




Abstract
The increase in the volume of a traumatic intracerebral hemorrhage (TICH) is a widely studied phenomenon that has a direct impact on the prognosis of patients. The objective of this study was to identify the risk factors associated with the progression of TICH. We retrospectively analyzed the records of 1970 adult patients >15 years of age who were consecutively admitted after sustaining a closed severe traumatic brain injury (TBI) between January 1987 and November 2013 at a single center. Beginning in 2007, patients with moderate TBIs were also included. A total of 782 patients exhibited one or more TICH on the initial CT scan, and met the selection criteria. The main outcome variable was the presence or absence of progression of the TICH. Univariate and multivariate statistical analyses were performed. Factors independently associated with the growth of TICH obtained through logistic regression included the following: an initial volume <5 cc (odds ratio [OR] 2.42, p<0.001), cisternal compression (OR 1.95, p<0.001), decompressive craniectomy (OR 2.18, p<0.001), age (mean 37.67 vs. 42.95 years; OR 1.01, p<0.001), falls as mechanism of trauma (OR 1.72, p=0.001), multiple TICHs (OR 1.56, p=0.007), and hypoxia (OR 1.56, p=0.02). TICH progression occurred with a frequency of 63% in our study. We showed that there was a correlation between TICH growth and some variables, such as multiple TICHs, a lower initial volume, acute subdural hematoma, cisternal compression, older patient age, hypoxia, falls, and decompressive craniectomy.
Introduction
T
Overall, several factors have been recognized as having an association with TICH growth and subsequent neurological deterioration, such as trauma severity, advanced age, multiple lesions, radiological signs (e.g., midline deviation or cisternal compression), and coagulopathy.
Some studies 3,12 –14 have attempted to determine the association of various factors with TICH growth. However, the main limitation of these studies was a small sample size; therefore, the conclusions cannot be generalized.
The primary objective of this study was to identify a set of factors associated with TICH progression in a large cohort of patients who have sustained severe or moderate TBI.
Methods
Inclusion and exclusion criteria
We retrospectively analyzed the records of 1970 adult patients >15 years of age who were admitted consecutively after sustaining a closed (non-missile) severe TBI, which was defined as a score of ≤8 points on the Glasgow Coma Scale (GCS) after nonsurgical resuscitation within the first 48 h after trauma, between January 1987 and November 2013 at University Hospital 12 de Octubre. Beginning in 2007, patients with moderate TBIs (GCS 9–13) were also included.
Patients were included in the study if an assessable initial CT scan was performed on admission, and a control CT scan could be evaluated to determine TICH progression or the appearance of new lesions. Therefore, from a total of 1970 patients diagnosed with moderate or severe TBI, 950 patients exhibited one or more TICH on the initial or control CT scan. Of these patients, 168 were excluded because of the lack of a control CT scan as a result of death or an immediate neurosurgical procedure, including evacuation of the TICH. The causes of death in this group of patients included the direct effect of TBI in 113 patients, and systemic causes and medical complications in 13 patients.
Therefore, 782 patients met the selection criteria, and we performed the subsequent analysis using data from this group (Fig. 1).
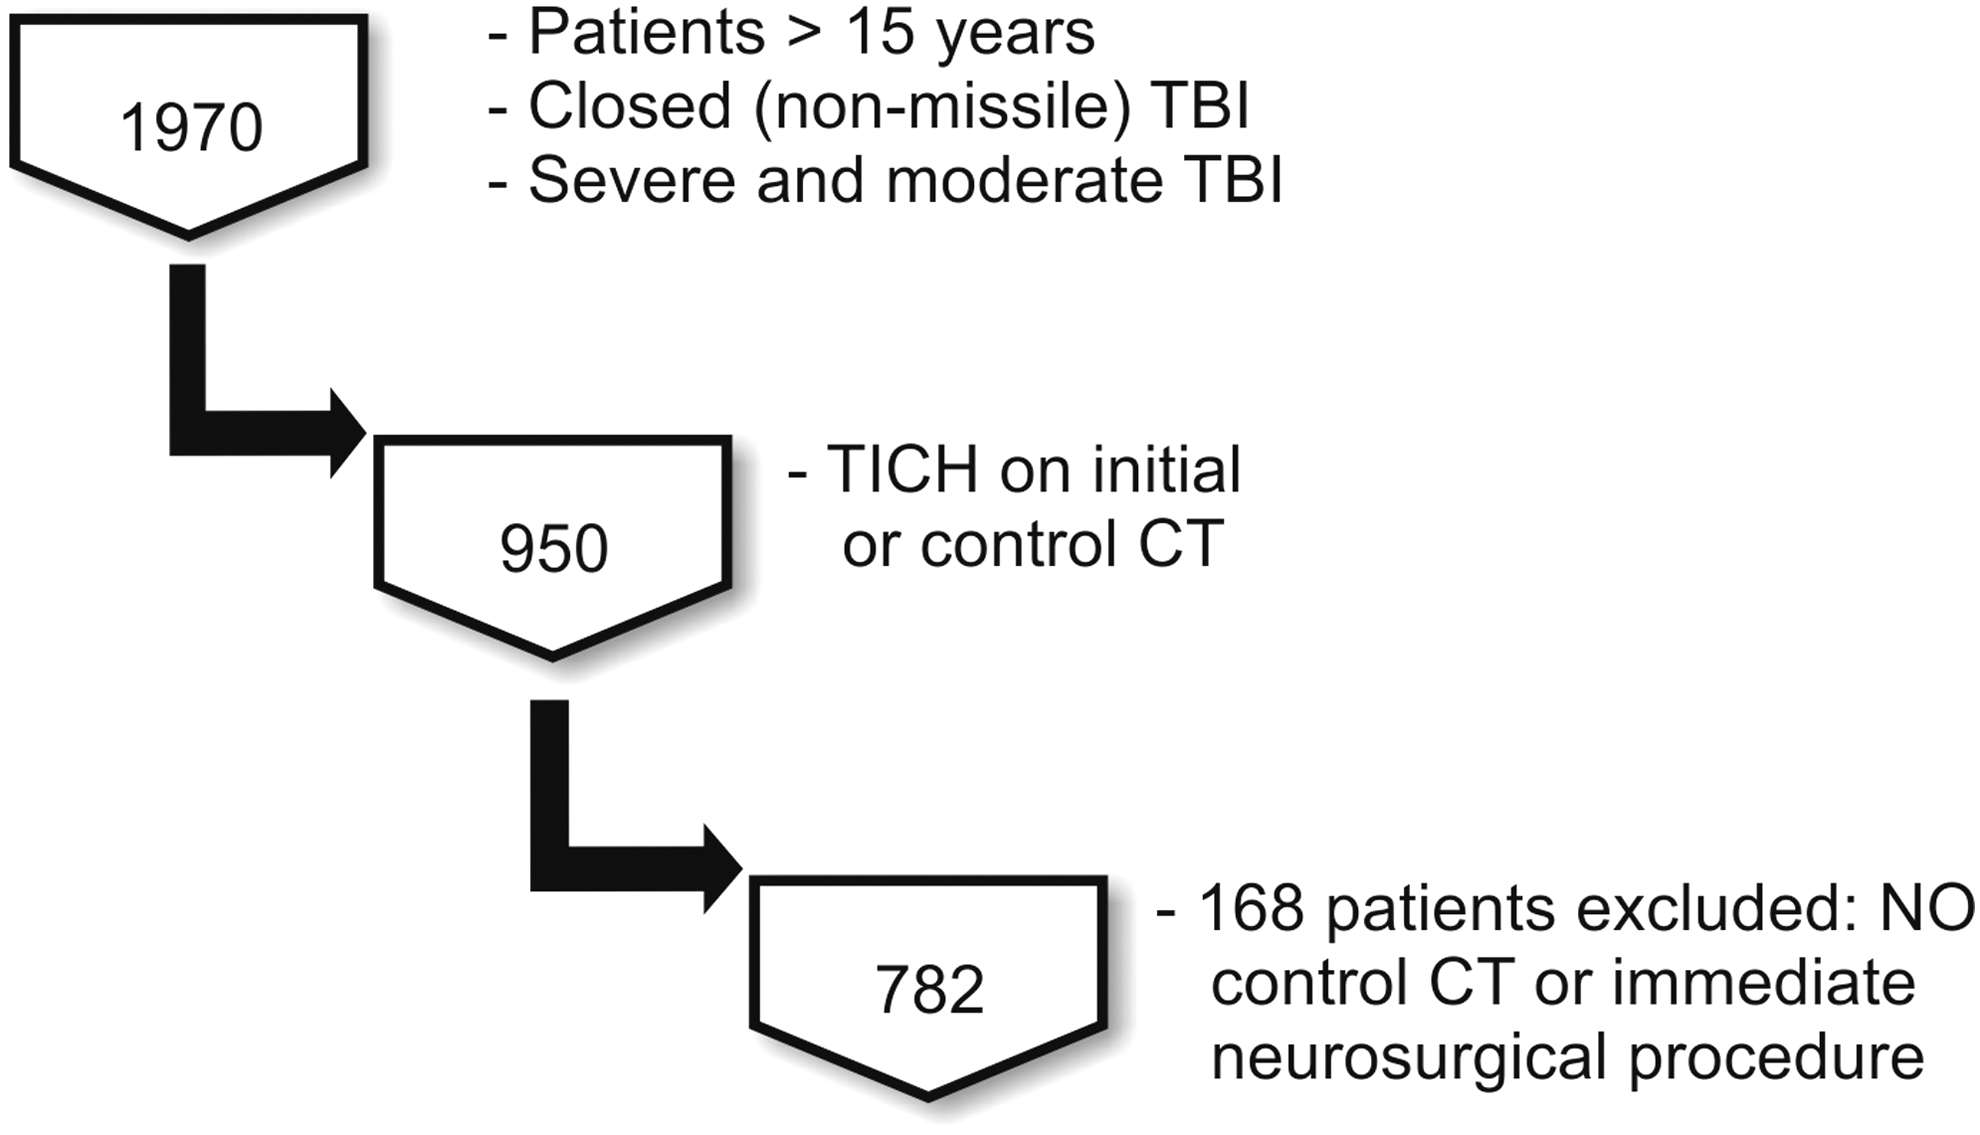
Flow diagram of patients who met the inclusion/exclusion criteria for the study population.
Variables assessed
We collected radiological, demographic, clinical, and treatment information, which is summarized in Table 1. Data were collected at the bedside in a standardized manner based on previous research 15 –18 and were also used in the creation of the TBI database of 12 de Octubre Hospital. 19
tSAH, traumatic subarachnoid hemorrhage; IVH, intraventricular blood; EDH, epidural hematoma; SDH, subdural hematoma; TICH, traumatic intracerebral hemorrhage; MLS, midline shifts.
Radiological variables
The radiological features analyzed are summarized in Table 1. The initial CT scan was defined as the scan performed immediately after a patient was admitted to the hospital. The control CT was defined as the scan with the worst radiological features. The control CT scan was performed after clinical deterioration or raised ICP, and without a scheduled protocol.
The time between the head trauma, initial CT, and control CT was recorded.
CT scans were classified according to the Marshall classification 20 and individual radiological features, including the following: 1) traumatic subarachnoid hemorrhage (tSAH), which was defined as the presence of blood in the subarachnoid space either over the convexity or fissures or in the basal cisterns; 2) intraventricular blood (IVH), which was categorized as present or absent; 3) basal cisterns, which were categorized as normal or abnormal (compressed or absent); 4) the presence and type of mass lesions, including epidural hematoma (EDH), acute subdural hematoma (ASH), or TICH. (TICHs were categorized based on volume into the following groups: 1–5 cc, 6–10 cc, 11–15 cc, 16–20 cc, 21–25 cc, 26–30 cc, 31–35 cc, and ≥36 cc); and 5) midline shifts (MLS) (shifts ≤5 mm versus shifts >5 mm).
We defined TICHs as traumatic intraparenchymal hemorrhagic lesions with a solid and well-defined appearance (hematoma) and fewer well-defined areas of mixed attenuation. Petechial lesions with a classic pattern of diffuse axonal injury (DAI) were excluded. 21
The initial and control volumes of TICH were measured in cubic centimeters. We recorded whether the initial volume was ≤5 cc, which was used as a dichotomous variable.
All CT scans were assessed by two senior neurosurgeons (P.A.G., A.L.). TICH volume was estimated by the following formula as suggested by the Surgical Guidelines of the Brain Trauma Foundation: A×B×C/2 (cm3), 9,22 where A, B, and C represent the largest dimensions of the hematoma measured at perpendicular angles to one another. TICHs were classified according to their location and number as single, focal, multiple unilateral, or multiple bilateral hematomas.
Treatment variables
Patients were classified as operated and unoperated. Surgical procedures were classified as follows: 1) craniotomy, evacuation of the lesion or lobectomy and debridement with bone flap replacement; 2) decompressive craniectomy, removal of the bone flap without evacuation of the TICH; and 3) others, elevation of bone fragments, cerebrospinal fluid drainage, and burr hole drilling.
Primary end-point
The main outcome variable was the presence or absence of TICH progression. We defined progression as an increase ≥33% of the initial volume of the TICH, or the appearance of a new lesion in a control CT scan.
In addition to the main variable, we estimated the change in volume in cubic centimeters from the initial to the control CT scan.
Outcome variable
According to the Glasgow Outcome Scale (GOS), we classified patients as favorable (GOS score 4–5) and unfavorable (GOS score 1–3), and we used this as the dichotomous variable. All patients had a minimum follow-up of 6 months.
Statistical analysis
To identify factors associated with TICH growth, a univariate analysis was performed. Univariate comparisons were performed using Student's t test for continuous variables and Fisher's exact test for dichotomous variables.
Logistical regression analysis was used to estimate the association between the risk factors (i.e., clinical findings, laboratory findings, and neuroimaging characteristics) and the main outcome variable (progression of TICH). The initial examination included a set of 22 potential predictors (Table 2) that were collected at the time of admission; these predictors are consistently referenced in the literature. 3,12 –14,18,23,24 The relationship between a predictor and progression was estimated using a crude odds ratio (OR) and R2 . P values≤0.05 were considered statistically significant.
OR, odds ratio; MLS, midline shifts; TICH, traumatic intracerebral hemorrhage; EDH, epidural hematoma; IVH, intraventricular blood; tSAH, traumatic subarachnoid hemorrhage; SDH, subdural hematoma; TBI, traumatic brain injury; GOS, Glasgow Outcome Scale.
In addition, with the results of the multivariate analysis, we were able to develop a predictive model based on the variables of greatest statistical significance. We used the Nagelkerke R2 value to determine the predictive ability of the model. 25 The Hosmer–Lemeshow goodness of fit test was used for the model calibration. 26 To evaluate the discrimination of the model, we used the area under the receiver operating characteristic (ROC) curve. 27
We used the model produced by logistical regression to develop a nomogram that created a simple graphical representation of our statistical predictive model and generated a numerical probability of progression.
All statistical analyses were performed with SPSS 22.0 software (IBM, Chicago, IL). The nomogram was created using Orange 2.7 software (University of Ljubljana, Slovenia).
Results
Patient characteristics
Epidemiological and clinical characteristics are shown in Table 1. A total of 621 (79%) of the patients were male, and 161 (21%) were female. The mean age was 41 years, ranging from 15 to 84 years.
The mean time between trauma and admission was 2.8 h; the mean time was 2.6 h in the group that demonstrated progression and 3.2 h in the group that did not exhibit progression. These values were not significantly different between groups.
The main mechanism of trauma was traffic accidents (498 [64%] patients), followed by falls (233 [30%] patients) and impact and other mechanisms (51 [6%] patients).
The motor scores at admission showed the following distribution: M1: 51 (8%) patients, M2: 68 (11%), M3: 84 (14%), M4: 123 (20%), M5: 192 (32%), and M6: 86 (14%). In 178 (23%) patients, the motor score was not reliable, mainly because of the effects of sedation.
The mean time between the trauma and the first CT scan was 2.9 h, and the mean time between the trauma and the control CT scan was 30.1 h.
Table 2 shows the radiological features of the initial CT scans. According to the Marshall classification, 345 (44%) patients corresponded to type II, 143 (18%) patients corresponded to type III, 22 (3%) patients corresponded to type IV, and 272 (34%) patients corresponded to types V–VI.
We observed the presence of tSAH in 611 (78%) patients, IVH in 232 (30%) patients, and skull fracture in 507 (65%) patients.
An MLS >5 mm was present in 172 (22%) patients. Compressed or absent cisterns were visualized in 397 (51%) patients.
TICHs were the only type of mass lesion in 258 (33%) patients. We also observed the presence of epidural hematoma in 153 (20%) and ASH in 389 (50%) patients.
With respect to the number and location of TICHs, 368 (57%) patients presented a focal TICH, 68 (10%) showed multiple unilateral TICHs, and 213 (33%) showed multiple bilateral TICHs.
The mean volume of the TICH on the initial CT scan was 7.29 cc; on the control CT scan, it was 18.18 cc. By classifying the initial TICH volume into groups, we observed that 412 (52.7%) patients presented a volume of <5 cc, 229 (29.3%) patients presented a volume of 6–10 cc, 74 (9.5) patients presented a volume of 11–15 cc, 33 (4.2%) patients presented a volume of 16–20 cc, 13 (1.7%) patients presented a volume of 26–30 cc, 5 (0.6%) patients presented a volume of 31–35 cc, and 9 (1.2%) patients presented a volume of >35 cc.
TICH progression was observed in 497/782 (64%) patients. The mean increase in volume was 10.9 cc. In 228 (46%) cases, there was an increase of <10 cc, an increase of 11–20 cc occurred in 130 (26%) cases, an increase of 21–30 cc occurred in 66 (13%) cases, and 73 (15%) patients presented an increase of >30 cc. In 285/782 (36%) patients, the TICH volume remained stable or decreased on the control CT scan (Fig. 2).
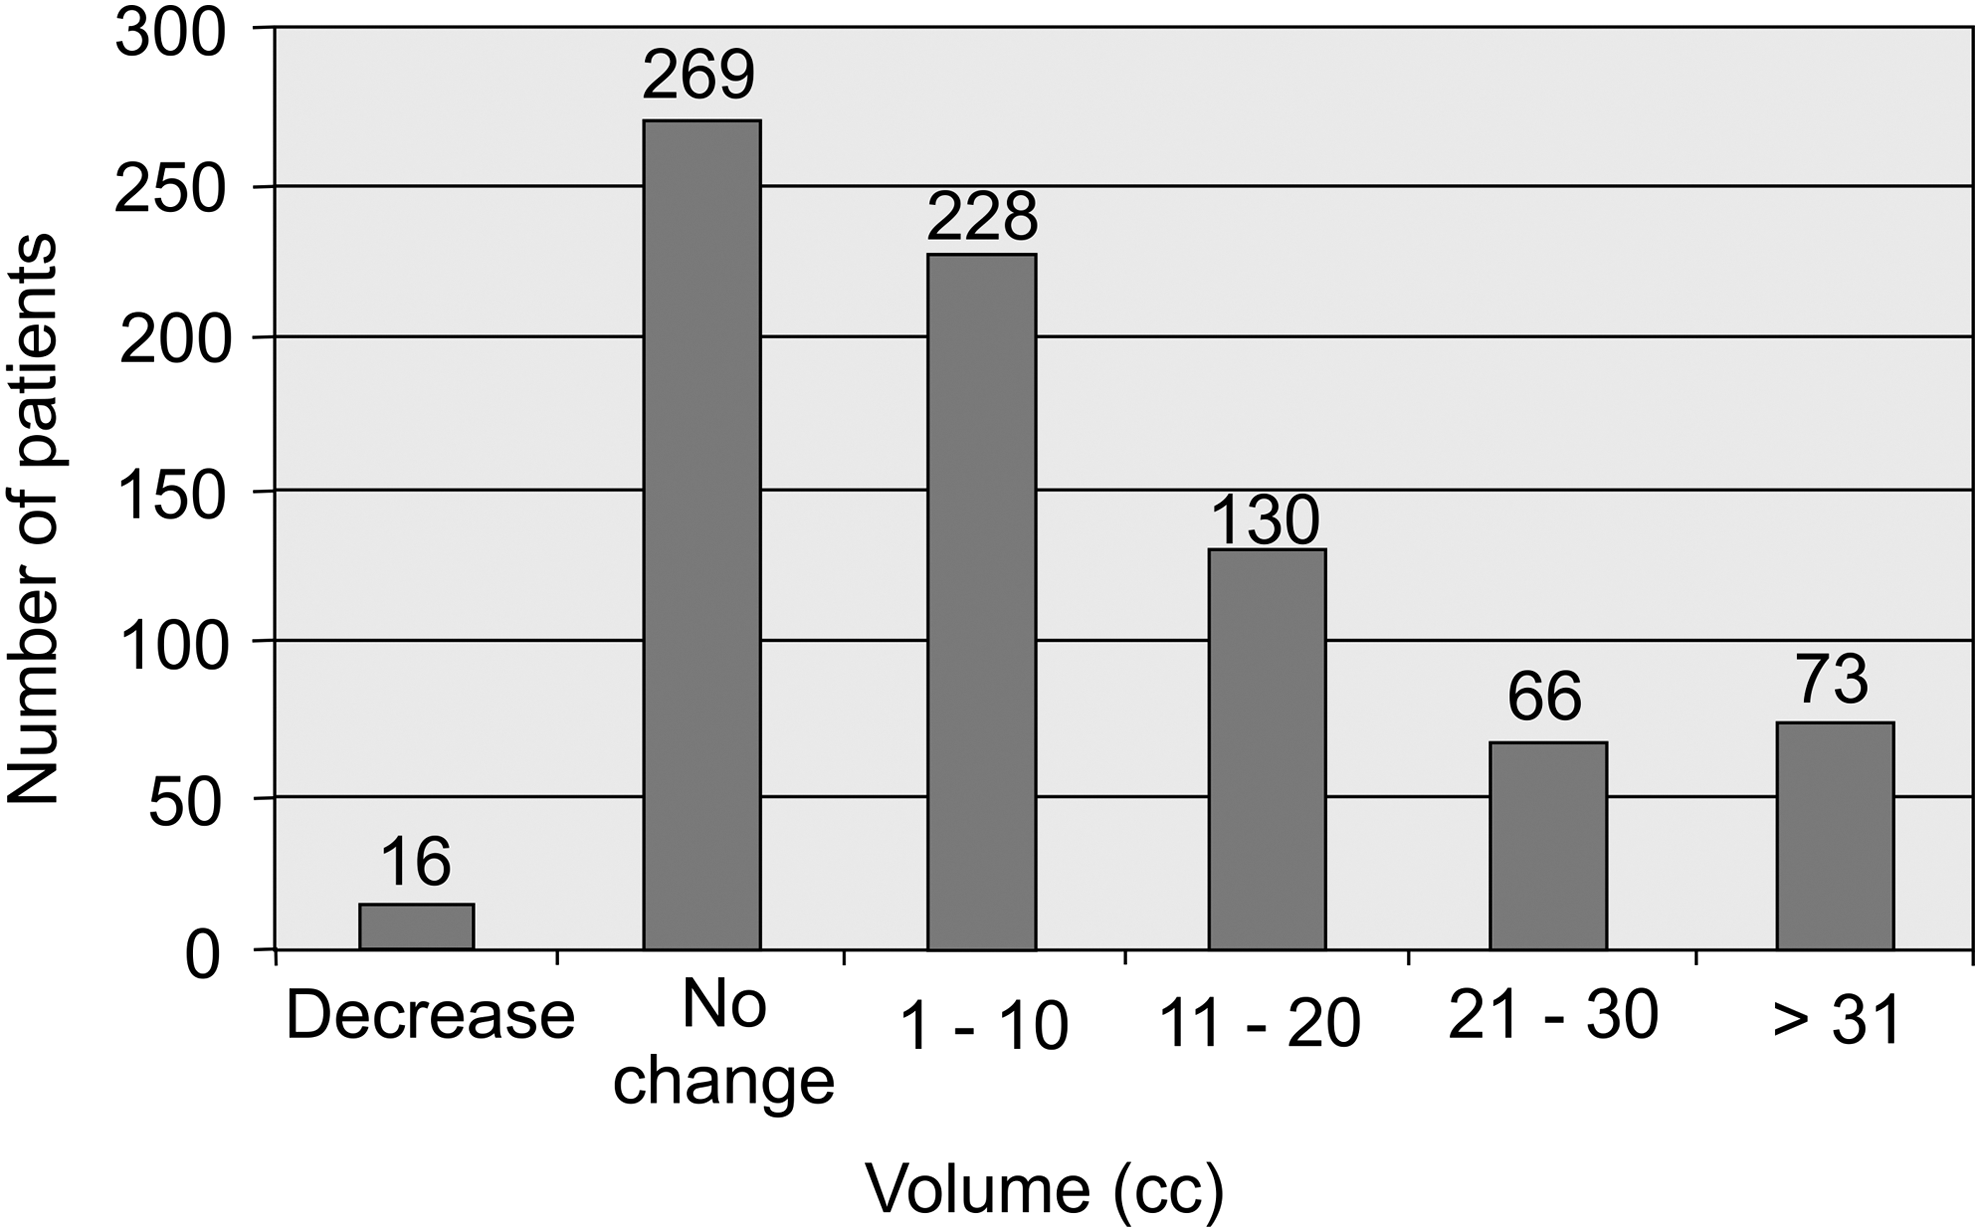
Bar graph showing the absolute change in traumatic intracerebral hemorrhage (TICH) volume (cubic centimeters) between the initial and control CT scan.
The outcome at 6 months of follow up was favorable in 285 (36%) patients and unfavorable in 474 (64%) patients. Although the purpose of this study was not to determine the outcome of patients with TICH, we found a significant correlation between progression and an unfavorable outcome (OR 3.6, p<0.001). We also found a significant correlation between the presence of multiple TICH and unfavorable outcome (OR 1.59, p<0.01). Regarding the initial volume of TICH, we observed that patients with TICH volume ≥15 cc on first CT scan had a poorer outcome (OR 1.67, p<0.05). The absolute change of volume of TICH showed a significant correlation with outcome: patients with favorable outcome had a mean growth of TICH of 5.36 cc, whereas the group of patients with unfavorable outcome showed a mean growth of 14.82 cc. This relation was statistically significant (p<000.1).
Factors associated with progression
Table 2 shows the results of the univariate analysis of the correlation between TICH progression and clinical and radiological variables. Of all variables analyzed, those that showed a statistically significant association with TICH growth included a higher mean age (mean 37.67 vs. 42.95 years for the groups with no growth and growth, respectively; OR 1.01, p<0.001), falls as the mechanism of trauma (OR 1.72, p=0.001), hypoxia (OR 1.56, p=0.02), shock (OR 1.62, p=0.004), cisternal compression (OR 1.95, p<0.001), midline shift >5 mm (OR 1.44, p=0.05), acute subdural hematoma (OR 1.36, p=0.03), multiple TICHs (OR 1.56, p=0.007), and an initial volume of <5 cc (OR 2.42, p<0.001). The mean time between the trauma and the first head CT was significantly lower in the group of patients that experienced growth: 2.71 vs. 3.43 h (OR 0.96, p=0.026). Undergoing a decompressive craniectomy was also significantly associated with an increased risk of progression (OR 2.18, p<0.001).
The variables that showed a statistically significant association with TICH progression were used in the multivariate analysis (Table 3). Factors independently associated with the TICH growth obtained through the logistic regression included an initial volume of <5 cc, cisternal compression, decompressive craniectomy, older age, falls, multiple TICHs, and hypoxia.
OR, odds ratio; CI, confidence interval; TICH, traumatic intracerebral hemorrhage.
The final model showed a predictive ability of 14% (Nagelkerke R 2 ), with an area under the ROC curve of 71% (Fig. 3) and a good calibration value (goodness-of-fit test p value=0.103).

Receiver-operating characteristic (ROC) curve and corresponding area under the curve (AUC) statistics for the predictive model of traumatic intracerebral hemorrhage (TICH) progression.
In Figure 4, we present a nomogram as a graphical representation of the clinical application of the model.
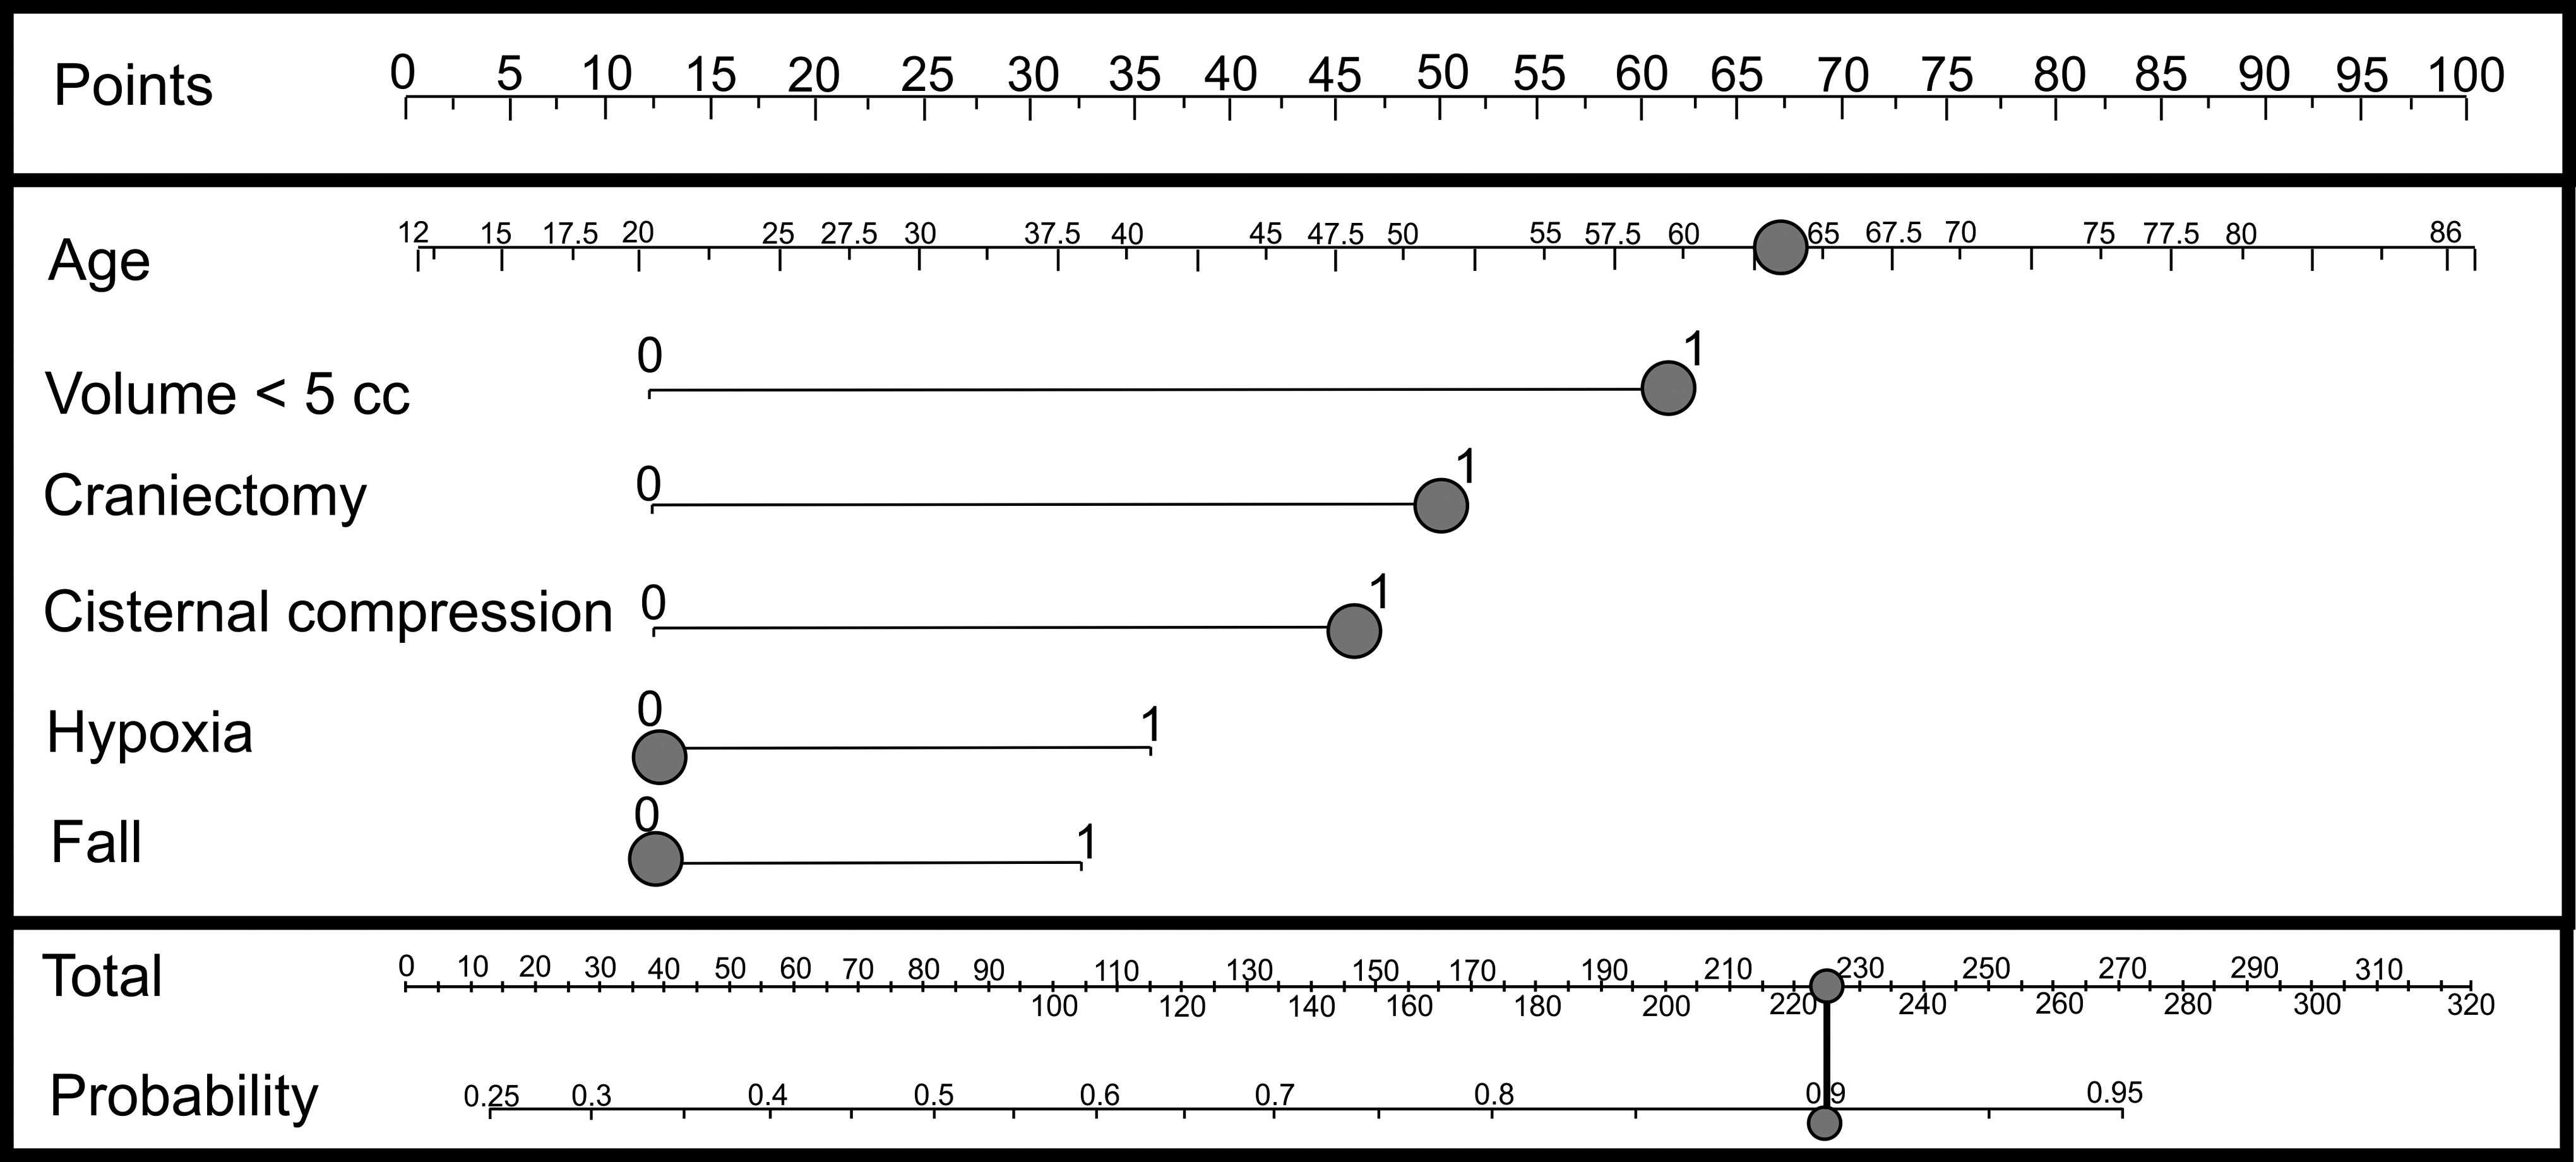
Nomogram. This example consists of a patient, 63 years of age (68 points), with an initial traumatic intracerebral hemorrhage (TICH) volume of <5 cc (64 points) who underwent a decompressive craniectomy (49 points). The initial CT scan showed that the cisterns were compressed (43 points), resulting in a total score of 224, which corresponds to a probability of progression of ∼ 0.93.
Discussion
The results of our study demonstrate a significant association of the initial TICH volume, cisternal compression, decompressive craniectomy, age, falls, multiple lesions, and hypoxia with TICH progression. As a secondary objective, we have created a predictive model based on the results of logistic regression with the goal of identifying patients who have certain risk factors and are more likely to experience TICH growth.
One of the strengths of our study is that we had a sufficiently large sample to enable us to focus on a specific type of intracranial lesion, namely, TICH, as we had a sufficient number of cases among all of the TBI patients.
We are aware of the limitations of this study. First, we analyzed patients rather than TICHs specifically, noting that a patient may have one or more TICH, and the volume used in the analysis was the total volume of traumatic intraparenchymal bleeding. We did not collect certain variables that may have been related to the probability of progression, including the location and type of TICH (coup, contrecoup, presence of extracranial injury), and certain variables were not recorded in all patients, such as laboratory values.
Another limitation is that we included patients with moderate and severe TBI, but we believe that to comprehensively analyze and better characterize the relationship between the initial neurological status of the patient and the probability of progression, it is essential to encompass the entire TBI patient spectrum.
Our predictive model is limited because of its low accuracy and discrimination. However, this preliminary model could be used as a basis for further studies to generate a predictive model for clinical application.
The first challenge that we faced in planning this study was the varied terminology used in previous studies regarding the definition of TICH and its progression. The first descriptions of radiological progression of TICH were provided by Gudeman et al. in 1979. 28 Hemorrhagic progression of TICH can be synonymous with delayed traumatic intracerebral hematoma (DTICH) 28 or progressive hemorrhagic injury (PHI). 29,30 Because of this ambiguity, we decided to use the term “growth” as an equivalent to progression.
Similar to Alahmadi, 12 we defined “growth or progression” as an increase ≥33% of the initial TICH volume. The need to use a cutoff value to determine whether a TICH increases is based on the following reasons, as explained by Brott. 31
First, a 33% change in the volume of a sphere corresponds to a 10% increase in diameter, which is a clear difference to the naked eye of a physician viewing serial CT scans of a patient with intracerebral hemorrhage (ICH). Second, preliminary measurements of serial CTs in patients with ICH indicated that some patients had up to one third less hemorrhage volume on the control CT than on the baseline CT. We assumed that this “decrease” was because of different positioning and angles of the CT slice images between the baseline and control CTs rather than to an actual decrease in hemorrhage volume. This observation was particularly true for small hemorrhages.
In our study, TICH growth was observed in 63% of patients (n=490/782). This percentage is slightly higher than that in other published articles. Yadav and coworkers 32 found progression in 16.4% of the cases; however, they classified a TICH as showing growth when its initial volume doubled. Chang and coworkers 3 observed progression in 38% of patients; most of these cases had an initial volume of <1 mL. Stein and coworkers 30 observed progression in 44% of patients. Oertel and coworkers 29 and Narayan and coworkers 13 observed progression in 51% of patients. Finally, in a study by White and coworkers, 14 65% of patients experienced progression.
In our study, age was a factor that was significantly associated with TICH growth. The average age in the progression group was significantly higher than that in the non-progression group (42.95 vs. 37.67 years). These results are similar to those of a study published by Stein and coworkers, 33 in which the authors proposed that the higher capillary fragility and rigidity of the elderly may contribute to hemorrhagic progression.
With respect to the mechanism of trauma, falls/precipitation were a factor associated with growth, possibly because of the exchange of kinetic energy associated with this particular mechanism of injury, and the coup-contrecoup injury mechanism involved. In previous studies, no significant differences were found between the mechanism of trauma and progression of the TICH.
With regard to time, a longer interval between the trauma and first CT seems to lead to a greater likelihood of progression, which is similar to other findings. 29
We observed that the presence of shock and hypoxia showed a statistically significant association with TICH progression. This result is contrary to the results of Oertel and coworkers, 29 who demonstrated that there was a lack of correlation between hypoxia and progression, because hypoxia itself is associated with diffuse cerebral edema, which may limit progression by its associated mass effect. The outcome of the multivariate analysis confirms the association between hypoxia and growth in our study, and is perhaps more consistent with the relationship between systemic disorders and secondary brain damage.
We did not find a correlation between TICH progression and either the GCS score for pre-hospital care or the GCS score at the time of admission. We also analyzed eye, motor, and verbal scores without finding significant results. In other studies, 1,33 there seemed to be an association between a low GCS score and progression of traumatic intracranial lesions in addition to TICH. In another study, Oertel and coworkers 29 did not find significant associations with the GCS score. The results of our study may be explained by circumstances such as unreliable GCS scores recorded during pre-hospital care, as well as the interference of sedation with the neurological assessment of the patient at admission. In our study, the motor score at admission in 178 patients could not be evaluated, because of sedation or paralysis. Therefore, it seems unlikely that the GCS score can be used as a predictor of progression.
According to previous studies, 24,29,34 –39 abnormalities in coagulation parameters and the platelet count have been described in patients with expanding traumatic intracranial lesions. Nevertheless, in our study, we were unable to identify a statistical correlation between the laboratory variables analyzed and the progression of TICH. We emphasize that these laboratory variables were not collected for the entire study sample. This limitation should be considered in future studies.
Regarding the initial TICH volume, our study showed different results than previous studies, which revealed that a TICH with a larger initial volume had a higher probability of growth. For example, Chang 3 proposed that small lesions are more stable and that large lesions are in an “active” growth phase. We found that TICHs with an initial volume of <5 cc are more likely to undergo progression. A hypothetical explanation for this result is that small lesions have more space inside the cranial cavity for expansion, whereas large TICHs have to overcome the higher pressures of surrounding structures to increase in volume.
As in other studies, we found significant differences in the progression group when patients also had an acute subdural hematoma, cisternal compression, and midline deviation. The association between growth and acute subdural hematoma could be explained by cases of lobar bursts, as proposed by Chang.
Further, we found no significant correlation between the presence of tSAH and progression, although other studies 5,40 revealed the existence of an association.
Another factor that we found to be significantly associated with progression was the presence of multiple TICHs, either in the same or the contralateral hemisphere. We did not find any reference to this variable in the literature. One possible explanation could be the coalescence of several small lesions that together generate a greater volume in the control CT.
According to our results, undergoing a decompressive craniectomy was significantly associated with progression. Gudeman and coworkers 28 reported 12 cases of hemorrhagic progression, 4 on the contralateral side of the craniectomy and 2 on the same side, which were not related to the surgical procedure. This finding can be partially explained by the “tampon effect” of removing a bone flap, as suggested by Flint and coworkers. 41 In their study, the authors compared pre- and postsurgical CT scans and observed the appearance of new TICHs and expansions of >5 cc in 24 of 40 patients who underwent a decompressive craniectomy. Overall, 81.5% of the TICHs were on the same side as the craniectomy.
Contrary to this finding, Sturiale and coworkers 42 examined 57 patients with 25 decompressive craniectomies (21 immediate and 4 between 6 and 12 h after trauma) and 32 cases that were managed conservatively. An increase of >2 cc of TICH volume occurred in 4/25 (16%) and 4/32 (12.5%) of the craniotomy and conservatively managed cases, respectively, which did not represent a significant difference. In our study, 213 decompressive craniectomies were performed. Patients who experienced growth represented 75% (160) of the cases, confirming the association between craniotomy and progression in the multivariate analysis (OR 2.63, p<0.001).
The importance of studying the evolution of TICH is the influence of the radiological worsening in the outcome of these patients. In previous studies, the association between CT evolution and risk of unfavorable outcome has been described. 4,5 However, the association of TICH progression and outcome has not been demonstrated in previous articles. 12,13,29 This could be explained by the lack of a long enough follow-up, or small study samples. In a recent study, Iaccarino and coworkers 43 described the risk factors for unfavorable outcome in patients with contusions. The author could not find a statistically significant association between outcome and TICH evolution, but radiological worsening expressed by increase in midline shift and worsened status of basal cisterns were related both to outcome and neurological worsening.
In our study, we showed a correlation among the initial TICH volume, progression and absolute change of TICH volume, and unfavorable outcome. These results are similar to those found in other publications. 11,44
A predictive model of TICH progression would be useful in daily practice, as it would allow early identification of patients who may experience progression and even benefit from early surgical intervention, thereby improving medical management. We acknowledge that our model does not meet these criteria, but by considering the results from this study and by improving data collection, more accurate models, and even risk scores, could be designed to achieve the desired goal in the future.
Conclusions
TICH progression occurred with a frequency of 63% in our study. We demonstrated that there is a correlation between TICH growth and several variables, such as multiplicity of TICHs, lower initial volume, acute subdural hematoma, cisternal compression, older patient age, markers of systemic injury such as hypoxia, falls as the mechanism of trauma, and decompressive craniectomy as the surgical method.
Acknowlegments
This study was funded by grant no. 2010-007 from the Mutua Madrileña Foundation (Spain) to Pedro A. Gómez.
Footnotes
Author Disclosure Statement
No competing financial interests exist.