
Abstract
Mild traumatic brain injury (mTBI) has subtle effects on several brain functions that can be difficult to assess and follow up. We investigated the impact of mTBI on the perception of sine-wave gratings defined by first- and second-order characteristics. Fifteen adults diagnosed with mTBI were assessed at 15 days, 3 months, and 12 months postinjury. Fifteen matched controls followed the same testing schedule. Reaction times (RTs) for flicker detection and motion direction discrimination were measured. Stimulus contrast of first- and second-order patterns was equated to control for visibility, and correct-response RT means, standard deviations (SDs), medians, and interquartile ranges (IQRs) were calculated. The level of symptoms was also evaluated to compare it to RT data. In general in mTBI, RTs were longer, and SDs as well as IQRs larger, than those of controls. In addition, mTBI participants' RTs to first-order stimuli were shorter than those to second-order stimuli, and SDs as well as IQRs larger for first- than for second-order stimuli in the motion condition. All these observations were made over the three sessions. The level of symptoms observed in mTBI was higher than that of control participants, and this difference did also persist up to 1 year after the brain injury, despite an improvement. The combination of RT measures with particular stimulus properties is a highly sensitive method for measuring mTBI-induced visuomotor anomalies and provides a fine probe of the underlying mechanisms when the brain is exposed to mild trauma.
Introduction
M
There is now clear evidence that mTBI results in brain deformations that affect white and gray matters, as well as their interface, and cerebral vascular tissue. 10,12 –21 Resulting metabolic disorders lead to physiological dysfunctions. 12,13,16,22 –25 Although the physical signs left by such a diffuse injury often remain undetectable by conventional investigation tools (e.g., computed tomography scan), 9,12,23,25,26 they can result, in the short and/or long term, in cognitive and/or emotional disorders and/or other disabling symptoms that have an impact on daily activities. 6,7,10,13,14,21 Moreover, although symptoms and functional disorders are most often transient, 2 in some individuals they can persist to diverse degrees and over long time periods. 3 –5,7,9 –11,13,14,21,22,26 –30
A broad part of the brain is involved in visual perception. 31 –39 Given the diffuse nature of brain alterations produced by an mTBI, one or several networks involved in vision could be affected post-mTBI, leading to visual perception deficits.
The visual perception of a stimulus relies on its attributes, which fall into two broad categories. First-order attributes (luminance and color) have simple or linear properties that can be processed in the Fourier domain. Second-order attributes (texture, depth, and motion) have complex or nonlinear properties that cannot be processed in the Fourier domain. Two distinct mechanisms allow for processing of first- and second-order stimuli, the latter necessitating additional steps. 40 –42 As a result, the visual system has a lower sensitivity for second-order than for first-order stimuli. 43 –48
Visual motion perception of first- and second-order stimuli also relies on two distinct mechanisms. 40,41,45,49 –51 Motion perception of second-order stimuli is based essentially on attentional processes, whereas that of first-order stimuli rests on a more automatic detection mechanism. 52 –54 Consequently, as already evidenced by reaction time (RT) measures, motion direction discrimination is faster for first- than for second-order stimuli. 55,56 It is also noteworthy that, in the case of second-order stimuli, motion direction discrimination necessitates a greater modulation depth than that required for orientation discrimination (static stimuli), whereas in the case of first-order stimuli, motion direction discrimination is possible at a lower modulation depth than orientation discrimination. 44,51 Finally, motion perception of second-order stimuli depends on distinct neural mechanisms 55,57 and recruits broader neuronal networks than those dedicated to first-order motion perception. 34,36 –38,42,58,59
Therefore, it seems that RT measures related to motion direction discrimination of first- and second-order stimuli are of particular interest to objectively assess the presence of diffuse microscopic lesions that could affect the visual system after an mTBI.
One study showed that perception of second-order stimuli, whether static or moving, was altered in children having sustained an mTBI. Observed visual deficits also persisted at least 3 months after the injury, even if symptoms had resolved. 60 This study is particularly interesting because it is longitudinal: mTBI children were evaluated at 1, 4, and 12 weeks after their injury, as were matched controls.
The aims of this study were to: 1) determine whether the visual deficits affecting perception of first- and second-order stimuli observed in children having sustained an mTBI 60 are also present in adults having sustained such trauma; 2) assess whether these deficits persist over a 1-year period after the injury; and 3) evaluate the link between the severity of symptoms and visual deficits. To achieve these goals, we consequently: 1) measured detection and motion direction discrimination RTs with dynamic first- and second-order stimuli; 2) evaluated the level of symptoms to compare it to RT data; and 3) repeated these measures at three predefined time periods identical for all subjects over a 1-year period.
Methods
This study received approval from the institutional research ethics boards of the Hôpital du Sacré-Cœur de Montréal (HSCM), McGill University Health Centre (MUHC), and Université de Montréal.
Participants
Two groups of 15 subjects (2 females, 13 males), each ranging in age from 17.8 to 39.8 years, participated in this study: a group of subjects having sustained an mTBI (mean age at first testing session, 29.2 ± 6.8 years) and a group of control subjects matched for age (29.3 ± 6.8 years old at first testing session), sex, handedness, and, whenever possible, education level. Before their participation in this study, all subjects gave their written informed consent. Subjects were clearly informed that they could leave the study whenever they wanted to do so, without prejudice.
Subjects in the mTBI group were volunteers recruited after their admission to emergency departments (EDs) of HSCM and of the Montreal Children's Hospital of the MUHC. They were eligible if: 1) they had received a diagnosis of mTBI from a physician at the ED (criteria used for this diagnostic were based on the World Health Organization [WHO] Collaborating Center Task Force on Mild Traumatic Brain Injury definition of mTBI 61,62 ); 2) the mTBI was not concomitant with any substance consumption affecting alertness or arousal state; 3) there was no more than one mTBI in the past 12 months; 4) they had no problematic alcohol consumption; 5) they were not consuming a substance on a consistent basis; 6) they had no premorbid psychiatric or learning disorders; 7) they had no fractures or cut preventing their participation in experimentations; and (8) they were ages 17–40. Coordinators of trauma programs obtained a first consent from each subject of the mTBI group, giving the first author the authorization to contact them by phone. This phone interview was used to further screen subjects, carefully confirming that inclusion criteria (items 2–7) listed above were fulfilled and that subjects were fluent in French or English.
None of the mTBI participants were engaged in litigation or compensation issues.
The characteristics of participants of mTBI group are displayed in Table 1.
mTBI, mild traumatic brain injury; M, male; F, female; GCS, Glasgow Coma Scale; EMS, emergency medical service (on site of accident); ED, emergency department; LOC, loss of consciousness; PTA, post-traumatic amnesia; N/D, not documented; SAH, subarachnoid hemorrhage; +, positive for clinical sign but unknown duration; −, negative.
Subjects of the control group were recruited among patients of the Université de Montréal School of Optometry Clinic, friends of mTBI participants, and the general population. Before participation, control subjects also underwent a phone screening. They had to fulfil the same criteria as mTBI subjects, and their medical history also had to be clear of mTBI.
mTBI patients before their brain injury had occupational statuses, sports practices, and means of transportation very similar to those of subjects of the control group. Therefore, subjects of the control group were exposed to the same risks of mTBI (predisposing factors and injury-related stress) than the mTBI patients previous to their brain injury. Moreover, each control subject was recruited within 2 months after the recruitment of the corresponding mTBI subject.
Before participating in the study and at every visit, subjects of both groups underwent a complete optometric examination, including the assessment of visual acuity, refraction, binocular vision (extraocular motility and stereoscopic vision), and ocular health (pupillary reflex and examination of anterior segment and fundus), as well as a screening evaluation of the central 20 degrees of monocular visual fields with frequency-doubling technology (FDT; screening mode of C-20 FDT program; perimeter Humphrey-Welch Allyn, Inc., Shakeneatles Falls, NY). 63 Participants had a visual acuity of 6/6 or better and wore a refractive correction to achieve this visual acuity level, whenever necessary. Further, their binocular vision, ocular health, and central visual fields were within normal limits.
RT measures as well as self-reported symptoms ratings were taken at 2 weeks (session A), 3 months (session B), 5,8,10,11,27 and 1 year (session C) 7,9,14,22,28,30,64 after the injury for mTBI subjects and at equivalent times for control subjects (Table 2).
Means ± standard deviation. No significant difference was found between groups for B (F (1, 28) = 3.845; p = 0.060) and C (F (1, 28) = 1.557; p = 0.222) session times. No significant difference was found between groups for age at session A (F (1, 28) = 0.004; p = 0.948), B (F (1, 28) = 0.005; p = 0.946), and C (F (1, 28) = 0.005; p = 0.946).
The same subjects participated in the three sessions for both groups; there were 2 females and 13 males in each group for the three sessions.
mTBI, mild traumatic brain injury.
All participants were administered the Test of Nonverbal Intelligence—Third Edition 65 at their first testing session. Standard score had to be at least of 85 to participate in the study. This test was also administered to ensure that both groups had comparable levels of general cognitive skills. A one-way analysis of variance (ANOVA; Group factor) showed no significant IQ difference (F (1, 29) = 0.462; p = 0.502) between mTBI (mean scaled score ± standard deviation [SD] = 110.40 ± 14.22) and control (107.13 ± 12.02) groups. 66
Finally, to make sure there was no attention deficit, each participant had to fill the Conners' Adult ADHD Rating Scale–Self-report: Short Version. 67 All participants obtained T scores within the mean range or below, confirming the absence of overt attention deficits in both groups.
Device
RT measures took place in a dark room where the monitor screen was the only light source. Stimuli were presented on a 17-inch CRT screen (6307-BTN Lenovo™) at a refresh rate of 100 Hz and a viewing distance of 114 cm. The screen was gamma corrected and calibrated using a Minolta CS100 photometer. An Intel® Core™ 2 Duo (2.33 GHz) with an NVIDIA Quadro® NVS 290 graphic card computed the stimuli.
Stimuli
Stimuli were sine-wave achromatic gratings with a spatial frequency of 0.5 cycles per degree. These gratings consisted of a static two-dimensional grayscale noise carrier either luminance- (first-order; obtained by adding a sinusoidal signal to a noise signal) or contrast-modulated (second-order; obtained by multiplying a sinusoidal envelope by the noise carrier 43,53,60 Fig. 1). Noise carrier was set to 50% Michelson contrast. Stimuli were presented in a circular window, 10 degrees in total diameter, with a plateau of 8 degrees in diameter and a Gaussian edge (0.5 degree SD). Screen background was set to a mean luminance of 22 cd/m2. Each noise carrier pixel subtended 0.016 × 0.016° (0.96’ × 0.96’). 51

Examples of first- (left) and second-order (right) stimuli.
Gratings were either pattern-reversal flickering (flicker condition) or drifting to the right or left (motion condition) at a temporal frequency of 2 Hz. 53,81 Motion direction varied randomly from trial to trial, with the same probability for each direction. In each condition, an equal number of first- and second-order stimuli were presented in random order. In combination with modulation types, there were four experimental conditions: first- and second-order flicker (FOF and SOF), and first- and second-order motion (FOM and SOM).
Stimuli were suprathreshold. Their visibility (related to modulation depth) has also been equated by setting luminance modulation depth at 12.5% (first-order stimuli) and contrast modulation depth at 100% (second-order stimuli). These modulation depths were chosen because they were suprathreshold by a factor of about 10 for both modulation types (considering threshold levels for static stimuli), ensuring that all participants were able to easily perceive the stimuli. 44,45,55,60
Reaction time measurements procedure
Trial blocks (flicker/motion) were displayed in random order.
Flicker and motion conditions consisted of four blocks of 100 trials each (i.e., 200 trials per condition, modulation, and session). Sporadically, for technical reasons or punctual participant failures to comply with instructions, the number of trials per condition, modulation, and session was inferior to 200 (either 150, 197, or 198 trials).
Subjects started each block by pressing the left mouse button. Within each block, trials were linked together in the following manner: A black cross appeared for 125 ms in the center of the screen uniformly gray; then the cross disappeared, the screen remaining uniformly gray for 500–1000 ms (random duration, depending on refresh rate); the stimulus was then presented for 1000 ms; the trial finally ended with a uniform gray screen for 125 ms. The cross indicated where to maintain fixation.
Each block lasted around 5 min. To prevent fatigue, subjects could take a 1- to 2-min break after each block. Thus, total duration for RT measures was around 40–50 min.
Subjects were instructed to maintain fixation at the center of the screen and give their responses using a computer mouse the way they were used to doing it (all of them used the mouse with the right hand, even those who were left-handed).
The flicker condition consisted of a simple detection task: Subjects were instructed to left-click as soon as a stimulus appeared. The motion condition consisted of a motion direction discrimination task: Subjects were instructed to right- or left-click depending on motion direction and as soon as they perceived it. RTs were recorded during the stimulus presentation period.
RTs were not recorded for responses that were out of the stimulus presentation time period. RTs shorter than 150 ms were discarded from the analysis because it is an anticipated response faster than the shortest time necessary for simple detection. 55 –57,68 –73 For the motion condition, RTs associated with incorrect responses were also discarded from the analysis.
Self-reported symptoms recording
At each testing session, participants self-reported their symptoms using the Post-Concussion Symptom Scale–Revised (PCSS-R). 2,74 Participants had to indicate in the 22 items list which symptoms (i.e., physical, cognitive, or emotional/behavioural) they experienced during the last 24 h and rate their severity on a scale ranging from 0 to 6 (0: none; 1: mild; 2–4: moderate; 5–6: severe). The variable we retained for the analysis of the level of symptoms is the total score.
Reaction times statistical analysis
For each participant, and each of the four experimental conditions (flicker first- and second-order, and motion first- and second-order) at each session, we determined the mean, SD, median, and interquartile range (IQR) for RTs. Thus, we decided to take, for each distribution, two values of central tendency and their corresponding values of dispersion. The mean is usually used more frequently than the median. However, RT distribution is not symmetrical around its central tendency: higher values are more spread out than smaller ones. The median seems therefore more appropriate than the mean to estimate the central tendency of such a distribution, because it is less affected by the asymmetrical distribution of extreme values. 75 Moreover, removing RTs shorter than 150 ms has a lesser incidence on medians and IQRs than on means and SDs. 76
We also determined participation rates for both flicker and motion conditions as well as accuracy rates for the motion conditions (one per modulation type). We defined the participation rate as being the number of responses given during stimuli presentation periods and corresponding to RTs of 150 ms and more out of the total number of stimuli presented. In other words, participation rate is the percentage of responses given following instructions. For the motion condition, we defined the accuracy rate as being the proportion of correct direction responses.
For each variable set (mean, SD, median, and IQR), we performed a four-way (Condition (2) × Modulation (2) × Session (3) × Group (2)) mixed ANOVA. When decompositions were necessary to further explain interactions, other ANOVAs (mixed [between-within subjects] or repeated measures [within subjects], depending on the case) were performed.
Self-reported symptoms statistical analysis
PCSS-R total scores were analyzed using a two-way mixed ANOVA (Session (3) × Group (2)).
They were also used in two-tailed bivariate Pearson's correlations in order to investigate and describe the relationship between: • Level of postconcussive symptoms and RTs recorded for each session; • Initial level of postconcussive symptoms (reported at session A) and RTs recorded at each session.
The Greenhouse-Geisser corrective factor was used for all the ANOVAs.
The overall significance level set at 5% was corrected for all correlations with Bonferroni's correction for the number of conditions, giving a significance level of 1.25%.
Results
Participation and response accuracy
The four-way mixed ANOVAs (Condition (2) × Modulation (2) × Session (3) × Group (2)) performed respectively on Participation and Accuracy variables revealed no significant Group effect (Participation: F (1, 28) = 0.207; p = 0.653; Accuracy: F (1, 28) = 0.090; p = 0.766). These results indicate that participation and accuracy levels of mTBI and control participants were similar. They also demonstrate that RT tests were easy enough to execute and reinforce the validity of the following comparisons between mTBI and control groups.
Mean and median reaction times
The four-way mixed ANOVA (Condition (2) × Modulation (2) × Session (3) × Group (2)) performed on mean RTs revealed, first, a significant Group effect (F (1, 28) = 5.167; p = 0.031), indicating that mean RTs were longer for the mTBI than for the control group (Figs. 2 and 3).

Derived variables from
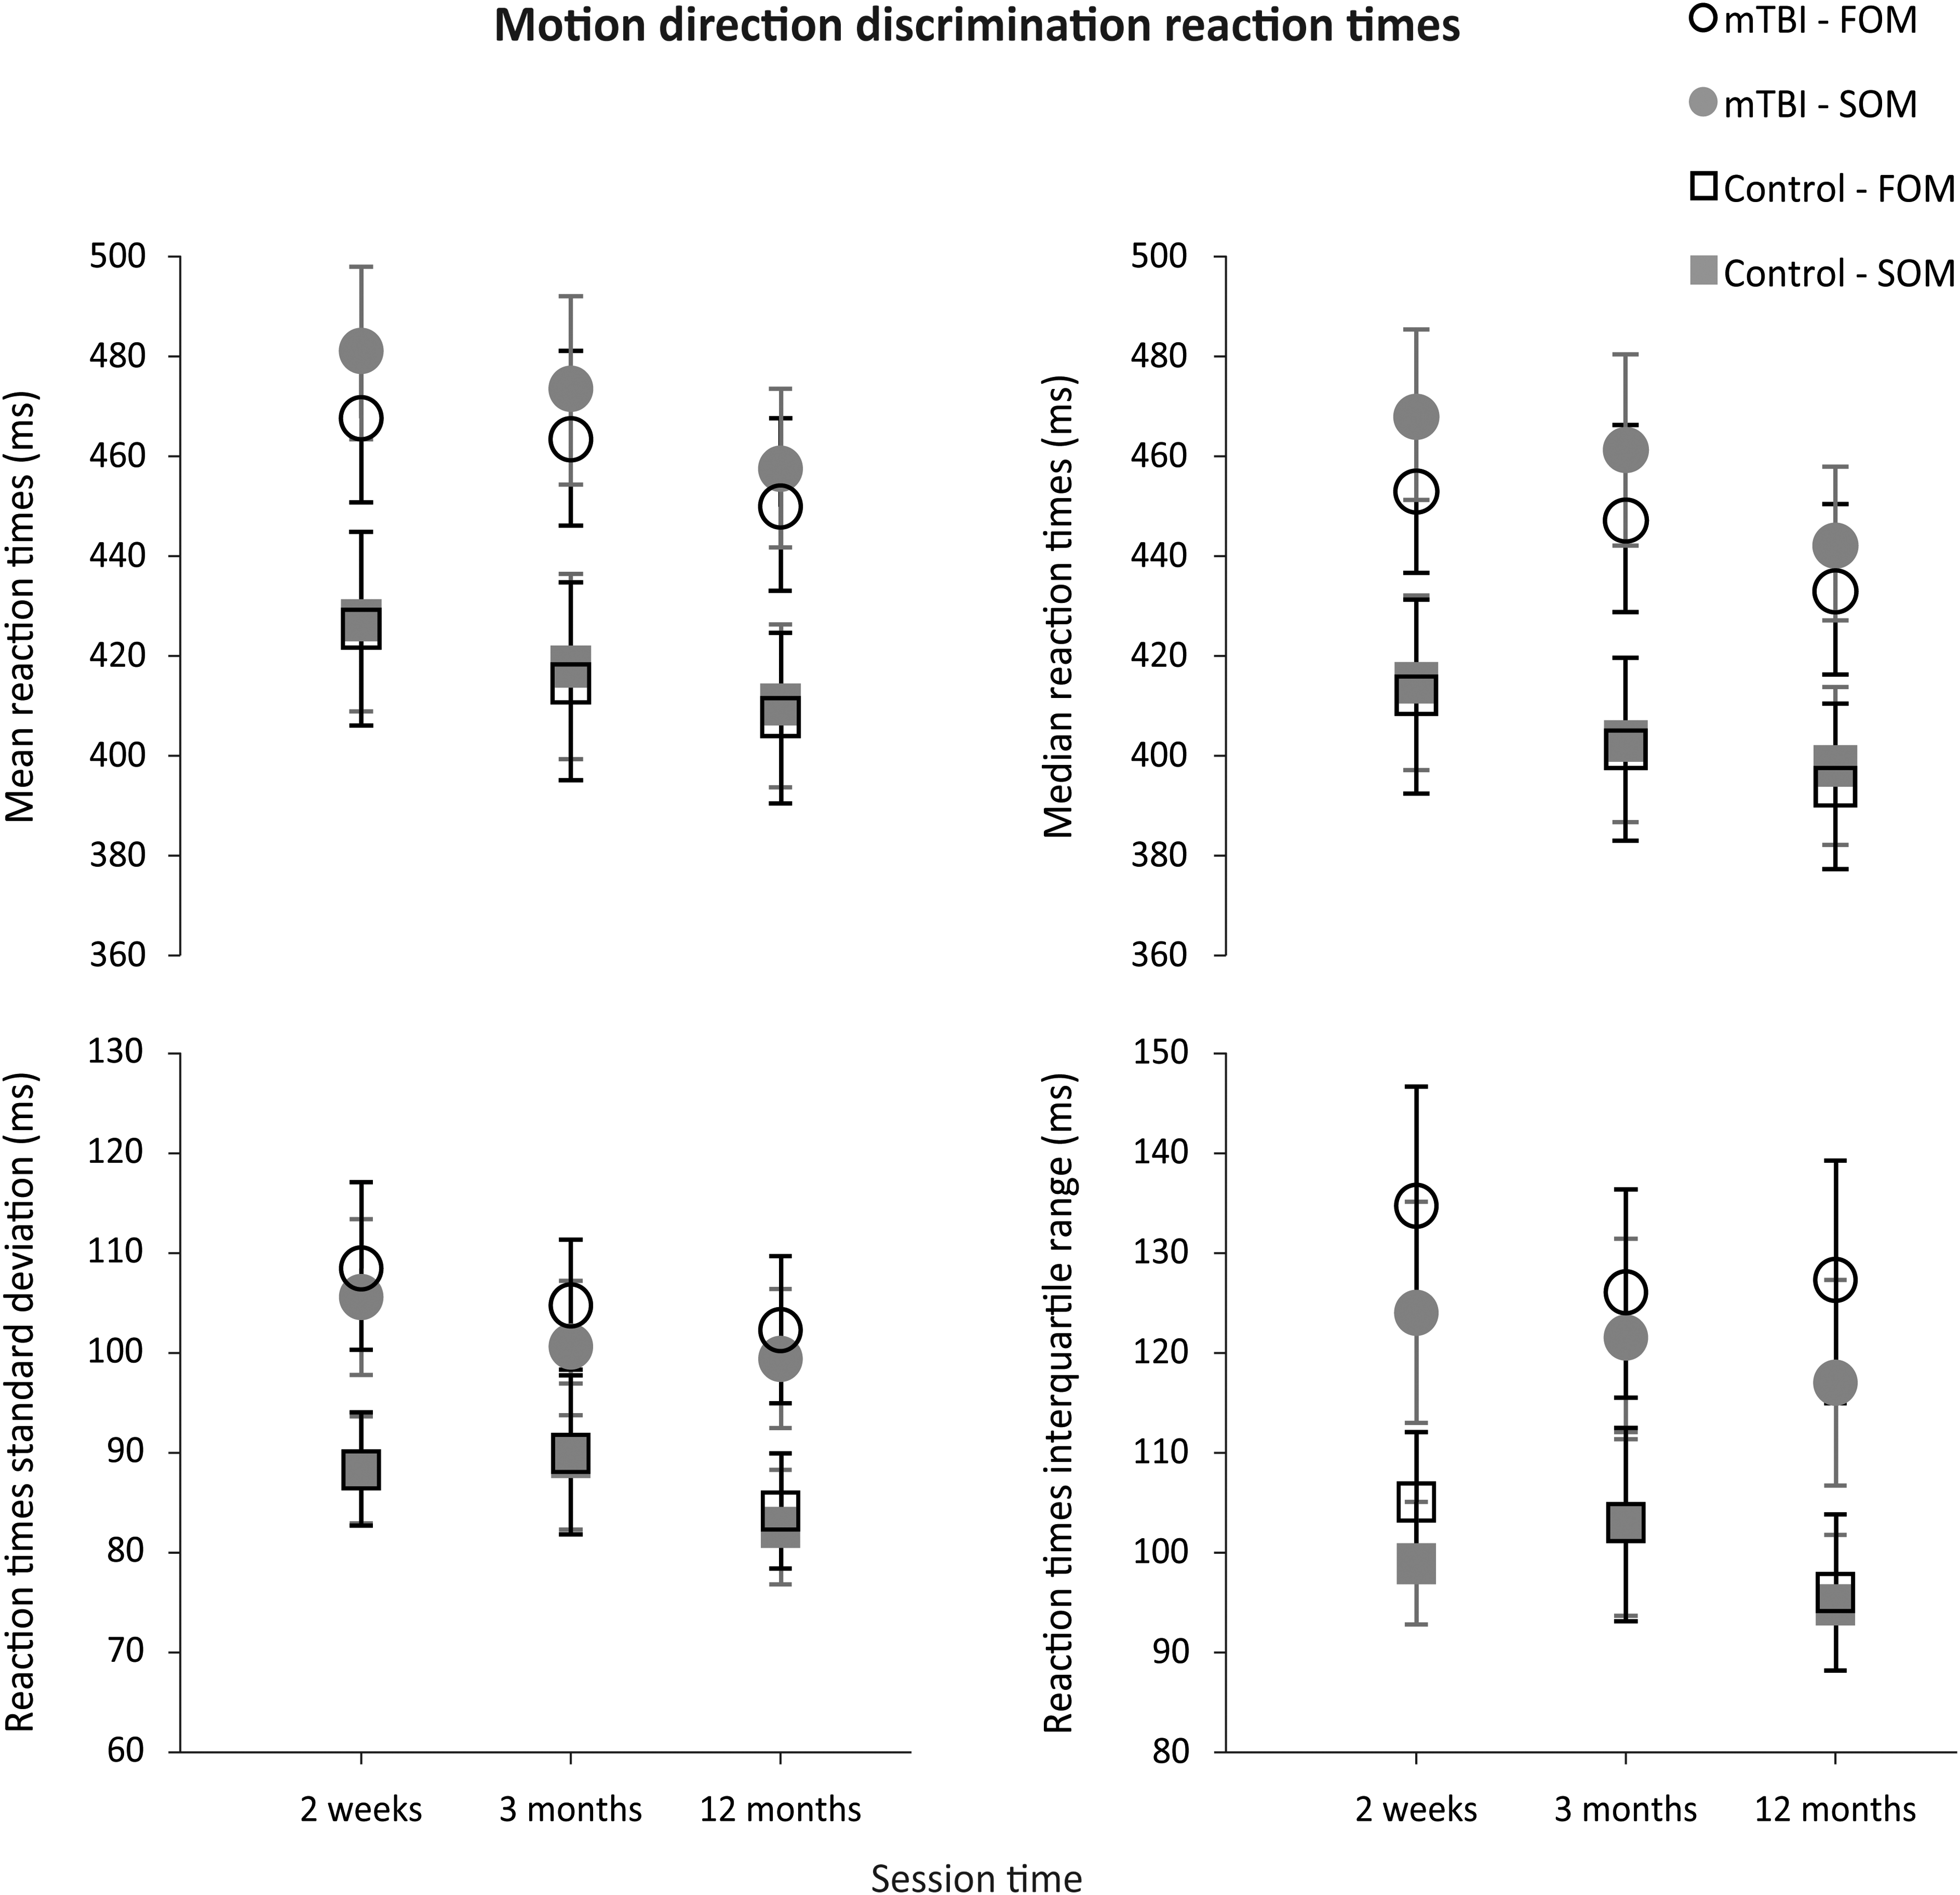
Derived variables from motion direction discrimination reaction time measures; mean ± standard error. mTBI, mild traumatic brain injury; FOM, first-order motion; SOM, second-order motion.
Moreover, a significant Condition effect (F (1, 28) = 549.544; p < 0.0001) indicated that mean detection RTs (flicker condition) were shorter than mean motion direction discrimination RTs (motion condition) for both groups. This result was expected owing to the difference of cognitive weight between tasks.
Mean RT analysis also revealed: 1) a significant Modulation effect (F (1, 28) = 9.711; p = 0.004), indicating that mean RTs for first-order stimuli differed significantly from those for second-order stimuli; 2) a significant interaction Modulation × Group (F (1, 28) = 5.477; p = 0.027), indicating that an mTBI has a larger effect on RTs for first- than for second-order stimuli; 3) a significant interaction Condition × Modulation (F (1, 28) = 22.226; p < 0.0001), indicating that margins observed between mean RTs related to first- and second-order stimuli significantly differed from the flicker to the motion condition; and 4) a significant interaction Condition × Modulation x Group (F (1, 28) = 4.799; p = 0.037). To further explain the Modulation factor main effect as well as the latter three interactions, we performed a three-way repeated-measures ANOVA (Condition (2) × Modulation (2) × Session (3)) for each of the mTBI and control groups.
These latter analyses revealed a significant Modulation effect for the mTBI group (F (1, 14) = 8.975; p = 0.010), but not for the control group (F (1, 14) = 0.882; p = 0.364). These results determine that margins observed between mean RTs related, respectively, to first- and second-order stimuli were significant for the mTBI group alone. These ANOVAs also showed a significant Condition × Modulation interaction (F (1, 14) = 20.210; p = 0.001) for the mTBI group, but not for the control group (F (1, 14) = 3.882; p = 0.069). These results demonstrate that differences observed between mean RTs related, respectively, to first- and second-order stimuli for flicker condition significantly differed from those observed for motion condition, for mTBI participants only. To further explain the Condition × Modulation interaction for the mTBI group, we performed a two-way repeated-measures ANOVA (Modulation (2) × Session (3)).
This latter ANOVA showed a significant Modulation effect for the motion condition (F (1, 14) = 16.637; p = 0.001), but not for the flicker condition (F (1, 14) = 0.276; p = 0.608). This indicates that mean motion direction discrimination RTs for first-order stimuli were significantly shorter than for second-order stimuli, whereas mean detection RTs were relatively similar for both types of stimulus.
Finally, there was no significant Session effect on mean RTs (F (2, 56) = 1.378; p = 0.261), indicating that RTs did not significantly vary across testing sessions. This was true for both groups. However, a significant Condition × Session interaction (F (2, 56) = 3.402; p = 0.043) indicates that differences observed between mean RTs related to flicker and motion conditions varied between sessions. To better explain the latter interaction, we performed a three-way mixed ANOVA (Modulation (2) × Session (3) × Group (2)) for both flicker and motion conditions.
These latter analyses revealed a significant Session effect for the motion condition (F (2, 56) = 3.495; p = 0.039), but not for the flicker condition (F (2, 56) = 0.260; p = 0.769). Therefore, these results indicate that, for both groups, mean motion direction discrimination RTs significantly shortened from session A to session C, whereas mean detection RTs did not significantly vary from session to session. This can be owing to a learning effect for both groups and could also be owing, to some extent, to a lessening of visual perception deficits for mTBI subjects.
Median RTs analysis returned similar results (not shown here).
Reaction times standard deviations and interquartile ranges
A four-way mixed ANOVA (Condition (2) × Modulation (2) × Session (3) × Group (2)) revealed a significant Group effect on RT standard deviations (RTSDs; (F (1, 28) = 5.170; p = 0.031; Figs. 2 and 3). This result indicates that RTSDs were significantly larger for the mTBI than for the control group. In other words, RT distributions were further spread around their mean for the mTBI group.
Moreover, a main effect of the Condition factor on RTSDs turned out to be almost significant (F (1, 28) = 4.132; p = 0.052). This indicates that detection RTSDs tended to differ from motion direction discrimination RTSDs. For the control group, detection RTSDs clearly seemed shorter than motion direction discrimination RTSDs, whereas for the mTBI group, detection and motion direction discrimination RTSDs did not seem to differ.
RTSDs analysis revealed no significant Modulation effect (F (1, 28) = 0.054; p = 0.818), which indicates that there was no difference between first- and second-order stimuli RTSDs. There was also no significant Modulation × Group interaction (F (1, 28) = 0.261; p = 0.613), which indicates that the differences observed between RTSDs for first- and second-order stimuli did not significantly differ from one group to the other.
However, RTSDs analysis showed: 1) a Condition × Modulation interaction (F (1, 28) = 4.189; p = 0.050), indicating that the difference observed between RTSDs for first- and second-order stimuli were significantly different from flicker to motion condition and 2) a Condition × Modulation × Group interaction (F (1, 28) = 4.943; p = 0.034). To better describe those two latter interactions as well as the almost significant effect of Condition factor, we performed a three-way repeated-measures ANOVA (Condition (2) × Modulation (2) × Session (3)) for each of the mTBI and control groups.
These ANOVAs revealed a significant Condition effect (F (1, 14) = 10.030; p = 0.007) for the control group, but not for the mTBI group (F (1, 14) = 0.011; p = 0.920). These results suggest that detection RTSDs were significantly narrower than motion direction discrimination RTSDs for the control group, whereas detection and motion direction discrimination RTSDs were similar for the mTBI group. In other words, shorter mean RTs corresponded with a smaller dispersion for the control group, whereas dispersions around the mean were similar for short (flicker condition) and long (motion condition) RTs in the mTBI group. These latter observations also explain why the Condition factor effect was almost significant in the four-way mixed ANOVA.
There was also a significant Condition × Modulation interaction (F (1, 14) = 6.686; p = 0.022) for the mTBI group, but not for the control group (F (1, 14) = 0.025; p = 0.878). These results indicate that the margins observed between RTSDs, respectively, related to first- and second-order stimuli significantly differed between flicker and motion conditions for the mTBI group only. To further explain this latter interaction, we applied a two-way repeated-measures ANOVA (Modulation (2) × Session (3)) to mTBI group data.
This latter ANOVA revealed a significant Modulation factor effect (F (1, 14) = 4.726; p = 0.047) for the motion condition, but not for the flicker condition (F (1, 14) = 2.429; p = 0.141) for the mTBI group. These results finally indicate that motion direction discrimination RTSDs were significantly larger for first- than for second-order stimuli, whereas there was no significant difference between detection RTSDs related to first- or second-order stimuli. In the motion condition, the shortest mean RTs (i.e., related to first-order stimuli) were associated with a larger dispersion in the mTBI group.
Finally, the four-way mixed ANOVA revealed no significant Session factor effect (F (2, 56) = 1.726; p = 0.189) and no significant Condition × Session interaction (F (2, 56) = 0.028; p = 0.970), which indicates that all previously described observations for the RTSDs did not significantly vary across sessions.
RTIQRs analysis (four-way mixed ANOVA) slightly differed from RTSDs analysis as for the Condition factor effect and decompositions. Actually, it revealed a significant effect of Condition factor (F (1, 28) = 23.985; p < 0.0001), indicating that detection RTIQRs were significantly narrower than motion direction discrimination RTIQRs for both groups (Figs. 2 and 3). However, in spite of different decompositions, RTIQRs analysis led to the same conclusions as RTSDs analysis, and thus is not described further here.
Self-reported symptoms
The two-way mixed ANOVA (Session (3) × Group (2)) applied to PCSS-R total scores revealed a significant Group effect (F (1, 28) = 12.614; p = 0.001). However, this analysis returned neither significant Session effect (F (2, 56) = 1.816; p = 0.182) nor significant Session × Group interaction (F (2, 56) = 0.909; p = 0.387). These results indicate that: 1) mTBI subjects had significantly more symptoms and/or symptoms of greater severity than control subjects and 2) this difference between mTBI and control subjects did not significantly vary across sessions (Fig. 4).
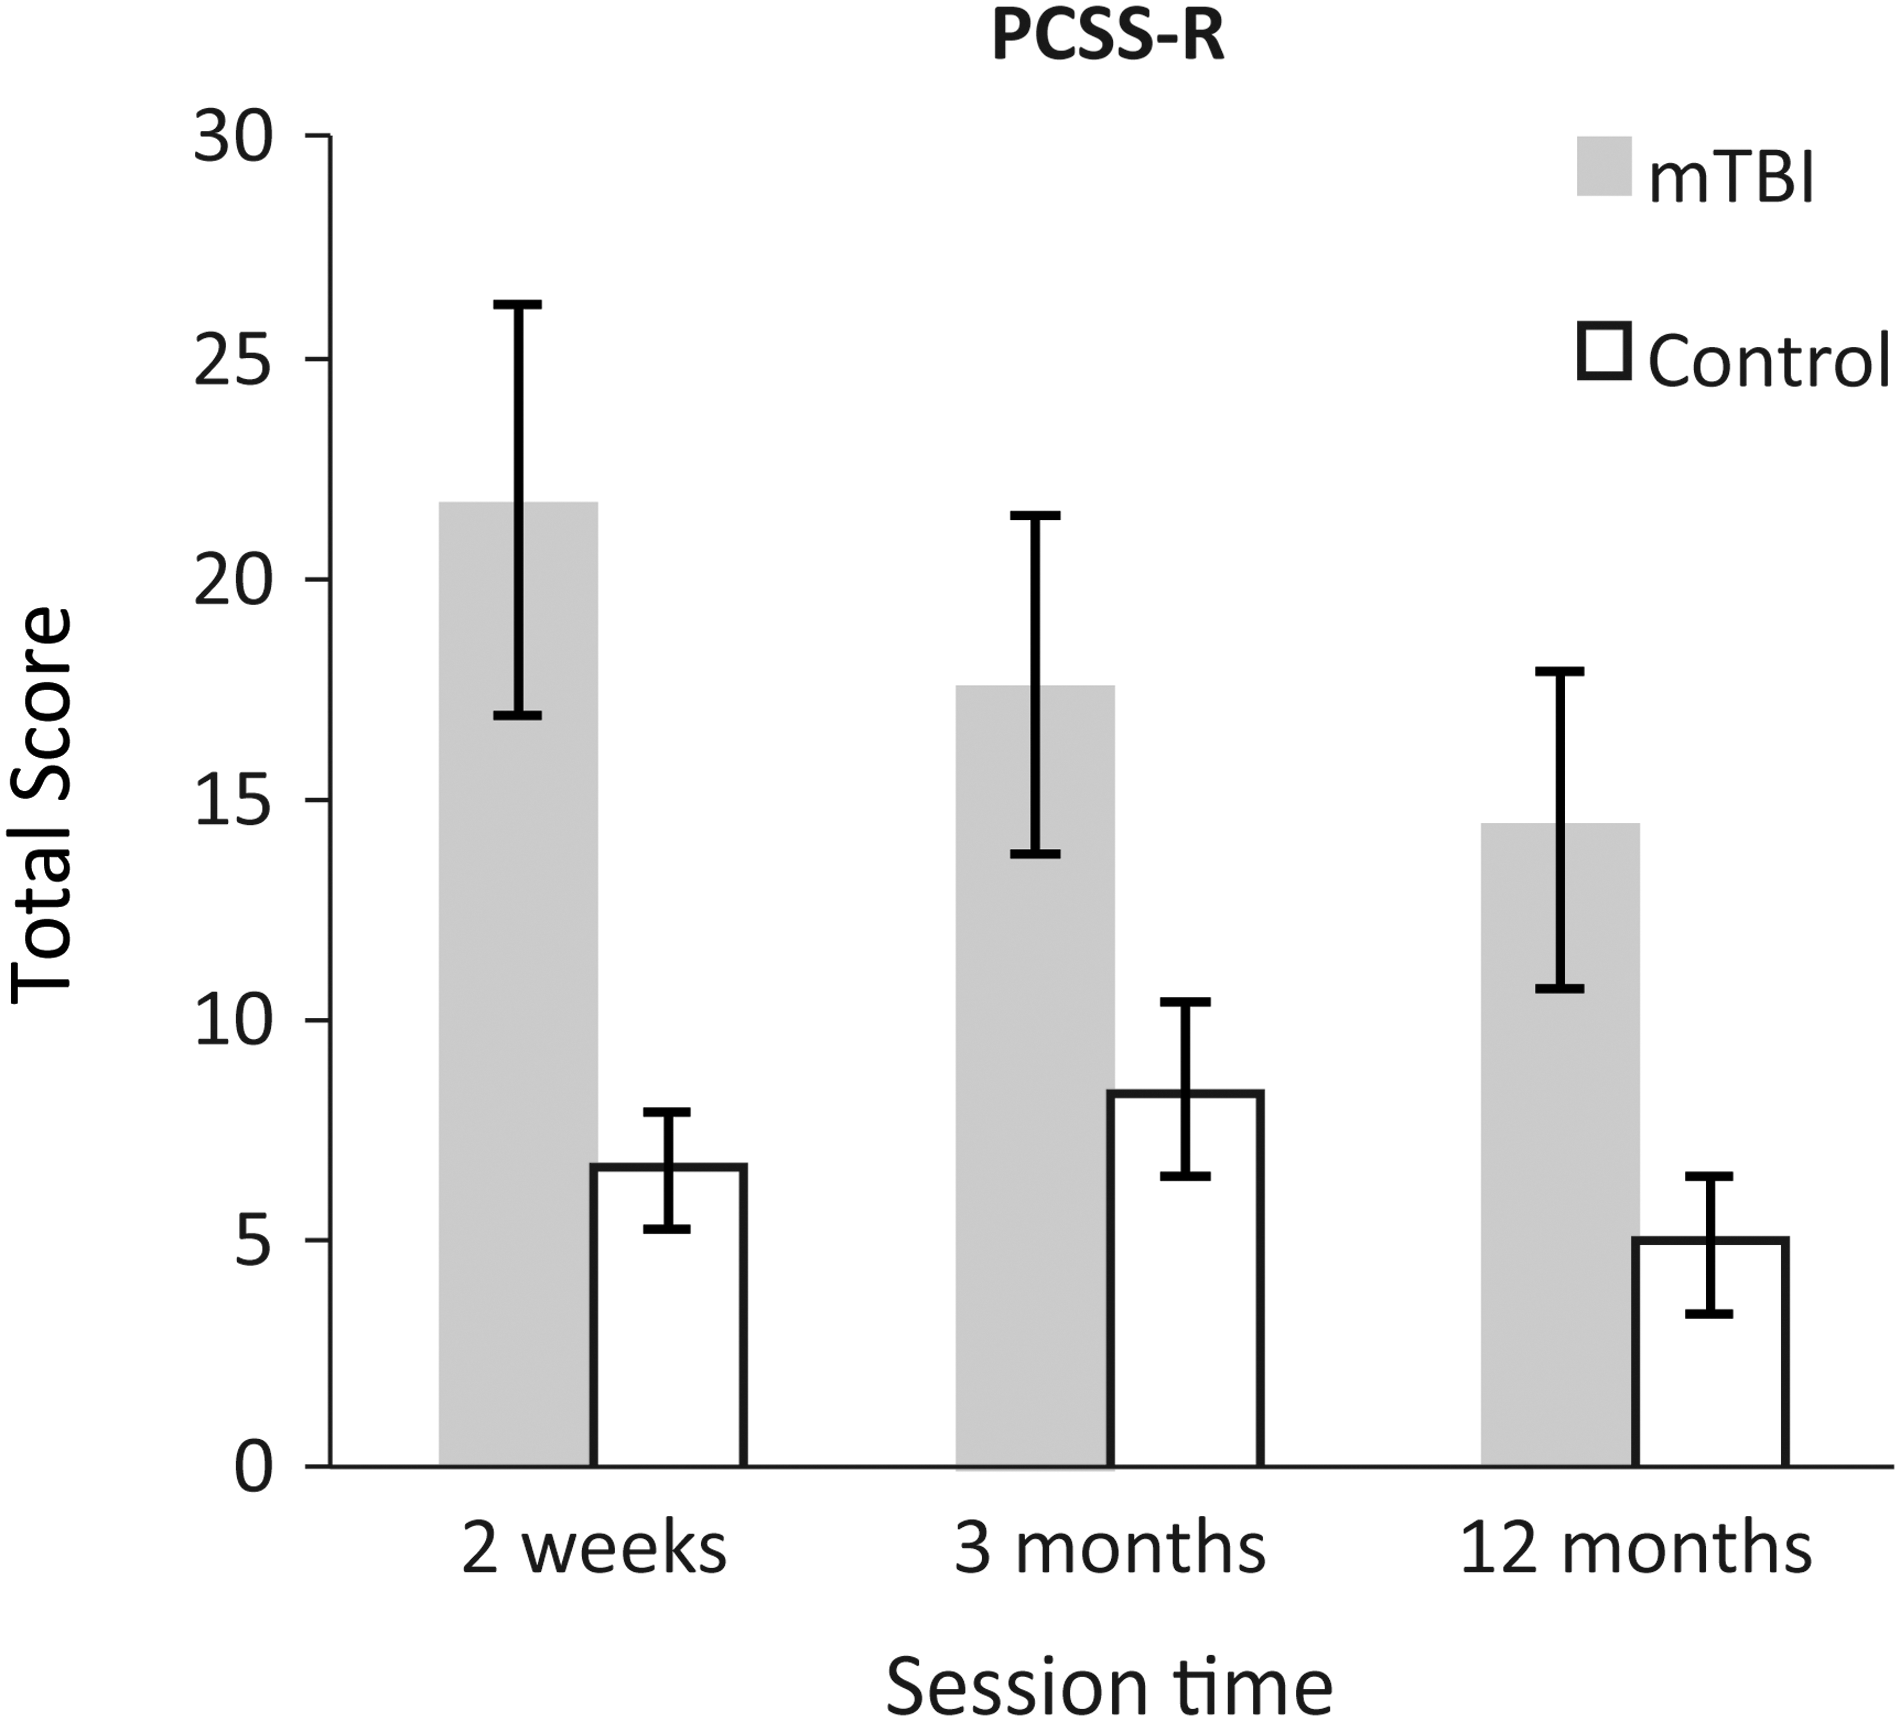
Post-Concussion Symptom Scale-Revised (PCSS-R) Total scores; mean ± standard error. mTBI, mild traumatic brain injury.
We also sought to verify whether there were correlations between: 1) RT variables (mean, SD, median, and IQR) at each session and the level of symptoms at corresponding session times and 2) between those same variables and the initial level of symptoms (i.e., determined at session A).
No correlation was found between the level of symptoms and RT variables for the control group.
Correlations between reaction times and level of symptoms at each session (mild traumatic brain injury group)
Session A
Mean and median RTs of the mTBI group for motion condition (first- and second-order) are positively correlated with the level of symptoms (mean RTs: r ≥ 0.646; p ≤ 0.009; median RTs: r ≥ 0.637; p ≤ 0.011). No significant correlation (p ≤ 0.0125) was found between level of symptoms and RT SDs and IQRs at session A.
Sessions B and C
No significant correlation was found between level of symptoms and RT variables
Correlations between reaction times and initial level of symptoms (mild traumatic brain injury group)
Session B
Mean RTs and RTSDs of the mTBI group of session B are positively correlated with the initial level of symptoms for all conditions (mean RTs: r ≥ 0.708; p ≤ 0.003; RTSDs: r ≥ 0.673; p ≤ 0.006). Median RTs are positively correlated with the initial level of symptoms for motion condition (first- and second-order), and RTIQRs are positively correlated with the initial level of symptoms for flicker condition (first- and second-order) and for first-order motion condition (median RTs: r ≥ 0.702; p ≤ 0.004; RTIQRs: r ≥ 0.649; p ≤ 0.009).
Session C
The initial level of symptoms is positively correlated only with RTSDs for first-order flicker (r = 0.639; p = 0.010).
Discussion
Visuomotor deficits related to motion processing after mild traumatic brain injury
Several conclusions have to be retained concerning the RT measures made in this study. First, for all conditions and sessions, RTs were globally longer and more spread around the central tendency for mTBI than for control subjects. In other words, responses of mTBI participants were significantly slower and more variable than those of control subjects, even 1 year after brain injury. These results are in agreement with those of Hugenholtz and colleagues, 77 Stuss and colleagues, 78 and Beaupré and colleagues. 79 They highlight the presence of persisting deficits affecting neural networks involved in visual information detection, integration, and interpretation, as well as in the related motor response as shown using RTs. Further, the observed difference in processing speed between the two groups in this kind of simple task suggests that, at early visual perception stages, this slowing is probably owing to: 1) longer processing steps leading to increasing delays during global processing and/or 2) to defective links between these steps in mTBI individuals. The durable presence of such deficits lingering beyond 3 months after an mTBI is in agreement with the findings of Brosseau-Lachaine and colleagues. 60
Second, concerning detection RTs, regardless of group, no difference was observed between first- and second-order stimuli. In other words, the discrepancies observed between detection RTs related to first- and second-order stimuli were similar in both groups. However, this task required giving a response as soon as the stimulus appeared. This means that the response speed resulted probably more from the detection of any change on the screen than from identification of the stimuli attributes.
Third, concerning motion direction discrimination RTs, three observations can be made. The first one is that they were longer than detection RTs, regardless of group or session. This can easily be explained by the fact that the processing load was greater for motion direction discrimination than for detection.
The second observation is, for control subjects, the absence of significant difference between choice RTs related, respectively, to first- and second-order stimuli, regardless of the variable (mean, median, SD, and IQR), and in spite of the fact that central tendencies were greater for second- than for first-order stimuli. These results confirm that our modulation depth adjustment between first- and second-order stimuli allowed equating their visibility. These results are also in agreement, at least for these modulation depths, with RT measures reported by Ledgeway and Hutchinson 55 as a function of stimuli attributes (first- vs. second-order) and contrast level.
Finally, the third observation concerns data of mTBI subjects. Two conclusions can be drawn. The first conclusion is that both the mean and the median RTs were significantly longer for second-order than for first-order stimuli across all testing sessions. The second conclusion concerns RT SDs and IQRs. For motion direction discrimination, RT SDs and IQRs were significantly larger for first- than for second-order stimuli. This second conclusion went against expectations: It was expected that the lower means and medians (i.e., corresponding to the shortest RTs and related to first-order stimuli) would be associated with a smaller dispersion. This is what we observed in the control group, where simple RTs, which were the shortest, were associated to a lesser dispersion than choice RTs. The validity of these findings is further reinforced by the fact that motion direction discrimination RTs of control group, as well as detection RTs of both groups, did not reveal any difference related to stimuli attributes, regardless of the variable (mean, median, SD, and IQR).
The finding that mean and median motion direction discrimination RTs of the mTBI group are longer for second- than for first-order stimuli is in agreement with the hypothesis of the existence of two separate mechanisms respectively dedicated to first- and second-order motion perception. 40,41,52 –55,83 These observations indicate that more time is needed to discriminate motion direction for second- than for first-order stimuli. Finally, the fact that, for the mTBI group, motion direction discrimination RTs were longer for second- than for first-order stimuli indicates that the integration of complex stimuli (i.e., second-order) is more severely affected in individuals having sustained an mTBI. Our findings are therefore in agreement with the observations of Brosseau-Lachaine and colleagues. 60
The finding that motion direction discrimination RT SDs and IQRs are greater for first- than for second-order stimuli for the mTBI group does not agree with the idea that, globally, shortest RTs should be associated with the smallest dispersion. This is what the data of control group indicate, when comparing simple to choice RTs. RT SDs and IQRs of mTBI group show a greater variability of RTs for first- than for second-order motion. It has been demonstrated that, for low spatial and temporal frequencies, motion of sine-wave luminance-defined gratings could be perceived either through a simple mechanism specific to such stimuli attributes or through a more-complex attention-based mechanism. 52 –54,80,81 The first mechanism, more automatic and requiring less-complex processing, seems usually to be preferentially used, whatever the spatial or temporal frequency, for first-order motion processing. This mechanism is the fastest. The second mechanism, of higher perception level and requiring additional visual-attentional processes, seems to be associated only with low spatial and temporal frequencies (such as the ones we used here) and to be the only one available for second-order motion stimuli perception. This mechanism is the slowest. The direction discrimination RT SDs and IQRs of both the mTBI and the control groups are in agreement with findings indicating that, at low spatial and temporal frequencies, both of the previously discussed mechanisms are available for first-order motion perception. These results also show that the fastest of those mechanisms is preferentially used in non-brain-injured adults. The greater variability of motion direction discrimination RTs for first- than for second-order stimuli in mTBI participants is compatible with the hypothesis of a first-order motion perception switching from a slower to another faster mechanism, after such a mild diffuse brain injury. Otherwise, the similar distributions of first- and second-order-related motion direction discrimination RTs in the control group may testify, in this particular case and given the equivalent visibility of stimuli attributes, to the systematic use of the fastest mechanism for first-order motion processing and of the slowest mechanism for second-order motion processing. The greater dispersion of motion direction discrimination RTs related to first-order stimuli, in mTBI participants, could be the result of a combination of deficits affecting neural networks dedicated to each of these mechanisms as well as inhibitory neural networks, which may enable selecting one or the other of these two pathways, without any parasitic or competitive interference of the other one. Another hypothesis would be that motion visual processing switches from one mechanism to the other whenever one is not able to efficiently process information, secondary to neurophysiological disorders that could temporally render inefficient such cerebral processes when used in a sustained fashion (as they probably were in such a task). Both of these hypotheses are compatible, in the first days after the mTBI, with the occurrence of neurophysiological disorders resulting from traumatic axonal injury and cerebrovascular damages, 12,13,16,22 –25 and in a longer term with the brain atrophy that occurs in individuals having sustained an mTBI. 26,82
Visual perception deficits and level of symptoms after mild traumatic injury
The level of self-reported symptoms using the PCSS-R remained significantly higher for mTBI than for control subjects across sessions. Consequently, we investigated whether there was any relationship between level of symptoms and RTs.
No statistically significant correlation was established between these variables for control group participants, regardless of the session.
In mTBI group participants, there was a link between level of symptoms and mean and median RTs in the first days after the brain injury. However, significant correlations between symptoms at the time of testing and RT measures disappeared 3 months after the injury. The level of symptoms 15 days postinjury positively correlated with mean and median RTs recorded at the same period for motion conditions (first- and second-order). These correlations for data gathered at 15 days after brain injury could indicate that level of symptoms and deficits associating visual perception and motor response requiring a choice may have, to some extent, a common neurophysiological origin, soon after the brain injury.
Three months post-mTBI, significant correlations between level of symptoms and RTs were no longer found. These results indicate that RTs shortened more than the level of symptoms decreased for the mTBI group. These findings are in agreement with those of Naunheim and colleagues, 2 who found that, in the first 6 h after an mTBI, the general cognitive status and performances to attention tests improved faster than the level of symptoms deceased. Our results are also in agreement with those of other researchers who showed that, in some cases, the persistence of some particular postconcussive symptoms for months, and even years, post-mTBI was associated with usually subtle cognitive deficits. 26,30,79,83,84 Other factors than that related directly to the brain injury may also have contributed to the lack of correlation between level of symptoms and reaction time measures at 12 months postinjury. Our results show that although symptoms are still present months after the injury, they are no more related to the RT responses.
Considering correlations between the initial level of symptoms and RT variables, we can see that 4 of 16 were significant at session A, they were globally (13 of 16) significant at session B, and only 1 of 16 was significant at session C. These findings seem to be attributable to some variability in the time course of recovery from visuomotor deficits resulting from an mTBI. The fact that correlations between initial level of symptoms and RTs were stronger for data related to session B than for those related to session A indicates that the shortening of RTs and the narrowing of their distribution from session A to B were relatively more pronounced in mTBI individuals having a lower initial level of symptoms, or that these two phenomena concerned only initially less symptomatic subjects. From session B to C, the number of significant correlations between the initial level of symptoms and RTs largely decreased. This suggests that, from session B to C, the shortening of RTs and the narrowing of their dispersion were relatively larger in subjects having a higher initial level of symptoms, or that these two phenomena were found only in the initially more symptomatic subjects. In other words, RTs were even longer and their dispersion even greater when the initial level of symptoms was high, and the decrease in visuomotor deficits revealed by RTs was even faster when initial level of symptoms was low. These time-course recovery differences among mTBI participants depending on injury severity have also been observed in children ages from 8 to 15 over a 1-year period. 85 Likewise, Iverson, 11 in a study on athletes ages from 13 to 19, showed that participants whose recovery was longer were also those who had the worst performances on neuropsychological tests and a higher level of symptoms on average, 72 h after the mTBI. Finally and similarly, other investigators showed that individuals having sustained an mTBI and who had the worst performances on neuropsychological and balance tests at ED assessment, had persisting symptoms 14 and 3 months later. 3
Conclusions drawn from correlations between RT variables and level of symptoms had an essentially descriptive goal, given that this can eventually become highly relevant for clinical practice. Given that these results showed some heterogeneity, they should be interpreted with caution, particularly because: 1) the assessment of level of symptoms is subjective in nature; 2) there is variability over time (in the short term) in the presence and severity of symptoms, especially at 3 months and 1 year after the mTBI, whereas the PCSS-R assesses self-reported symptoms only over the last 24 h; 3) the symptoms listed in the PCSS-R are not entirely specific to mTBI, although they have been shown to be more frequent, as well as sensitive and specific in mTBI, in comparison to moderate-to-severe TBI or trauma controls at similar time points postinjury, or to normal control 86,87 ; and 4) the neurophysiological disorders behind symptoms and the visuomotor deficits demonstrated by RT measures may perhaps not be related entirely to the same brain areas and/or tissues. 16,28,70,88,89
Limitations
Ideally, a larger sample size would have been preferable, especially to draw more-general conclusions and establish subcategories in terms of concussion type or level of symptoms, for instance. However, strictly respecting all inclusion and exclusion criteria, particularly regarding the absence of alcohol or drug abuse, made recruitment rather difficult. Moreover, given that the willingness to participate in research is less in patients who fully recover, this may result in an underestimation of the recovery after an mTBI as measured with RTs. 90
It would also have been preferable that none of the participants belonging to the mTBI group have a previous medical history of mTBI (1 year or more before inclusion in the study, according to our inclusion/exclusion criteria). However, this was found for only 2 subjects, and thus results of the entire mTBI group cannot be ascribed to this.
Finally, owing to relatively long periods between each testing session, it was not impossible that subjects sustained another mTBI in the course of the present study. However, this was verified before the second and third testing sessions. None of the subjects belonging to the control group reported having sustained an mTBI during the whole study period. In the mTBI group, however, one subject reported, at session C, having being concussed on a soccer field 6 weeks after session B. He reported having neither loss of consciousness nor post-traumatic amnesia after this injury. He reported his symptoms (nausea, dizziness, confusion, and fatigue) to have lasted around 1–2 months. Finally, he said having stopped all sport activities after this incident (i.e., for over a 7.5-month period). At the third session, he reported being clear from all symptoms (nausea, dizziness, confusion, and fatigue). His data gathered at session C were compared to those recorded at previous sessions and to those of other mTBI group participants. Given that no aberration was found this way in his latter data, we decided to include them in the study.
Conclusion
In the present study, RT measures related to first- and second-order stimuli reveal the presence of subtle visual perception deficits induced by an mTBI and affecting high-level as well as low-level processing steps. Moreover, our findings related to motion direction discrimination RTs showed that visuomotor deficits affected high-level more than low-level processes. Finally, these deficits and level of symptoms observed in mTBI participants did persist up to 1 year after the brain injury. This reveals that, even though after an mTBI there is a lessening of visuomotor deficits as well as a decrease in the level of symptoms, the recovery from such a brain injury 1 year later does not reach the functional level that can be observed in a non-brain-injured population.
Visual perception deficits induced by an mTBI prove to be detectable by tasks relying on the analysis of first- and second-order motion perception. Developing screening tests in this respect intended for early post-mTBI use would be of interest. Further, further studying relationships of such deficits with performance in daily life activities, such as school, work, or sports, is crucial in order to determine the functional impacts of these alterations in visuomotor functions.
Footnotes
Acknowledgments
This study was funded by the Canadian Institutes of Health Research (MOP-18004). The authors thank David Nguyen-Tri for programming and English proofreading; Isabelle Roy and Ariane Demers (HSCM) and Lisa Grilli (MUHC) for recruitment of participants; Thomas Romeas (School of Optometry, Université de Montréal; project coordinator); Rémy Allard and Frédéric Poirier for comments on the manuscript; Claudine Habak for English proofreading and comments on the manuscript; and all the participants that participated in this study.
Author Disclosure Statement
No competing financial interests exist.