




Abstract
The role of primary blast in blast-induced traumatic brain injury (bTBI) is controversial in part due to the technical difficulties of generating free-field blast conditions in the laboratory. The use of traditional shock tubes often results in artifacts, particularly of dynamic pressure, whereas the forces affecting the head are dependent on where the animal is placed relative to the tube, whether the exposure is whole-body or head-only, and on how the head is actually exposed to the insult (restrained or not). An advanced blast simulator (ABS) has been developed that enables high-fidelity simulation of free-field blastwaves, including sharply defined static and dynamic overpressure rise times, underpressures, and secondary shockwaves. Rats were exposed in head-only fashion to single-pulse blastwaves of 15 to 30 psi static overpressure. Head restraints were configured so as to eliminate concussive and minimize whiplash forces exerted on the head, as shown by kinematic analysis. No overt signs of trauma were present in the animals post-exposure. However, significant changes in brain 2′,3′-cyclic nucleotide 3′-phosphohydrolase (CNPase) and neurofilament heavy chain levels were evident by 7 days. In contrast to most studies of primary blast-induced TBI (PbTBI), no elevation of glial fibrillary acidic protein (GFAP) levels was noted when head movement was minimized. The ABS described in this article enables the generation of shockwaves highly representative of free-field blast. The use of this technology, in concert with head-only exposure, minimized head movement, and the kinematic analysis of the forces exerted on the head provide convincing evidence that primary blast directly causes changes in brain function and that GFAP may not be an appropriate biomarker of PbTBI.
Introduction
I
The injury mechanics of penetrating fragments (secondary blast injury) or being thrown (tertiary blast injury) by an explosion are comparable to those often encountered in civilian life such as in car accidents and sports injuries. However, the mechanism(s) as to how blast-generated shockwaves cause injury (primary blast injury) are much less defined. Although blast overpressure has long been recognized as causing damage to gas-containing organs such as the lung, ear, and gastrointestinal (GI) tract, 3 –5 primary blast-induced traumatic brain injury (PbTBI) has become the focus of some controversy. 6 –8 Although instances of human PbTBI have been identified recently, 9 as well as in the past, 10 considerable doubt remains as to their frequency and importance in overall bTBI. 11,12 In addition, the development of accepted animal models that accurately reflect the potential human response to primary blast has been problematic due to the diversity of model systems, the difficulties of translating small rodent data to humans, and the questionable relevance of some of these animal model systems to realistic blast scenarios. 13,14
Several hypotheses have been advanced as to the mechanism of PbTBI, none of which are mutually exclusive. A thoracic mechanism with a long history 10,15 postulates that the kinetic energy of a blast pressure wave (or penetrating ballistic projectile) is transmitted through the thorax to the vasculature and then to the brain, causing increased intracranial pressures and resultant damage. 16 This has been supported with several animal studies that show that body armor reduces brain damage, 13,17,18 although the use of shielding in Rhesus monkeys 19 and swine 20 exposed to primary blast did not prevent the intracranial pressure oscillations ostensibly responsible for brain damage. A skull flexure hypothesis posits that the skull and brain act as a coupled mechanical system, where the dynamic structural response of the skull to shockwaves causes intracranial pressure oscillations, with resultant brain damage. 21 –23 This reliance on transmitted stress is dependent on the skull dynamics of a given species, and it has been suggested that this is an important consideration in investigations of PbTBI using animal models. 21 Finally, a hypothesis has been proposed where stress waves are directly transmitted through the cranium. 24 This transosteal propagation of the air-borne shockwave into the brain is distinct from that caused by skull flexure.
The uncertainties as to how, and whether primary blast causes brain injury has hampered the ability to make any definitive decisions as to the role, if any, that it plays in the large number of combat casualties currently suffering from mild TBI. Here, we hypothesize that single-pulse shockwave exposure to the head, with minimized dynamic scaling artifacts of head movement, will directly cause changes in the brain. We used highly defined single-pulse shock-wave forms, head restraint, and kinematic analysis in a head-only exposure rat model to test this hypothesis. During this testing we also examined whether glial fibrillary acidic protein (GFAP), a well-accepted biomarker of mechanically induced TBI, is an appropriate indicator of primary blast-induced brain damage.
Methods
Blast exposure
In conducting this research the authors adhered to the “Guide to the Care and Use of Experimental Animals” and “The Ethics of Animal Experimentation” published by the Canadian Council on Animal Care. Adult male Sprague-Dawley rats were acquired from Charles River Laboratories (St. Constant, QC, Canada) and acclimated for at least one week prior to exposure. On the day of use, the animals (∼280–330 g) were anesthetized with 3% isoflurane in oxygen and placed into a restraint (Fig. 1) consisting of a clear plastic cylindrical sleeve, with the neck encircled snugly in a plastic collar and the head protruding through an opening in the end, which is concaved such that it matches the curvature of the blast tube interior. The hind quarters were supported using an end cap fitted with a piston. To the left of the head and contralateral to the shockwave direction, a mesh netting was secured between two pins placed vertically in line with the side of, and above and below the head. The motion of the head was restrained using two different methods defined as Head Restraint 1 and 2. With Head Restraint 1, the head was placed against the vertical netting, and then held in place using additional netting around the head. Head Restraint 2 also used the vertical mesh, but with the head of the anesthetized animal supported using a thin strip of duct tape placed horizontally between the bottom pins. Importantly, this method did not secure the head in place against the vertical mesh with additional netting (Fig. 1).

Animal restraint device. The animal holder consists of a tube that encases the body with the hind quarters supported using an end cap fitted with a piston. The head protrudes through an opening in a fitted collar, with the opening being concaved so that it matches the curvature of the blast tube interior. Two pins secure a vertical mesh support that is stretched taut between them. For Head Restraint 1, the right side of the head is wrapped against this support with additional mesh to enable the left side of the head to be exposed to the shockwave. The mesh is secured using Velcro® that is situated downstream and behind the right side of the head. For Head Restraint 2, an additional pin is placed horizontally from the bottom pin and an ∼0.25-cm wide strip of duct tape (double sided, glue side in) is stretched between them to support the head. The head is not restrained with a net wrapping as in Head Restraint 1.
After a total of 8 min of anesthesia, the restraint containing the animal was set into the wall of the advanced blast simulator (ABS) 4280 mm downstream from the diaphragm, such that only the head protruded into the test section. Test groups consisted of sham control, and head-only, side-on exposures of single-pulse shockwave static overpressures of 15, 20, 25, and 30 psi of ∼6 to 7 msec positive duration. At 1 day (Head Restraint 2) or at 1 and 7 days (Head Restraint 1) post-exposure, the animals were anesthetized and then euthanized. For experiments involving brain biochemistry and Western blot analysis, animals were sacrificed by decapitation. Brain regions containing the hippocampus, frontal cortex, cerebellum, and brainstem were separated under a dissecting microscope and lysates were prepared and stored at −80°C until analysis. For experiments involving histology or immunohistochemistry, animals were euthanized and immediately perfused transcardially with ice-cold phosphate-buffer saline (PBS, pH 7.4) followed by 4% formaldehyde. The brains were removed and post-fixed with 4% formaldehyde before histological preparations.
Advanced blast simulator (ABS)
A custom‐built ABS (∼30.5 cm in diameter and 5.79 m in length, Fig. 2) was used for producing simulated blast waves. Unlike a conventional shock tube, the ABS was designed from first principles to replicate the wave dynamics of explosive blast by means of its specially shaped divergent area. 25 It is particularly important to reproduce the correct tailored waveforms for static and dynamic pressure in the shockwave, which are most often misrepresented in conventional shock tubes. The ABS consists of a “driver” section filled with high-pressure gas separated by a frangible diaphragm from a transition section, leading to an ambient-pressure test section. Controlled pressurization of the driver causes rupture of the diaphragm at predetermined pressures, abruptly releasing the high-pressure gas and driving a tailored shockwave down the length of the test section. The inclusion of an end wave eliminator (EWE) at the end of the test section precludes reflected waves propagating back into the testing area; the EWE also mitigates noise and gas efflux into the laboratory space. By means of these unique design features, the ABS generates highly reproducible single-pulse shockwaves tailored to replicate those of explosive blast. 25 The required target pressure and waveform shapes were achieved using compressed helium in the driver and various layering and thicknesses of reinforced cellulose acetate sheets for the frangible diaphragm.
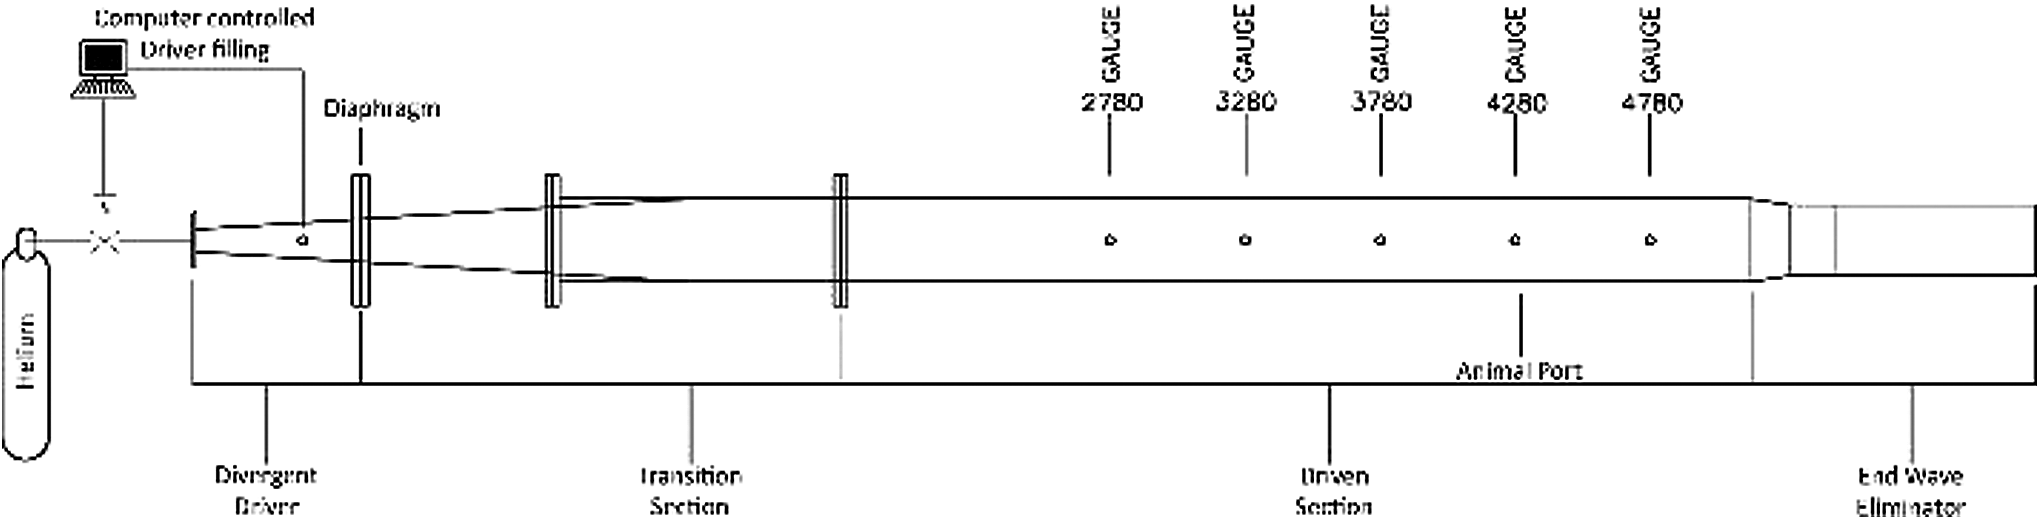
Schematic of advanced blast simulator (ABS). The divergent driver is pressurized with helium through a computerized control system. The diaphragm fails at a pre-determined driver pressure, sending a shockwave through the transition section and into the test section. The animal restraint device (Fig. 1) is inserted into a port located 4280 mm downstream from the diaphragm, so that the head is across from the 4280-mm sidewall pressure gauge. A tunable end wave eliminator prevents rarefaction waves from re-entering the test section.
ABS pressure data acquisition
Static pressures were measured using PCB 113A28 gauges placed at 2780, 3280, 3780, 4280, and 4780 mm from the diaphragm. Total pressures experienced by the test animal were measured using a Pitot probe (Endevco 8530B pressure transducer) orientated such that it measured the total pressures at the test location 4280 mm from the diaphragm. Dynamic pressures were obtained by calculating the difference between the static and total pressure recorded at this location. All pressure data were recorded using a custom Labview interface and recorded on a GaGe Octopus 8389 CompuScopePCIe digitizer board at a sampling rate of 500,000 samples/sec.
High-speed photography and kinematics
To observe the response of the head to the shockwave, the ABS was equipped with polycarbonate window ports. These windows provided viewports for high-speed video cameras, whereas two smaller windows permitted illumination from video lights. Two Phantom v710 high-speed video cameras were positioned across from, and above the animal, thus providing front and top views of the head, respectively. Video was recorded at a resolution of 640 × 528 pixels at a frame rate of 20,000 frames per sec. The kinematics of the animal head were measured using the eyes and base of the nose as landmarks, thereby defining a triangle in three-dimensional space, with the nose used as the origin. Tracking was achieved at a high temporal resolution of 50 μsec intervals.
Western blot analysis
Rat brain homogenate protein lysates (10–15 μg protein) were separated on a 4 to 20% gradient pre-cast gel (Bio-Rad Laboratories, Mississauga, ON, Canada) and transferred onto polyvinylidene difluoride (PVDF) membranes. The membranes were blocked with 5% skim milk, 0.1% Tween 20 in PBS, and then incubated with antibodies against GFAP (1:2000; Invitrogen, Burlington, ON, Canada) or Neurofilament H (NFH, 1:1000; Invitrogen) overnight at 4°C. The membranes were then washed with PBST (PBS plus 0.1% Tween 20) 3 times for 10 min each. Primary antibodies were probed by incubating membranes with a secondary antibody; donkey anti-rabbit or mouse IgG-HRP (GE Health Care Biosciences, QC, Canada) diluted 1:5000. Detection was carried out by using ECL advanced detection reagents (GE Health Care Biosciences) and imaged using a Molecular Imager VersaDoc MP 4000 system (Bio-Rad Laboratories). To confirm equal protein loading, blots were re-probed with anti-pan-actin antibody (1:1000; Cell Signaling, Danvers, MA). Band intensities were quantified using the Quantity One software and expressed as a percentage of control. At least five samples were analyzed from each group and results were represented as mean ± standard error of mean (SEM).
Immunohistochemistry and histology
Coronal sections of rat brain were immunostained with primary antibodies and fluorescence tagged secondary antibodies against phosphorylated NFH (pNFH, Covance SMI 31, 1:500; Cedarlane, Burlington, ON, Canada) or GFAP (1:1000; Invitrogen). Briefly, fixed brains were dehydrated in 30% sucrose (in 0.1 M phosphate buffer) and frozen at −80°C. Coronal sections containing the hippocampus (30 μM thickness) were processed for sequential staining with antibodies against pNFH and GFAP. At the end of the staining process, all slices were counter-stained with DAPI (Invitrogen) to view nuclei. Stained brain slices were viewed with a Quorum WaveFX laser scanning confocal microscope and images were captured with a Hamamatsu EM-CCD camera. Finally, captured images were stitched together using a module from MetaMorph to show structures of different brain regions. Areas of interest were then cropped to include approximately 500 μm sections for presentation. For histological analysis, Nissl staining was used. Coronal sections of brain containing cortex/hippocampus or cerebellum/brainstem (30 μm thickness) were mounted on Superfrost Plus glass slides, air dried, rehydrated, and stained with 0.02% Cresyl violet (Sigma Chemical Co.) in acetate buffer. The stained slides were then dehydrated through a series of alcohols, cleared in xylene, and cover slipped before being scanned with a slide scanning device (Nanozoomer Digital Slide Scanner, Olympus).
Biochemistry
Rat brain homogenate lysates were assayed for 2′,3′-cyclic nucleotide 3′-phosphohydrolase (CNPase) activity kinetically using a modification of the assay developed by Dreiling and Mattson. 26
Statistical analysis
Statistical differences were analyzed using two-way analysis of variance (ANOVA) and Sidak's multiple comparisons test.
Results
Figure 2 shows a schematic of the ABS with its accompanying instrumentation. The driver is filled with helium using a computer-controlled system. Gauges are placed along the length of the tube and measure static pressure at defined locations downstream of the diaphragm. All animals were at location 4280 mm. At this position, the pressure gauge is directly across from the animal mounting port. Figure 3 depicts the static and total pressures, as well as the static and total pressure impulses from 25 psi trials with and without an animal present in the tube. The trace labeled as the total pressure consists of an initial short-lived reflected pressure peak, followed by a slower exponential-like decay phase. The peak static overpressure is lower and the trace closely follows the Friedlander waveform. The presence of an animal in the tube caused a minor alteration of the static pressure trace in the decay phase. The initial perturbation (∼0.8 msec) is caused by a reflection of the incident wave off the head of the animal, which travels across the shock tube and is recorded by the pressure gauge. As the pressure wave further decays this region stabilizes and resembles the case where no animal is present. The impulse observed is not sensitive to these differences. Table 1 shows the high predictability and reproducibility of the nominal test static overpressures (15, 20, 25, and 30 psi), as well as the static pressure durations, impulses, and the derived dynamic pressures.

Representative pressure and impulse curves for a 25 psi static overpressure shot at test location 4280. The static overpressures closely follow the Friedlander waveform, with an instantaneous rise-time followed by an exponential decay. The positive phase duration time is approximately 7 msec, followed by a negative phase and a secondary shockwave. The total pressures show an immediate reflective peak, followed by an exponential-like decay. The static overpressures obtained with and without the presence of test animal superimpose each other, with the exception of perturbations in the decay phase of the peak at ∼0.8 msec (insert). These perturbations did not alter the static impulse. Color image is available online at
Dynamic pressures determined separately from animal studies.
Kinematic analysis
Representative examples of the tracking of head motion for the two restraint methods are shown in Figure 4 for the case of a 25 psi exposure. For head kinematic analysis, the eyes and base of the nose were used as landmarks thereby defining a triangle in three-dimensional space, with the nose being used as the origin. A “Top” and “Front” view is shown for each head restraint case, although due to the restrictions of the apparatus these views were aligned 40.5 degrees from each other rather than the preferred 90 degrees. Therefore, the dimensions shown are not absolute but relative to the view plane. Although the motion is shown in 2 msec time-steps, the tracking was achieved at high temporal resolution of 50 μsec intervals. The initial acceleration and subsequent arrest by the restraints in the first 10 msec were the critical aspects of the kinematics relevant to injury. It can be seen that the motions were qualitatively similar although differing in severity and extremes. In all cases the head was initially displaced somewhat uniformly downstream for the first millisecond of response. This displacement merged with increasing whipping action relative to the pivot point of the neck penetration through the wall of the simulator. The whipping action was not in a simple sagittal, coronal, or transverse plane relative to the head axes and was accompanied by a rotation around the longitudinal axis of the head. The looser Head Restraint 2 restraint allowed a much greater extent of motion compared with Head Restraint 1, with the head rotating almost entirely downstream predominantly in the transverse plane of the head. Although not shown in the temporal scale of Figure 4, the head was observed to be flattened up to 2 mm during the first half-millisecond by the initial shock-wave loading irrespective of the restraint.
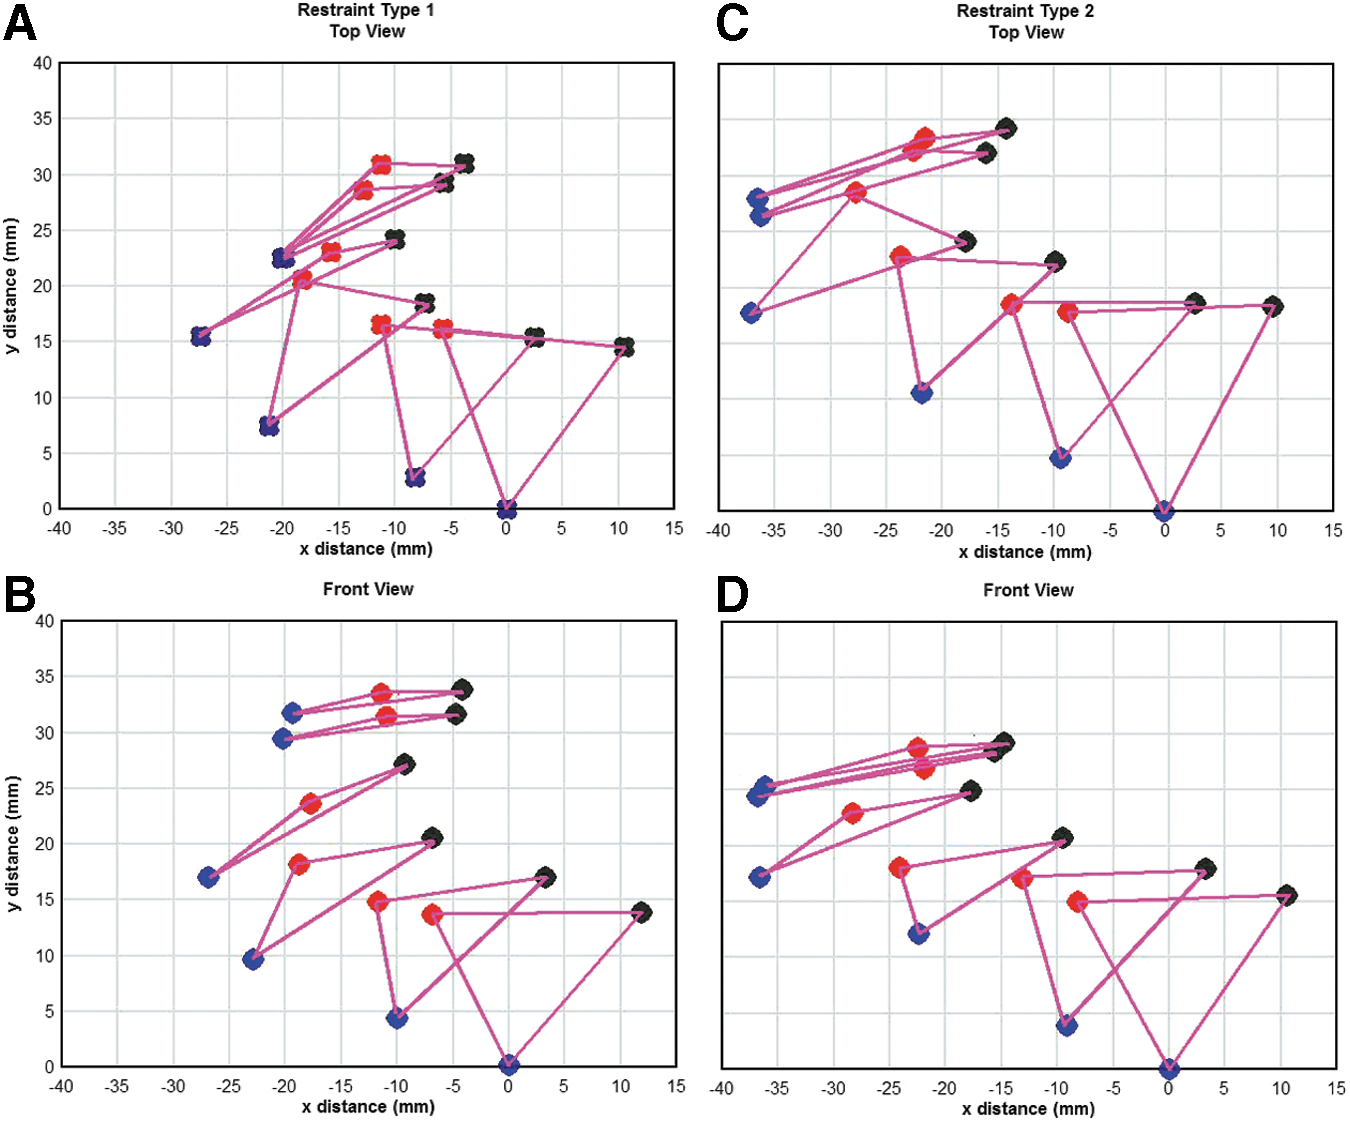
Comparison of head motion for Head Restraints 1 and 2. Representative tracking of head motion for the two head restraints are depicted for a 25 psi exposure. The eyes (red and black circles) and base of the nose (blue circles) are used as landmarks defining a triangle in three-dimensional space. The nose was used as the origin and head motion is tracked in 2 msec time-steps. The top
Animal response
Animals exposed to shockwaves in either head configuration showed no signs of gross injury to the head or brain, and no obvious signs of damage were observed upon microscopic examination of Nissl-stained brain sections (Head Restraint 1; Fig. 5). Time-to-awake/mobile from anesthesia values did not change statistically significantly from control (2–4 min), and time-to-normal rat behavior (i.e., grooming, exploratory behavior) values after shock also showed no significant differences between sham control and test animals, except for a slightly increased time to grooming for animals in Head Restraint 1 configuration at 30 psi. Although weight gains at either 1 or 7 days were not affected by exposure to shock in animals using Head Restraint 1, animals in Head Restraint 2 showed weight loss at 25 and 30 psi compared with controls on day one after blast.
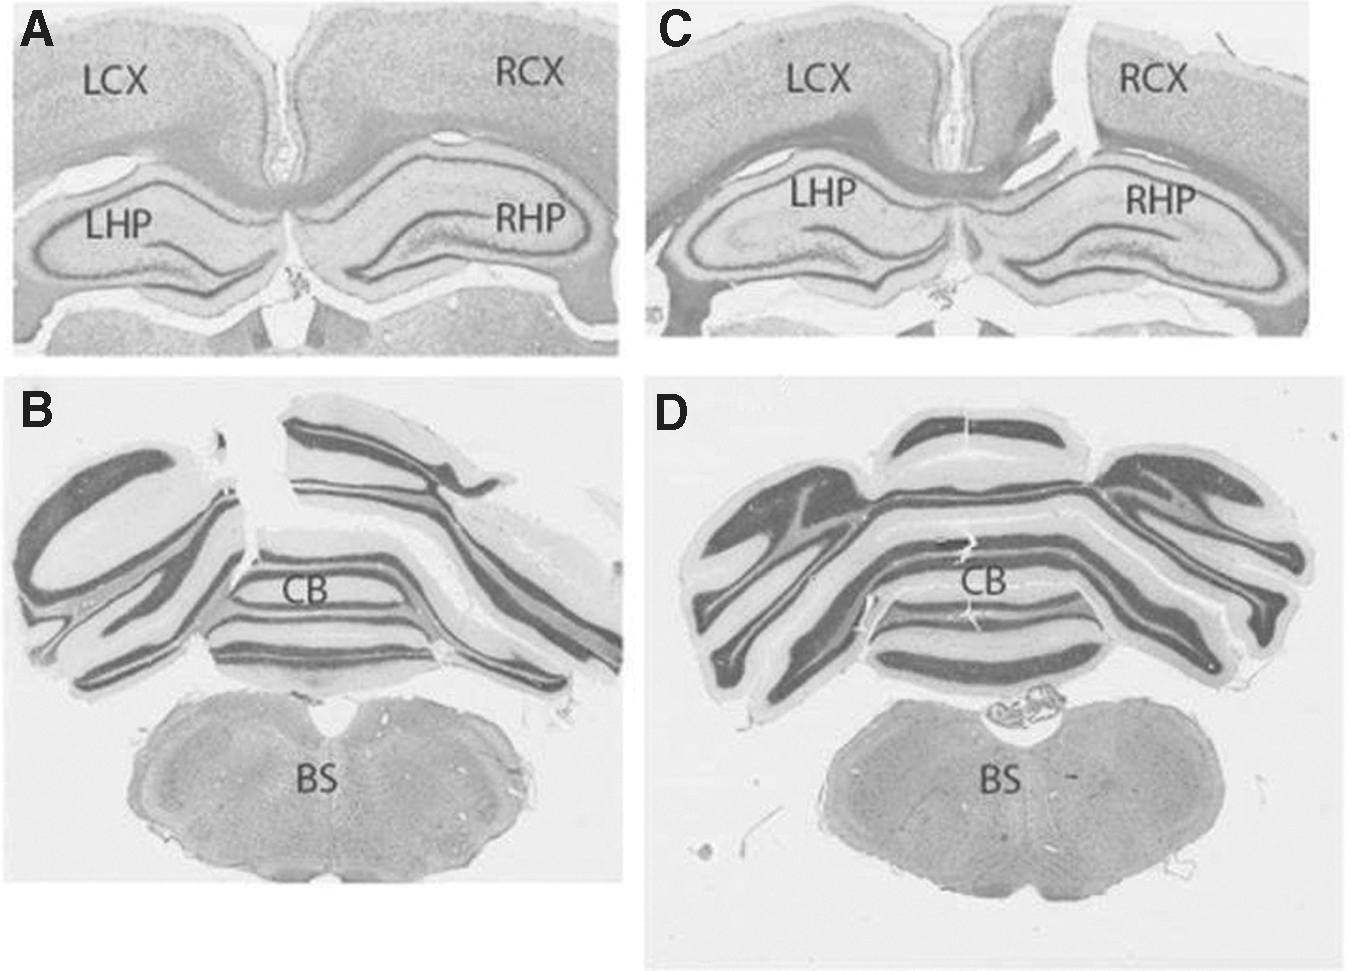
Nissl staining of rat brains 1 week after single-pulse shockwave exposure. Rats in Head Restraint 1 were head-only exposed to a single-pulse shockwave of 25 psi static overpressures. Nissl staining was performed on perfused rat brains 1 week after blast exposure. No obvious anatomical damage was observed in any area of the brain. The tissue breaks seen in
Molecular/biochemical assessment of injury
Both right and left hemispheres of hippocampus and cortex were isolated and assessed. However, few occasions occurred where right and left hemispheres were significantly statistically different (p < 0.05), these being: 1) Head Restraint 1: 1-day 20 psi hippocampus NFH values and 7-day 20 psi hippocampus GFAP values, and 2) Head Restraint 2: 30 psi hippocampus NFH and 25 psi cortex GFAP values. For the sake of clarity, left and right hemisphere data for cortex and hippocampus were therefore combined and assigned equal weight.
Brain NFH in animals exposed to shock while in Head Restraint 1was sensitive to blast showing declines in all brain areas by 1 day, with brainstem exhibiting a greater than 50% decrease from control values. By 7 days, NFH levels were generally slightly more decreased (Fig. 6A–D). Only cerebellar NFH was significantly decreased by 1 day in animals in Head Restraint 2 (Fig. 6E–H), with little change noted in other brain regions.
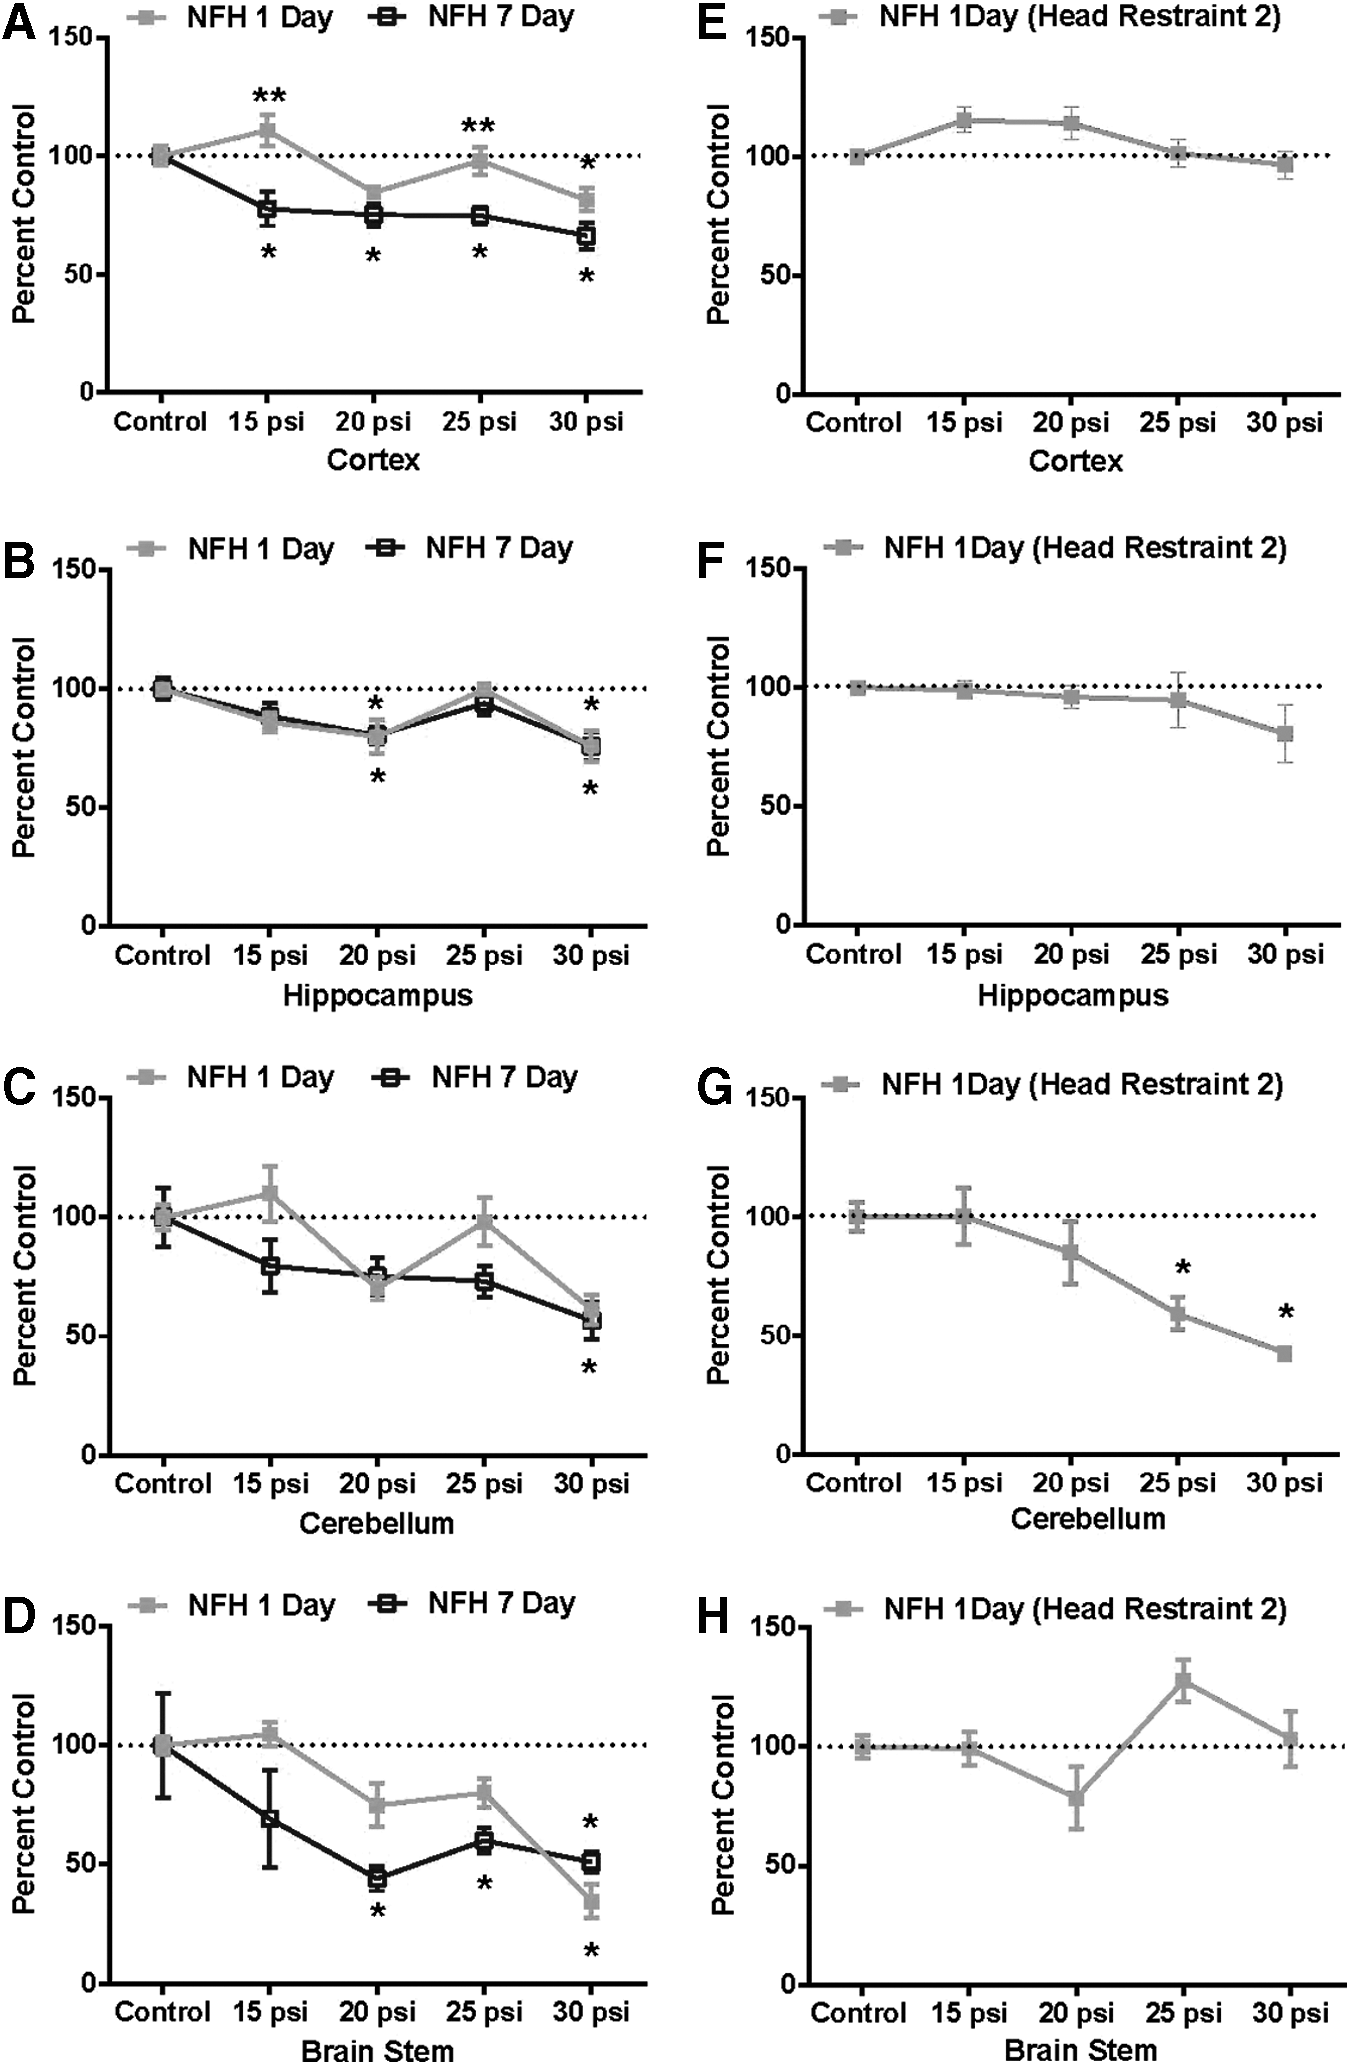
Effect of single-pulse shockwaves on neurofilament H (NFH) expression in rat brain using Head Restraint 1
The oligodendrocyte biomarker CNPase was assessed catalytically. Slight, but statistically significant declines in CNPase activity were detected at 15 to 25 psi by 7 days in all brain areas in those animals exposed to blast in Head Restraint 1 (Fig. 7A–D). However, in every case they returned to control values at 30 psi. In contrast, animals in Head Restraint 2 exposed to blast showed a significant elevation of CNPase activity by 1 day in every brain region except cortex (Fig. 7E–H).
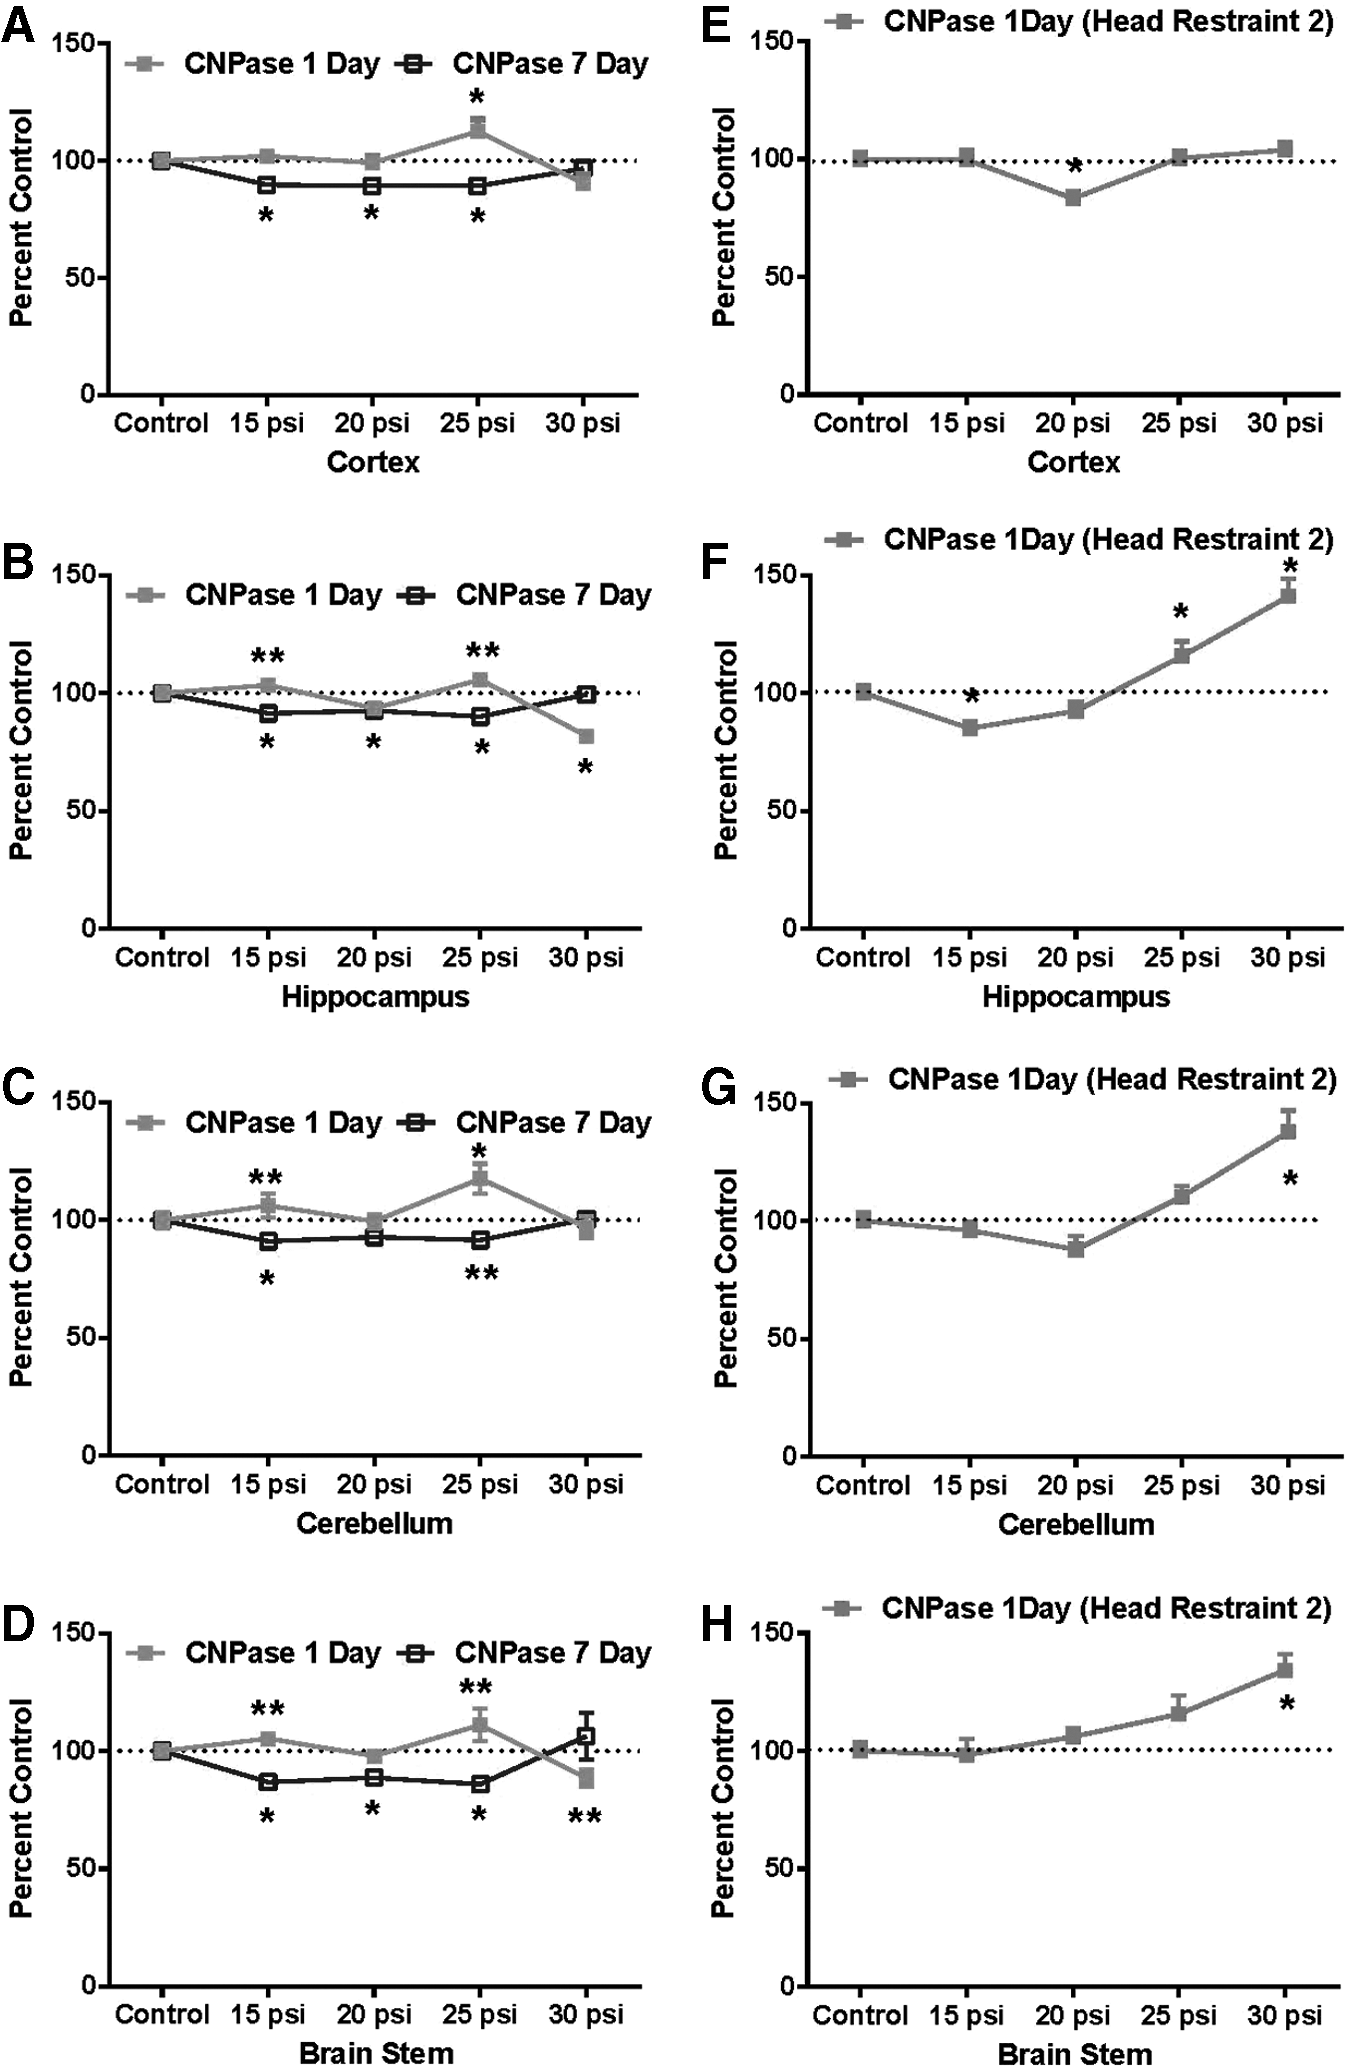
Effect of single-pulse shockwaves on CNPase activity expression in rat brain using Head Restraint 1
The effect of shockwave exposure on brain GFAP levels in animals in Head Restraint 1 was statistically significant from sham controls only in the cortex, where they were depressed at 1 day at 30 psi, and 7 days at 15 psi. No other differences were noted in any other instances, with the majority of the data points just below, or only marginally above the 100% control baseline (Fig. 8A–D). In very marked contrast, animals in Head Restraint 2 exposed to blast exhibited significant elevations in GFAP levels (200–400% compared with sham control values) in the cortex, hippocampus, and cerebellum at 25 and 30 psi by 1 day post-exposure, with only brainstem GFAP values showing no change (Fig. 8E–H).
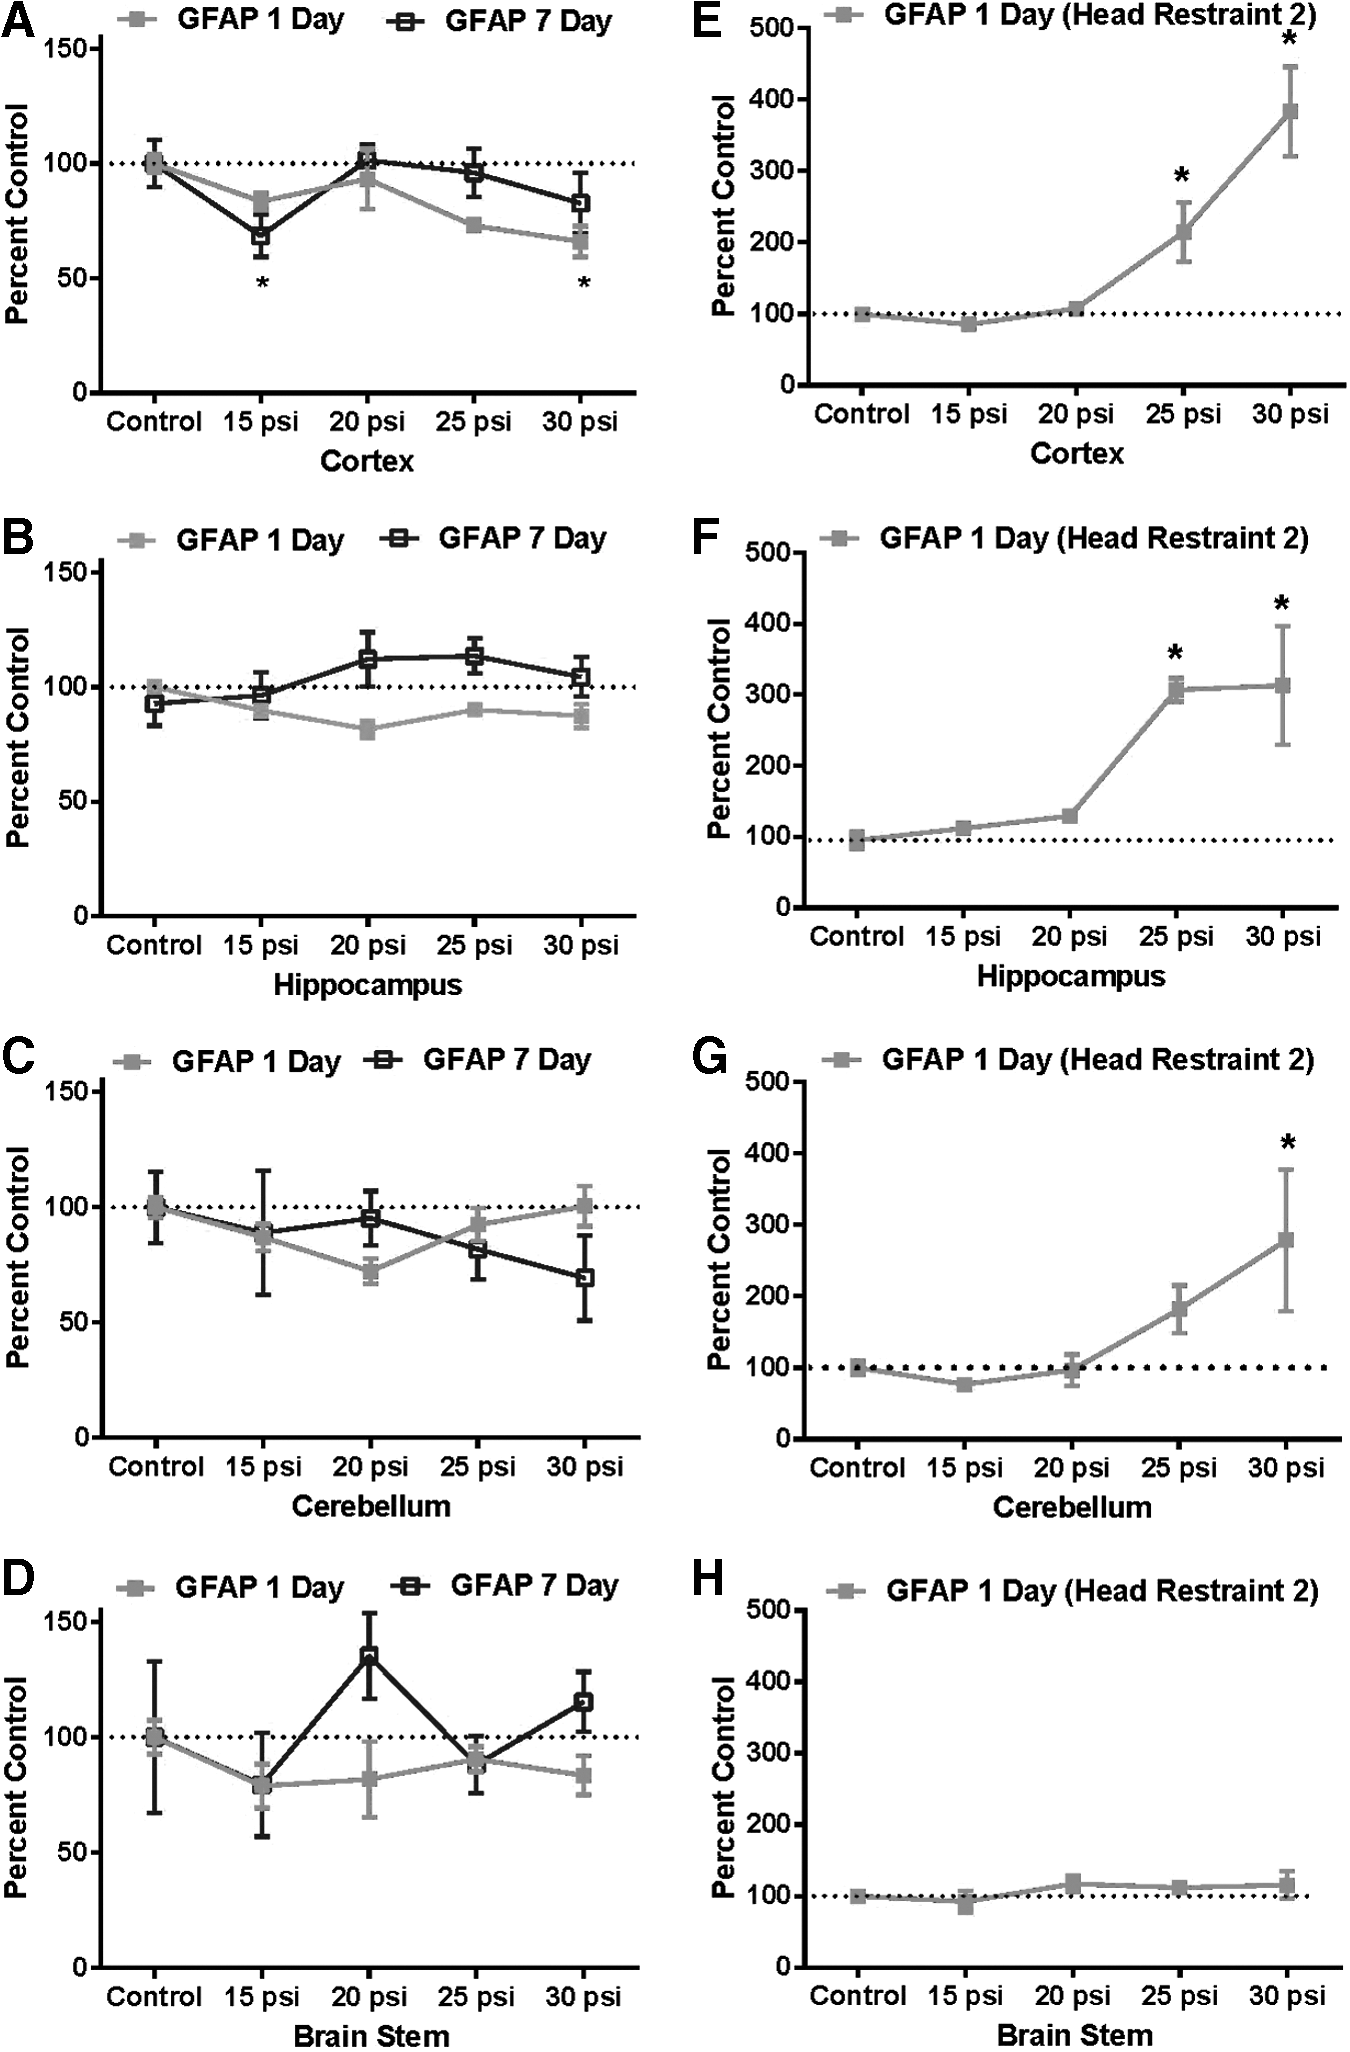
Effect of single-pulse shockwaves on glial fibrillary acidic protein (GFAP) expression in rat brain using Head Restraint
Figure 9 illustrates the effects of a 25 psi shockwave exposure (Head Restraint 1) on the phosphorylation of NFH at 1 and 7 days in the CA1 and DG regions of the hippocampus. At 1 day post-exposure, a robust elevation of pNFH is evident in both brain regions, that by 7 days post-exposure returned to baseline (Fig. 9; left-hand panels). Consistent with our earlier observations with Western blot analysis, no concomitant changes in GFAP levels were observed (Fig. 9, right-hand panels).
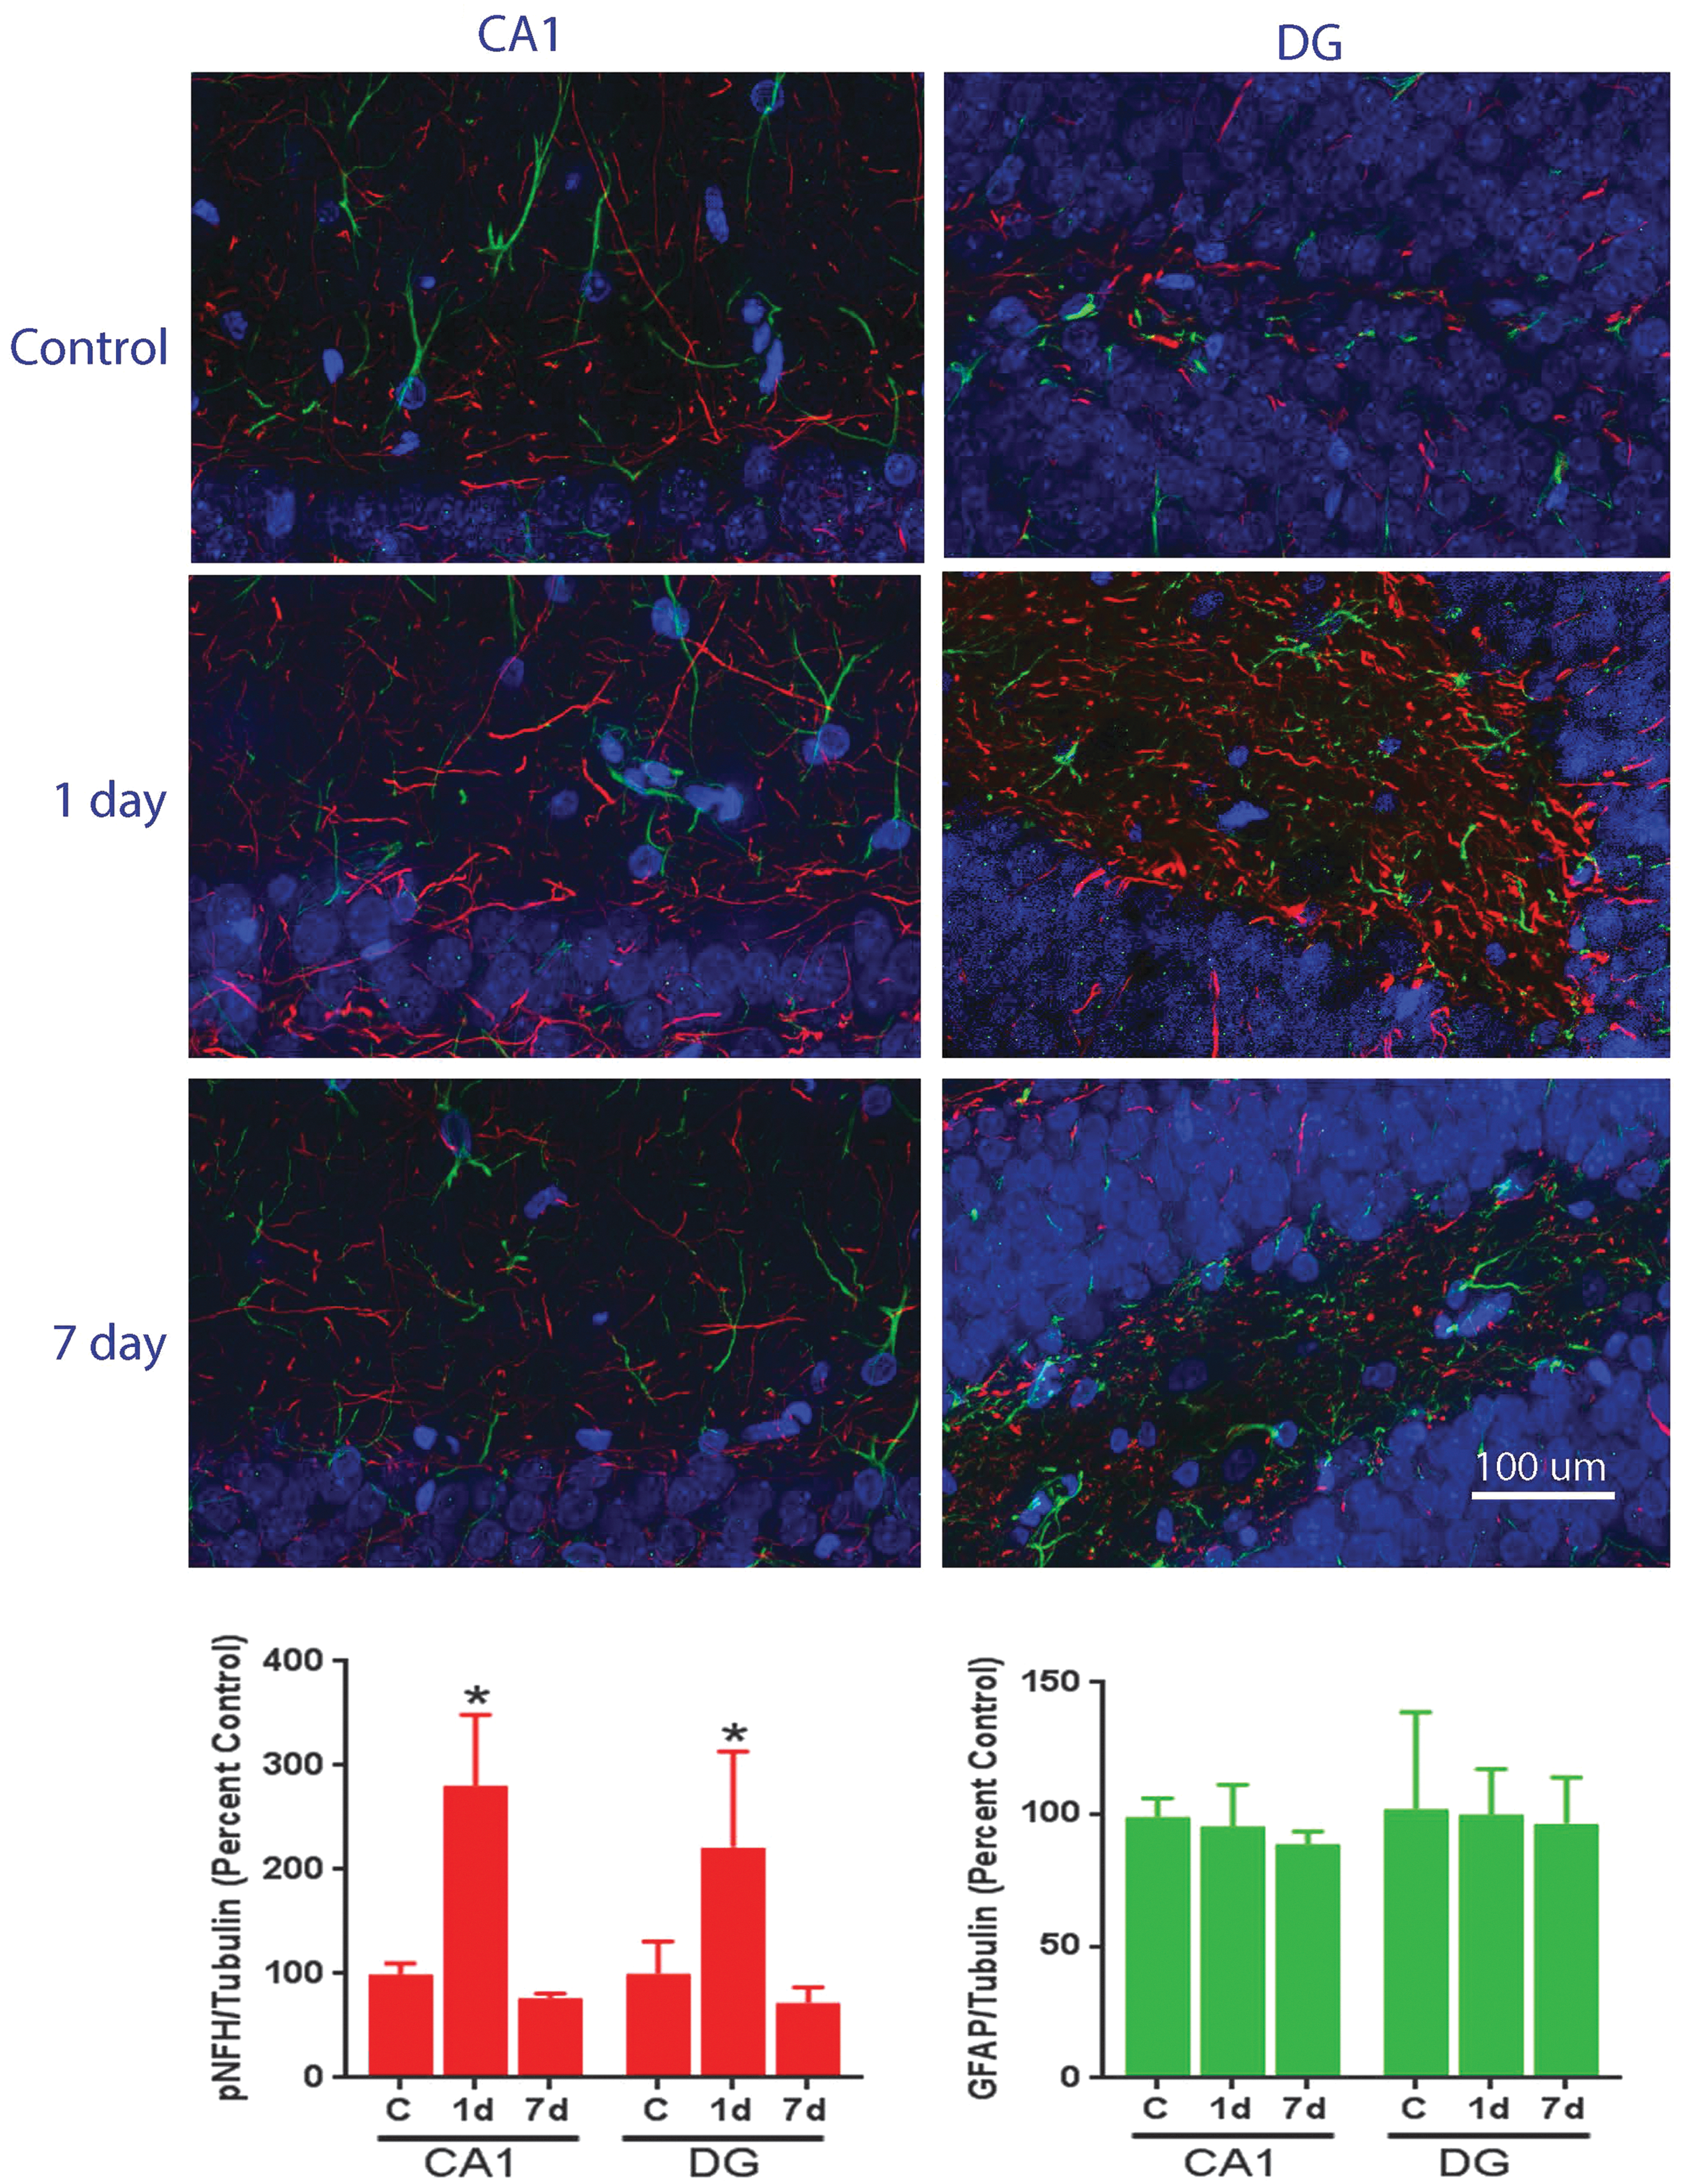
Effect of primary blast on the expression of phosphorylated neurofilament H (pNFH) and glial fibrillary acid protein (GFAP) in rat hippocampus 1 day and 7 days after a 25 psi primary shockwave exposure using Head Restraint 1. Top panel: Representative confocal microscopic images showing expression of pNFH (red) and GFAP (green) in both CA1 and dentate gyrus (DG) regions of the ipsilateral side of the hippocampus. Original magnification 400×. Bottom left panel: Quantification of pNFH fluorescence intensity, expressed as percentage of control. Bottom right panel: Quantification of GFAP fluorescence intensity, expressed as percentage of control. Values were mean ± SEM from three animals for each experimental group. *p < 0.05 compared with control. SEM, standard error of mean. Color image is available online at
Discussion
The study of PbTBI is a complex and multidisciplinary endeavor, and a bewildering array of test methods, devices, and model systems have been utilized in recent years. These include open-field blast, 27 –30 bazookas and howitzers, 31 long guns of different calibers, 31,32 modified commercial nail 33,34 and paint ball guns, 35 traditional blast tubes 20,31,36 –39 and shock tubes, 18,40 –45 as well as custom developed equipment based on compressed air 46 –48 or laser-ignited microexplosives. 49 These various approaches produce pressure wave profiles of widely varying shapes, components, overpressures, and durations. The shockwaves produced by these efforts are often reported simply as a target peak static overpressure, without mention of the dynamic pressure component of the shockwave, anomalies/artifacts within the shock-wave form, or other characteristics of the wave profile such as rarefaction waves. How the measurements were recorded is also seldom reported. Superimposed on this variable landscape, is a multiplicity of exposure conditions used by investigators utilizing traditional blast/shock tubes. Animals (most often mouse, rat, or swine) are exposed with or without torso protection, in either whole-body or head-only fashion, at varying sites within the shock tube, and with a significant number of laboratories also using endjet testing, where the target is placed immediately at, or just off the end of the tube. The end result is that a shock or blast exposure may be stated as having a given static overpressure in one system, yet possess dramatically different total shockwave energy and effect, than the same static overpressure cited for a different model system. Although all of these approaches have the potential to produce brain injury, it is not clear that these disparate methodologies are able to both simulate and importantly then isolate, the conditions necessary to produce the injury referred to as PbTBI. It is thus not surprising that it is difficult to make definitive conclusions concerning this injury, based on the different results arising from these model systems.
To ascertain whether low-level shockwaves affect the brain, it was necessary to develop the means with which to reproducibly simulate free-field blastwaves. In its simplest form, a laboratory shock tube is a straight pipe that is separated into a “driver” section charged with high-pressure gas, separated from the “driven” section by a frangible membrane. Rupture of the membrane results in the suddenly released high-pressure gas expanding and driving the shockwave into the test section. Although seemingly straightforward, the wave dynamics developed in this type of system do not intrinsically simulate free-field blast, 25 and in fact introduce very significant artifacts into the exposure. To address these concerns, an ABS was developed featuring a divergent-area driver to assist in shaping the waveform, and a tunable EWE used to prevent rarefaction wave artifacts (technical report in preparation). Using this ABS system, it was possible to generate highly reproducible single-pulse shockwaves simulating the static pressure conditions of free-field blast exposure, including a planar wave front, secondary shock, and negative phase. 25 The selected test static overpressures (15–30 psi) for this study were based on pressures that would be expected in low-level far-field blast, and the dynamic pressures measured at these overpressures were also consistent with those expected under these conditions. Contextually, the highest static overpressure used in these studies (30 psi), with its associated duration (∼7.2 msec) approximated that expected from a surface burst of 28.2 kg of C4 explosive 7.6 m from the target, and would cause less than 1% mortality as predicted from the Bowen and Modified Bowen curves. 50,51
In addition to the common problem of extrapolating animal data to the human condition, shock and blast studies also introduce scaling issues, factors that are as of yet, not worked out for comparing rodent blast exposures with those in humans, and introduce complex non-linear relationships. The objective of this study was very defined, and consisted solely of investigating whether a human-scaled single-pulse shockwave directly causes brain damage via head-only exposure of a rat. Underlying this work was the assumption that the brain tissue of a rat responds in a similar manner to that of a human to a shockwave, and specifically eliminates consideration of species/scaling differences in brain anatomy and cellular makeup, skull geometry/flexure, and thoracic input. Although the test conditions used in these studies were relevant to low-level human exposures, they were not scaled to a target the mass and size of a rat head. This is critical; although the effect of a pressure wave on rat brain tissue may be directly comparable to that of a human brain, the effects caused by dynamic pressures (or blast wind) on the heads of these two species definitely are not. The forces that dynamic pressures exert on a target are dependent on the impulse relative to the mass and surface area taking the load. Thus, whereas a given low-level shockwave may not induce significant visible effects on a human head, the same dynamic impulse from an identical waveform will cause violent acceleration/deceleration in a rat or mouse head (or body), often accompanied by extremely significant concussive effects of the head against proximal surfaces of the exposure device. These artifacts can become amplified with improper placement of the target using in-tube exposures, 52 –54 or when endjet testing is used. 20,52,54 Importantly, and specifically because of scaling issues, conclusions such as those from mouse studies, that claim that blast wind plays a major role in mild primary blast-injury in humans in far-field exposures 55 are not correct, casting doubt on any conclusions reached using this model.
Early experiments showed that violent head motion was indeed produced during shockwave exposures using this model system, and efforts were taken to develop a head restraint that would reduce these effects. Head Restraint 2 was largely an effort only to support the head of the anesthetized animal, as well as to prevent it from impacting the sidewalls of the ABS. Although successful in achieving these aims, simple visual inspection showed very significant whiplash effects and Head Restraint 1 was designed to minimize acceleration-deceleration, although there was still significant displacement of the head partially due to the high flexure of the rat skull. This restraint represents a compromise; a more rigid support, for example wire mesh contrecoup to the head, would exaggerate the crushing forces exerted by the dynamic pressures on the highly flexible rat head.
Direct comparison of the head motion in animals using the two head restraints and exposed to shockwaves well illustrated the effects of using netting to minimize head movement. Although technical difficulties (primarily video camera port placement) presented a less than ideal situation for kinematic analysis, the use of the eyes and nose to define a triangle in three-dimensional space enabled the tracking of the head movement. Only by using such a planar element could the full complex motion of the head be resolved. These landmarks will also allow subsequent estimates for the location of the brain center-of-gravity (CG). In humans, the accelerations associated with this location are used for injury predictors by methods such as the Head Injury Criterion (HIC) and Head Impact Power (HIP). Tracking of this triangular plane showed that the initial acceleration and subsequent arrest of the head by both restraints in the first 10 msec were the critical aspects of the kinematics relevant to injury.
The head motion using both restraints was qualitatively similar although differing in severity and extremes, with the looser Head Restraint 2 allowing significantly more motion and greater rotation than Head Restraint 1. The injury effects of using the two head restraints were compared using exposure of rats to blastwaves of 15 to 30 psi static overpressure with durations of ∼6.1 to 7.4 msec duration. This work showed no visible or measureable differences between sham controls and exposed animals using either restraint with respect to recovery from anesthetic/shock exposure, and no head trauma or gross brain pathology was apparent. Although there were no weight gain differences between control and test animals with Head Restraint 1, those animals using Head Restraint 2 and exposed to 25 and 30 psi shockwaves exhibited significant weight loss compared with sham control animals, indicating a more severe insult with the latter restraint. Consistent and pressure-related changes in brain function end-points were noted in most brain regions examined in animals using both restraints, which were generally maximal by 7 days (Head Restraint 1). These included changes in neurofilament levels, a neuronal end-point whose native and phosphorylated forms have been used as markers of axonal injury and TBI, 56 –58 as well as blast exposure. 36,46,59,60 At 1 day, differences were seen in NFH levels between rats exposed using the two head restraints, with NFH generally decreasing in all brain areas with Head Restraint 1, compared with only a cerebellar decrease in animals using Head Restraint 2. Western blot analysis showed strongly pressure-dependent decreases in NFH levels in most brain regions by 7 days in rats exposed using Head Restraint 1, indicating axonal degradation. A 25 psi exposure also caused pNFH expression to be transiently increased at 1 day, returning to control levels by 7 days (Head Restraint 1). Additional work is required to examine this effect, as well as to validate this end-point as a potential indicator of PbTBI severity.
Differences were also noted between the responses of animals using the two head restraints when examining the oligodendrocyte-specific marker CNPase. Although very little change was observed at 1 day after shockwave exposure with Head Restraint 1, significant elevations of CNPase were observed in the cortex, hippocampus, and brainstem of animals using Head Restraint 2. Modest decreases in CNPase activities were noted in animals using Head Restraint 1 by 7 days, suggesting that primary blast may also interrupt normal axonal myelination as a prelude to the neurofilament disruption seen above.
In contrast to the results obtained with CNPase and NFH, very dramatic differences in the response to blast were observed in animals using the two head restraints when GFAP, a highly specific serum biomarker for human TBI, 61,62 was examined. This astrocytic protein has also been extensively touted as a candidate biomarker for PbTBI. Numerous studies have detected elevated brain levels of GFAP after reported primary blast exposure in mice, 55,63 –65 rats, 44,45,47,48 and small (∼3 kg) monkeys, 27 and it has been suggested that GFAP, as a measure of injury-induced gliosis is a common response of brain to insult, regardless as to whether it is mechanical or blast in nature. 47,48
Our findings are in contrast to the above-cited studies and show that GFAP levels in all brain areas remain largely unchanged, or only slightly decreased at both 1 and 7 days post-blast exposure when the head motion is minimized. When the head is allowed greater freedom to move and experiences increased whipping action (as in Head Restraint 2), very significant elevation of GFAP occurred in most brain regions by 24 h. We interpret this GFAP elevation as an artifact of the animal exposure system, and not due to primary blast. These results are in agreement with two rodent studies located that utilized head-only exposure with head restraint. 35,41 A rat study 41 used a blast tube and exposed animals (head-only) to highly defined waveforms (∼35 psi) and found that GFAP staining was not prominently increased “although small numbers of reactive microglia were seen in areas of neuronal death.” 41 Heldt and coworkers 35 used a modified paint ball gun that utilized a mouse restraint that allowed little movement of the head and found that “50–60 psi” exposures did not induce elevated GFAP levels in the brain. No further detail was given as to the nature of the shockwaves produced in these studies. Studies in swine have detected astroglial activation 20,66 when the animals were exposed to blast inside complex environments such as inside an armored vehicle or within a room, but not when exposed using a traditional blast tube. However, these reports provided little detail as to the actual blast exposure conditions (which appear very severe), making further interpretation difficult. Taken together, these results suggest that gliosis is not induced by the effects of a primary blast wave on the brain, and that studies identifying elevated GFAP levels in rodents and small monkeys may be due to exaggerated dynamic forces on the head or body due to scaling artifacts introduced by the animal model system. This finding highlights the importance of body armor or shielding, and also sheds doubt on the use of serum or cerebral spinal fluid GFAP levels as a reliable indicator of brain injury due to primary blast.
The recent Iraq and Afghanistan wars have resulted in an unprecedented number of blast-induced casualties exhibiting TBI, ranging from severe open head wounds to the more controversial and insidious injury referred to as mild TBI (mTBI). As a result, a great deal of recent work has investigated bTBI, much of it focusing on primary blast as a potential determinant of mTBI. Although virtually all animal studies have reported damage due to primary blast, the interpretation of these studies is often unclear or impossible due to difficulties in ascertaining the actual and complete exposure conditions. Conclusions based on incomplete information or erroneous interpretation of the actual insult have the potential to result in outcomes that have adverse practical ramifications to the warfighter, in terms of both the development of personal protection and medical treatments. The ABS technology used in this work reproducibly generates single-pulse shockwaves that closely simulate the static and dynamic pressure characteristics of free-field blast. Individuals exposed to blast seldom experience this kind of insult in isolation; reflecting surfaces are usually a complicating factor and other facets of blast (secondary, tertiary, and quaternary) often play a major role in the resultant injury. 1,11 However, an understanding of the basic mechanisms of PbTBI can most easily be obtained by reducing the insult to its simplest form. Not surprisingly, the “injury” demonstrated in this rat model of primary blast is relatively subtle. Nevertheless, this work provides compelling evidence that primary blast directly causes changes in the brain at early time-points, and that brain GFAP levels are not elevated. Further work is necessary using this model to demonstrate the biochemical and functional deficits caused by exposure to single and repetitive primary blast at early and late time-points, the role of shock-wave duration in resultant injury, and the relationship of these types of insult to the mTBI seen in blast-exposed casualties.
Footnotes
Author Disclosure Statement
No competing financial interests exist.