




Abstract
Duration of post-traumatic amnesia (PTA) has emerged as a strong measure of injury severity after traumatic brain injury (TBI). Despite the growing international adoption of this measure, there remains a lack of consistency in the way in which PTA duration is used to classify severity of injury. This study aimed to establish the classification of PTA that would best predict functional or productivity outcomes. We conducted a cohort study of 1041 persons recruited from inpatient admissions to a TBI rehabilitation center between 1985 and 2013. Participants had a primary diagnosis of TBI, emerged from PTA before discharge from inpatient hospital, and engaged in productive activities before injury. Eight models that classify duration of PTA were evaluated—six that were based on the literature and two that were statistically driven. Models were assessed using area under the receiver operating characteristic curve (AUC) as well as model-based Akaike Information Criterion (AIC) and Bayesian Information Criterion (BIC) statistics. All categorization models showed longer PTA to be associated with a greater likelihood of being nonproductive at 1 year after TBI. Classification systems with a greater number of categories performed better than two-category systems. The dimensional (continuous) form of PTA resulted in the greatest AUC, and lowest AIC as well as BIC, of the classification systems examined. This finding indicates that the greatest accuracy in prognosis is likely to be achieved using PTA as a continuous variable. This enables the probability of productive outcomes to be estimated with far greater precision than that possible using a classification system. Categorizing PTA to classify severity of injury may be reducing the precision with which clinicians can plan the treatment of patients after TBI.
Introduction
T
Measurement of injury severity is vital after TBI because it is considered to be one of the strongest predictors of outcome. Several indices are used to assess severity of injury, including length of coma (LOC), the Glasgow Coma Scale (GCS), and duration of post-traumatic amnesia (PTA). 2,3 LOC has proven to be a less reliable index because of differences in its measurement. The GCS has traditionally been most widely used as the gold-standard measure, associated with in-hospital mortality and functional outcome. 4
Duration of PTA has emerged as another strong measure of injury severity, representing the length of time from injury until return of orientation and continuous memory for events. 5,6 PTA duration has been associated with presence or extent of skull fracture, intracranial hemorrhage, raised intracranial pressure, residual neurological deficits, extent of neuropathology, as well as with longer-term functional outcomes and return to employment. 6 –9 Recent studies investigating persons surviving to discharge from hospital provide support for PTA as a stronger predictor of longer-term functional outcome, return to employment, and cognitive impairment, compared with GCS or LOC. 10 –12 It also accounts for more variance in outcome than sociodemographic factors. 13,14
The measurement of PTA has evolved substantially, from retrospective estimates relying on patient responses regarding their first memory after emergence from PTA to the development of scales that objectively, and prospectively, monitor depth and recovery of PTA. 15 PTA is generally measured in terms of minutes, hours, or days, dating from the moment of injury until the person is orientated in person and place, while also being able to lay down new memories. 16
Several different classification systems have been proposed in an attempt to characterize injury severity. Russell and Smith 16 and Jennett and Teasdale 17 proposed that PTA below 5 min should be considered very mild; 5–60 min, mild; 1–24 h, moderate; 1–7 days, severe; 1–4 weeks, very severe, and more than 4 weeks considered extremely severe TBI. The above researchers assessed PTA by interviewing patients retrospectively. This classification system, however, was based on clinical observations of patient cohorts, rather than statistical analysis of outcome data.
Several recent studies have used cohorts from the National Institute on Disability and Rehabilitation Research funded TBI Model Systems. These studies documented PTA duration exceeding 24 h, assessed prospectively at least three times weekly using either the Galveston Orientation and Amnesia Test (GOAT) or Orientation-Log (O-Log). End of PTA was defined as the first of the two consecutive days of GOAT >75 or O-Log >24 scores or 1 day after hospital discharge.
Walker and associates 12 reported that the probability of Good Recovery (the definition including return to previous employment capacity) on the Glasgow Outcome Scale at 1 year after injury is less than 10% for persons with PTA duration of 56 days or longer. Brown and colleagues 10 identified a PTA duration of 48 days to be indicative of poor employment outcomes at 1 year after injury. The same group showed that at 1 year after injury, competitive employment was predicted by PTA extending into week four after injury. 18
In addition, Nakase-Richardson and coworkers 19 found that patients with TBI differed significantly in productivity at 1 year when classified according to the Mississippi PTA intervals. The latter define moderate severity as PTA duration between 0 and 14 days; moderate severe, 15 to 28 days; severe, 29 to 70 days; and very severe as PTA duration longer than 70 days. In these studies, return to productivity/employment was defined as being a full-time or part-time student, competitively employed or taking care of house or family.
Categorization of continuous, or dimensional, variables such as duration of PTA is commonly performed in medical research (e.g., diabetes, depression, body mass index, waist-hip-ratio, systolic and diastolic blood pressure) in an effort to simplify both clinical interpretation and statistical analysis. In practice, however, such categorization often leads to a loss of statistical power. Alternatively, in circumstances involving possible confounding variables such as age, categorization may result in an increase in type I errors or false alarms in rejecting the null hypothesis. 20
Categorization may also affect interpretation; for example a recent Australian study of invitation to an outpatient cardiac rehabilitation program by age, showed very different effects depending on whether age was categorized into 5- or 10-year intervals. 21 Although the authors of recent applied statistical texts continue to discourage the use of categorization, it is still often used in clinical research and practice. 22,23
To directly ascertain the effects of categorizing PTA, the present study compared different methods of categorizing PTA with methods that retain the duration of PTA as a dimensional variable. The aims of the study were twofold: first, to establish the best classification of PTA that would predict functional or productivity outcomes, and second, to compare the various classification systems with a simple dimensional variable approach based on standard logistic regression.
Methods
Study population and design
The study was approved by the Human Ethics Committees of Epworth Healthcare and Monash University. Participants were recruited as part of a longitudinal head injury outcome study from consecutive inpatient admissions to a TBI rehabilitation center in the context of a no-fault accident compensation system administered by the Transport Accident Commission (TAC) or Worksafe, which are state agencies to help avoid and manage compensation claims after injury. Patients were admitted between 1985 and July 2013. Inclusion criteria included a primary diagnosis of nonpenetrating TBI with emergence from PTA, age at injury greater than 16 years, and pre-injury engagement in productive employment or study. Exclusion criteria included no recorded productivity status at either pre-morbid or 1-year post-accident time points, no recorded duration of PTA, permanent confusional or amnestic state, or not being engaged in productive activities before injury.
Procedure
Patient demographic and injury-related information (sex, age at injury, number of years of education, marital status, living location, pre-morbid productivity, pre-morbid medical history, injury cause, inpatient CT scan results, and physical injuries) was retrieved from medical files at hospital admission. One-year productivity outcomes were collected at follow-up for the longitudinal study.
Assessment of productivity status
Participants pre-morbidly unemployed or not currently in the labor force were classified as nonproductive. Participants who were classified as apprentices, full-time or part-time employees, or as secondary or tertiary students were classified as productive. One-year productivity status was captured on a structured outcome questionnaire. Persons classified as medically/surgically delayed, not in the labor force, engaged in work trial, work conditioning or retraining, unemployed, or nonvocational were categorized as nonproductive. Participants were considered as productive if they were employed in their previous position or an alternative position full-time or part-time.
Assessment of PTA duration
The Westmead Post-Traumatic Amnesia Scale (WPTAS) 24 is a 12-item measure that assesses orientation for person, place, and time, as well as anterograde memory. The WPTAS was administered daily by a neuropsychologist until patients had emerged from PTA, after having answered all items correctly on 3 consecutive days, or otherwise cleared by a neuropsychologist.
PTA classification systems
Eight PTA classification systems were compared—six that were previously proposed in the literature and two that were derived statistically using the WPTAS data collected in the current study. The classification models recommended in the literature were those of: Russell 16 /Jennett, 17 Walker and associates, 12 Brown and colleagues, 10 Brown and coworkers, 18 Mississippi, 19 and Collapsed Mississippi. 19 Russell 16 and Jennett 17 categorized PTA into <1 day, 1–7 days, >7–28 days, >28 days. In predicting Good Recovery on the Glasgow Outcome Scale (GOS), Walker and colleagues 12 categorized PTA into 0–56 days and >56 days. In predicting return to productivity defined as full- or part-time work or study or home duties, Brown and associates 10 categorized PTA into 0–48 days and >48 days; Brown and coworkers 18 categorized PTA into 0–28 days and >28 days; the Mississippi 19 system categorized PTA into 0–14 days, 15–28 days, 29–70 days, >70 days; and the Collapsed Mississippi 19 system categorizes PTA into 0–14 days, 15–28 days, >28 days.
In these studies, PTA was assessed either using the GOAT, O-Log, or retrospective file audit, with PTA estimated as length of stay plus 1 day in cases still in PTA on discharge. Two other classifications were examined in the current study that were derived through statistical analysis using the WPTAS data collected in the current study. These were Classification and Regression Trees (CART), 25,26 and a simple logistic regression approach that left duration of PTA in its continuous/dimensional form. These methods are explained further below.
Statistical analysis
Statistical analyses were conducted using Stata Version 12 27 and CART Version 7. 25 The original dataset was randomly divided into a learning sample comprising 75% of observations used to develop the statistically derived PTA classification models, and a holdout sample of 25% of observations, used to test the models. PTA classification schema were initially developed using the learning dataset and cross-validated on the holdout dataset.
Logistic regression was used to predict productivity group membership at 1 year using PTA in its continuous or dimensional form. CART is a classification tree approach that divides dimensional variables into binary splits at each stage of the tree-growing process, and then “prunes” the tree using cross-validation. 26 CART first grows a decision tree until the resulting subgroups are too small for further analysis (generally five observations or less). This tree is then pruned, based on how well the performance of the tree generalizes to other data. Performance is assessed using 10-fold cross-validation. 26 The dataset is first divided into 10 equally sized subsets, trees are then constructed using nine subsets, and then tested for generality on the excluded subset, with each subset being excluded in turn. CART has been used in medical research for many years 28 and has previously been used in the analysis of PTA data by Brown and associates. 10
The appropriateness of each PTA classification and regression model was assessed using the area under the receiver operating characteristic (ROC) curve, 29 calculated using Stata version 12. Areas under the ROC for different models were calculated using the nonparametric method of DeLong and colleagues. 30 The Akaike Information Criterion (AIC) and Bayesian Information Criterion (BIC) information criteria, which attempt to balance model complexity (e.g., number of categories) with model performance, were used to compare each of the models with one another. 31 PTA classification systems were evaluated based on their area under the curve (AUC), with greater values representing overall better classifications, as well as their associated AIC and BIC model statistics, with lower values representing better model performance balanced against the number of parameters of the model (e.g., the number of categories). The BIC also takes the number of observations into account. 31
Results
Patient characteristics
Of the 1461 patients admitted between 1985 and July 2013, 279 were engaged in nonproductive activities before injury, 23 were aged under 16 years, 89 had no recorded pre-morbid or 1-year productivity status, 25 had no recorded duration of PTA, and 3 participants had unresolved PTA. The study sample comprised the remaining 1041 participants (Table 1). Of these, 455 (43.7%) were classified as nonproductive at 12 months post-injury and 586 (56.3%) as productive.
SD, standard deviation; PTA, post-traumatic amnesia.
Nonproductive and productive status refers to participant productivity status at 1 year after TBI.
Refers to persons who have moderate or severe physical injuries defined as injuries resulting in a fracture or necessitating surgery.
PTA classifications
A minority of participants in the current study had a PTA duration less than a day (Table 2). Conversely, only 5.7% of the sample had a PTA exceeding 70 days. All classification systems showed a greater likelihood of being nonproductive at 12 months post-injury with greater length of PTA.
PTA, post-traumatic amnesia.
Presents percentage of persons who are categorized into PTA bands depending on classification system.
Presents percentage of persons nonproductive at 12-months after injury within each categorization band.
Definition of nonproductivity and productivity used in the current study differed in relation to previous studies.
PTA classification systems derived from literature or through statistical methods.
Russell/Jennett classification derived from Russell 16 and Jennett 17 ; Walker classification obtained from Walker and associates 12 ; Brown 2005 classification obtained from Brown and colleagues 10 ; Brown (2010) classification obtained from Brown and coworkers 18 ; Mississippi and Collapsed Mississippi classifications obtained from Nakase-Richardson and associates. 19
The dimensional (continuous) form of PTA, analyzed using logistic regression, obtained the greatest AUC of the selection of classification systems (Fig. 1). This was the case in both the learning and holdout datasets. In the learning dataset, dimensional PTA performed significantly better (as measured using AUC) than all other classification systems. Classification systems with a greater number of categories, including the Russell/Jennett, Mississippi, and Collapsed Mississippi, performed better than those with only two categories. Interestingly, the CART statistically derived approach found a two-category solution, below or above 30.5 days of PTA. Although a simple binary classification, this system did not perform as well as systems with a greater number of categories. Similar AUCs were observed in the holdout dataset with the reduced sample size. The only change was in the Russell/Jennett classification, which displayed a poorer AUC. Dimensional PTA achieved a statistically superior AUC compared with the Russell/Jennett, CART, Brown and associates 2010, 18 and Walker and colleagues 12 classifications. All other classifications remained in the same ordering, based on AUC, between the learning and holdout samples.
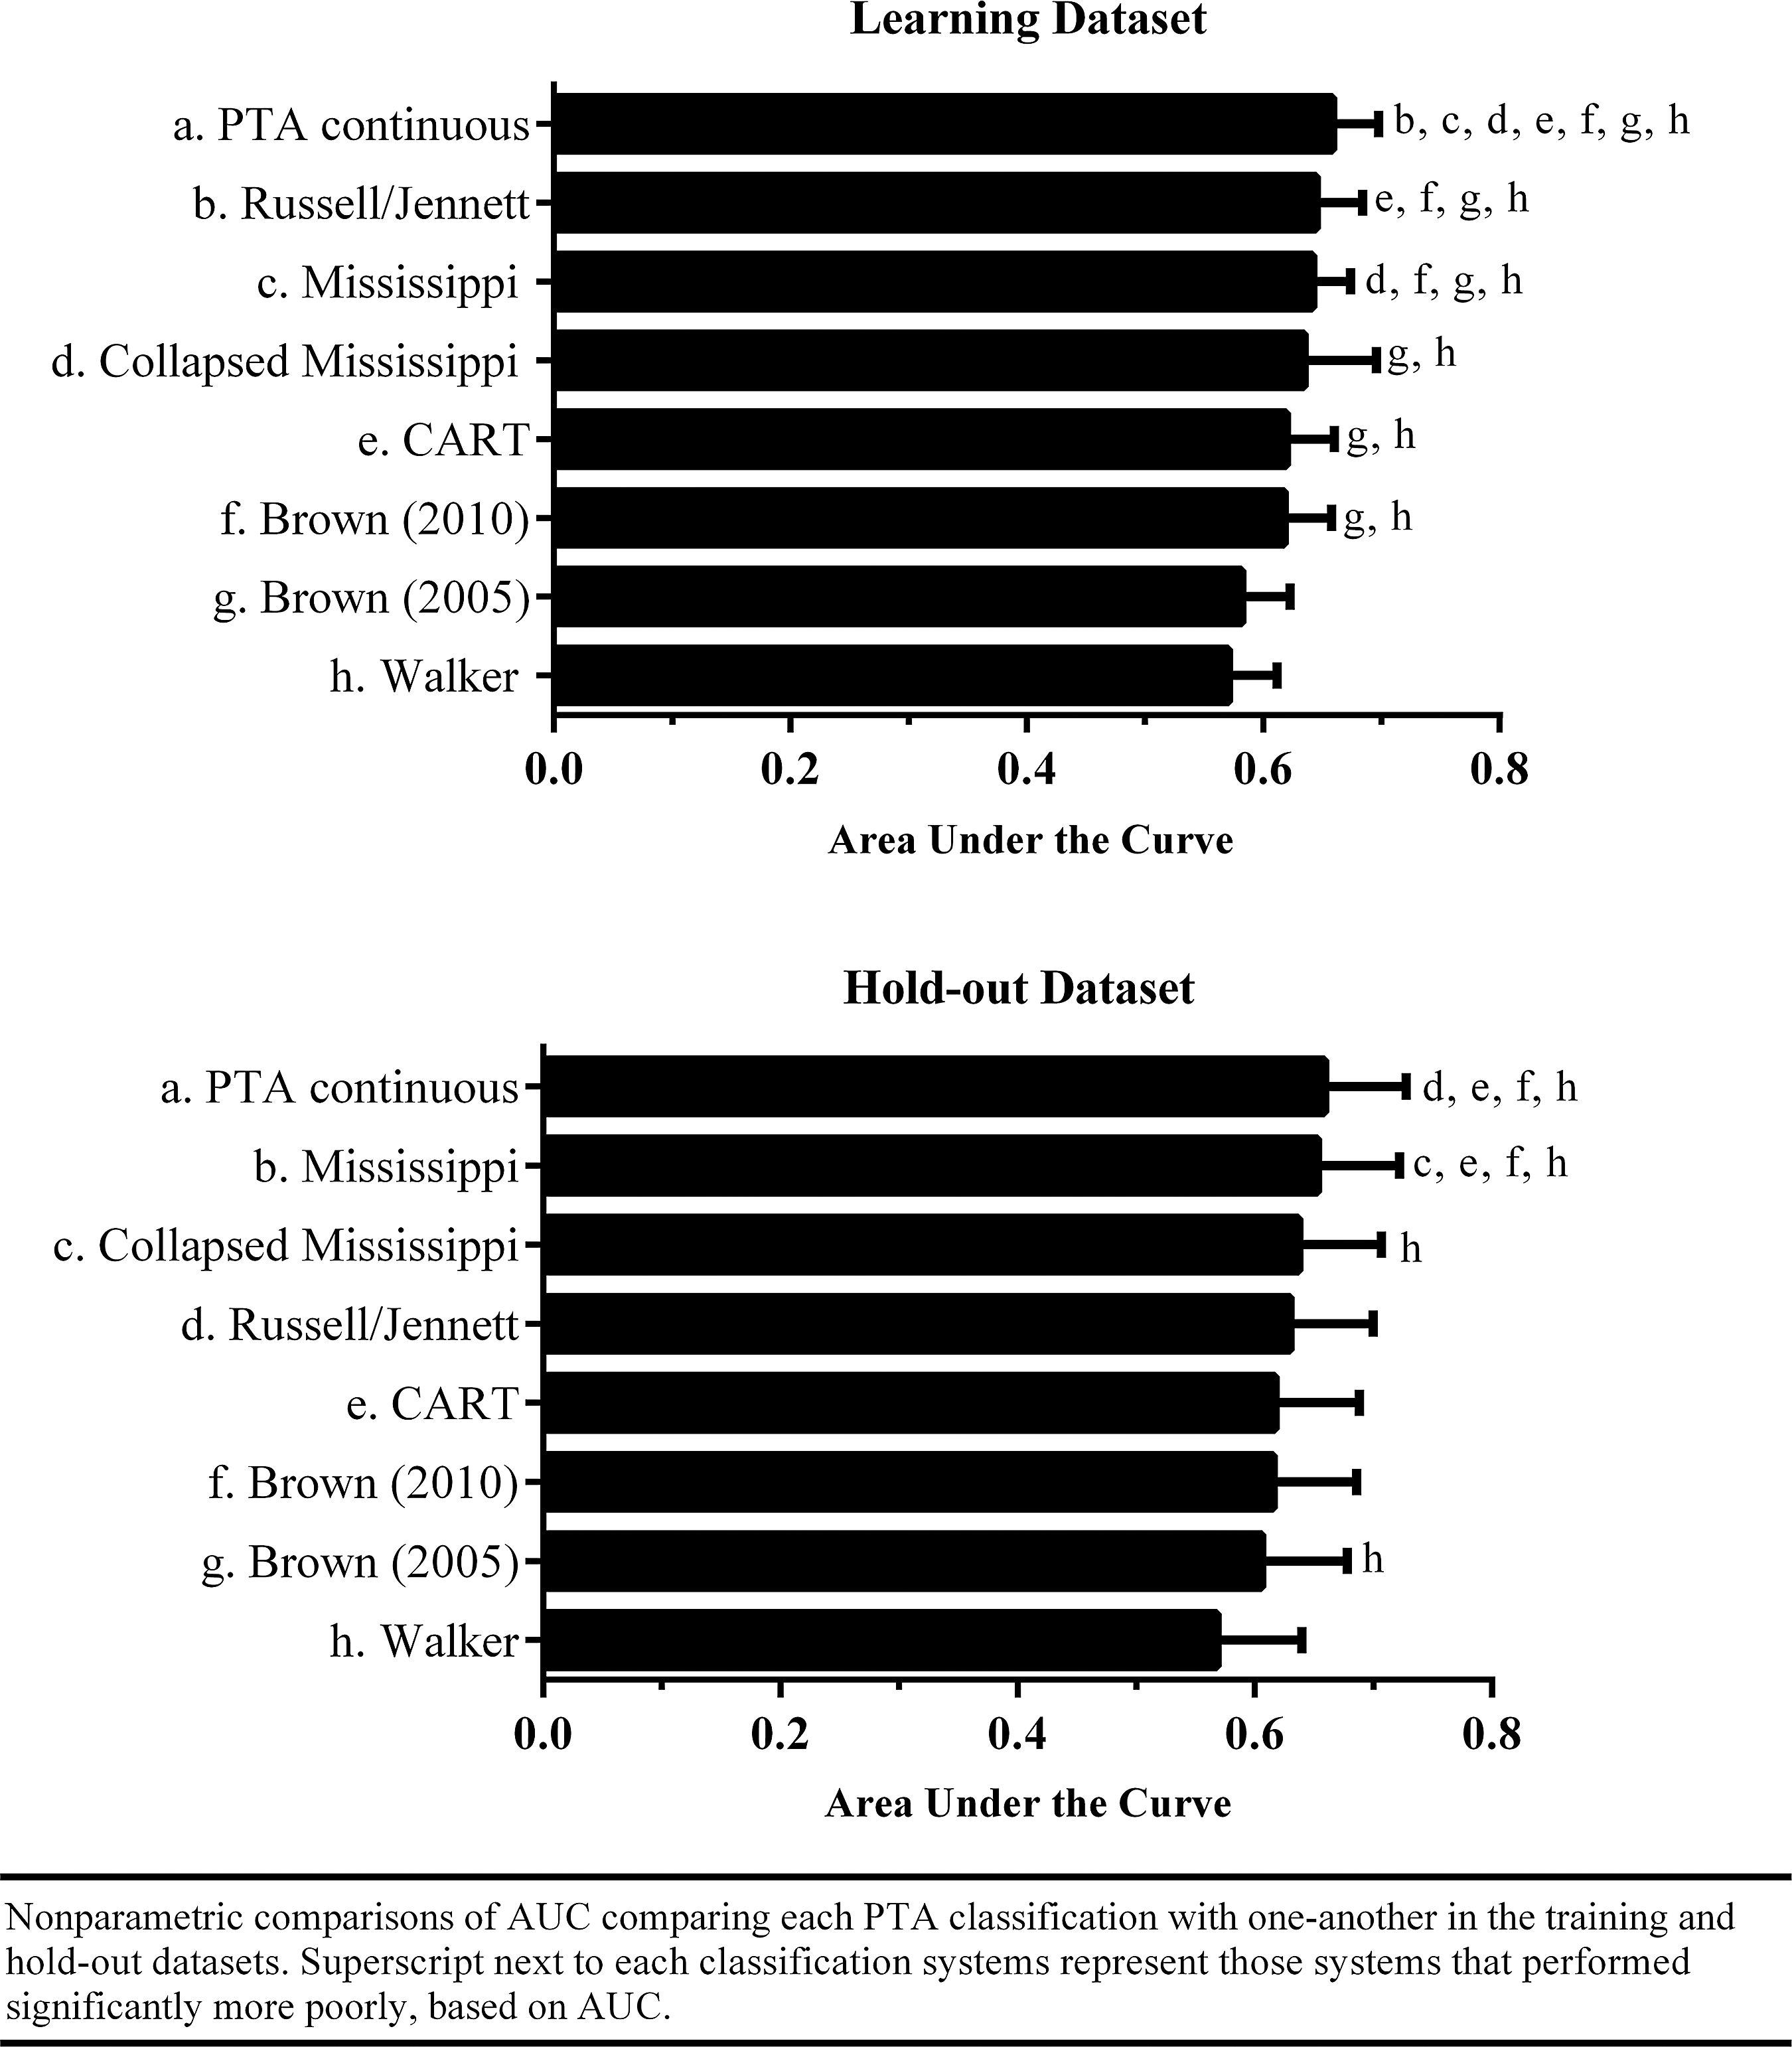
Nonparametric comparisons of area under the curve (AUC) comparing each post-traumatic amnesia (PTA) classification with one another in the training and holdout datasets. Superscript next to each classification systems represent those systems that performed significantly more poorly, based on AUC.
The relationship between the probability of being nonproductive at 1 year after injury and duration of PTA appears to be monotonic (increasing), if not linear (Fig. 2, continuous PTA panel). On the other hand, it is evident that artificial constraints may be imposed by categorization of PTA. For example, leaving PTA as a dimensional variable suggests that persons with PTA duration between 29 and 70 days have a probability of being nonproductive of 43% to 70%, respectively. Conversely, a PTA duration between 29 and 70 on the Mississippi scale would indicate that all persons with a duration between 29 and 70 days have a 57% chance of being nonproductive at 1 year after injury, when assessed by logistic regression using the Mississippi scale as a categorical predictor. A greater number of cutoffs were found to increase the AUC. Conversely, the Walker and Brown 2010 classifications, having only a single cutoff, were found to perform the worst, with lower performance than the single cutoff CART decision rule.
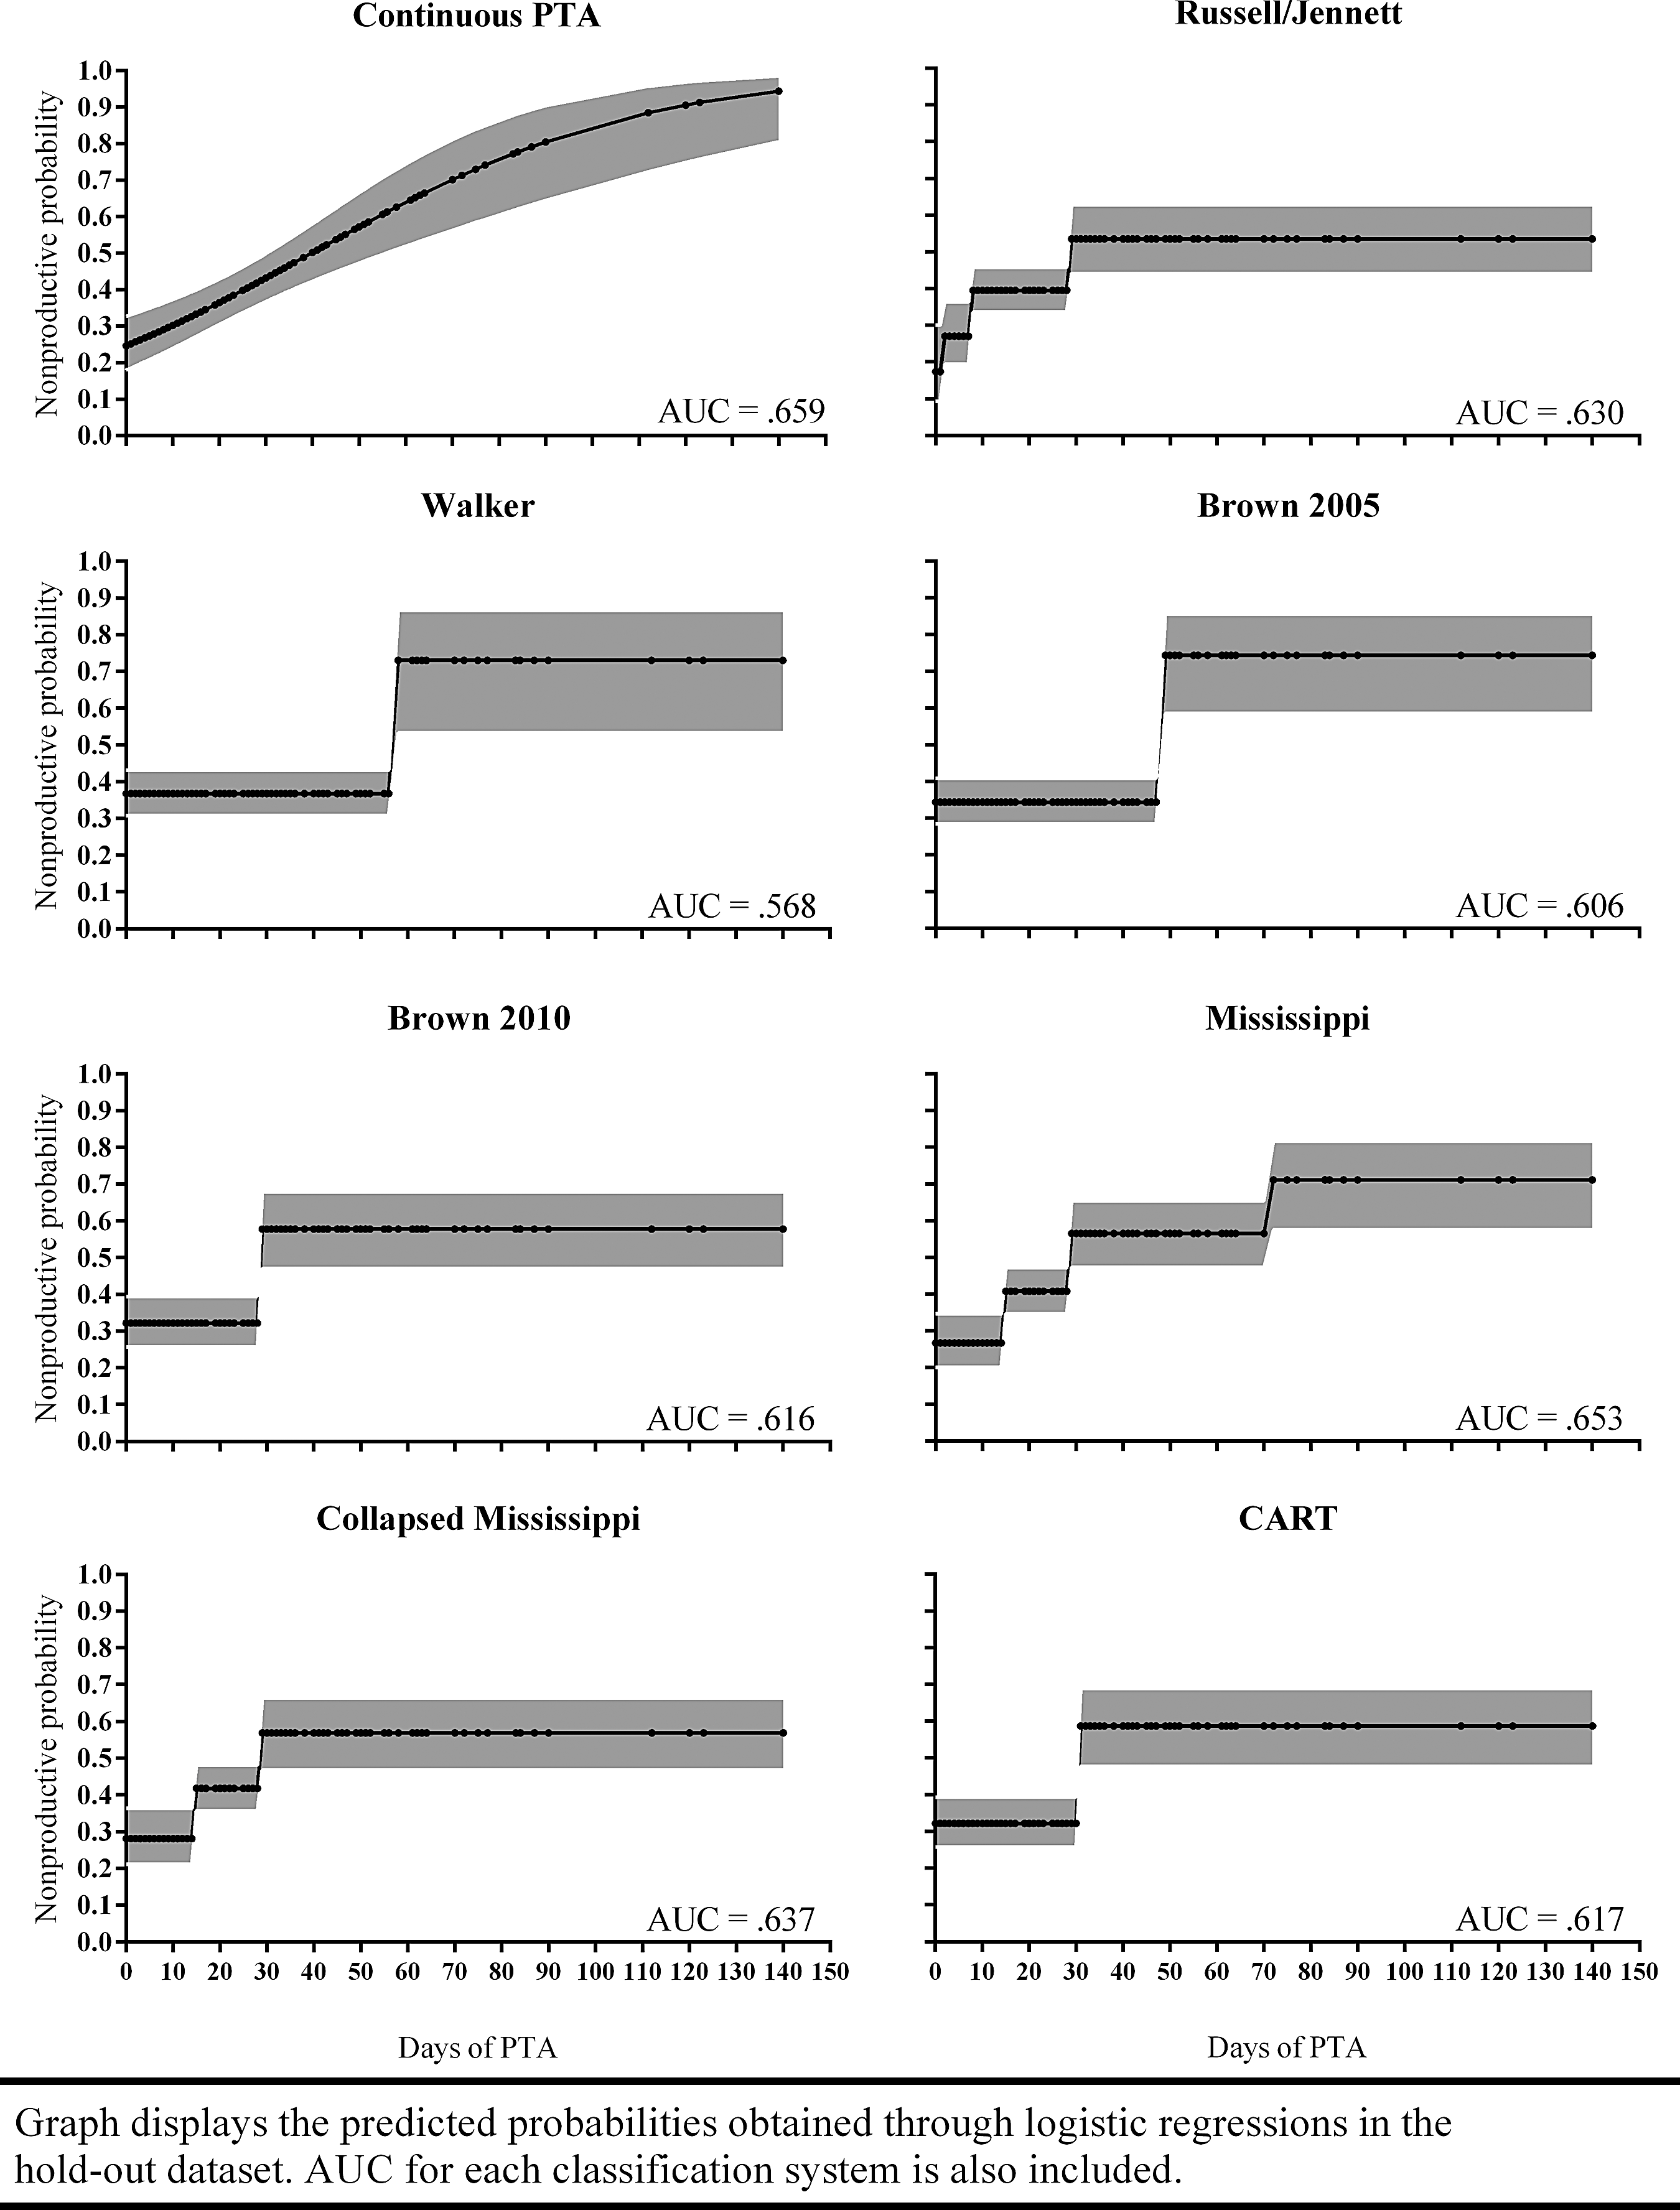
Graph displays the predicted probabilities obtained through logistic regressions in the holdout dataset. Area under the curve (AUC) for each classification system is also included. PTA, post-traumatic amnesia.
Sensitivity for all models was generally low, correctly classifying only between 16% to 39% of nonproductive persons at 1 year for the learning dataset, and between 18% to 45% in the holdout dataset (Table 3). Specificity for the models was quite high, correctly classifying 84% to 98% of productive persons in the learning dataset, and between 77% to 95% of productive persons in the holdout dataset. Both AIC and BIC model-based statistics suggest that PTA in its continuous form is the superior model of the set of competing classification systems, both in the learning and holdout datasets.
AIC, Akaike Information Criterion; BIC, Bayesian Information Criterion.
Discussion
PTA duration is increasingly used as a measure of injury severity to predict outcome after TBI. Despite the growing international adoption of this measure, there remains a lack of consistency in the way in which PTA duration is being used to classify severity of injury. Methods most commonly used, such as those proposed by Russell and Smith 16 and Teasdale and Jennett 17 are not based on systematic analysis of clinical outcome data. More recently, classifications based on clinical data analysis, such as the Mississippi PTA Intervals, have been proposed, but these have not been widely adopted. The present study compared different methods of categorizing PTA with methods that retain the duration of PTA as a dimensional variable in terms of their prediction of productivity outcomes in a consecutive sample of patients with TBI admitted to rehabilitation.
Eight classification models were examined—six that were based on the literature and two that were statistically driven—and applied to our sample. All systems showed longer PTA to be associated with a greater likelihood of being nonproductive at 1 year after TBI. Of the categorical classification systems, those with more categories, including the Russell/Jennett, Mississippi, and Collapsed Mississippi intervals, performed better than two-category systems, including the statistically derived CART binary cutoff of 30.5 days. Although the Russell/Jennett classification did not perform as well when tested in the holdout dataset, the Mississippi and Collapsed Mississippi classifications continued to perform relatively well.
The dimensional (continuous) form of PTA, however, resulted in the greatest AUC of the classification systems examined. This was the case in both the learning and holdout datasets. In addition, the dimensional model of PTA displayed the lowest AIC and BIC model statistics of the models assessed, providing further support for this model.
This finding indicates that the greatest accuracy in prognosis is likely to be achieved using PTA as a continuous variable. This enables the probability of productive outcomes to be estimated with far greater precision than that possible using a classification system. For example, using the Mississippi PTA intervals, all persons with PTA ranging from 29 to 70 days are treated the same with regard to predicted outcome. Using the dimensional approach, it is possible to ascertain that, based on the current dataset, a person with 29 days of PTA has a 46% probability of being nonproductive at 1 year post-injury, whereas a person at the mid-point with PTA of 49 days has a 60% probability of being nonproductive and a person with a PTA of 70 days has a 74% probability of being nonproductive.
Rather than categorizing persons into a discrete set of PTA duration bands, clinicians may be able to make more accurate predictions of productivity outcomes using continuous measures of PTA. An important question concerns the utility of such probability calculations. It is not difficult to compute individual probabilities for each unique value of PTA duration. This would lead to increased precision of prognosis than could be achieved by 2, 3, or 4 categories used in the Mississippi or other classification systems. The computations for prediction using logistic regression equations may appear complex at first glance, because they involve exponentiation. It is a relatively straightforward procedure to program the calculations in a spreadsheet on a tablet, however, or as an application for the simplest of “smart” phones.
It needs to be acknowledged that outcome was only measured in terms of return to productivity for those persons engaged in productive activities before injury. Return to productivity was measured in a similar way to previous studies of Model Systems samples, except that it did not include engagement in home duties pre- or post-injury as productive activity. The findings may not generalize to groups whose members were not productive before injury or to prediction of other forms of outcome, such as functional status. In addition, the current study did not investigate the extent that duration of PTA predicts recovery of specific domains within the “productive” umbrella, such as cognition, motor function, and behavior. PTA was assessed using different measures in the Model Systems studies from that used in the present study. This may have resulted in some systematic differences in PTA duration across studies, which may in turn influence categorization.
Although PTA is an essential factor to consider when examining prognosis, it must also be acknowledged that other factors may play a role in outcome prediction, including demographic variables, particularly age, pre-morbid neurological conditions, personality, and social support. In previous studies, however, PTA has been shown to be a stronger predictor of productivity and functional outcome than these other factors. 13,14 Interestingly, Brown and associates 10 used CART, logistic, and discriminant analysis with a range of predictor variables. They found that CART performed best at developing useful multivariate models that predicted outcome. This study shows that PTA is an important variable that may assist in making clinical judgments, but should also be considered in the context of other demographic and social predictors.
The study focused on a consecutive sample admitted for rehabilitation in the context of a government-funded accident compensations system that provided rehabilitation to persons injured in motor vehicle or work-related accidents, regardless of fault. The sample, therefore, included a predominance of transport or work-related injuries, with relatively few falls, assaults, or sporting injuries and very few mild injuries. The other studies used to create PTA cutoffs included a higher proportion of injuries due to falls, assaults, and other injuries (approximately 33% vs. 15% in the current study), and participants had a slightly higher mean age of around 37 years as opposed to 31 years in the present study. These factors might have differentially influenced return to productivity outcomes in these studies.
The purpose of this study, however, was not to compare outcomes per se, but to evaluate the use of PTA in predicting outcome. None of these studies included many participants with mild TBI. There is already some evidence to suggest that PTA duration is less predictive of outcome after mild TBI. One other issue raised by the study findings concerns the need for examination of the nomenclature used to describe injury severity. There is considerable variability across studies in the methods and measures used to classify the severity of injury. The findings of the present study suggest there is a need to review the way in which PTA duration is initially recorded and, in turn, is being used to describe the severity of TBI.
The present study has shown that using PTA as a continuous variable allows for prediction of productivity outcomes in persons with moderate to severe TBI with greater precision than appears possible using categorical systems. This underscores the importance of obtaining continuous, prospective measures of PTA using validated scales, 32 notwithstanding the need to consider the costs of adding a daily assessment procedure lasting 5–10 min into patient care routines. Given that the use of the GCS has now become standard practice in the management of TBI, it should be possible to work toward further integrating the assessment of PTA into routine clinical practice.
Footnotes
Acknowledgment
This project is funded by the Transport Accident Commission (TAC), through the Institute for Safety, Compensation and Recovery Research (ISCRR).
Author Disclosure Statement
No competing financial interests exist.