
Abstract
Sport-related concussion (SRC) is a major health problem, affecting millions of athletes each year. While the clinical effects of SRC (e.g., symptoms and functional impairments) typically resolve within several days, increasing evidence suggests persistent neurophysiological abnormalities beyond the point of clinical recovery after injury. This study aimed to evaluate cerebral blood flow (CBF) changes in acute SRC, as measured using advanced arterial spin labeling (ASL) magnetic resonance imaging (MRI). We compared CBF maps assessed in 18 concussed football players (age, 17.8 ± 1.5 years) obtained within 24 h and at 8 days after injury with a control group of 19 matched non-concussed football players. While the control group did not show any changes in CBF between the two time-points, concussed athletes demonstrated a significant decrease in CBF at 8 days relative to within 24 h. Scores on the clinical symptom (Sport Concussion Assessment Tool 3, SCAT3) and cognitive measures (Standardized Assessment of Concussion [SAC]) demonstrated significant impairment (vs. pre-season baseline levels) at 24 h (SCAT, p < 0.0001; SAC, p < 0.01) but returned to baseline levels at 8 days. Two additional computerized neurocognitive tests, the Automated Neuropsychological Assessment Metrics and Immediate Post-Concussion and Cognitive Testing, showed a similar pattern of changes. These data support the hypothesis that physiological changes persist beyond the point of clinical recovery after SRC. Our results also indicate that advanced ASL MRI methods might be useful for detecting and tracking the longitudinal course of underlying neurophysiological recovery from concussion.
Introduction
S
Previous research has provided great insight into the neurometabolic and biomechanical changes following mild traumatic brain injury (mTBI). 3,6,8,9,11 –15 However, studies of the biological substrates of SRC have been limited in scope, and knowledge regarding the functional physiological deficits following mTBI remains relatively unknown. 11,13,16 –22 Although the pathogenesis of concussion has yet to be fully elucidated, it is becoming increasingly clear that cerebrovascular alterations play a significant role in the evolution of injury sequelae, as well as in the process of post-traumatic brain repair. 4,11,22 –24 Reduced cerebral blood flow (CBF) signifies one of the most lasting markers of concussion in animal models of traumatic brain injury (TBI), 14,25,26 while CBF has been shown to be decreased immediately after injury in an animal model 27,28 and decreased regional CBF persisted after injury. 29
Reduced CBF during the acute and subacute phases of mTBI has been detected using imaging methods such as single-photon emission computed tomography 30,31 and perfusion computed tomography, 32 which have several disadvantages, including financial cost, ionizing radiation, and limited repetition of acquisitions. Arterial spin labeling (ASL) is an advanced magnetic resonance imaging (MRI) technique capable of measuring CBF non-invasively by using magnetically labeled arterial blood water as an endogenous contrast tracer, without radiation exposure, and is hence very suitable for longitudinal studies of CBF in healthy and diseased individuals, or as a surrogate marker of brain function and metabolism. 33 –35 The three dimensional (3D) pseudo-continuous ASL (pCASL) technique with a higher signal-to-noise ratio (SNR) and efficiency has been developed. 36 –38 Until recently, only very limited research has applied this advanced MRI technique in concussion research. 39 To evaluate the recovery trajectory during the acute stage after SRC, we examined clinical signs and CBF changes as measured using 3D pCASL in football athletes who sustained acute SRC, compared to matched uninjured teammates.
Methods
Participants
Participants were recruited from an ongoing prospective study of clinical recovery following concussion, Project Head to Head. Project Head to Head enrolled contact and collision sport athletes from nine high schools and four colleges in southeastern Wisconsin from August 2012 through November 2014. For the purposes of this paper, a sample of male football players who sustained concussions (n = 22) in the Fall 2014 sport season were recruited for neuroimaging assessment as part of a concurrent General Electric-National Football League (GE-NFL) Head Health Challenge study, in addition to completing the larger project's standard clinical post-injury protocol. Four concussed patients were excluded due to severe head motion during the imaging procedure; therefore, only 18 patients were included in this report. Also, the non-injured controls (n = 19) were selected to match injured athletes based on age, gender, sport, estimated premorbid level of academic achievement (see Wechsler Test of Adult Reading [WTAR] measure listed below), and grade point average. Table 1 summarizes the sample characteristics and degree of matching between the groups used in these analyses. All subjects except one reported engaging in a graded program of exertion. The one subject who did not was injured in the last game of the season and therefore did not need to return to play after injury.
Sample included male football players only. One concussed athlete did not complete the pre-season baseline measures.
M, mean ; SD, standard deviation; ADHD, attention-deficit hyperactivity disorder; WTAR, Wechsler Test of Adult Reading (estimate of premorbid verbal intellectual ability); LOC, loss of consciousness; PTA, posttraumatic amnesia; RGA, retrograde amnesia.
In this study, as a requirement of the funding mechanism, we used the U.S. Department of Defense's definition for mild traumatic brain injury: “an injury to the brain resulting from an external force and/or acceleration/deceleration mechanism from an event such as a blast, fall, direct impact, or motor vehicle accident which causes an alteration in mental status typically resulting in the temporally related onset of symptoms such as headache, nausea, vomiting, dizziness/balance problems, fatigue, insomnia/sleep disturbances, drowsiness, sensitivity to light/noise, blurred vision, difficulty remembering, and/or difficulty concentrating.” 40
Adult athletes and parents of minor athletes completed informed consent, and minor participants completed assent prior to their first evaluation. Participants were compensated $30 for completing pre-season baseline assessments, $50 for each follow-up clinical assessment, and $100 for each MRI session. All testing procedures were approved by the Institutional Review Board at the Medical College of Wisconsin.
Baseline and post-injury clinical assessments
Participants completed a 90-min clinical assessment protocol at pre-season baseline testing and at each follow-up (i.e., post-injury or control) evaluation. Post-injury testing occurred within 24 h of injury (mean [M] = 20.33 h; range, 14–24 h) and at 8 days post-injury (M = 8.39 days; range, 7–11 days). Follow-up assessments for controls were performed as soon as possible after identification and 7 days after the first follow-up (M = 7.21; range, 6–10 days). Baseline clinical assessments were individually proctored by paid research assistants and included a demographics and health history interview, WTAR, Sport Concussion Assessment Tool 3 (SCAT3) symptom checklist, 2 Standardized Assessment of Concussion (SAC), 41 Balance Error Scoring System (BESS), 42 the Automated Neuropsychological Assessment Metrics (ANAM) 43,44 and Immediate Post-Concussion and Cognitive Testing (ImPACT) computerized neurocognitive test (CNT) batteries, 45 and other self-report and computerized measures. The version of ANAM used in this study was comprised of eight subtests: Simple Reaction Time (SRT), Code Substitution-Learning (CDS), Procedural Reaction Time (PRO), Mathematical Processing (MTH), Matching to Sample (M2S), Code Substitution-Delayed (CDD), Simple Reaction Time 2 (SR2), and Go/No-Go (GNG). The test produces nine indices—one per test and a composite score. ImPACT produces four neurocognitive composite scores: Verbal Memory (VERM), Visual Memory (VISM), Visual Motor Speed (VMS), and Reaction Time (RT). Follow-up assessments were similar to baseline assessments but obtained injury/recovery (rather than health history) information and did not repeat the WTAR.
MRI acquisition
Participants were scanned on a GE Discovery MR750 whole–body 3-Tesla MRI scanner with a receive-only 32-channel coil array head coil () at the Center for Imaging Research, Medical College of Wisconsin. CBF measurements were performed using the 3D pCASL sequence with Fast Spin Echo spiral multi-slice readout using the following parameters: repetition time (TR) = 4632 msec; echo time (TE) = 10.54 msec; field of view (FOV) = 240 mm; matrix = 128 × 128; spiral readout of eight arms and 512 samples; number of excitations = 3; post label delay = 1.52 sec; label duration = 1.45 sec; in-plane resolution = 1.875 × 1.875 mm; slice thickness = 4 mm, total 36 slices; and sampling bandwidth = 62.5 Hz. To minimize blurring, the spiral acquisition was short (4 msec), and the required resolution was achieved with eight spiral interleaves. Three pairs of tagged–untagged images were collected. Background suppression pulse was applied to maximize the sensitivity to blood perfusion, 46 scan time = 4:29 min. In addition, T1-weighted 3D fast spoiled gradient echo (FSPGR) sequence with sensitivity encoding was acquired for anatomical reference with the following parameters: FOV = 256 mm; 180 axial slices; slice thickness = 1 mm; voxel size 1 × 1 × 1 mm3; image matrix = 256 × 256; TR/TE = 8.124/3.164 msec; acceleration factor R = 2 in the phase encoding direction; flip angle = 12°; sampling bandwidth = 31.25 kHz; scan time = 3:41 min.
Imaging processing
Individual T1 FSPGR and ASL image quality was checked for potential distortion and artifact. Three-dimensional pCASL data analysis was conducted with MATLAB software programs developed as described previously.
47
Images were corrected for motion, pair-wise subtracted between label and control images followed by averaging to generate the mean difference image. CBF quantification (in mL/100 g/min) was performed for the 3D pCASL based on a single compartment model using the equation:
where λ is the brain-to-blood partition coefficient (0.9 mL/g), PLD is the post label delay, T1blood is the T1 of arterial blood at 3T (1.6 sec),
48
α is the labeling efficiency (0.85),
49
TL is the labeling duration (1.5 sec), ΔS is the ASL difference signal, and S0 is the proton-density signal intensity. The term (1-exp[-2.0sec/1.5sec]) in the numerator reflects the presence of a saturation pulse that is applied in the proton-density images and allows conversion between measured MR signal (S0) and the unperturbed longitudinal gray matter magnetization. The quantified CBF maps were co-registered with anatomical FSPGR, which was segmented into gray matter (GM), white matter (WM), and cerebrospinal fluid (CSF) compartments using SPM8 (
Statistical analysis
For voxel-wise group comparison on individual CBF maps, the Analysis of Functional NeuroImages (AFNI;
Statistical Package for Social Sciences (SPSS, version 21.0; ) was used to assess differences in demographic and clinical measures between groups. For continuous variables, ANOVAs were employed with correction for multiple comparisons, while χ2 tests were used to examine group differences in categorical variables.
Results
Participant characteristics
All participants in this study were male. Concussed and control groups did not differ significantly with respect to age, years of education, height, or weight (Table 1). In addition, no significant difference was found in pre-existing conditions, including diagnosis of attention-deficit hyperactivity disorder, learning disability, or WTAR standard score. However, in light of the trend showing a difference in number of prior concussions between groups (p = 0.06), this variable was tested as a potential confounding covariate in group analyses as stated above. In the concussed group, one participant (5.6%) had any loss of consciousness associated with injury, one (5.6%) reported post-traumatic amnesia, and four (22.2%) reported retrograde amnesia.
Clinical measures
Between-group comparisons
Concussed subjects were equivalent in ratings on the SCAT3 symptom checklist and performance on the SAC and BESS at baseline (Table 2). Within 24 h of injury, concussed subjects produced higher symptom ratings (p < 0.0001) and performed more poorly than controls on the SAC (p = 0.029), with these impairments resolving by day 8 (p = 0.398 for group comparison at Day 8). The majority of the sample also completed the ANAM and ImPACT CNTs (concussed/control group, ANAM n = 16/18; ImPACT n = 11/18; Table 3). Across the CNTs' 13 indices, two demonstrated significantly different performance between groups at baseline (ANAM PRO throughput, p = 0.023; ImPACT VERM, p = 0.002). Consequently, ANOVA models evaluating group differences for these subtests at later time-points included baseline performance as a covariate. At 24 h, six of 13 indices demonstrated significant impairment for concussed versus control subjects (ANAM Composite p = 0.013, CDS p = 0.037, M2S p = 0.025, CDD p = 0.003; ImPACT VISM p = 0.011, VMS p = 0.020; all other p values >0.06). At the Day 8 assessment, concussed athletes were impaired (vs. controls) on only one of the 13 indices (ANAM CDS p = 0.043; Table 3).
significantly worse at 24 h than the baseline.
significantly improved at 8 days from 24 h. No measure showed a difference between baseline and 8 days in either group.
M, mean; SD, standard deviation; SCAT3, Sport Concussion Assessment Tool 3; SAC, Standardized Assessment of Concussion; BESS, Balance Error Scoring System.
models adjusted for baseline performances between groups on this scale. Concussed/control ANAM n = 16/18; ImPACT n = 11/18.
significantly worse at 24 h than the baseline.
significantly improved at 8 days from 24 h. Higher scores reflect better performance for all ANAM and ImPACT tests with the exception of ImPACT RT, for which lower reaction time reflects better performance.
M, mean; SD, standard deviation; ANAM, Automated Neuropsychological Assessment Metrics; BL, baseline; SRT, Simple Reaction Time; CDS, Code Substitution-Learning; PRO, Procedural Reaction Time; MTH, Mathematical Processing; M2S, Matching to Sample; CDD, Code Substitution Delayed; SR2, Simple Reaction Time 2; GNG, Go/No-Go (all ANAM analyses used throughput scores with the exception of Go/No-Go, for which d-prime scores were used); ImPACT, Immediate Post-Concussion and Cognitive Testing; VERM, Verbal Memory; VISM, Visual Memory; VMS, Visual Motor Speed; RT, Reaction Time.
Within-group longitudinal change
For the SCAT3 symptom checklist, SAC, and BESS, there were no significant changes between any two time-points in the control group. For the concussion group, scores on the clinical symptom (SCAT3 symptom severity) and cognitive (SAC total score) measures demonstrated significant impairment (versus pre-season baseline levels) at 24 h (SCAT3 p < 0.0001; SAC p < 0.01) but returned to baseline levels at 8 days (Table 2). Among the 17 concussed subjects with baseline symptom data, 10 (59%) provided SCAT3 symptom severity scores equal to or lower than their baseline levels at Day 8, while the remaining seven reported higher (4–33 points) than baseline symptom scores at this time-point. The median length of graded exertion protocol did not differ between the groups whose symptoms were at baseline levels versus not at baseline levels at Day 8 (Mann-Whitney U test, p = 0.345).
At 24 h, concussed athletes demonstrated worse performance (vs. baseline levels) on two of 13 CNT indices (ANAM CDD p = 0.032 and ImPACT VISM p = 0.020; other p values >0.08). In comparison, the control group demonstrated significant improvement from baseline levels on two of 13 CNT scores at 24 h (with no significant declines from baseline). On Day 8, both the concussed and control groups performed at or better than baseline levels on all CNT indices, with both groups demonstrating significant improvements from baseline on four of 13 indices (Table 3).
CBF changes
Between-group comparisons
At 24 h, the concussion group showed significantly lower CBF, predominantly in the right supplementary motor area (SMA) and pre-SMA regions, relative to the control group (p < 0.05 corrected; Fig. 1). At 8 days, concussed subjects demonstrated significantly lower CBF diffusely across cortical gray matter, mainly in bilateral prefrontal regions, temporal lobes, some parietal regions, as well as the thalamus, compared with the control group (p < 0.05 corrected; Fig. 2). No region showed significantly more CBF in the patient group related to the control group at any time-point.

Regions (in blue color) show significantly less cerebral blood flow (CBF) in concussion group at 24 h after injury, compared with the control group. No region shows significantly more CBF in the concussion group compared to the control group. Images reflect family-wise error correction at p < 0.05. Color bar indicates the t score. Color image is available online at
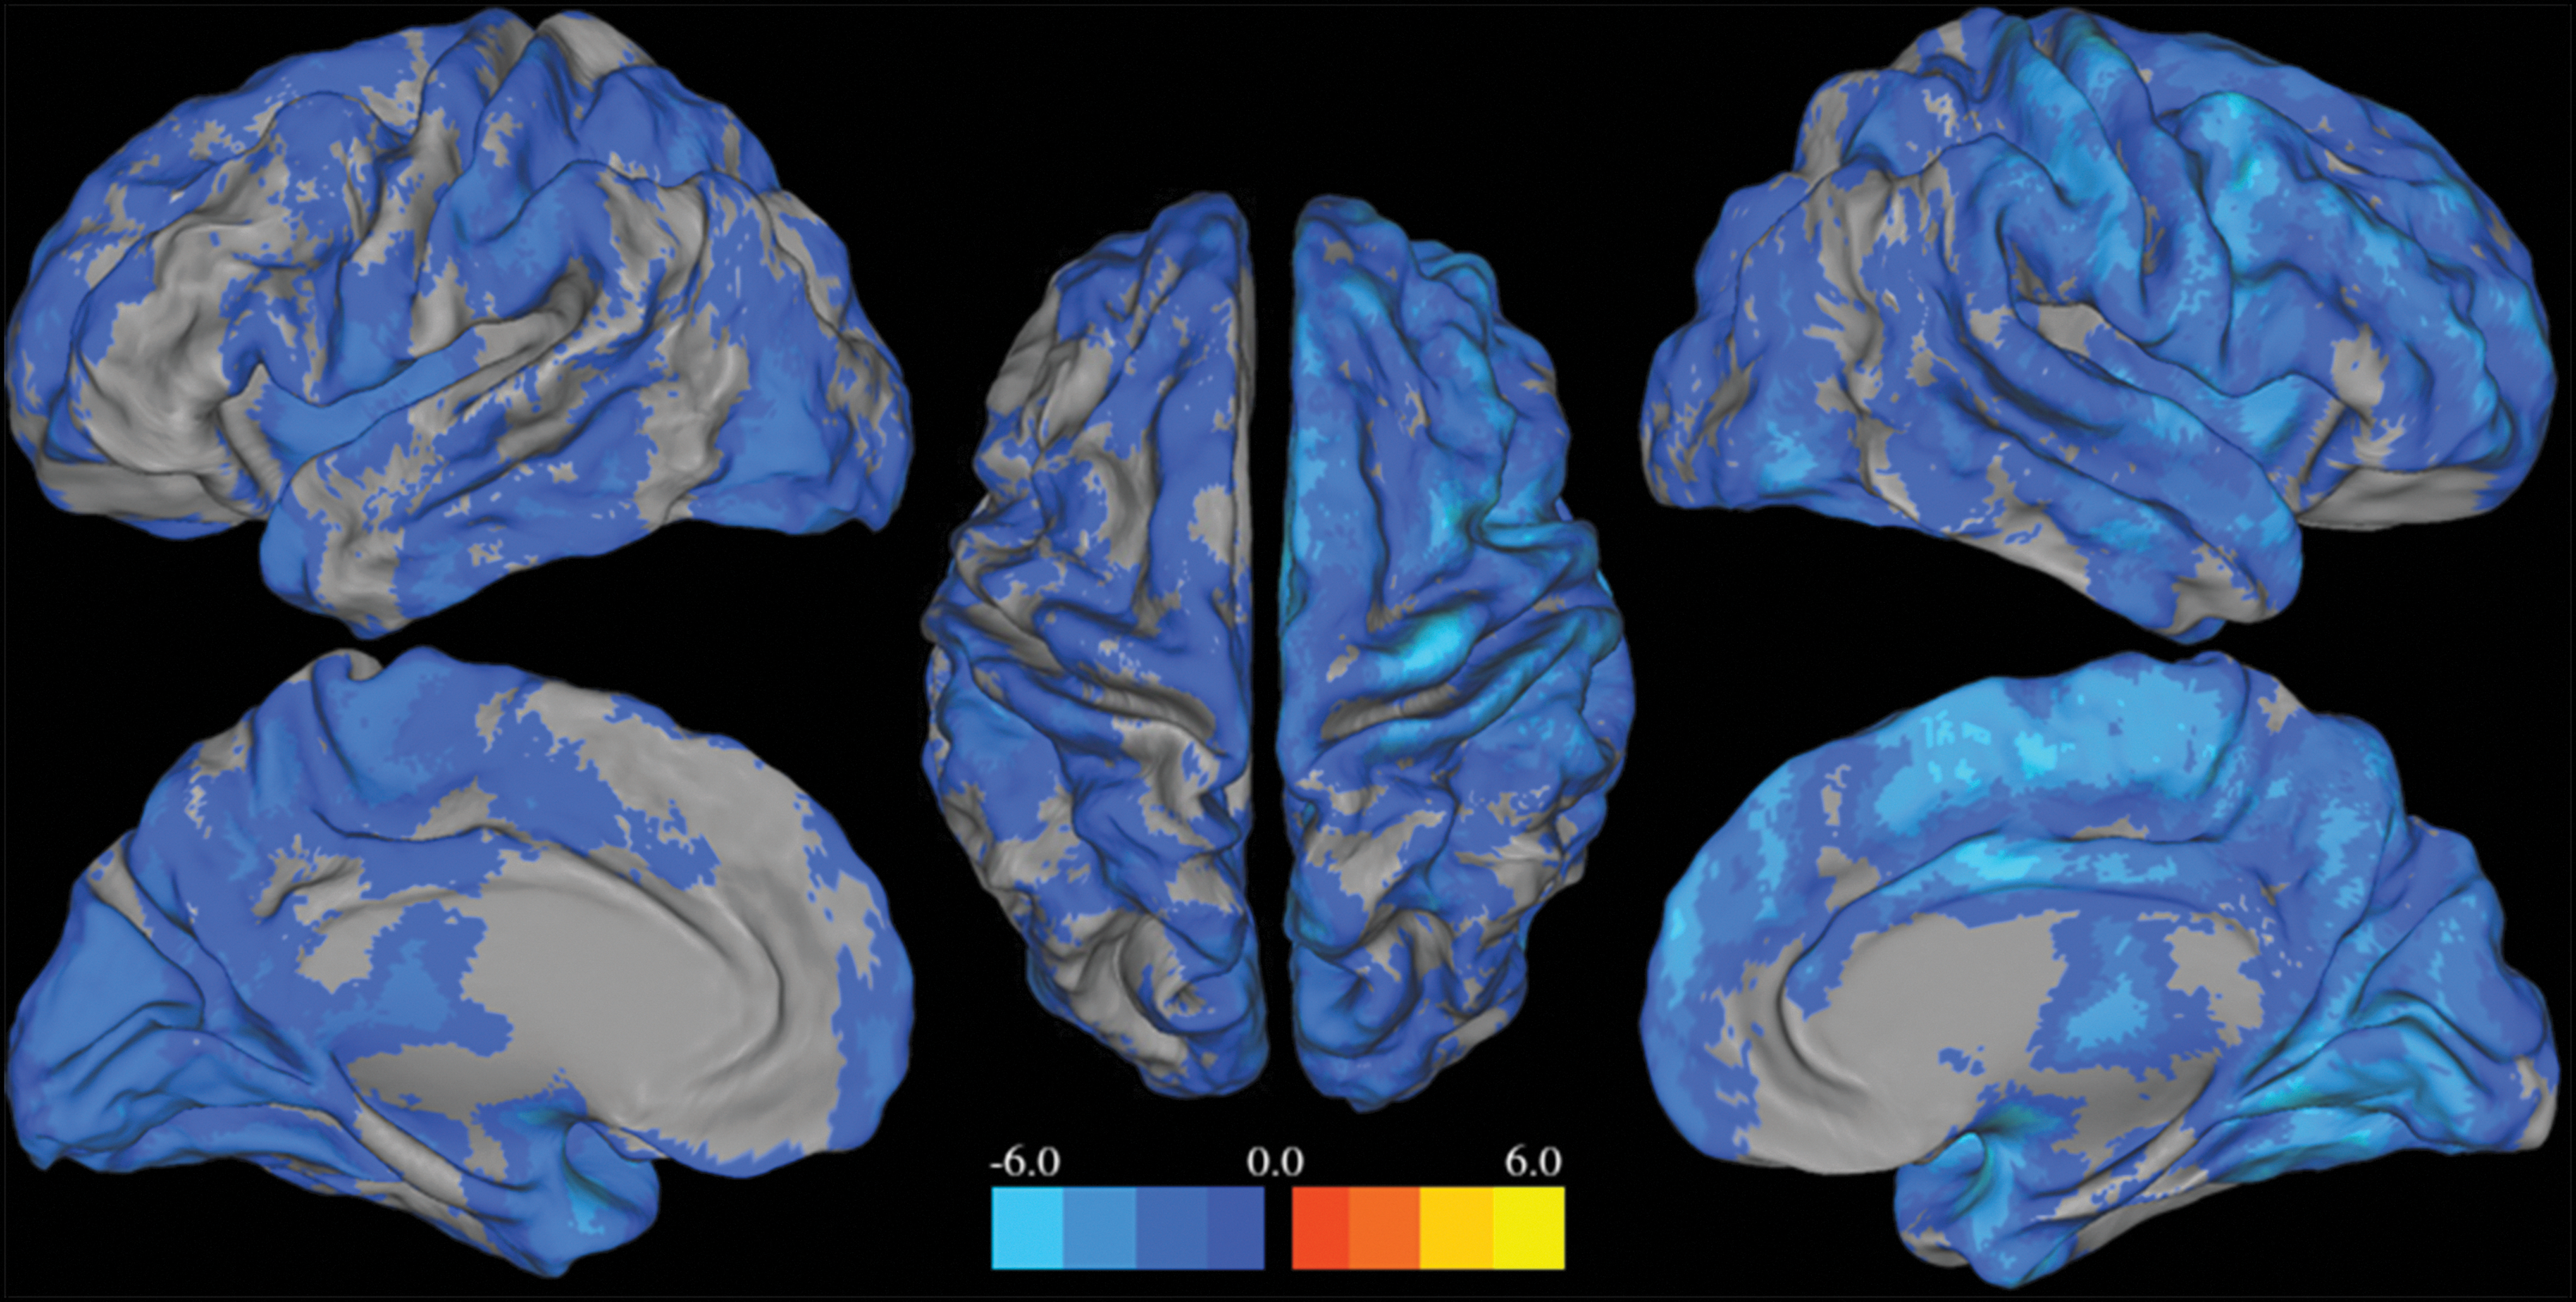
Diffuse cortical and subcortical regions (in blue color) show significantly less cerebral blood flow (CBF) in concussion group at 8 days after injury, compared with the control group. No region shows significant more CBF in the concussion group compared to the control group. Images reflect family-wise error correction at p < 0.05. Color bar indicates the t scores. Color image is available online at
Within-group longitudinal change
Spread cortical area in frontal and temporal lobes demonstrated significantly decreased CBF at 8 days, compared with 24 h after concussion in the patient group (p < 0.05 corrected; Fig. 3), while the control group did not show any changes in CBF between the two time-points. Significant group-by-time interaction of CBF changes was found mainly in bilateral frontal and temporal area (p < 0.05 corrected; Fig. 4).

Spread cortical and subcortical regions (in blue color) show significantly decreased cerebral blood flow (CBF) in concussion group at 8 days compared to 24 h after injury. No region shows significantly increased CBF in the concussion group at 8 days. Images reflect family-wise error correction at p < 0.05. Color bar indicates the t scores. Color image is available online at
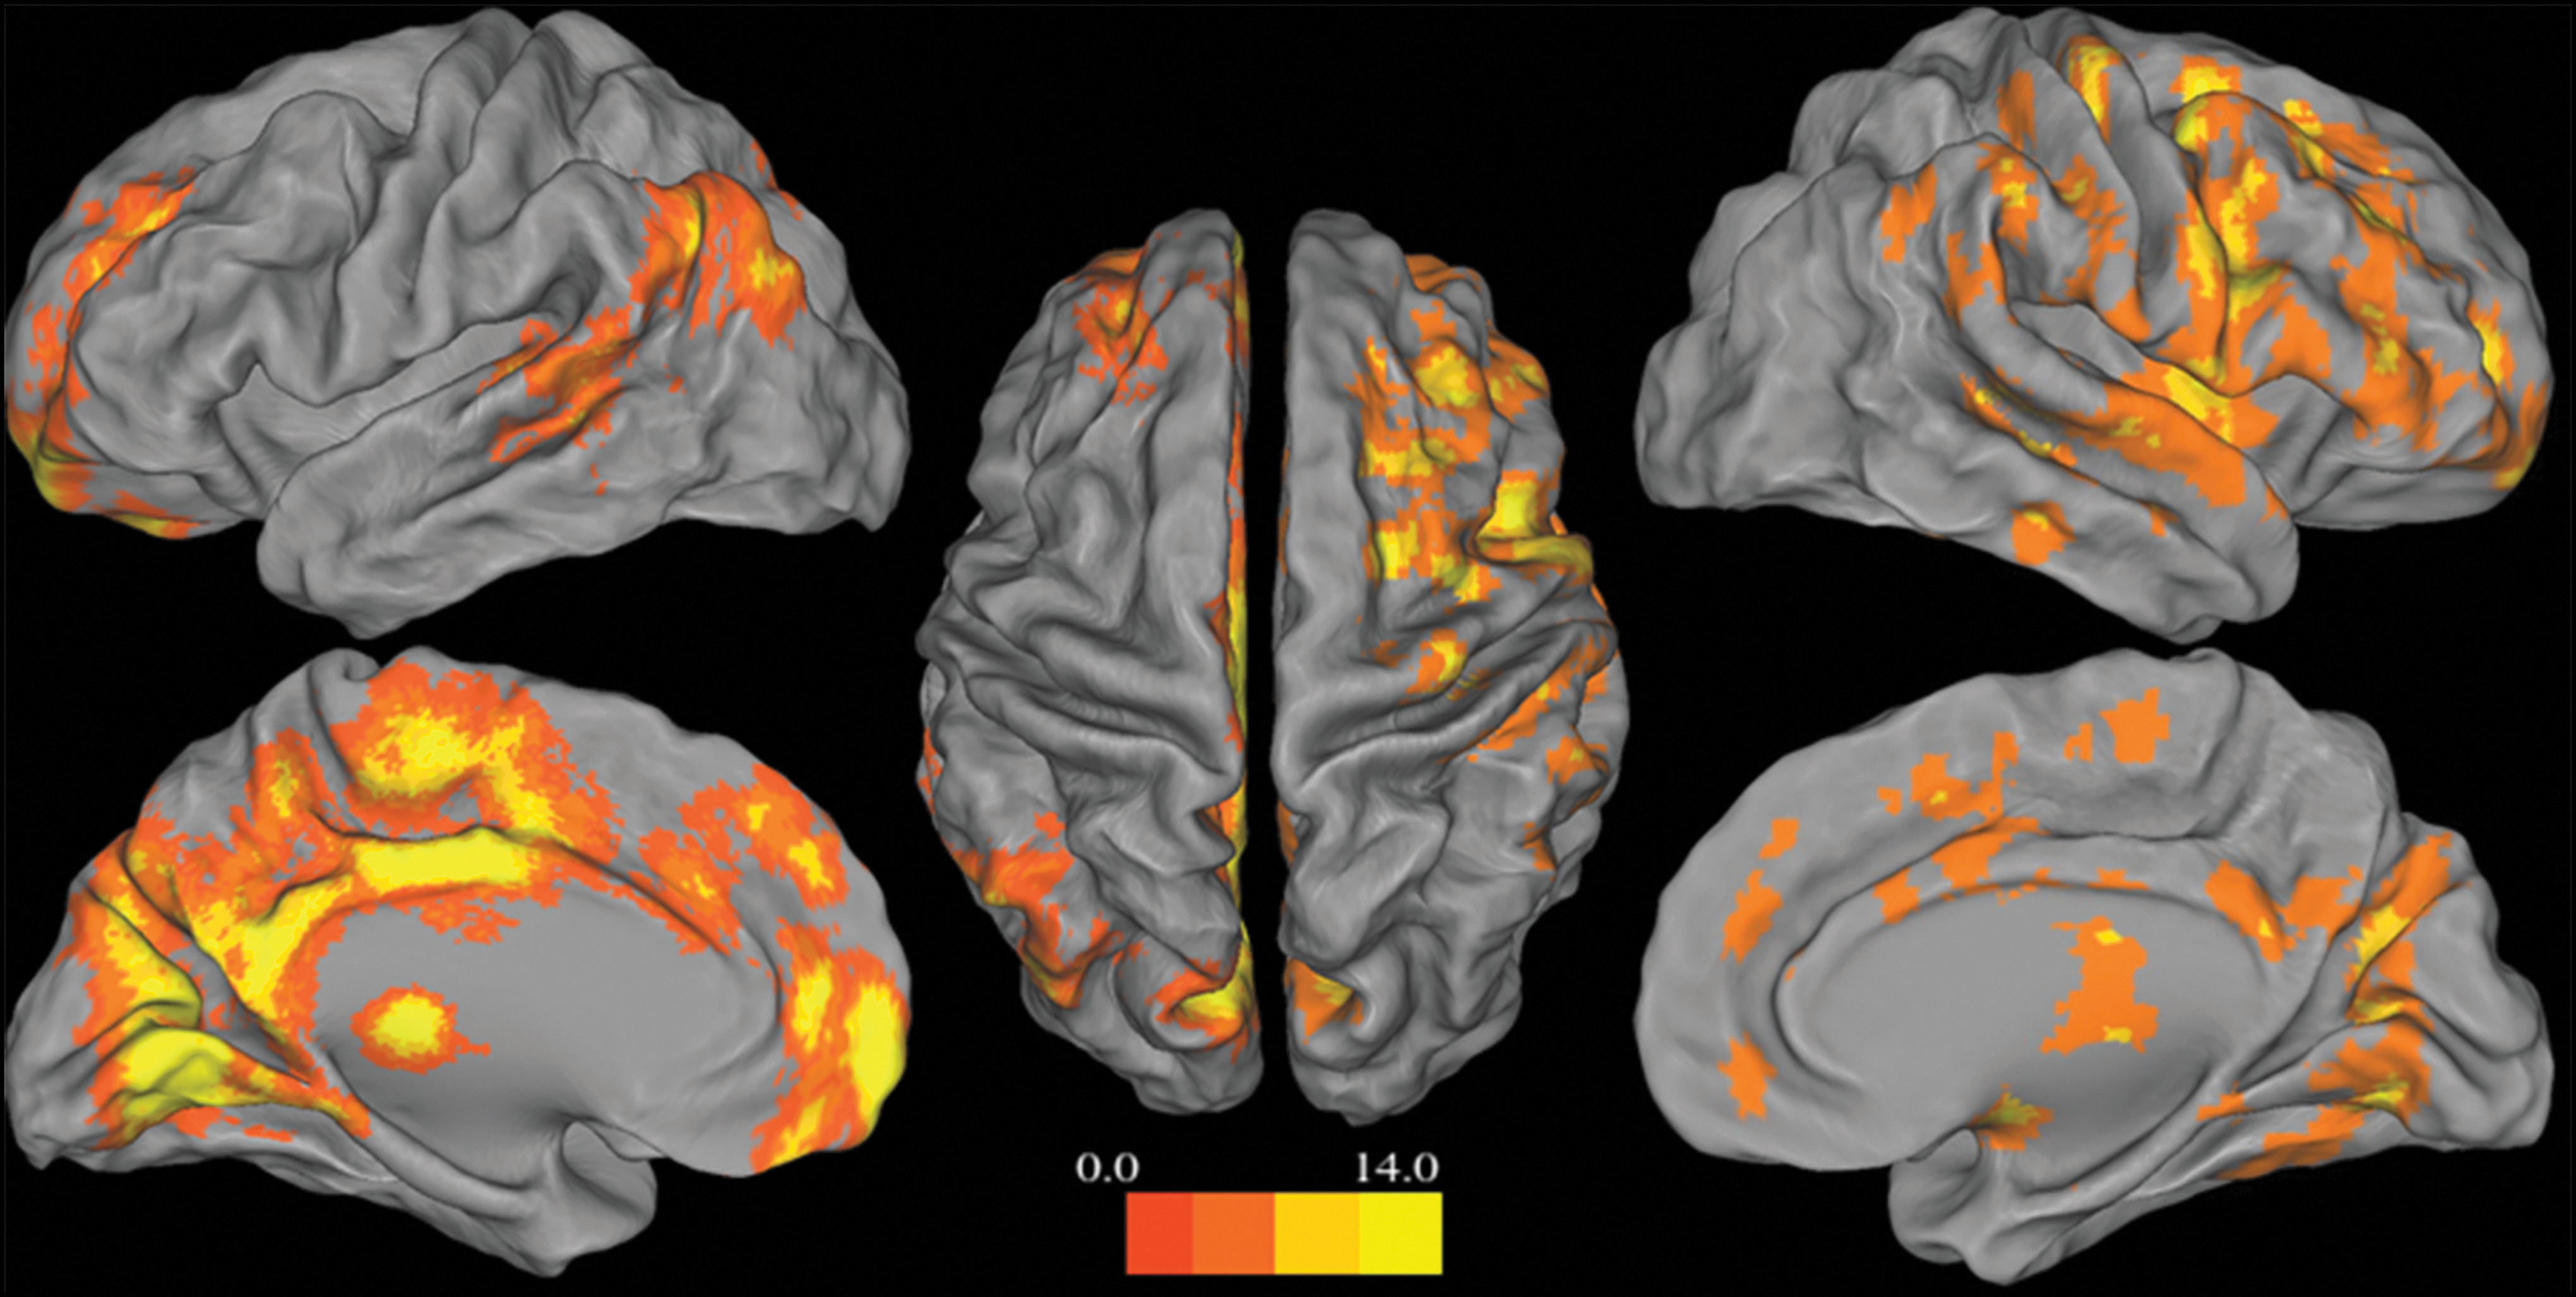
Significant group-by-time interaction of cerebral blood flow changes is found mainly in bilateral frontal and temporal regions (in hot color). Images reflect family-wise error correction at p < 0.05. Color bar indicates the t scores. Color image is available online at
In additional analysis, we repeated the above voxel-wise CBF group comparisons with and without the number of prior concussions as the covariate but found no significant effect of number of prior concussion on the final CBF results in this sample. Further, we also evaluated the results by applying a more conservative threshold of corrected p < 0.01. Although the spatial size of significant clusters was attenuated, decreased CBF at 8 days within the concussion group and less CBF in the concussion group relative to controls at the same time-point in the original analysis remained significant, illustrating decreased CBF in spread regions of frontal and temporal lobes in concussed patients at 8 days after injury (Table 4).
SFG, superior frontal gyrus; IFG, inferior frontal gyrus; STG, superior temporal gyrus; MTG, middle temporal gyrus; MFG, middle frontal gyrus.
Discussion
In this study, concussed football players demonstrated abnormally reduced CBF 24 h after sustaining SRC, and further decreased CBF at 8 days post-injury. Findings were evident in both within (compared with preseason baseline) and between (compared with matched controls) subjects analyses. Notably, significant clinical symptoms and impaired neurocognitive performance were observed at 24 h post-injury relative to the baseline, while at a group level both clinical measures returned to baseline levels at 8 days. Further, neurocognitive recovery at 8 days was observed for both a paper-and-pencil screening measure (SAC) and two computerized measures (ANAM and ImPACT).
These findings are considered to have important clinical implications in the context of understanding the natural time course of clinical and physiological recovery after SRC and mTBI. Current guidelines for management of SRC call for a step-wise, symptom-limited program of exertion that is initiated after resolution of clinical symptoms. 2,10 However, as symptoms are self-reported, underlying physiological effects of SRC still may be present when these subjective markers are reported to have resolved. 22,54 Even after symptom resolution, neurons under a state of physiologic stress function abnormally and may remain susceptible to second injury. 55,56 Supporting this notion, our recent studies indicate that abnormalities on advanced electrophysiological testing and working memory functional MRI are detectable in athletes who otherwise report a complete symptom recovery and perform normally on clinical measures (i.e., cognitive and balance testing) after SRC. 7,57,58
These findings fuel the critical concern that a window of cerebral vulnerability (WoCV) extends beyond the point of clinical recovery after SRC, when the brain remains physiologically compromised and at heightened risk of repetitive injury. However, no measurable biological indicators of this WoCV are available for clinical use, and existing data are insufficient to determine the likely time course or the end point of physiological abnormalities after SRC. Our results are in line with the notion that underlying neurophysiological changes persist even after clinical recovery from SRC, which supports the hypothesis of the WoCV. In particular, CBF alterations might present a possible mechanism underlying the WoCV during recovery after SRC.
Recent research has suggested that SRC may produce a pathophysiologic process resulting in altered CBF values with a variable and possibly protracted time frame for resolution. 39,55,59 CBF perturbations have been identified in experimental models as the cause of a “metabolic mismatch” between supply and demand for oxygen and glucose. 60 Neurons under such a state of physiologic stress function abnormally and become more susceptible to secondary injury. 55 If a concussed athlete returns too quickly to strenuous physical activity or experiences a second SRC, symptoms and neuropsychological testing deficits frequently worsen. 2,6,55,61 Therefore, our data enrich the theory that a protracted state of physiologic abnormality exists for some concussed athletes, even when clinical assessments appear normal. The current findings have significant implications for the management of concussion. Return-to-play decisions are currently based on clinical judgment that is informed by neurocognitive batteries and self-report symptom metrics rather than on evidence-based biomarkers. 10,22,39,62 Our study suggests a potential objective marker of physiological recovery indicating that the WoCV has elapsed and the individual is safe to resume activity. 10
Yet to be fully elucidated, there are several possible pathophysiologic mechanisms of decreased CBF after mTBI. 11,22 Following TBI, primary injury at the moment of impact damages brain tissue by disrupting blood vessels; this event facilitates secondary injury cascades affecting the neurovascular unit (NVU) physiology. 11 The NVU is a physiological entity that is structurally defined by interactions occurring between endothelial cells, pericytes, smooth muscle cells, astrocytes, and neurons. 11,63 The post-traumatic changes in the NVU are mostly observed during the first week after injury, although the evolution of these changes in the NVU over a long period of time is still unknown. 11 Moreover, cerebral autoregulation, the intrinsic ability of the brain to maintain a constant CBF in response to variations in systemic blood pressure, has been found to be lost or impaired following mTBI for up to 14 days. 22,64 –66 In addition, research has illustrated that the autonomic and cardiovascular systems become uncoupled following acute brain injury 67 ; it has also been suggested that deficits in neuroautonomic control after brain injury are correlated with abnormal cerebrovascular responses. 68 CBF changes after TBI also may be related to changes in basic properties of the cerebral vasculature, and decreased CBF early after injury is a common signature of TBI. 11
Our findings of scattered perfusion deficit (i.e., decreased CBF) in acute SRC are in accord with our previous study showing significantly lower CBF in bilateral dorsal prefrontal and temporal lobe regions in asymptomatic pediatric SRC subjects at 7 months post injury. 59 Our data also are consistent with another magnetic resonance perfusion study of mTBI. 69 Further, it has been shown the most reliable patterns of parenchymal changes after TBI were observed in the frontal, temporal, and cingulate regions, although effects were observed to varying degrees in nearly every brain region. 70 Most recently, Meier and colleagues 39 found longitudinal (1 day and 1 week vs. 1 month post-injury) CBF recovery only in the right insular and superior temporal cortex in a sample of collegiate athletes. The reasons for discrepancy of results might be due to different sample characteristics and/or the use of different methodology in assessments. Another recent study reported increased CBF in acute mTBI relative to controls, but with a very limited sample size (seven patients) and no longitudinal within-subject comparisons. 71 Nevertheless, animal research has demonstrated that diffuse and mild injuries could result in very low reductions or even increases in blood flow, at least at initial time-points following TBI, 11,72 –74 which might provide an explanation of our observing relatively small difference in CBF between SRC at 24 h post-injury and controls. It should be noted that the concussed sample of this study represents the mildest end of the continuum of TBI. This might also give context to the fact that we observed CBF deficit within 24 h, despite the mild injuries, and provides a call for additional study of more severe mTBI to look for a CBF dose response based on injury severity.
Relevant limitations of this study require acknowledgment. A modest sample size and confined follow-up period are the primary limitations of this preliminary investigation. It would be important to follow up with existing subjects to detect a complete recovery course of the underlying perfusion deficit after SRC. In this study, we only recruited male athletes and were therefore unable to examine gender differences. As age may play a role in the moderation of CBF after mTBI, 22 further research is warranted to evaluate the effect of age on duration of the WoCV after SRC. Further, although the sample demonstrated clinical recovery at 8 days post-injury at a group level, there were seven of 18 patients who were not completely symptom-free at the time-point. Limited sample size did not allow for the separate analyses of CBF based on clinical recovery status at an individual level. While group comparisons showed a similar course of changes in clinical symptoms and neurocognitive performance, we do not have enough evidence to draw conclusions about which clinical measure might be more or less sensitive to detect changes at 8 days post-injury. Future work accumulating larger samples and athletes of more varied in demographic characteristics will allow for more complete elucidation of the interplay between clinical symptoms and physiological recovery for a wide range of athletes. A multi-modal approach to combine 3D pCASL with other imaging methods, such as functional and diffusion MRI, would be useful to characterize the physiological effects of concussion. Future studies may demonstrate that such advanced imaging modalities could potentially direct rehabilitation after concussion and possibly aid in determining when it is safe for an athlete to return to play, although there is no evidence at the present time to support such conclusions. 15
Footnotes
Acknowledgments
This work was supported by the GE-NFL Head Health Challenge I and the U.S. Army Medical Research and Materiel Command under award number W81XWH-12-1-0004. Opinions, interpretations, conclusions, and recommendations are those of the authors and are not necessarily endorsed by the NFL, GE, or the U.S. Army. This publication was also supported by the Clinical and Translational Science Institute grant 1UL1-RR031973 (-01) and by the National Center for Advancing Translational Sciences, National Institutes of Health grant 8UL1TR000055. The contents of this publication are the sole responsibility of the authors and do not necessarily represent the official views of the National Institutes of Health.
Author Disclosure Statement
No competing financial interests exist.