




Abstract
Operation Brain Trauma Therapy (OBTT) is a multicenter pre-clinical drug screening consortium testing promising therapies for traumatic brain injury (TBI) in three well-established models of TBI in rats—namely, parasagittal fluid percussion injury (FPI), controlled cortical impact (CCI), and penetrating ballistic-like brain injury (PBBI). This article presents unique characterization of these models using histological and behavioral outcomes and novel candidate biomarkers from the first three treatment trials of OBTT. Adult rats underwent CCI, FPI, or PBBI and were treated with vehicle (VEH). Shams underwent all manipulations except trauma. The glial marker glial fibrillary acidic protein (GFAP) and the neuronal marker ubiquitin C-terminal hydrolase (UCH-L1) were measured by enzyme-linked immunosorbent assay in blood at 4 and 24 h, and their delta 24–4 h was calculated for each marker. Comparing sham groups across experiments, no differences were found in the same model. Similarly, comparing TBI + VEH groups across experiments, no differences were found in the same model. GFAP was acutely increased in injured rats in each model, with significant differences in levels and temporal patterns mirrored by significant differences in delta 24–4 h GFAP levels and neuropathological and behavioral outcomes. Circulating GFAP levels at 4 and 24 h were powerful predictors of 21 day contusion volume and tissue loss. UCH-L1 showed similar tendencies, albeit with less robust differences between sham and injury groups. Significant differences were also found comparing shams across the models. Our findings (1) demonstrate that TBI models display specific biomarker profiles, functional deficits, and pathological consequence; (2) support the concept that there are different cellular, molecular, and pathophysiological responses to TBI in each model; and (3) advance our understanding of TBI, providing opportunities for a successful translation and holding promise for theranostic applications. Based on our findings, additional studies in pre-clinical models should pursue assessment of GFAP as a surrogate histological and/or theranostic end-point.
Introduction
N
As outlined in companion articles to this report, 3 –6 Operation Brain Trauma Therapy (OBTT), a multicenter pre-clinical drug-screening consortium, is evaluating promising therapies in three well-established pre-clinical rat models of TBI—namely, parasagittal fluid percussion injury (FPI), controlled cortical impact (CCI), and penetrating ballistic-like brain injury (PBBI)—using state-of-the-art histological and behavioral methods. 7 A unique feature of OBTT is also taking advantage of a special opportunity to evaluate glial (glial fibrillary acidic protein [GFAP]) and neuronal (ubiquitin C-terminal hydrolase-L1 [UCH-L1]) protein levels in peripheral blood across these models as a novel strategy to assess neuroprotective effects of TBI treatment. 1,2
Circulating biomarkers are increasingly being considered as additional outcome measures for pre-clinical TBI, complementing histological and behavioral data, because they have the potential to provide information that is reproducible, highly quantifiable, sensitive, and/or specific in detecting even minor brain cell damage, and reliably reflect the extent of brain damage. Further, combinations of different molecular markers of brain damage and their patterns that reflect injury to distinct brain cell types and assess different pathophysiological mechanisms in TBI could represent a simple and highly useful approach to gain insight into the pathobiology of TBI models while allowing for comparison, characterization, and severity stratification.
In this article, we have used the biomarker data from the sham and vehicle (VEH) treated TBI groups from the first three treatment trials of OBTT 4 –6 to compare and characterize the three rat models of TBI that are being used. This approach provides a robust and unprecedented sample size for pre-clinical biomarker investigation, boosting the statistical power of our comparisons.
The aims of this report are (1) to determine blood levels of two promising and pathobiologically diverse biomarkers that are currently in clinical testing—namely, GFAP and UCH-L1—including kinetics and comparison with sham; (2) to gain insight into reproducibility of the models themselves as assessed by biomarker levels; and (3) to define the relationships between the circulating biomarker levels and both neuropathological and behavioral outcomes.
Methods
Animals and experimental TBI models
This study is part of the OBTT consortium; the details of that consortium are provided in the introductory overview companion article in this issue. 3
The present analysis focused on a cohort of 88 shams and 99 VEH treated rats with TBI from the first of three studies in OBTT in which analysis of brain damage markers in blood was available (Table 1). Briefly, adult male Sprague-Dawley rats weighing 220–310 g were used for these studies. Rats were housed in standard cages in a 12 h light, 12 h dark cycle and given food ad libitum. Rats underwent TBI that was induced using three established experimental models: CCI, FPI, and PBBI. Sham rats underwent all manipulations except trauma or drug or VEH administration. The rats were randomly assigned to experimental groups.
TBI, traumatic brain injury; FPI, fluid percussion injury; CCI, controlled cortical impact; PBBI, penetrating ballistic-like brain injury.
The three rat models of TBI used in this project have been described in the aforementioned three companion articles. 4 –6 The studies in rats were performed at the Safar Center (University of Pittsburgh, CCI model), the University of Miami (parasagittal FPI model), and Walter Reed Army Institute of Research (WRAIR, PBBI model).
All experiments were performed in accordance with Institutional Animal Care and Use Committee (IACUC) and the United States Army's Animal Care and Use Review Office (ACURO) approved protocols.
Blood sampling
Blood sampling was performed at 4 h, 24 h, and 21 days after injury or at parallel time points in shams. For the early time points, 0.7 mL was obtained. The final time point at sacrifice yielded 2–3 mL of blood obtained from the left cardiac ventricle via a 20-gauge needle. Blood was immediately placed in microcentrifuge tubes and allowed to clot at room temperature for 60 min. Tubes were centrifuged at 5000g at room temperature for 5 min. In the FPI and PBBI models, indwelling venous catheters were in place, and blood samples were collected and processed as serum samples. In the CCI model, tail vein samples were collected using a heparinized syringe and tubing to prevent clotting, and thus plasma samples were processed. Serum or plasma was collected, snap frozen on dry ice, and stored at −80°C until shipped. Samples were shipped on dry ice by overnight mail to Banyan Biomarkers, LLC, Alachua, FL.
Measurement of brain damage markers: GFAP and UCH-L1
Quantification of GFAP and UCH-L1 levels was performed at Banyan Biomarkers. All samples were coded, and the analyst was blind to animal data. All samples were analyzed in duplicate. Samples were measured using standard UCH-L1 and GFAP sandwich enzyme-linked immunosorbent assay (ELISA) protocols, 8,9 as described below.
The GFAP ELISA uses a proprietary rabbit polyclonal antibody (Banyan Biomarkers) for solid phase immobilization and a biotin labeled polyclonal rabbit antibody for detection. The test sample is allowed to react sequentially with these antibodies, resulting in GFAP molecules being sandwiched between the two antibodies. Detection occurs after the addition of a tertiary streptavidin-poly-HRP conjugate and addition of a colorimetric substrate (Ultra-TMB ELISA, Pierce#34028), and product was quantified by absorbance at 450 nm in a microplate spectrophotometer (BMG FLUOStar OPTIMA, Germany).
The UCH-L1 ELISA uses a proprietary mouse monoclonal antibody (Banyan Biomarkers) for solid phase immobilization. The UCH-L1 antigen is previously bound to a proprietary polyclonal rabbit antibody (Banyan Biomarkers) for detection, via an overnight incubation. The bound analyte is then captured by the immobilized antibody on the plate, resulting in UCH-L1 molecules being sandwiched between the two antibodies. The detection signal occurs after the addition of a tertiary polyclonal anti-rabbit-HRP conjugated antibody and addition of a colorimetric substrate (Ultra-TMB ELISA, Pierce #34028), and product was quantified by absorbance at 450 nm in a microplate spectrophotometer (BMG FLUOStar OPTIMA, Germany).
All samples were analyzed concomitantly with calibrators prepared in matrix; specifically, a serial dilution of the calibrator protein is prepared, and aliquots of that calibrator solution are assayed in the same assay volume and under the same conditions as the samples. The calibrator signal intensities were used to generate a dose response curve and to calculate the sample levels using a four parameter logistic function (Mars Software from OPTIMA reader). In most cases, the same amount of sample, QC controls, and calibrators are used for each assay (dilution factor = 1), but in some cases, there may have been insufficient material, and a dilution factor larger than 1 would be used to compensate for the lower amounts used.
For each biomarker, quantitative determination of the biomarker levels was achieved by comparing the sample signal intensities to the standard curve obtained from the same assay. Target levels are reported in ng/mL. QC controls at the high, midpoint, and low end of the assay range were included on each plate to verify performance. A native reference sample was also included to monitor changes in assay performance over time.
Finally, an assessment of the relationship between serum and plasma biomarker levels was made for direct comparison of values across models. For these assessments, 10 rats underwent CCI (n = 7) or sham (n = 3) using the established CCI injury protocol in OBTT. 4 At 4 h after injury in each rat, a venous blood sample was obtained and divided into two aliquots; one aliquot was centrifuged to obtain serum while the other was immediately heparinized and centrifuged to obtain plasma. The GFAP and UCH-L1 assays were then performed, and measures of biomarkers levels were compared between the 10 pairs of plasma and serum samples of the same animals to determine whether a correction factor was required to convert the plasma biomarker values in CCI to parallel serum values for comparison with the FPI and PBBI models.
The correlation coefficient was highly significant (r = 0.98, p < 0.0001), and the Bland-Altman analysis shows that the difference against the mean did not vary in any systematic way over the range of biomarker measurement. In addition, the absolute concentrations of biomarkers did not vary significantly between the serum and plasma, and the differences were within the between-run coefficient of variation. Therefore, a correction factor was not applied.
Neuropathological and behavioral assessments for correlations with biomarker levels
Complete descriptions of the approaches used for neuropathological and behavioral assessments are provided in the companion articles. 4 –6
To assess the relationship between biomarker levels and neuropathology, we used lesion volume or tissue loss in the injured hemisphere or cortex. 4 –6 Of note, consistent with the approach taken in the companion drug testing articles, lesion volume and tissue loss in CCI and PBBI were expressed as percent of contralateral (noninjured) hemisphere, while in FPI, because of the small lesion size that is limited to cortex, lesion volume and tissue loss were expressed as percent of contralateral cortex. Ipsilateral and contralateral hemispheric tissue volume (CCI and PBBI) or cortical tissue volume (FPI) were quantified using the same standardized approach. 4 –6
To assess the relationship between biomarker levels and behavioral outcome, we used two metrics—namely, mean latency on the hidden platform in the Morris water maze (MWM) and percent time in target quadrant on a probe trial of functional outcome. 4 –6
Statistical analyses
The normality of data distribution was assessed, and continuous variables are presented as mean (standard deviation) or median (interquartile range), as appropriate. Delta 24–4 h biomarker levels in injured groups were calculated as the difference between 24 h and 4 h biomarker levels. This measure of dynamic change in brain injury markers identifies increases (positive delta) and decreases negative delta of biomarker levels within this important 20 h epoch.
Because levels of both markers had a skewed distribution, the differences in biomarker level among the different trials and TBI models were evaluated using the Kruskal-Wallis test followed by post hoc comparisons applying Mann-Whitney U and Bonferroni correction. The Mann-Whitney test was used to test differences between two groups in GFAP and UCH-L1 levels for unpaired data, and the Wilcoxon test was used for paired data (4 h vs. 24 h). The relation between biomarker level and neuropathological and behavioral parameters was assessed by bivariate correlations (Spearman rank correlation test).
All hypothesis tests conducted were two-tailed, and a p value < 0.05 was considered significant. All statistical analyses were performed using SAS (SAS version [9.2] of the SAS System. Copyright ©2002–2008 by SAS Institute Inc., Cary, NC) and Sigmaplot v.11.0 (Systat Software, Inc., Chicago, IL).
Results
Comparison across experiments
To ensure that it was valid to combine the results in sham groups for each model across the first three treatment trials and similarly in TBI + VEH groups for each model across the first three treatment trials, it was necessary to determine reproducibility within these groups. In all the models, blood GFAP and UCH-L1 levels in sham or TBI + VEH groups at both 4 and 24 h post-injury and the related delta 24–4 values did not differ significantly (p > 0.05) across the three treatment trials, confirming exceptional reproducibility of biomarker data across the studies. These findings provide evidence for the reliability and reproducibility of our models and support our combining the results from the three experiments for all of the studies in this report.
Characterization of the experimental TBI models using biochemical markers of brain injury acutely after the insult
FPI model
After FPI, GFAP levels were significantly increased compared with shams at both 4 h and 24 h (1.22 vs. 0.001 ng/mL, p < 0.0001 and 0.09 vs. 0.009 ng/mL, p = 0.00009) (Fig. 1A). FPI + VEH rats demonstrated an ∼1200-fold increase in circulating GFAP levels at 4 h but only a 10-fold increase at 24 h after injury compared with shams.
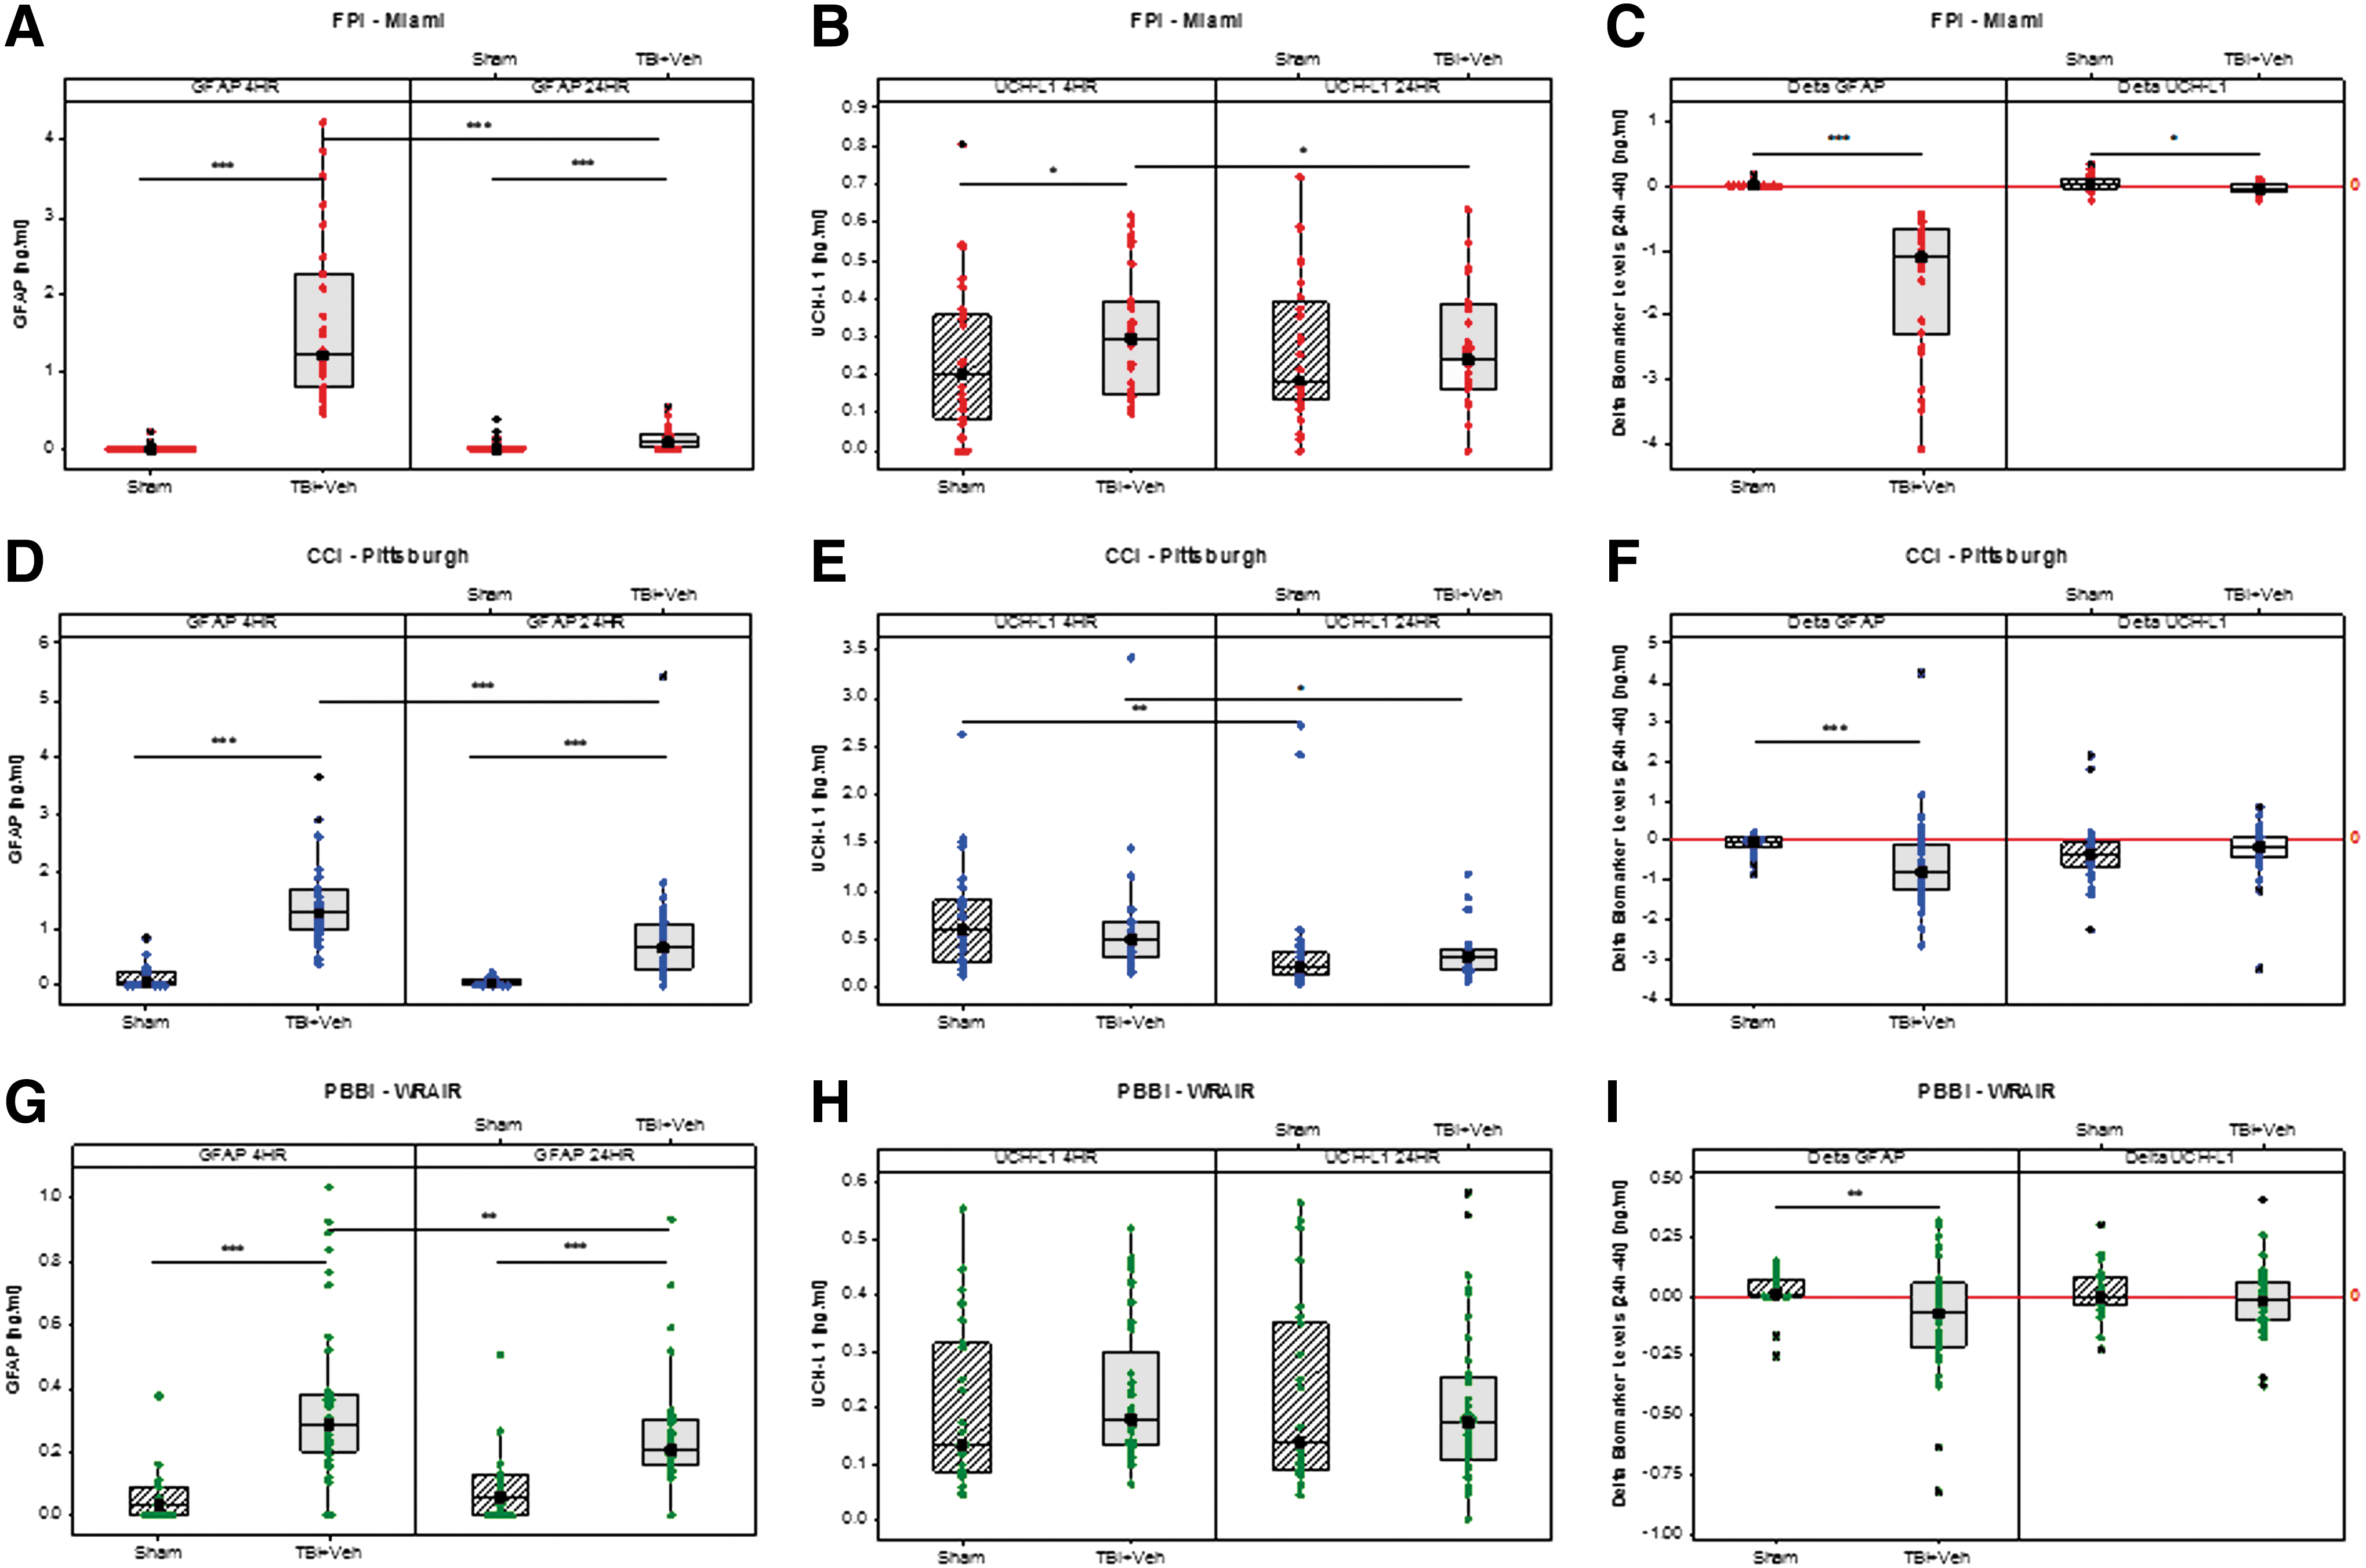
Box-and-whisker plots of glial fibrillary acidic protein (GFAP), ubiquitin C-terminal hydrolase-L1 (UCH-L1), and delta 24–4 h GFAP and UCH-L1 levels in sham and TBI + vehicle (VEH) groups at 4 h and 24 h after fluid percussion injury (FPI), controlled cortical impact (CCI), and penetrating ballistic-like brain injury (PBBI) from rats across the first three treatment trials in Operation Brain Trauma Therapy. (
In FPI + VEH rats, GFAP levels significantly decreased at 24 h (p < 0.0001) compared with the levels at 4 h post-injury, while they did not change throughout the testing period in shams (Fig. 1A).
Conversely, after FPI, UCH-L1 levels differed significantly from shams at 4 (0.3 vs. 0.2 ng/mL, p = 0.04) but not at 24 h (0.24 vs. 0.18 ng/mL, p = 0.62) (Fig. 1B). In addition, UCH-L1 levels at 24 h were significantly decreased in FPI + VEH rats, but not in shams, versus 4 h post-injury (p = 0.038) (Fig. 1B).
Both delta 24–4 h GFAP and UCH-L1 levels in FPI + VEH rats were significantly different from sham (−1.09 vs. 0.006 ng/mL, p < 0.0001 and −0.05 vs. 0.02 ng/mL, p = 0.02) (Fig. 1C).
CCI model
Similar to FPI, after CCI, GFAP levels were significantly increased compared with shams at both 4 h and 24 h (1.28 vs. 0.1 ng/mL, p < 0.0001 and 0.69 vs. 0.05 ng/mL, p < 0.0001) (Fig. 1D). CCI + VEH rats demonstrated an ∼13-fold increase in circulating GFAP levels at 4 h and 14-fold increase at 24 h after injury compared with shams.
In CCI + VEH rats, GFAP levels significantly decreased at 24 h (p < 0.0001) compared with the levels at 4 h post-injury, while they did not change throughout the testing period in shams (Fig. 1D).
Surprisingly, after CCI, UCH-L1 levels did not differ significantly from shams at either 4 or 24 h (0.49 vs. 0.73 ng/mL, p = 0.14 and 0.33 vs. 0.21 ng/mL, p = 0.07) (Fig. 1E). UCH-L1 levels, however, decreased in both sham and CCI + VEH groups at 24 h compared with the levels at 4 h (p = 0.003 and p = 0.02, respectively) (Fig. 1E).
Delta 24–4 h GFAP levels in CCI + VEH rats were significantly different from sham (−0.7949 vs. −0.05 ng/mL, p = 0.001), while delta 24–4 h UCH-L1 levels did not differ between these groups (−0.16 vs. −0.390.21 ng/mL, p = 0.08) (Fig. 1F).
PBBI model
Similar to CCI and FPI, after PBBI, GFAP levels were significantly increased compared with shams at both 4 h and 24 h (0.29 vs. 0.03 ng/mL, p < 0.0001 and 0.21 vs. 0.06 ng/mL, p = 0.00009) (Fig. 1G). PBBI + VEH rats demonstrated an ∼10-fold increase in circulating GFAP levels at 4 h and 4-fold increase at 24 h after injury compared with shams.
In PBBI + VEH rats, GFAP levels significantly decreased at 24 h (p = 0.01) compared with the levels at 4 h post-injury, while they did not change throughout the testing period in shams (Fig. 1G).
UCH-L1 levels did not differ significantly from shams at either 4 or 24 h (0.18 vs. 0.13 ng/mL, p = 0.1 and 0.17 vs. 0.14 ng/mL, p = 0.77) and did not change throughout the testing period in either shams or the PBBI + VEH group (Fig. 1H).
Delta 24–4 h GFAP levels in PBBI + VEH rats were significantly different from sham (−0.07 vs. 0.01 ng/mL, p = 0.009), while delta 24–4 h UCH-L1 levels did not differ between groups (−0.02 vs. −0.001 ng/mL, p = 0.2) (Fig. 1I).
Biomarker correlations
There was a strong correlation between GFAP and UCH-L1 levels at 4 h after injury in FPI + VEH rats (R = 0.72, p < 0.0001) and between GFAP and UCH-L1 levels at 24 h after injury in PBBI + VEH rats (R = 0.52, p = 0.0008), but no other correlations were found.
Comparisons across models
At 4 h post-injury, GFAP was significantly higher in CCI and FPI versus PBBI (p < 0.001) while UCH-L1 was significantly higher in CCI versus FPI and PBBI (p < 0.01 and p < 0.001, respectively) (Fig. 2A). At 24 h post-injury, GFAP was higher in CCI versus FPI and PBBI (p < 0.001) and also higher in PBBI versus FPI (p < 0.05). UCH-L1 was higher in CCI versus PBBI (p < 0.001) (Fig. 2B).
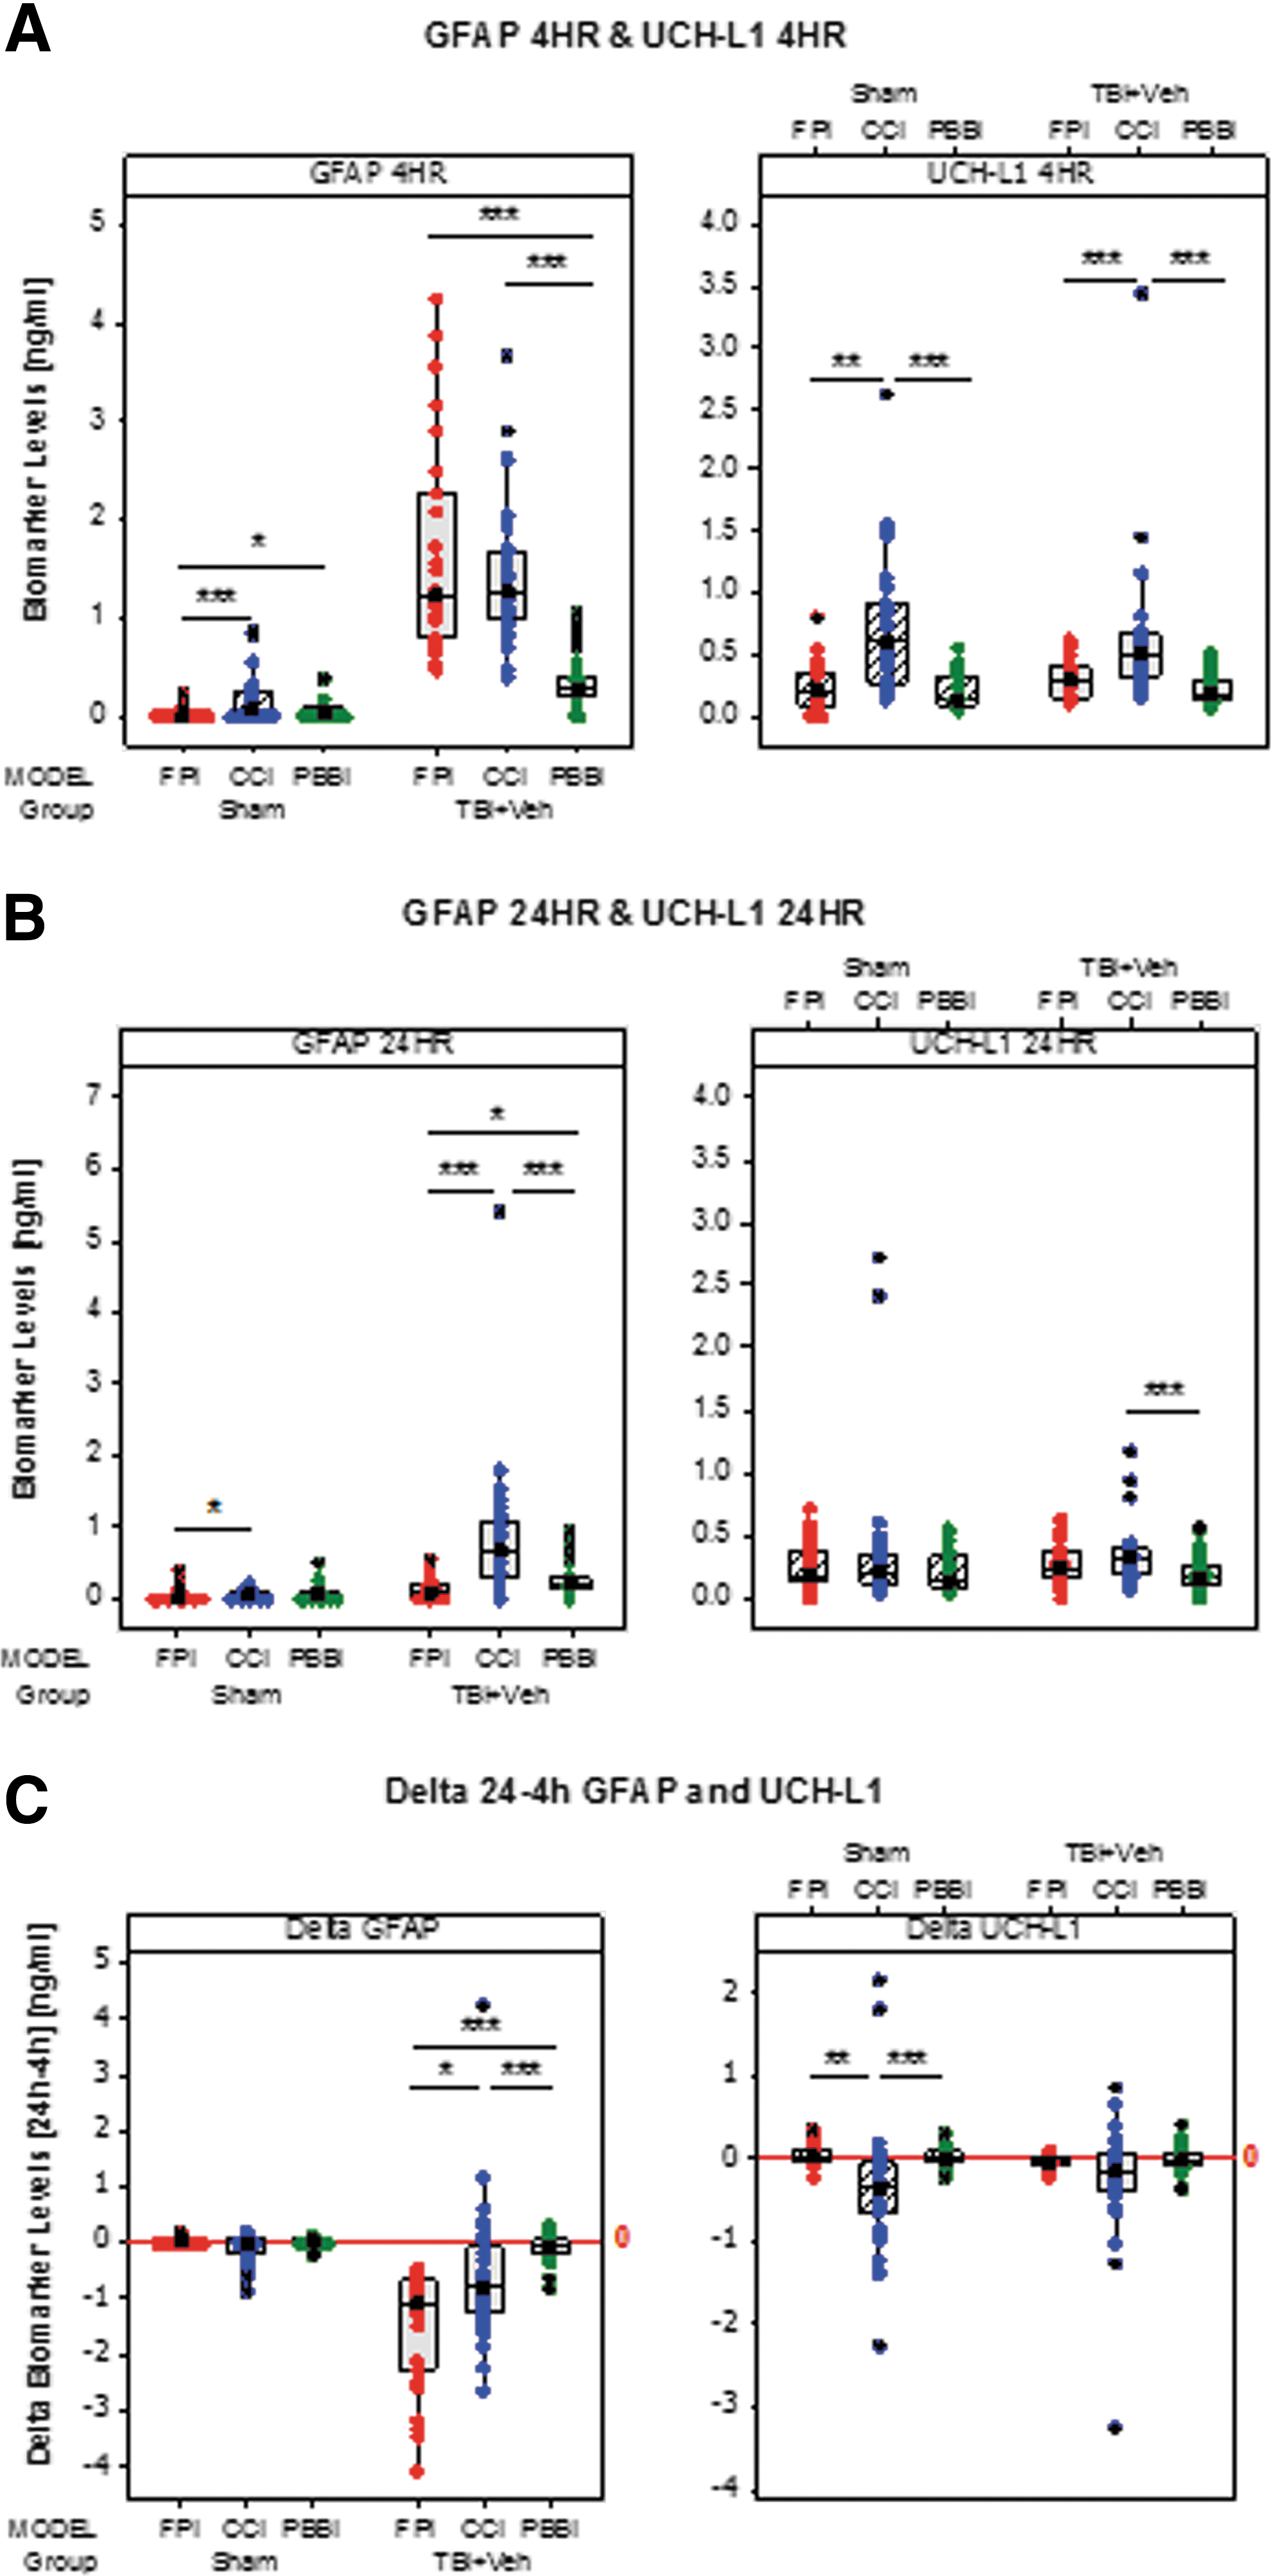
Box plots comparing circulating glial fibrillary acidic protein (GFAP), ubiquitin C-terminal hydrolase-L1 (UCH-L1), and delta biomarker levels across models of traumatic brain injury (TBI). (
Significant differences were also found comparing shams across the models at 4 h, with higher levels in CCI and PBBI versus FPI (p < 0.001 and p < 0.05, respectively) and higher UCH-L1 levels in CCI versus FPI and PBBI (p < 0.001 and p < 0.01, respectively). At 24 h, only GFAP was significantly higher in CCI versus FPI (p < 0.05) (Fig. 2B).
Significant differences were also found comparing delta 24–4 h levels across the models. Delta 24–4 h GFAP levels in injured rats were higher in CCI and PBBI versus FPI (p < 0.05 and p < 0.001, respectively) and higher in CCI versus PBBI (p < 0.001), with no differences in shams. Conversely, sham rats showed higher delta 24–4 h UCH-L1 levels in FPI and PBBI versus CCI (p < 0.01 and p < 0.001, respectively), but no differences were found for delta 24–4 h UCH-L1 levels in injured rats in any of the models (Fig. 2C).
GFAP and UCH-L1 blood levels in relation to histology
Lesion volume and hemispheric or cortical tissue loss were significantly greater in CCI and PBBI versus FPI (p < 0.001) (Fig. 3).
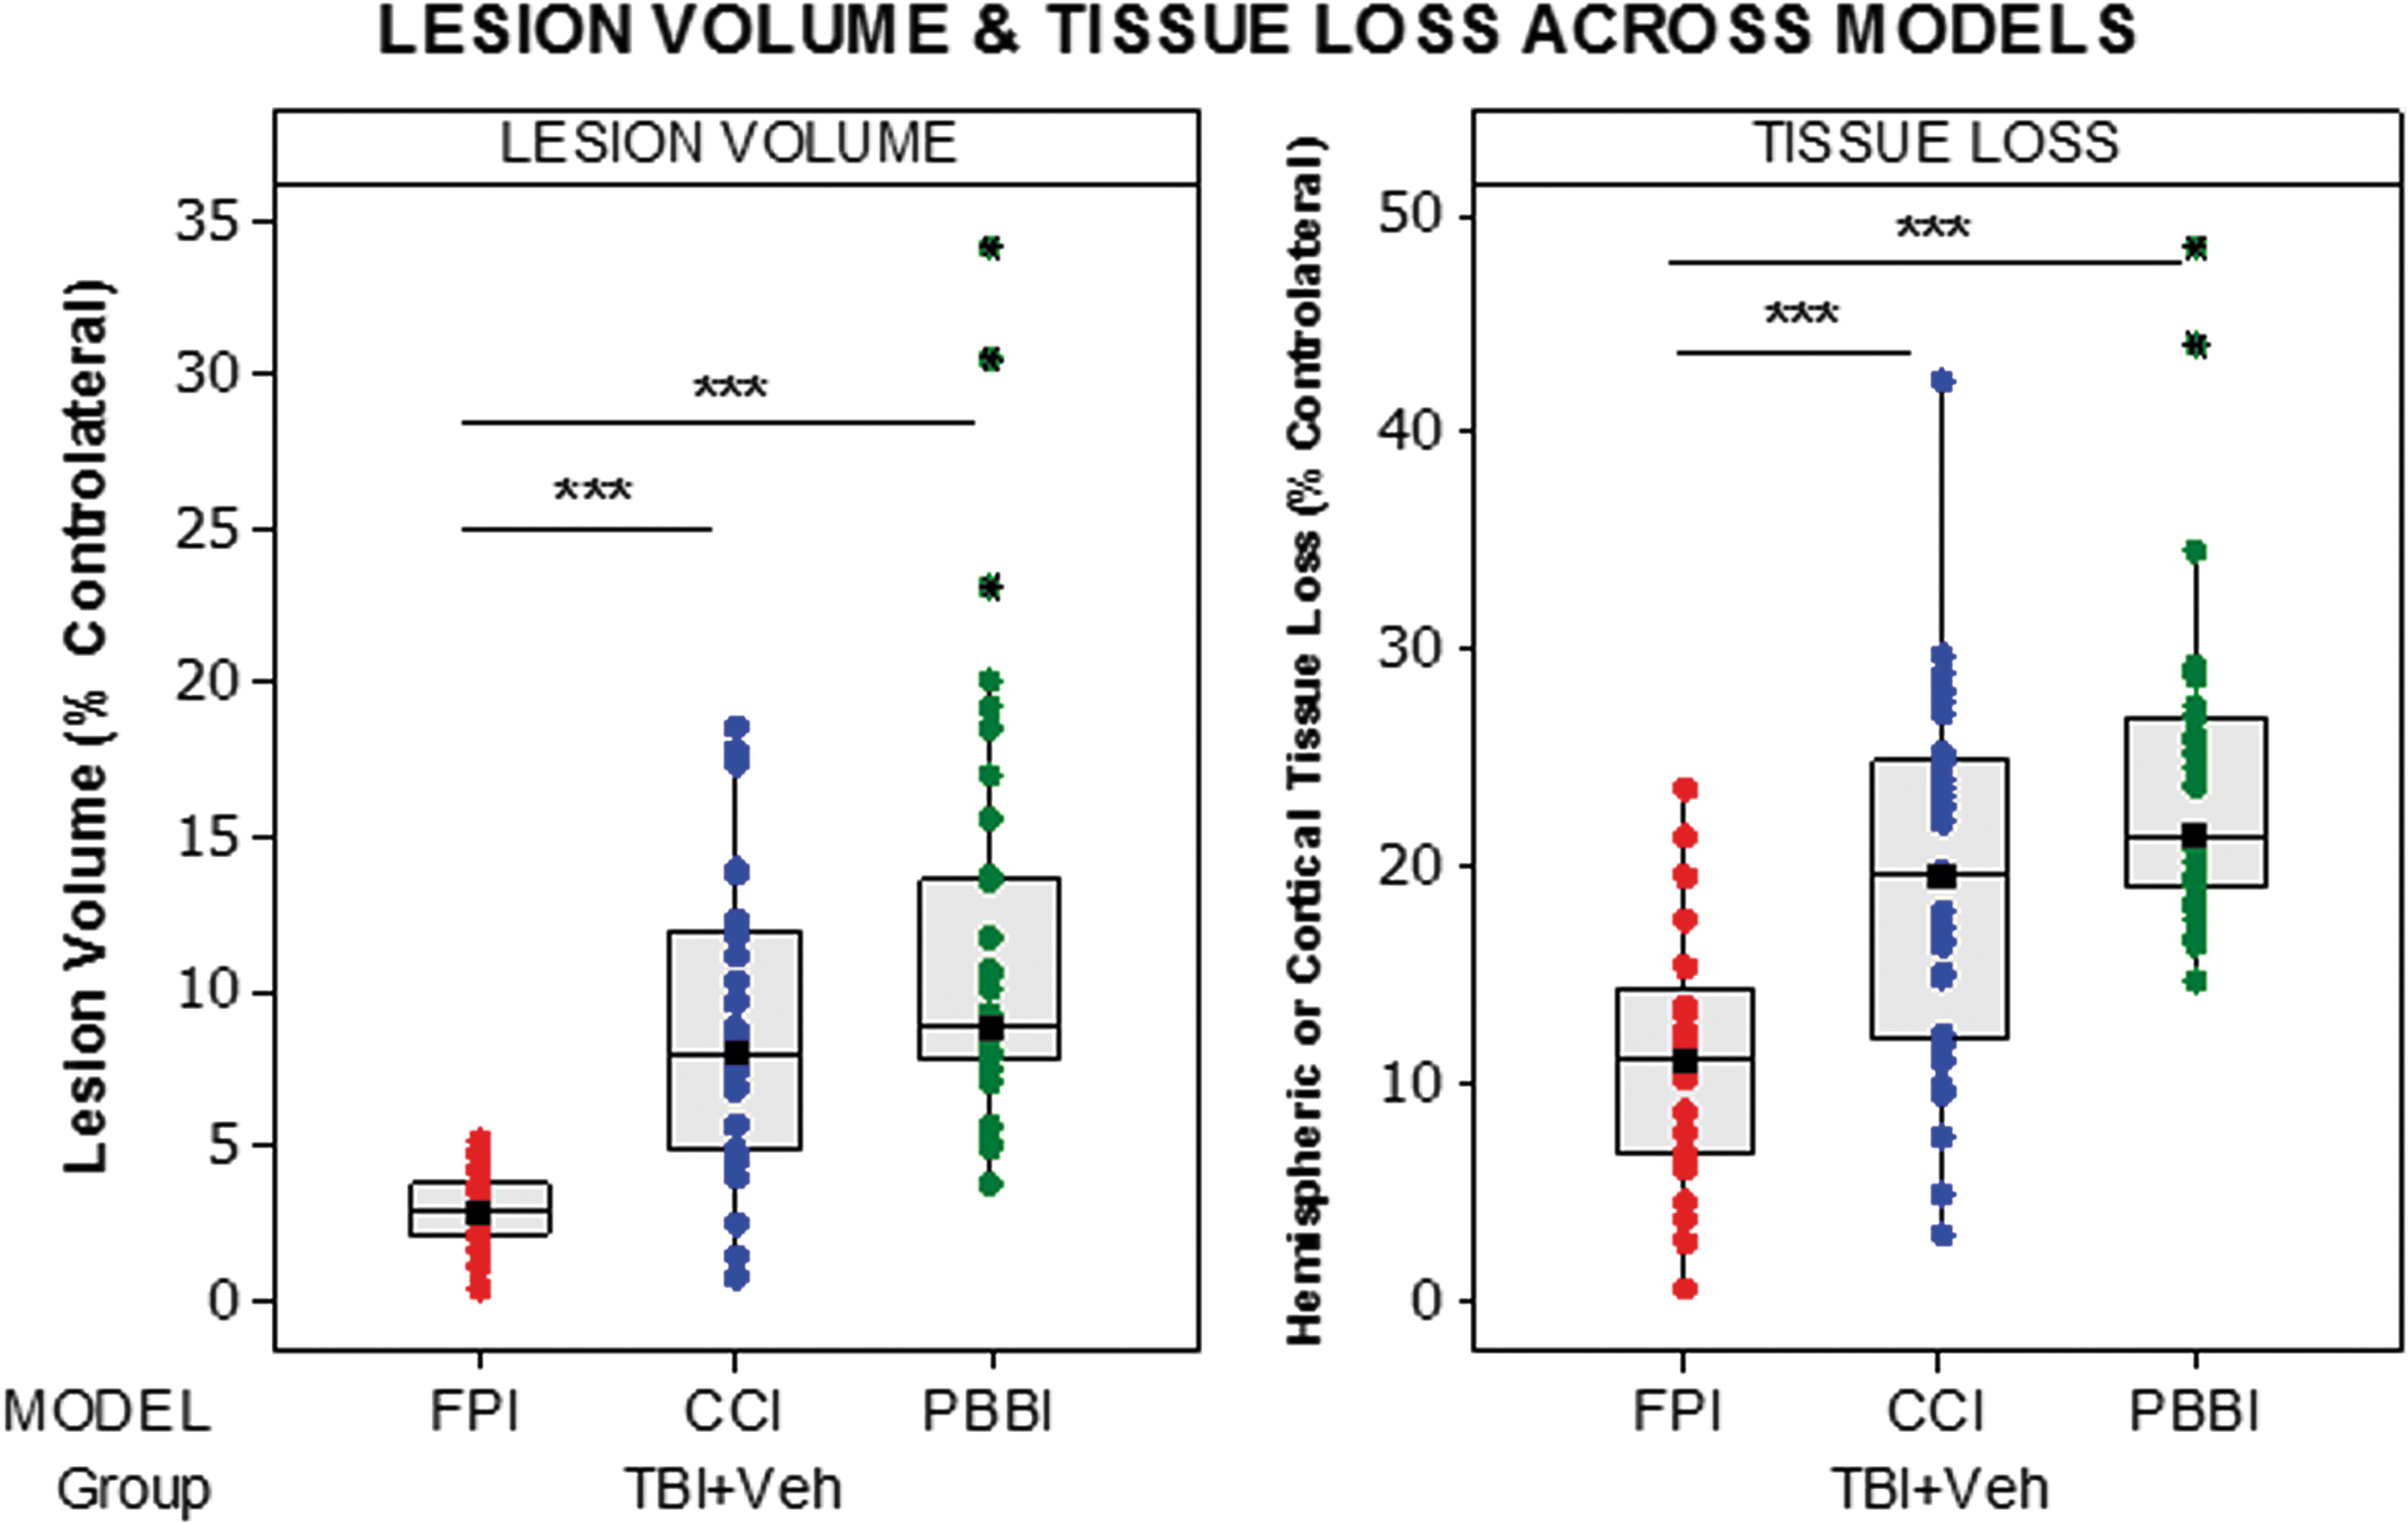
Box plots comparing lesion volume and hemispheric volume loss across the three models of traumatic brain injury (TBI) in Operation Brain Trauma Therapy. Significant differences are indicated with *(p < 0.05), **(p < 0.01), or ***(p < 0.001) (Kruskal-Wallis test followed by post hoc comparisons applying Mann-Whitney U). FPI, fluid percussion injury; CCI, controlled cortical impact; PBBI, penetrating ballistic-like brain injury.
In Figure 4, we show representative GFAP-stained coronal brain images in panel A for each model obtained at 21 days after injury. These images provide a frame of reference for the accompanying biomarker correlations discussed below.
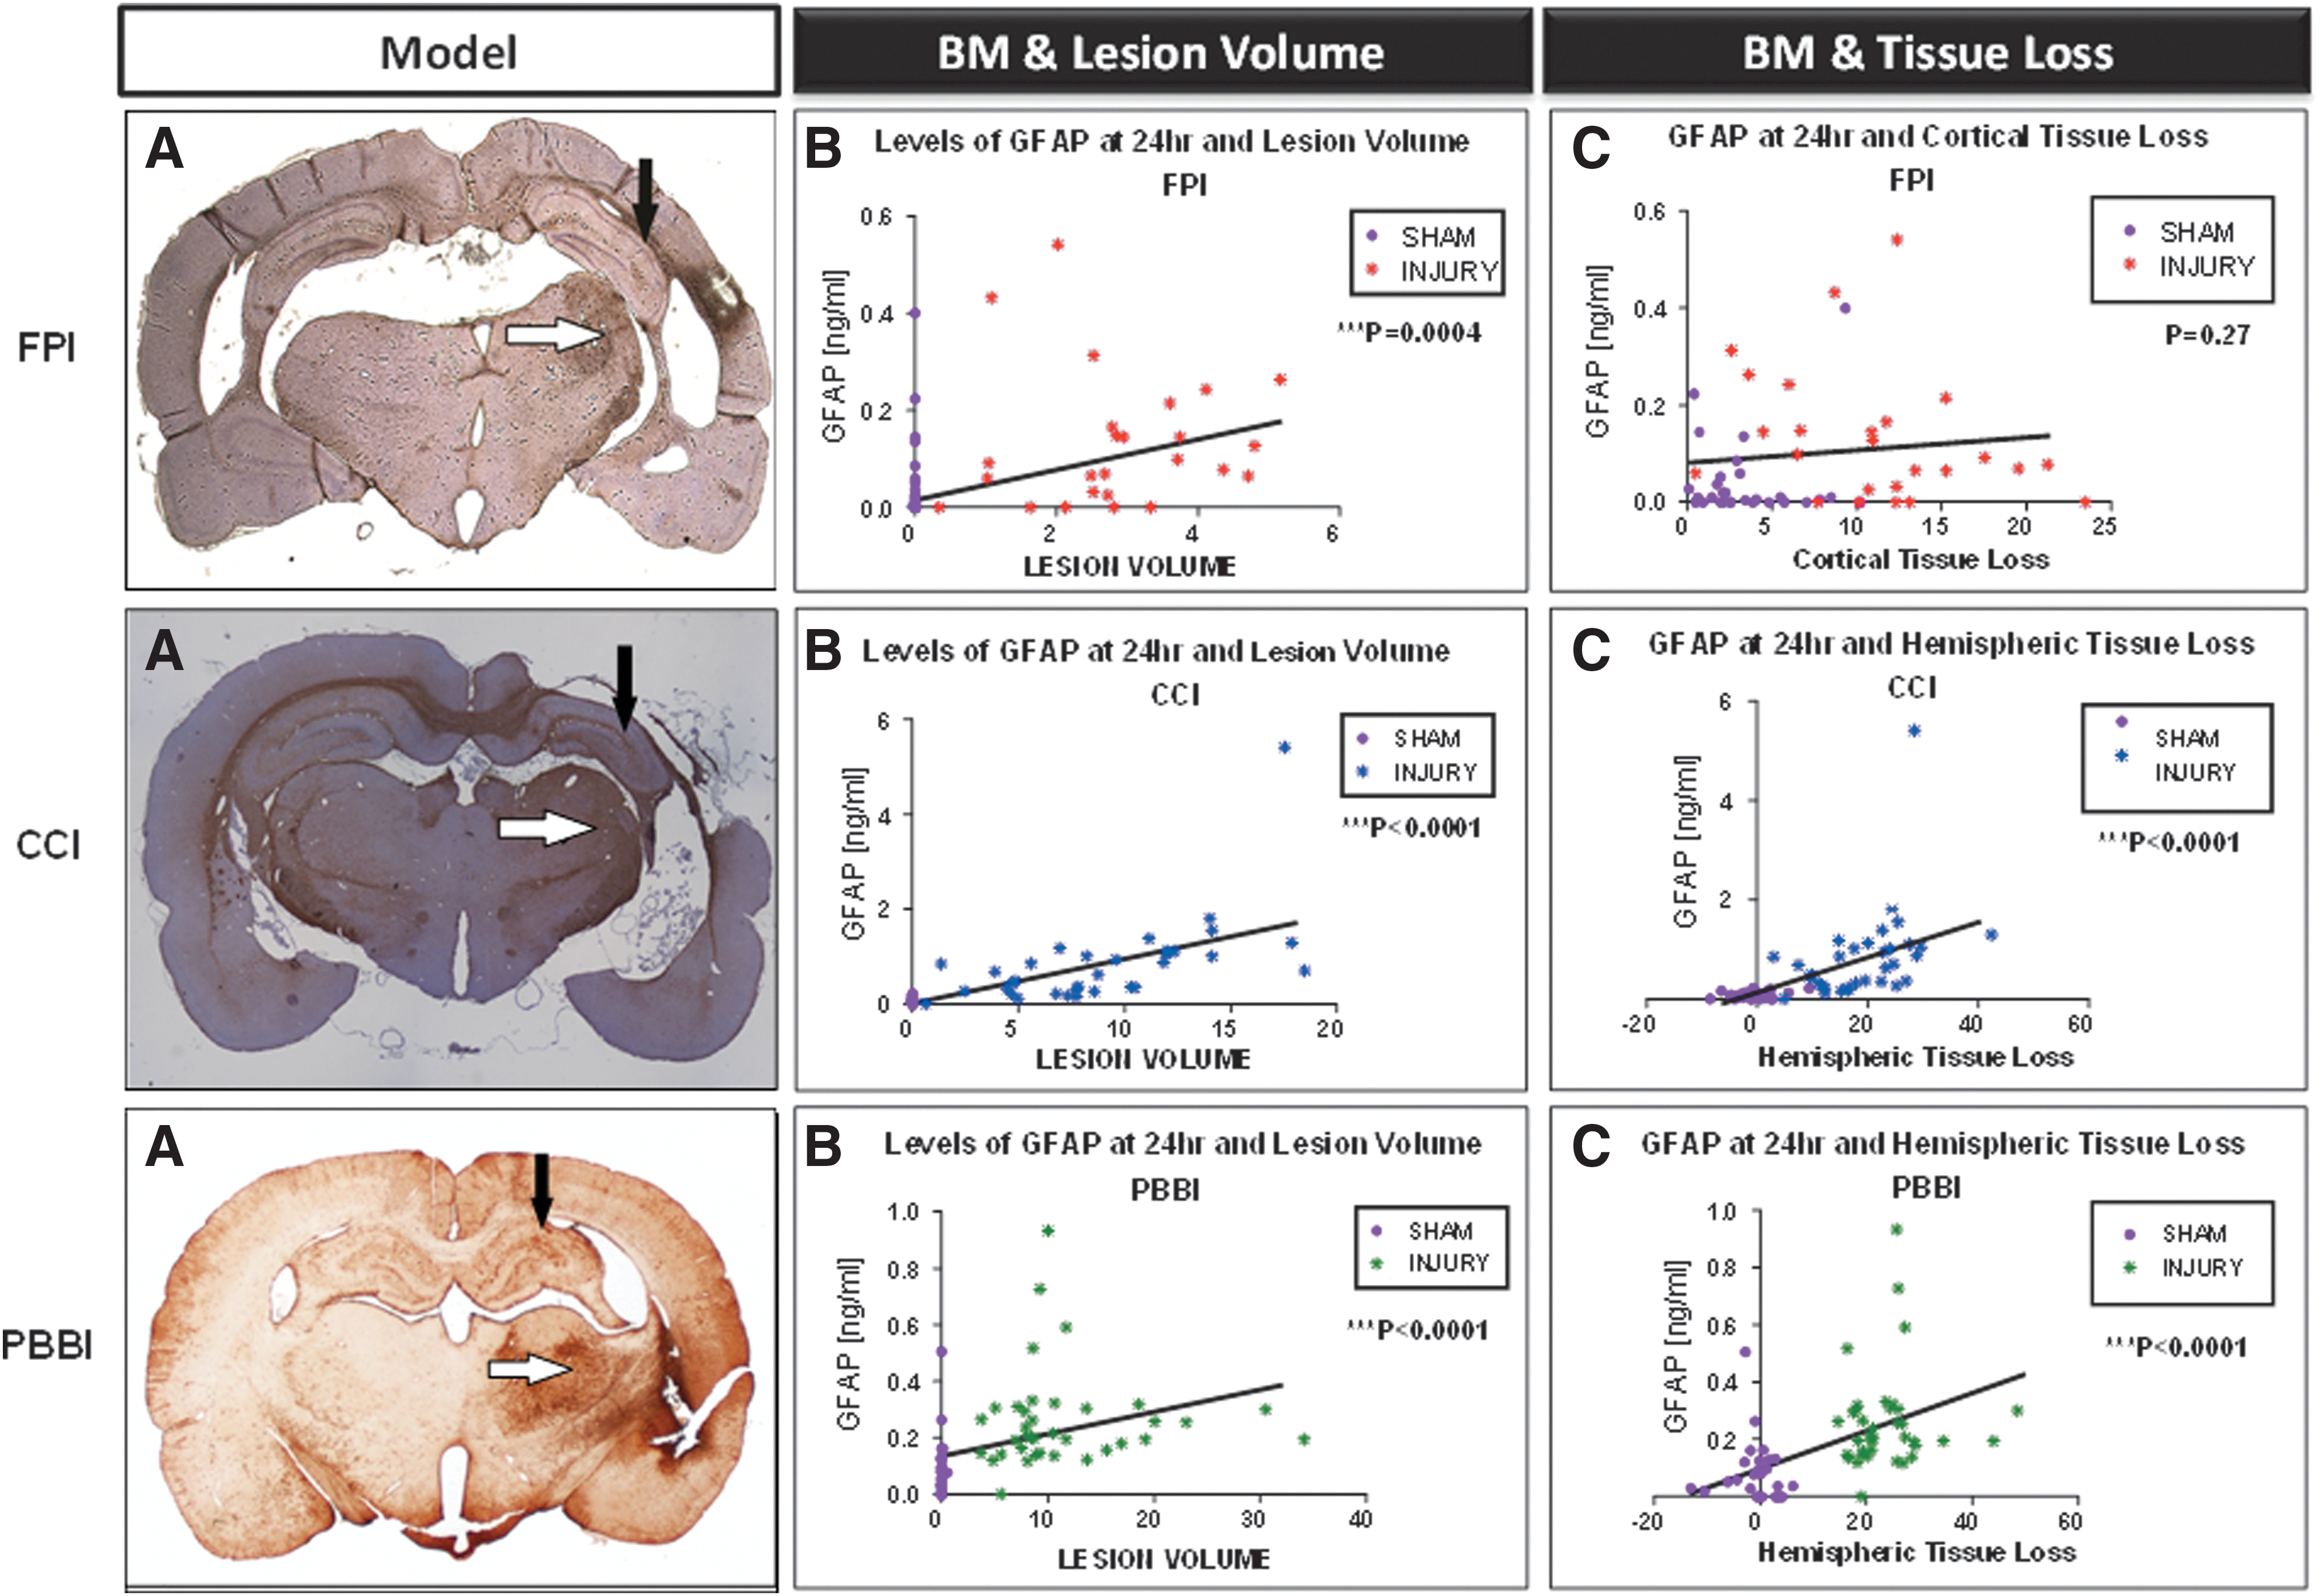
Circulating biomarker levels correlate with neuropathological measures across models in Operation Brain Trauma Therapy (OBTT). (
FPI model
GFAP levels at 4 h were also strongly correlated with lesion volume and cortical tissue loss (R = 0.80, p < 0.0001. and R = 0.61, p < 0.0001). GFAP levels at 24 h correlated with lesion volume (R = 0.47, p = 0.0004) but not with cortical tissue loss (Fig. 4 B, C and supplementary Fig. 1 A, B; see online supplementary material at
CCI model
GFAP levels were strongly correlated with lesion volume and hemispheric tissue loss at 4 h (R = 0.76, p < 0.0001 and R = 0.73, p < 0.0001) and 24 h (R = 0.85, p < 0.0001 and R = 0.80, p < 0.0001) (Fig. 4 B, C and supplementary Fig. 1 A, B; see online supplementary material at
PBBI model
GFAP levels were strongly correlated with lesion volume and hemispheric tissue loss at 4 h (R = 0.62, p < 0.0001 and R = 0.59, p < 0.0001) and 24 h (R = 0.66, p < 0.0001 and R = 0.57, p < 0.0001) (Fig. 4 E, F and supplementary Fig. 1 A, B; see online supplementary material at
GFAP and UCH-L1 levels in relation to behavioral outcomes
MWM latency was significantly greater in CCI and PBBI versus FPI (p < 0.001), consistent with a greater functional impairment in CCI and PBBI. Similarly, percent time in target quadrant on the probe trial was lowest in PBBI versus both CCI and FPI (p < 0.001 and p < 0.001, respectively), consistent with a particularly robust cognitive deficit in PBBI (Fig. 5).

Box plots comparing Morris water maze (MWM) latency and percent time in target quadrant on the probe trial across the three models of traumatic brain injury (TBI) in Operation Brain Trauma Therapy (OBTT). Overall the PBBI model exhibited the most robust cognitive deficit. Please see text for details. Significant differences are indicated with *(p < 0.05), **(p < 0.01) or ***(p < 0.001) (Kruskal-Wallis test followed by post hoc comparisons applying Mann-Whitney U.) FPI, fluid percussion injury; CCI, controlled cortical impact; PBBI, penetrating ballistic-like brain injury; Veh, vehicle.
FPI model
GFAP at 4 h correlated significantly with MWM latency (R = 0.5, p = 0.0002), but no other correlations were found (Fig. 6).

Scatter plot of glial fibrillary acidic protein (GFAP), ubiquitin C-terminal hydrolase-L1 (UCH-L1) blood levels in relation to behavioral outcomes. (
CCI model
GFAP at 4 h weakly correlated with MWM latency (R = 0.29, p = 0.03), but no other correlations were found (Fig. 6).
PBBI model
Both GFAP and UCH-L1 at 4 h correlated weakly with MWM latency (R = 0.35, p = 0.002 and R = −0.36, p = 0.03), but no other correlations were found (Fig. 6).
Discussion
In view of the clinical and pathoanatomic heterogeneity of TBI, numerous models have been developed in an attempt to mimic the many aspects of the human injury. The variability in experimental approaches among studies, however, makes comparison of results across models and trials difficult. Also, direct comparisons of various outcomes between pre-clinical TBI models are uncommon.
This is particularly true for circulating biomarkers. One working premise of OBTT is that successful translation of pre-clinical research into human studies necessitates the development of objective, highly sensitive methods for the evaluation, refinements, and standardization of TBI animal models, thereby allowing results to be comparable and replicable across studies and laboratories.
In addition, OBTT, by using three distinct models, has the potential to contribute in two manners. First, it may identify robust therapies crossing all models and, thus, agents that would be optimal for large randomized controlled trials. Second, it may provide insight into therapeutic efficacy as it relates to a specific model and may thus be able to guide precision medicine approaches in specific patient injury phenotypes. Circulating biomarkers may aid in characterizing insults in both the pre-clinical and clinical setting in this regard and serve as surrogate theranostic tools in pre-clinical screening and clinical trials. These potential opportunities are being investigated within the unique and powerful OBTT framework.
To this end, this report provides unique assessments, characterizations, and comparisons of multiple gold-standard pre-clinical TBI models using conventional outcome metrics and novel candidate biomarkers of brain injury from the first three trials of OBTT. 3 –6 In particular, we used clinically relevant circulating biomarkers to elucidate fundamental cellular injury and patterns and define/quantify different pathophysiological responses triggered by TBI in distinct rat TBI models.
Given that considerable variation can be seen in a model despite use of standardized protocols, 10 in the present study, validated biomarkers were first assessed to confirm that the different models described in OBTT behave in a reproducible and predictable fashion. Across the first three trials of OBTT, there was no evidence for differences in levels of GFAP and UCH-L1 at both 4 h and 24 h after injury and also for the delta levels that were investigated (Fig. 1), nor were there major differences in behavioral and neuropathological outcomes in either shams or TBI + VEH groups comparing the first, second, and third studies within a given TBI model.
Taken together, we are pleased to report that OBTT investigators were thus able to replicate studies with constant data that matched the initial results and emphasize the stability of the models used in OBTT—namely, that circulating biomarker data can be successfully used to reflect this fact.
Once stability was established, data from each model from all three trials were pooled for analysis, increasing the sample size and thus conferring additional statistical power to detect meaningful differences among models and facilitating evaluation of correlations with the other outcomes. This approach provided a powerful tool allowing a number of unique assessments to be made in nearly 200 sham and TBI + VEH treated rats across the three models, taking advantage of the special opportunity afforded by the OBTT consortium. 11
This study is the first in which two pathobiologically diverse biomarkers reflecting damage to different brain compartments (glia and neuron) were simultaneously evaluated in three pre-clinical models of TBI—namely, FPI, CCI, and PBBI. Noteworthy, our models embrace a significant proportion of the spectrum of pathophysiological heterogeneity observed in patients with TBI, ranging from the combination of focal cortical contusion and diffuse subcortical neuronal injury of FPI 12 to cavity formation with white matter degeneration, hemorrhage, edema, and gliosis of PBBI. 13
The most robust finding in our pre-clinical biomarker work in OBTT is that GFAP acts similarly in all three models with significant increases at early time points after injury compared with shams. Specifically, in injured rats, increased GFAP levels were detectable at 4 h post-injury and declined through 24 h, although remaining higher than in shams. Across the model, however, we found significant differences in terms of levels and temporal patterns of GFAP. These changes were reflected by significant differences in delta 24–4 h GFAP levels across the models.
Although from a pathophysiological perspective the variability in GFAP levels across the models may be related to the differences in injury severity and lesion volume, our findings demonstrate that these cannot be the only explanation. Indeed, PBBI, our most severe model as assessed by behavioral and neuropathological outcomes, presented the lowest levels of GFAP at 4 h (significantly lower than CCI and FPI). Other potential explanations for these findings involve location and type of injury, vascular damage, and disruption of the blood–brain barrier (BBB) or of glymphatic flux, 14 and possibly effects on other parameters such as the level of cerebral blood flow (CBF) within the injured tissue, among others.
Location of the injury could determine the cell population mainly affected by the TBI, leading to distinct patterns of disintegration and release of cell-type–specific proteins into the biofluids. Experimental and human studies have shown that the ratio of glia to neurons varies from one brain region to another, sometimes dramatically, ranging from a glia to neuron ratio of about 1:1 in the cortex to 17:1 in the thalamus, 15 and also differs from species to species. A seminal study in the FPI model also showed that different brain regions are more physically vulnerable to the primary injury and that the distribution of the resulting BBB permeability varies considerably depending on the injury location. 16
Supporting our hypothesis, studies in stroke have shown distinct patterns of biomarkers released in relation to stroke location. 17 Further, we previously presented evidence that different profiles of biomarker release are associated with differences in structural damage and therefore distinct types of injury after TBI. 9,18
It also seems plausible that the BBB has a major influence on the levels and time course of biomarkers. Experimental and human studies have established that BBB disruption is a hallmark of TBI that allows the passage of macromolecules from the brain parenchyma into the bloodstream and vice versa. 19 BBB permeability after CCI is reported to be maximal at 1 and 4 h after injury and reduced at 8–24 h, with localization primarily within and around the contusion. 20 FPI produces a mix of local and diffuse effects on the BBB, with permeability at 1 h, which largely resolves by 24 h. 16 Although the extent of BBB leakage is linked to injury severity, PBBI may cause a more sudden disruption and rapid destruction of neuronal and astroglial cells, thus resulting in an earlier appearance of biomarkers in the bloodstream. 21 Supporting this, a recent experimental study has shown the peak of serum UCH-L1 as early as 5 min after injury in PBBI. 22
Differences between models in the level of disruption of glymphatic flux could also play a very important role in determining the time course of biomarker clearance from brain to blood, as recently shown by Plog and associates. 14 The glymphatic pathway is an exciting new construct that deserves additional exploration.
Thus, circulating levels of brain injury markers may vary as a function of several key variables including distinct patterns of BBB disruption. This hypothesis has potential important implications. Based on these observations, we can speculate that also in humans, the levels and kinetics of the markers would very likely be affected by other factors besides simply severity of primary injury. Ongoing kinetic studies will help elucidate the clinical meaning of these findings, providing potentially valuable information and novel prospects for therapeutic approaches.
To this end, because BBB breakdown determines penetration and distribution to the brain of molecules that are normally restricted from the central nervous system, it might also help neuroprotective drugs reach their targets. 23 Thus, specific circulating biomarker profiles might be helpful to guide and optimize the treatment. Further studies are warranted.
In contrast to GFAP, in our study, UCH-L1 had limited value and was only increased versus sham in a single model (FPI) and at a single time point (4 h). The lack of a relation between UCH-L1 levels in blood and neuropathological and behavioral outcomes may be because of the 4 h sampling time in our study. Biokinetic analyses suggest that UCH-L1 concentration in blood increases significantly very acutely after injury. 24 This observation has also been confirmed recently in the PBBI model where UCH-L1 levels were elevated at 5 min post-injury and rapidly decreased by 2 h. 22
The finding of increased circulating biomarker levels at 4 h after sham craniotomy is of interest given evidence of significant brain damage after craniotomy, particularly the more substantial craniotomy used in CCI, and this is supported by increase in UCH-L1 levels in shams in CCI and also the GFAP and delta 24–4 h UCH-L1 data. Our finding supports and extends previous work showing that the traditional sham operation results in readily detectable circulating GFAP levels after craniotomy, which is most likely a consequence of the alterations of the BBB and disruption of the network of nerve fibers and blood vessels connecting the rat brain and the skull produced by the drilling or trephination processes. 25
Remarkably, in the FPI model—where the lowest GFAP levels were seen in shams—the craniotomy is performed 24 h before TBI, in contrast to CCI and PBBI, and thus the time of blood sampling in our study was much more tightly coupled to the craniotomy in CCI and PBBI than in FPI. In any case, we have provided evidence of a difference in the effects of craniotomy across models.
Another finding of our study was the dynamic change (delta) in GFAP levels after injury in all the models and a significant difference across models. These observations have two implications. First, they provide evidence of a consistent decreasing pattern of GFAP after injury that may have clinical utility in TBI. The use of a delta might improve the overall diagnostic performance of GFAP and be included as a criterion for TBI definition. 26 Second, our data support the concept of distinct pathophysiological mechanisms underlying the biomarker dynamics across models potentially related to the extent and/or duration of BBB opening, glymphatic flux, degree of perfusion of injured brain tissue, secondary insults, and/or associated prolonged cell death or axonal injury cascades. Future studies will be required to determine whether the delta approach provides added value helping to differentiate between the various causes of brain injury.
OBTT models are also extensively characterized pathologically and behaviorally according to rigorous protocols that match the highest standards. Although recent research compared circulating biomarker levels with histology and behavior in a rat model of TBI, 27,28 the ability of biomarkers to predict those outcomes is still unknown.
Because this association is essential to assess whether biomarkers might also serve as surrogate end-points, we evaluated the relationship between circulating biomarker levels and various neuropathological and behavioral measures across models in OBTT. We noted a marked correlation between GFAP levels at 4 h and lesion volume and hemispheric and/or cortical tissue loss across the models, supporting the hypothesis of a causal relation between the GFAP release into blood and the amount of astroglial cell destruction caused by the different injuries.
Further, we revealed a significant correlation between GFAP levels and cognitive deficits, assessed in terms of the latency to locate a hidden platform in the MWM across models. As the severity of behavioral deficits depends on the severity of the injury, this correlation fits well with other lines of evidence that suggest a link between the GFAP release in blood and the magnitude of structural damage.
It is still unclear, however, why we noted a lack of a correlation between GFAP levels and probe trial results. One reason might be that spatial learning and working memory depend on distinct brain regions and neurotransmitter systems. 29 Further study is needed.
In any case, this is the first pre-clinical study, to our knowledge, to explore and demonstrate consistent relationships between initial GFAP levels and later development of neuropathological damage and behavioral deficits in a large set of animals across three different models. Our data provide evidence that GFAP can be used to reliably detect damage and destruction in brain tissue and as a surrogate marker for predicting outcomes in pre-clinical TBI models. Given the exceptional performance of acute circulating GFAP in predicting ultimate histological damage in the setting of contusion (contusion volume and tissue loss), correlation analysis to neuropathological findings in clinical TBI is also worthy of additional exploration.
Some limitations of our study should be recognized. First, a detailed analysis of the UCH-L1 kinetics, in the initial 6 h, might have helped to identify an optimal time window for this marker, potentially leading to different findings. Ongoing studies by the OBTT consortium have begun collecting blood samples at 1 h after injury to address UCH-L1 dynamics more completely.
Second, metabolism in rats is likely accelerated versus humans. As a result, both the half-life and the kinetics of circulating brain damage markers differ between these species. For successful translation of these pre-clinical findings, further investigations and validation in clinical studies will be needed. We did not assess BBB injury, glymphatic flux, or CBF across the models, and that information might greatly aid in interpreting the biomarker finding. The overall goal of OBTT, however, is therapy screening for clinical translation, and mechanistic studies are outside of the scope of the project.
Finally, we used a research prototype immunoassay for GFAP and UCH-L1 determination. The technical improvement and future development of standardized tests is likely to expand the assay range, allowing highly sensitive and more precise quantification of GFAP and UCH-L1 in serum and plasma.
Conclusion
We have characterized experimental models of TBI using circulating brain injury biomarkers and have shown that different models produced distinct biomarker profiles replicable across experiments. These findings provided robust evidence that biomarkers, in particular GFAP, are objective, highly sensitive, and valuable means for characterization, standardization, and optimization of TBI animal models. Our findings provide insight into the pathophysiological mechanisms in brain triggered by TBI in distinct experimental models, helping advance our understanding of TBI while providing opportunities for a successful translational research.
Importantly, early circulating levels of GFAP appear to be particularly useful in predicting ultimate tissue loss across models, and given the ease of assessing serum biomarkers in contrast to labor intensive volumetric analysis, 4 or 24 h serum GFAP might represent a substitute for histological end-points and a valuable screening tool in pre-clinical model assessment. Finally, taken together with the findings in our studies of simvastatin 30 and levetiracetam, 31 24 h GFAP has potential as a theranostic tool in pre-clinical investigations. 32 Based on the work of OBTT in this and the other aforementioned reports, the potential utility of GFAP as a theranostic biomarker also merits exploration in clinical TBI.
Footnotes
Acknowledgments
We are grateful to the U.S. Department of Defense grants WH81XWH-10-1-0623 and WH81XWH-14-2-0018 for generous support. We would like to thank Col. Dallas Hack for his strong support of our program, his vision for TBI research, and his scientific input. We also thank Dr. Kenneth Curley for his administrative support and his many contributions to identification of emerging therapies. We thank Dr. Brenda Bart-Knauer for her support of our program and her administrative assistance. We thank Linda Ryan for administrative support with budgetary issues across the consortium, Fran Mistrick for other administrative and coordinating support, and Marci Provins and Natalie Nieman for assistance with manuscript preparation. We thank Rebecca Pedersen, Justin Sun, Ofelia Furones-Alonso, Milton Martinez, Juliana Sanchez-Molano, William Moreno, Ryan Treu, Jessie Truettner, Hong Q. Yan, PhD, Michelle Ma, Jeremy Henchir, and Keri Feldman for outstanding technical support in the individual TBI models across the consortium. We thank Drs. Samuel Poloyac and Philip Empey for valuable contributions to the drug treatment protocols.
This material has been reviewed by the Walter Reed Army Institute of Research. There is no objection to its presentation and/or publication. The opinions or assertions contained herein are the private views of the authors, and are not to be construed as official, or as reflecting true views of Department of the Army or Department of Defense.
Author Disclosure Statement
Dr. Hayes and Mr. Richieri own stock and are both officers of Banyan Biomarkers Inc. Drs. Hayes and Catania, Mr. Richieri, and Ms. Glushakova are employees and receive salaries and stock options from Banyan Biomarkers Inc. Dr. Wang is a former employee of Banyan Biomarkers Inc. and owns stock. Drs. Hayes and Wang also receive royalties from licensing fees and as such all of these individuals may benefit financially as a result of the outcomes of this research or work reported in this publication. For the remaining authors, no competing financial interests exist.
References
Supplementary Material
Please find the following supplemental material available below.
For Open Access articles published under a Creative Commons License, all supplemental material carries the same license as the article it is associated with.
For non-Open Access articles published, all supplemental material carries a non-exclusive license, and permission requests for re-use of supplemental material or any part of supplemental material shall be sent directly to the copyright owner as specified in the copyright notice associated with the article.
