
Abstract
We aimed to generate two-dimensional (2D) unfolded cortical maps from magnetic resonance (MR) images to delineate the location of traumatic brain injury (TBI)-induced cortical damage in functionally diverse cytoarchitectonic areas of the cerebral cortex, and to predict the severity of functional impairment after TBI based on the lesion location and extent. Lateral fluid-percussion injury was induced in adult rats and T2 maps were acquired with magnetic resonance imaging (MRI) at 3 days post-TBI. Somatomotor deficits were assessed based on the composite neuroscore and beam balance test, and spatial learning was assessed in the Morris water maze. Animals were perfused for histology at 13 days post-injury. A 2D template was generated by unfolding the cerebral cortex from 26 sections of the rat brain atlas, covering the lesion extent. Next, 2D unfolded maps were generated from T2 maps and thionin-stained histological sections from the same animals. Unfolding of the T2 maps revealed the lesion core in the auditory, somatosensory, and visual cortices. The unfolded histological lesion at 13 days post-injury was 12% greater than the MRI lesion at 3 days post-TBI, as the lesion area increased laterally and caudally; the larger the MRI lesion area, the larger the histological lesion area. Further, the larger the MRI lesion area in the barrel field of the primary somatosensory cortex (S1BF), upper lip of the primary somatosensory cortex (S1ULp), secondary somatosensory division (S2), and ectorhinal (Ect) and perirhinal (PRh) cortices, the more impaired the performance in the beam balance and Morris water maze tests. Subsequent receiver operating characteristic analysis indicated that severity of the MRI lesion in S1ULp and S2 was a sensitive and specific predictor of poor performance in the beam balance test. Moreover, MRI lesions in the S1ULp, S2, S1BF, and Ect and PRh cortices predicted poor performance in the Morris water maze test. Our findings indicate that 2D-unfolded cortical maps generated from MR images delineate the distribution of cortical lesions in functionally different cytoarchitectonic regions, which can be used to predict the TBI-induced functional impairment.
Introduction
T
Severity of TBI in the clinic is often scored using the Glasgow Coma Scale, which has limited value in assessing lesion pathology, location, or severity. 4 In the pre-clinical laboratory, severity of TBI is often graded based on the acute mortality in the injured cohort, duration of apnea, time to return of the righting reflex, and the fluid pressure or piston depth used to induce the TBI, none of which have any remarkable value for analyzing the lesion location or extent in the cerebral cortex. 5 –8 Methodologies to accurately outline the cortical damage to predict the type of post-TBI disabilities in a given subject would provide an opportunity for tailored personalized preventive and rehabilitative treatments.
Here we tested a hypothesis that two-dimensional (2D) unfolded cortical maps generated from structural magnetic resonance (MR) images would provide a reliable method to assess the lesion location and extent in different cytoarchitectonic areas of the cerebral cortex, and to predict the functional abnormalities in a given animal. We used magnetic resonance imaging (MRI), histological, and behavioral data sets generated in a previous study of a lateral fluid-percussion injury (FPI) model of TBI in the rat. 9 We expanded our previous analysis by 1) generating an unfolded cortical map from T2 maps, and comparing it with an unfolded map generated from thionin-stained sections of the same animal, and 2) analyzing the association between the location of the lesion in different cytoarchitectonic areas of the cortex and the severity of behavioral impairments. Our findings indicate that unfolding the lesioned cortex imaged with MRI on the atlas-based cytoarchitectonic map provides a tool to predict the severity of cognitive and behavioral impairment.
Methods
Study design
The study design is shown in Figure 1. For a detailed description of the lateral FPI, behavioral tests, and MRI procedures, see the study by Kharatishvili and coworkers. 9 Briefly, adult (12 weeks old) male Spraque–Dawley rats were anesthetized, the skull was exposed, and a 5 mm craniotomy was made between bregma and lambda on the left convexity (anterior edge of the craniotomy 2.0 mm posterior from bregma, lateral edge of the craniotomy 6.0 mm lateral to midline), leaving the dura intact. One group of rats (n = 17) received a lateral FPI with an impact pressure of 2.05 ± 0.06 atm (moderate injury, acute mortality 8%, apnea time range: 0–15 sec) and the other (n = 15) with 3.12 ± 0.05 atm (severe injury, acute mortality 30%, apnea time range: 0–45 sec).
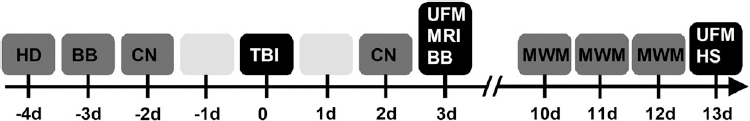
Study design. Prior to lateral fluid-percussion-induced traumatic brain injury (TBI), all animals went through a baseline beam balance (BB) and composite neuroscore (CN) test after the handling day (HD). At 2 days post-injury, CN was performed, followed by BB and magnetic resonance imaging (MRI) on day 3. On days 10–12, all animals underwent the Morris water maze (MWM) test and the brains were perfusion-fixed on day 13 for histological analysis. Unfolded maps (UFM) of the cortical lesion were constructed from the MRI images (3 days post-TBI) as well as from the thionin-stained histological sections (13 days post-TBI) available from the same animals.
Over the 13 day post-injury follow-up, animals underwent a series of behavioral tests, including the beam balance, composite neuroscore, and Morris water maze tests (Fig. 1). In the beam balance test, rats were perpendicularly placed on an elevated 31.5 cm long beam for a duration of 60 sec. In the composite neuroscore test, we assessed 1) left and right contraflexion, 2) left and right hindlimb flexion, 3) left and right lateral pulsion, and 4) ability to stand on an inclined board in a vertical and horizontal (left and right) position. Each component was scored from 0 (poor) to 4 (normal) (maximum score 28). The Morris water maze test was used to assess the spatial memory. We adopted a 3 day paradigm according to Thompson and colleagues. 10
Baseline scores in the beam balance and composite neuroscore tests were assessed 2 or 3 days before TBI or sham operation, respectively. Post-injury scores for the beam balance and neuroscore tests were obtained at 3 or 2 days after injury, respectively (Fig. 1). At 3 days post-injury, animals were imaged with 4.7T MRI to obtain T2 maps. A spin-echo sequence was used to acquire the T2 maps from 15 slices (slice thickness 1 mm, in-plane resolution 0.14 × 0.27 mm2, repetition time 2 sec, echo time 20, 40, 60 ms; for details, see Kharatishvili and coworkers. 9 At 10–12 days after injury, spatial memory was assessed in the Morris water maze (Fig. 1). All animals were killed 13 days post-injury. The brains were perfusion fixed, cryoprotected, cut in a 1-in-5 series of coronal 30 μm thick sections, thionin stained, and used to prepare cortical unfolded maps as described subsequently, to determine the lesion location and extent across the different cytoarchitectonic areas of the cortical mantle, and to compare MRI data with the histological data (Fig. 1).
All animal procedures were approved by the Committee for the Welfare of Laboratory Animals of the University of Kuopio and the Provincial Government of Kuopio, and conducted in accordance with the guidelines set by the European Community Council Directives 86/609/EEC.
Preparation of unfolded maps of the rat cerebral cortex
Preparation of the template based on a rat brain atlas
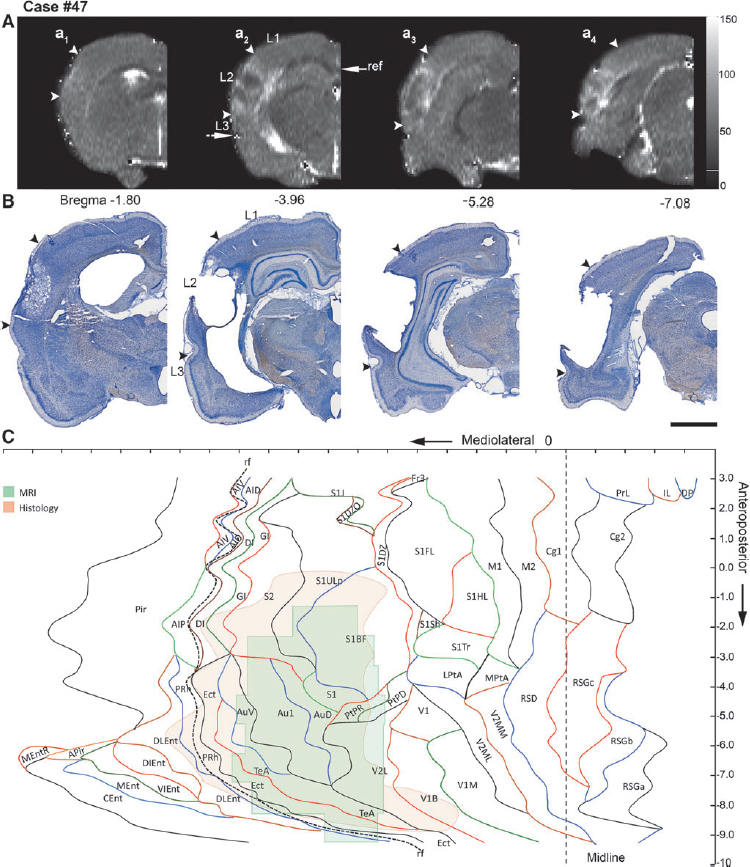
Two-dimensional unfolded maps of the rat cerebral cortex were constructed according to the method described by Van Essen and Maunsell. 11 First, we prepared a template of the unfolded cerebral cortex from a normal rat using the plates available in the rat brain atlas of Paxinos and Watson. 12 Twenty-six coronal plates located between the anterioposterior (AP) coordinates +3.0 to −9.24 from bregma, at 0.48–0.52 mm intervals, were included in the template. The plates were uploaded into ImageJ as .tiff files. The scale was set based on the atlas. Using the segmented line tool, the surface length (mm) of each cortical region in a given plate was measured (Fig. 2). To prepare the template of the unfolded cortex, the medial reference was set as the point at which the cortex contacted the corpus callosum (see arrowheads in Fig. 2A). In the most anterior plates, however, the measurement started from the medial edge of the dorsal penduncular (DP) cortex (AP levels +3.0 to +2.52) or area 2 of the cingulate cortex (Cg2) (AP levels +2.04 to −1.44) (see arrowheads in Fig. 2A). In the most posterior plates, the measurement started from the medial edge of the rostrosplenial granular cortex (RSG) (AP levels −1.92–9.24) (see arrowheads in Fig. 2A). In the anterior plates (AP levels +3.0 to −4.92), the lateral reference point was the medial edge of the piriform cortex. In the most caudal plates (levels −5.40 to −9.24), the lateral reference point was the medial edge of the entorhinal cortex (see arrowheads in Fig. 2). As in T2 maps, it was not possible to identify the medial edge of the piriform or entorhinal cortex, and, therefore, the rhinal fissure was used as another reference point (see section entitled Unfolded map of the cortical lesion in MRI). Progressing from the most rostral plate (plate 11 in Paxinos and Watson) 12 to the most caudal plate (plate 110 in Paxinos and Watson), 12 the procedure was repeated for each of the 26 plates. Thereafter, the measured length of each cortical region in each plate was drawn as a straight line (i.e., unfolded) along the mediolateral direction on a scaled PowerPoint sheet (Fig. 2). Finally, the different points marking the beginning and end of each cortical region in the consecutive plates were connected to each other to reveal the boundaries of the different cytoarchitectonic cortical areas (Fig. 2).
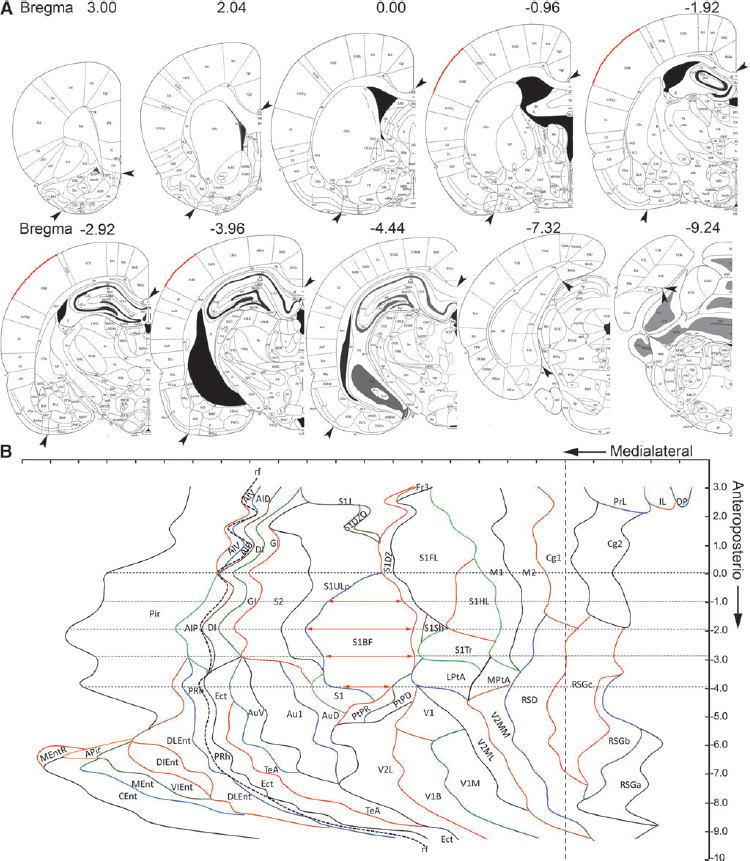
Template of the unfolded rat cortex. Twenty-six plates from the rat brain atlas by Paxinos and Watson were used.
12
Unfolded map of the cortical lesion in MRI
Data for 1 mm thick coronal T2 maps of the rat brain acquired in vivo at 3 days after TBI (see Fig. 1) were used for unfolding the lesioned area. First, the anteroposterior level of each coronal slice ( = T2 map) was visually matched with the coronal atlas plates. To reveal the mediolateral location of the lesion, the length of the cortical surface from the medial reference point (as described) to the medial edge of the lesion (L1) (See Fig. 3A), the surface length of the lesion (L2), and the length from the lateral edge of the lesion to the rhinal fissure (L3) were measured using ImageJ as described in each coronal slice (Fig 3Aa2
). In cases in which the lesion extended lateral to the rhinal fissure, L2 was measured from the upper edge of the lesion to the rhinal fissure, and then to the lower edge of the lesion. This allowed us to locate the mediolateral position of the lesion using the rhinal fissure as a lateral reference point. To adjust for differences in brain size between the atlas-based template and the experimental case, we calculated the ratio for each MRI coronal slice as follows: cortical surface length in the MRI slice (i.e., distance from the medial reference point to the lateral reference point [rhinal fissure]) divided by the cortical surface length in the atlas slice at a given anteroposterior level. Then, the measured length of L1, L2, or L3 was multiplied by the ratio. This was repeated for every slice. The adjusted measurements from each image were then transferred to the template at the corresponding anteroposterior coordinate
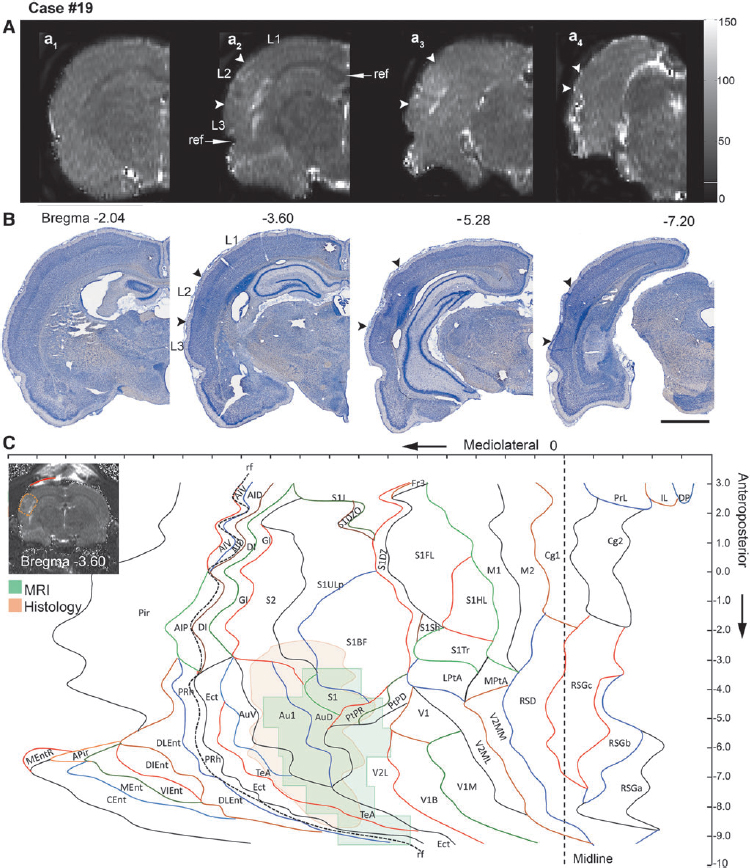
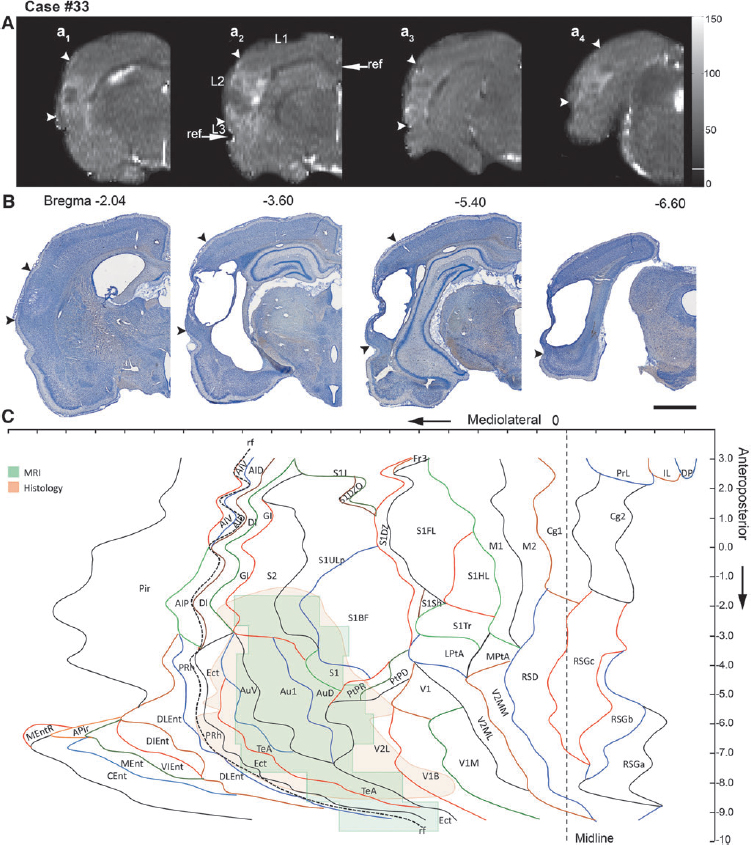
Representative unfolded magnetic resonance imaging (MRI) and histological maps from four animals (moderate traumatic brain injury [TBI], 19 and 26; severe TBI, 33 and 47), showing the distribution of the lesion (between arrowheads) in different cytoarchitectonic areas of the cerebral cortex.

Unfolded map of the cortical lesion in histological sections
Thionin-stained 30 μm thick coronal sections (240 μm apart from each other) of the brains from animals (killed at 13 days post-TBI) imaged at 3 days post-TBI were used to unfold the histological lesions. Images of the sections were captured using a stereomicroscope equipped with a Nikon DXM1200F digital camera system, and uploaded into the ImageJ software for analysis as .tiff files. As with the MRI slices, we first measured the length of the cortical surface from the medial reference point to the medial edge of the lesion (L1) (Fig. 3), then along the lesion (L2), and finally, from the lateral edge of the lesion to the rhinal fissure (L3), as described (see Fig. 3Aa2 ). The criterion for lesion delineation was the occurrence of neurodegeneration in layer V. Each histological section was adjusted for shrinkage and differences in the brain size as described previously for MRI slices. The measurements from each section were then transferred to the template (Fig. 2). Finally, the marks indicating the edges of the lesion in successive sections were connected to reveal the outline of the lesion (Fig. 3).
Calculation of the area of the unfolded cortical lesion
After preparing the two sets of unfolded maps from the lesioned cortex, one from MR images and another from thionin-stained sections, the files were converted into .tiff images and uploaded into ImageJ. The scale in ImageJ was set to match that in the unfolded maps. Using the selection tool in the ImageJ software, the lesion areas in the MRI and histological unfolded maps were outlined. We then measured 1) the total lesion area separately in the MRI and histological maps and 2) the extent of damage in each cytoarchitectonic cortical region (absolute value as mm2 and percentage of damage of the total area in the given cytoarchitectonic field).
Statistical analysis
Statistical analysis was performed using IBM SPSS Statistics (v. 21). The nonparametric Kruskall–Wallis test was used to analyze differences in the cortical lesion area between the groups. If a significant difference was detected, post-hoc analysis was performed using the Mann–Whitney U test. The Wilcoxon test was used to assess whether the area of the cortical lesion in a given animal measured from the unfolded MRI map differed from that in the unfolded histological map. The nonparametric Spearman rank correlation test was used to assess correlations among the MRI lesion, histologic lesion, and behavioral data. The χ2 test was used to test the difference in the percentage of animals with a lesion in a specific cortical area based on MRI and histology, as well as if there were differences in the lesion occurrence between animals with “moderate” or “severe” TBI. A receiver operating characteristics (ROC) analysis was prepared to assess whether the occurrence of a lesion in a given cortical area predicted functional deficits. Data are presented as mean ± standard error of the mean (SEM). A p value <0.05 was considered statistically significant.
Results
Unfolded lesion area in MRI and histological sections
Representative examples of the unfolded MRI and histological lesions in rats with moderate (cases 19, 24, and 26) or severe (33, 47, and 51) TBI are shown in Figure 3.
Comparison of moderate and severe TBI
The 2D-unfolded area of the cortical lesion was remarkably similar between rats with moderate and those with severe TBI, whether it was calculated from the MRI (moderate: range 8.65–46.49 mm2; severe 13.15–31.26 mm2) or the histological maps (moderate 8.33–45.87 mm2; severe 22.81–47.15 mm2).
Further analysis revealed no difference between the moderate and severe TBI groups in the mean area of the cortical lesion in the unfolded MRI maps at 3 days post-TBI (20.78 ± 2.30 mm2 vs. 22.84 ± 1.39 mm2, p > 0.05). In the unfolded histological maps prepared at 13 days post-TBI; however, the lesion area in the severe TBI group (30.53 ± 1.87 mm2) was 55% greater than that in the moderate group (19.72 ± 2.12 mm2; p < 0.001; Fig. 4C–E).
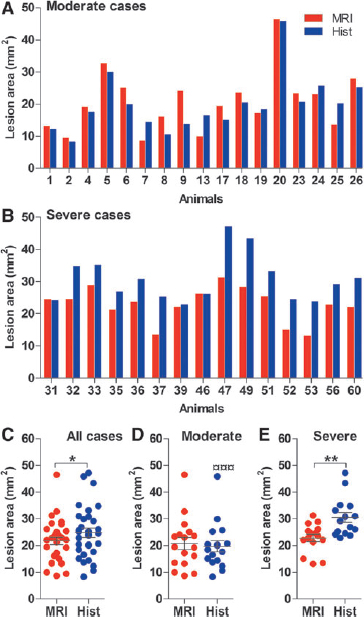
Comparison of lesion size calculated from the unfolded magnetic resonance imaging (MRI) and histological map histograms showing the area of the lesion (y-axis) in
Comparison of MRI at 3 days and histology at 13 days post-TBI
Next, we assessed whether MRI lesions at 3 days post-TBI predicted histological injury at 13 days post-TBI. In the whole group of animals, the lesion area in the unfolded MRI maps at 3 days post-TBI was 12% lower than in the histological maps at 13 days post-TBI (21.75 ± 1.38 vs. 24.79 ± 1.71 mm2, p < 0.05). Further analysis revealed no difference in the moderate TBI group (MRI 20.78 ± 2.30 mm2 vs. histology 19.72 ± 2.12 mm2, p < 0.001); however, in the severe TBI group, the lesion area in the histological map (30.53 ± 1.87 mm2) was 34% greater than that in the MRI map (22.84 ± 1.39 mm2; p < 0.01; Fig. 4C–E). Visual analysis of histological unfolded maps confirmed expansion of the lesion in the severe TBI group. In particular, the lesion progressed laterally and caudally compared with that in the MRI maps obtained 10 days earlier, and also involved the caudal aspects of the cortex, such as the entorhinal, perirhinal (PRh), and ectorhinal (Ect) cortices (postrhinal cortex according to Burwell and Amaral). 13
Correlation of the lesion area in unfolded maps with the lesion volume
To assess whether the extent of the 2D-unfolded lesion area reflected the three-dimensional (3D) lesion volume estimated with the Cavalieri method, the present data were correlated with previously analyzed lesion volumes (see Kharatishvili and coworkers). 9
The unfolded MRI lesion area and MRI lesion volume were strongly correlated (all animals: r = 0.928, n = 32, p < 0.001; moderate TBI: r = 0.958, n = 17, p < 0.001; severe TBI: r = 0.900, n = 15, p < 0.001) (Fig. 5A). Also, the unfolded histological lesion area was strongly correlated with histological lesion volume (all animals: r = 0.791, n = 32, p < 0.001; moderate TBI: r = 0.645, n = 17, p < 0.01; severe TBI: r = 0.675, n = 15, p < 0.01) (Fig. 5D).
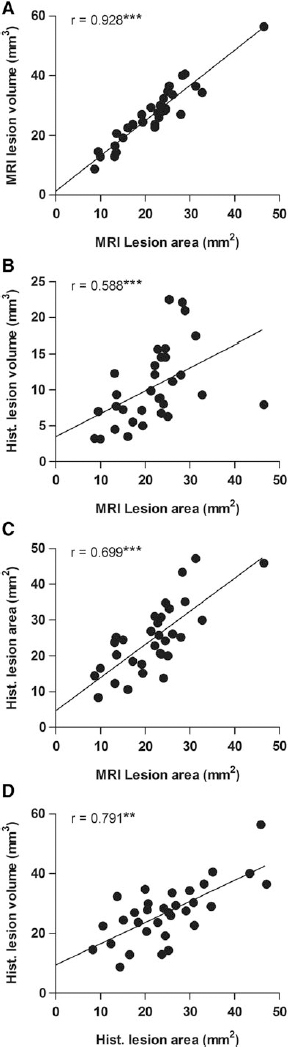
Correlations between the unfolded magnetic resonance imaging (MRI) and histological lesion areas with the MRI and histological lesion volumes.
Further, the unfolded MRI lesion area at 3 days post-TBI predicted the forthcoming unfolded histological lesion area (all animals: r = 0.699, n = 32, p < 0.001; moderate TBI: r = 0.723, n = 17, p < 0.01; severe TBI: r = 0.732, n = 15, p < 0.01) as well as the histological lesion volume (all animals: r = 0.588, n = 32, p < 0.001; moderate TBI: r = 0.549, n = 17, p < 0.05; severe TBI: r = 0.700, n = 15, p < 0.01) (Fig. 5B) and (Fig. 5C) assessed at 13 days post-injury.
Lesion distribution in different cytoarchitectonic areas of the cerebral cortex
Unfolded MRI maps
A closer analysis of the lesion location in unfolded MRI maps at 3 days post-TBI revealed that most of the rats had damage to the visual, auditory, and some parts of the somatosensory cortices. A noticeable lesion was also present in the parietal cortex.
In the visual cortex, the lesion covered, on average, 47% (percentage was calculated from rats with lesion, that is, 32/32 rats) of the lateral division of the secondary visual cortex (V2L) and 16% (lesion present in 13/32 rats) of the binocular division of the primary visual cortex (V1B) (Fig. 6, Table 1). In the auditory cortex, the lesion coverage was 66% (32/32 rats) of the primary auditory cortex (Au1), 89% (32/32 rats) of the secondary auditory cortex (AuD), and 29% (31/32 rats) of the ventral division of the secondary auditory cortex (AuV) (Fig. 6, Table 1). In the somatosensory cortex, the lesion coverage was 74% (30/32 rats) of the primary somatosensory division (S1), 21% (30/32 rats) of the barrel field of the primary somatosensory cortex (S1BF), 8% (22/32 rats) of the upper lip of the primary somatosensory cortex (S1ULp), and 14% (32/34 rats) of the secondary somatosensory division (S2) (Fig. 6, Table 1). In the parietal cortex, the lesion covered ∼24% (23/32 rats) of the dorsal part of the posterior area (PtPD), and 53% (31/32 rats) of the rostral part of the posterior area (PtPR) (Fig. 6, Table 1).
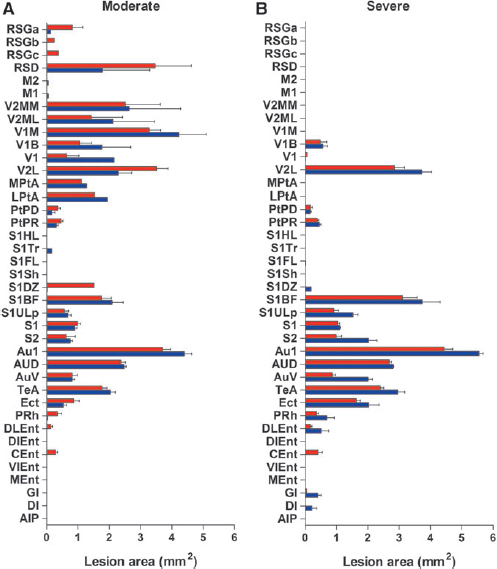
Bar graphs showing the involvement of different cytoarchitectonic regions of the cerebral cortex in lesions based on unfolded maps prepared from magnetic resonance imaging (MRI) or histology. The most injured areas in all animals include the auditory, somatosensory, parietal, and visual cortices. Note the absence of lesions in the motor cortex.
The number of animals with a lesion in a specific region is provided in the parentheses (n).
Au1, primary auditory cortex; AuD, secondary auditory cortex, dorsal area; AuV, secondary auditory cortex, ventral area; DI, dysgranular insular cortex; DIEnt, dorsal intermed entorhinal cortex; DLEnt, dorsolateral entorhinal cortex; Ect, ectorhinal cortex; GI, granular insular cortex; LPtA, lateral parietal association cortex; M1, primary motor cortex; M2, secondary motor cortex; MEnt, medial entorhinal cortex; MPtA, medial parietal association cortex; PRh, perirhinal cortex; PtPD, parietal cortex, posterior area, dorsal part; PtPR, parietal cortex, posterior area, rostral part; RSD, retrosplenial dysgranular cortex; RSG S1, primary somatosensory cortex; S1BF, primary somatosensory cortex, barrel field; S1DZ, primary somatosensory cortex, dysgranular; S1FL, primary somatosensory cortex, forelimb region; S1HL, primary somatosensory cortex, hind limb region; S1Sh, primary somatosensory cortex, shoulder region; S1Tr, primary somatosensory cortex, trunk region; S1ULp, primary somatosensory cortex, upper lip region; S2, secondary somatosensory cortex; TeA V1, primary visual cortex; V1B, primary visual cortex, binocular area; V1M, primary visual cortex, monocular area; V2L, secondary visual cortex, lateral area; V2ML, secondary visual cortex, mediolateral area; V2MM, secondary visual cortex, mediomedial area; VIEnt. 12
¤ ¤ p < 0.01, ¤ ¤ ¤ p < 0.001 (as compared to MRI lesion); * p < 0.05, ** p < 0.01, *** p < 0.001 (as compared to moderate injury cases).
Interestingly, at 3 days post-TBI, we found no difference between the moderate and severe groups in the number of rats with a lesion in any specific cortical cytoarchitectonic area. The only exceptions were the S1ULp (8/17 of moderate cases had damage vs. 14/15 severe cases, p < 0.01, χ2), perirhinal cortex (PRh) (moderate 9/17 vs. severe 15/15, p < 0.01, χ2), and the caudomedial aspect of the entorhinal cortex (Cent) (moderate 4/17 vs. severe 10/15, p < 0.01, χ2) (Fig. 6B and C, Table 1).
Unfolded histological maps
At 13 days post-injury, most of the cases had lesions in the visual, auditory, somatosensory, and parietal cortices.
In the visual cortex, on average, 18% of the area of the V1B (14 of 32 rats) and 49% of the V2L (32/32) was damaged. In the auditory cortex, the lesion covered 80% of the Au1 (32/32), 93% of the AuD (32/32), and 47% of the AuV (32/32) (Fig. 6, Table 1). In the somatosensory cortex, the lesion covered 25% of the S1BF (32/32), 11% of the S1ULp (32/32), 74% of the S1 (32/32), and 19% of the S2 (32/32) (Fig. 6, Table 1). In the parietal cortex, 15% of the PtPD (19/32) and 49% of the PtPR (30/32) was damaged.
As with the unfolded MRI maps, we found no difference between the moderate and severe groups in the number of animals with lesions in any specific cortical cytoarchitectonic area, except for the Ect cortex (moderate 13/17 vs. severe 15/15, p < 0.05, χ2) and the PRh cortex (moderate 1/17 vs. severe 11/15, p < 0.01, χ2) (Fig. 6, Table 1).
Association between the location of the cortical lesion and neuromotor and spatial learning performance
To determine whether the unfolded lesion area or the location correlated with the post-traumatic functional deficits, we evaluated the correlations between the lesion areas in unfolded MRI and histological maps, and the cytoarchitectonic lesion locations with the composite neuroscore, beam balance, and Morris water maze tests (see Fig. 1). Data on the behavioral tests have previously been published (for details see Kharatishvili and coworkers). 9
Effect of cortical lesion area and location on neuroscore
In the whole group of animals, we found no correlation between the composite neuroscore at 2 days post-TBI and the MRI lesion area at 3 days post-TBI (all animals: r = −0.282, n = 32, p > 0.05; moderate TBI: r = −0.583, n = 17, p < 0.05; severe TBI: r = 0.467, n = 15, p > 0.05) (Fig. 7A). The lower the neuroscore (i.e., more severe impairment) at 2 days post-TBI, the larger the unfolded histological lesion area at 13 days post-TBI (all animals: r = −0.579, n = 32, p < 0.01; moderate TBI: r = −0.227, n = 17, p > 0.05; severe TBI: r = 0.437, n = 15, p > 0.05) (Fig. 7B).
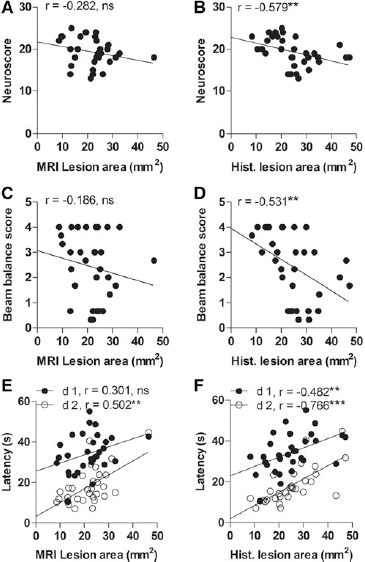
Dot plots showing the correlations between the unfolded magnetic resonance imaging (MRI) and histological cortical lesion areas and the performance on the neuroscore, beam balance, or Morris water maze tests.
Further analysis revealed no correlation among the whole group of animals between the neuroscore at 2 days post-TBI and the MRI lesion area at 3 days post-TBI in any of the somatomotor cortical areas. In the whole group of animals, however, the lower the neuroscore at 2 days post-TBI, the larger the histological lesion area in the S1ULp (r = −0.486, n = 15, p < 0.01), S1 (r = −0.354, n = 15, p < 0.05), and S2 (r = −0.544, n = 15, p < 0.01) at 13 days post-TBI. No correlations were observed between the neuroscore and the unfolded MRI or histological lesion areas when animals were divided into the moderate and severe injury groups. It should be noted that only one animal had a lesion in the motor cortex (neuroscore of 18).
Effect of cortical lesion location on beam balance
In the whole group of animals, the beam balance results at 3 days post-TBI did not correlate with the unfolded MRI lesion area at the same time point (Fig. 7B). On the other hand, the lower the beam balance score at 3 days post-injury, the larger the unfolded histological lesion area at 13 days post-TBI (r = −0.531, n = 32, p < 0.01) (Fig. 7C). Performance in the beam balance test did not correlate with the extent of the lesion either in the unfolded MRI maps or the histological maps when the animals were divided into moderate and severe TBI groups.
Further analysis in the whole animal group revealed that the lower the beam balance score, the larger the MRI lesion area in S1ULp (r = −0.469, n = 17, p < 0.01) and S2 (r = −0.458, n = 17, p < 0.01). Also, the lower the score, the larger the histologic lesion area in S1ULp (r = −0.559, n = 15, p < 0.01) and S2 (r = −0.647, n = 15, p < 0.001). No correlations were detected when animals were divided into moderate and severe TBI groups.
Effect of cortical lesion location on spatial learning and memory
The Morris water maze test was started on the day 10 post-TBI to assess spatial learning and memory (see Kharatishivili and coworkers for details). 9 In the whole group of animals, the lesion extent in the unfolded MRI maps at 3 days post-injury did not correlate with the latency to find the platform on day 10 (1st testing day) post-TBI. The larger the lesion area in the unfolded MRI map at 3 days post-TBI, the longer the latency on day 11 post-TBI (2nd testing day; r = 0.502, n = 32, p < 0.01) (Fig. 7C). Also, the larger the lesion in the unfolded histological map, the longer the latency to reach the platform (day 1: r = 0.482, n = 32, p < 0.01; day 2: r = 0.766, n = 32, p < 0.001) (Fig. 7D).
Further analysis in the whole group of animals indicated that the longer the latency, the larger the unfolded MRI lesion in S1BF (day 1: r = 0.302, n = 32, p > 0.05; day 2: r = 0.471, n = 32, p < 0.01), S1ULp (day 1: r = 0.359, n = 32, p < 0.05; day 2: r = 0.429, n = 32, p < 0.05), S2 (day 1: r = 0.443, n = 32, p < 0.05; day 2: r = 0.474, n = 32, p < 0.01), Ect (day 1: r = 0.294, n = 32, p > 0.05; day 2: r = 0.460, n = 32, p < 0.01), and PRh (day 1: r = 0.205, n = 32, p > 0.05; day 2: r = 0.389, n = 32, p < 0.05).
Also, the longer the latency, the larger the unfolded histological lesion in S1ULp (day 1: r = 0.594, n = 32, p < 0.001; day 2: r = 0.601, n = 32, p < 0.001), S1 (day 1: r = 0.190, n = 32, p > 0.05; day 2: r = 0.422, n = 32, p < 0.05), S2 (day 1: r = 0.589, n = 32, p < 0.001; day 2: r = 0.613, n = 32, p < 0.001), Ect (day 1: r = 0.373, n = 32, p > 0.05; day 2: r = 0.560, n = 32, p < 0.01), and PRh (day 1: r = 0.309, n = 32, p > 0.05; day 2: r = 0.470, n = 32, p < 0.01).
Asking if lesions in a specific cytoarchitechtonic cortical area predict upcoming functional deficits
Because we found correlations between 1) the unfolded MRI lesion area in the S1ULp and S2 cortices and performance on the beam balance test, and 2) the unfolded MRI lesion area in the S1BF, S1ULp, S2, Ect, and PRh cortices and the latency in the Morris water maze test, we next assessed whether the extent (mm2) of the lesion in these areas was a sensitive and specific predictor of the upcoming somatomotor and memory deficits using ROC analysis. To perform the ROC analysis, animals were first divided into impaired and unimpaired groups according to the following criteria: in the beam balance, a score <2.5 (median score of all injured animals) and in the Morris water maze, a mean latency >22.5 sec (test day 1) and >9.5 (test day 2) (i.e., mean +1 SD of that in sham-injured animals) was considered impaired.
Beam balance
The ROC analysis revealed that the MRI lesion area at 3 days post-TBI in both the S1ULp (≥ 0.277 mm2, area under the curve [AUC] = 0.745, p < 0.05; sensitivity 65%, specificity 60%) and S2 (0.282 mm2, AUC = 0.757, p < 0.05; sensitivity 82%, specificity 53%) was a sensitive and specific predictor of deficits in the beam balance test (Fig. 8A, Table 2).
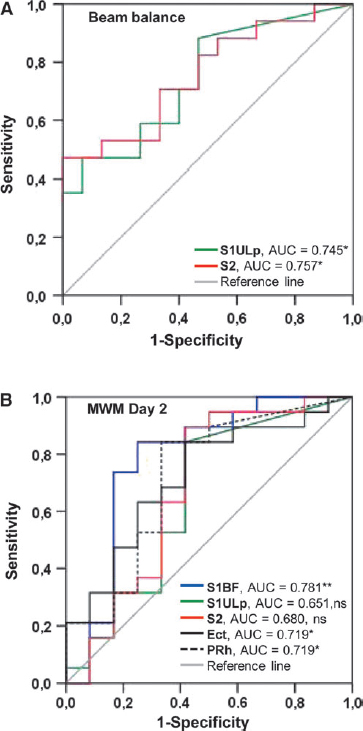
Receiver operating characteristic (ROC) curves demonstrating the sensitivity and specificity of the lesion in the different cytoarchitectonic cortical areas at 3 days post-injury for predicting deficits in the beam balance and Morris water maze tests.
AUC, area under the curve: CI, confidence interval; Ect, ectorhinal cortex; PRh, perirhinal cortex; S1BF, primary somatosensory cortex, barrel field; S1ULp, primary somatosensory cortex, upper lip region; S2, secondary somatosensory cortex SE, standard error.
Morris water maze
The MRI lesion area in S1BF (≥ 1.194 mm2; AUC = 0.781, p < 0.01; sensitivity 84%, specificity 75%), Ect (≥ 0.752 mm2; AUC = 0.719, p < 0.05; sensitivity 84%, specificity 55%), and PRh (≥ 0.05 mm2; AUC = 0.719, p < 0.05; sensitivity 84%, specificity 65%), but not in S1ULp (AUC = 0.651, p > 0.05) or S2 (AUC = 0.680, p > 0.05), differentiated animals with or without impairment on the second testing day (Fig. 8B, Table 2).
Discussion
Prediction of the development of post-TBI functional impairments would benefit from accurate delineation of both the lesion location and the lesion extent in the functionally diverse cerebral cortex. Our objective was to develop a methodology to delineate lesion location in different cytoarchitectonic regions of the cerebral cortex in MR images after experimental TBI. We hypothesized that the location and extent (severity) of the lesion in a given cortical area predicts the severity of functional impairment. To test our hypothesis, we re-analyzed our previous data sets by generating 2D-unfolded cortical maps of the lesioned cortex from MRI T2 maps and histological sections collected at 3 days or 13 days after lateral FPI in rats. 9 The lesion location was then visualized by overlying it on a template of the unfolded cerebral cortex, which was constructed from the rat brain atlas of Paxinos and Watson. 12 The five major findings were as follows: 1) the area of the lesion assessed at 3 days post-TBI using MRI T2 maps was, on average, 12% smaller than that in the histological sections at 13 days post-injury; 2) during the first 2 weeks after lateral FPI, the cortical lesion expanded laterally and caudally, particularly after severe TBI; 3) lesion areas in unfolded maps correlated positively with lesion volume; 4) lesions in the somatosensory cortex predicted neuromotor deficits in the beam balance test and the greater the lesion area, the greater the deficit; and 5) lesions in the somatosensory and PRh cortices predicted impaired spatial memory in the Morris water maze test, and, as in the somatosensory cortex, the greater the lesion area, the greater the deficit.
Methodological limitations
Functionally distinct cortical areas cannot be accurately partitioned based on MR images. Even in histological sections, the cytoarchitectonic delineation of the cortical lesion after TBI is challenging, as region-specific cytoarchitectonic characteristics are lost as a result of injury. Therefore, we generated a 2D template of the unfolded rat cerebral cortex using the widely distributed rat brain atlas of Paxinos and Watson. 12 We also adopted the nomenclature for different cortical areas from the atlas. The coronal T2 maps or histological sections of the injured cortex were then superimposed onto the template, and the lesion was reconstructed with cytoarchitectonic borders.
Several aspects of the study can compromise the accuracy of our analysis of the lesion location and size. First, for MRI and histological maps, we used the surface length (mm) from the medial reference point to the rhinal fissure, which can be affected by the biologic variability in brain size, time since the injury, and animal-dependent variability in the extent of injury-related cortical swelling, as well as shrinkage related to histological processing.
To take into account the variability in brain size, we multiplied the measured hemispheric cortical lengths (L1, L2, and L3) by the ratio that was calculated as the cortical surface length of the experimental case divided by the cortical surface length in the atlas section at the same coronal level. Another possibility was to image the brain of each animal before injury, and use the pre-injury cortical surface length to adjust the brain size in a given animal to the template. The deforming effect of injury-induced swelling and its dynamics in a given animal on the shape of the unfolded map are difficult to correct and must, therefore, be kept in mind when analyzing and interpreting the data.
Shrinkage of the brain tissue during fixation and processing for histology can also distort comparisons, particularly of different analysis platforms such as MRI and histology. Importantly, however, the MRI and histological lesion locations were comparable, and we considered the most extensive lesion in the histological sections to be the result of the progression of secondary cortical damage rather than of factors related to histological tissue processing.
The extent of the histological lesions was measured from cortical layer V, rather than from the surface of the brain as when outlining the MRI lesion and the template, to avoid false measurements related to cortical distortion during histological processing of necrotic tissue. Therefore, it should be noted that if the lesion extent is wider in the superficial cortical layers than in layer V, the analysis would underestimate the extent of the cortical lesion area. Overall, when interpreting the results, the heterogeneity of the “shape” of the cortical lesion in coronal sections must be kept in mind.
Finally, the rostrocaudal distribution of the lesion volume is dependent on the correct matching of the anteroposterior levels of the MRI slices and histological sections with the standard template. With histological sections, this is less challenging if the cutting orientation of the sections matches with that in the atlas. When placing the measurements from 1 mm thick MRI slices onto the template, the slice thickness affects the accuracy of the placement of measurements on the template, outlining the lesioned area, and area measurements. Also, the analysis was performed on an existing MRI data set (see Kharatishvili and coworkers) that was acquired in a rather low magnetic field (4.7T) with a pulse sequence that was not optimized for this type of analysis. 9 Imaging with more isotropic resolution and the contrast achievable, for example, with 3D steady-state sequences in a higher magnetic field, could benefit the analysis. Despite these limitations and the 10 day difference in data sampling, the data from histological and imaging analysis matched surprisingly well.
Unfolded MRI and histology lesions locate laterally and caudally relative to craniectomy
To obtain an in-depth understanding of the lesion extent, we investigated the location and extent of the lesions in the different cytoarchitectonic cortical areas from the 2D-unfolded maps. Except for one case, the cortical lesion was located lateral to the craniotomy site. This is consistent with previous findings that the fluid-pulse directed onto the intact dura via a cap positioned perpendicular to the skull surface blows the impact force laterally and caudally, involving caudal structures, such as the PRh and Ect (postrhinal) cortices. 8,14,15 The most severely lesioned areas, however, included the auditory, parietal, visual, and somatosensory cortices. The auditory cortex was lesioned in all cases, with >50% of its surface area affected. Anatomically, this region is located closest to the skull. Whether the consistent damage to the auditory cortex is caused by the mechanical pressure of the skull on the edematous auditory cortex following FPI remains to be investigated. Also, we observed remarkable damage in subregions of the somatosensory cortex, including the S1ULp, S1BF, S1, and S2. In fact, >60% of all animals showed damage to these areas. Not surprisingly, the affected somatosensory regions bordered the auditory cortex, suggesting that these regions experienced some mechanical pressure as well. Functionally, the remarkable damage to the auditory cortex suggests that most of the animals have unilateral impairment of auditory processing. McIntosh and colleagues demonstrated an auditory deficiency in the lateral FPI model, as a brainstem auditory evoked response test revealed the disappearance of wave V and a prolonged peak latency in injured rats. 8 Importantly, except for one animal with a neuroscore of 18, there was no lesion in the motor cortex. Whether this implies that regions other than motor cortex are responsible for the impairment indicated by the neuroscore, or the recovery in the neuroscore relates to resolution of edema, however, remains to be explored.
Severity of the impact affects the progression of secondary damage after TBI
Studies indicate that edema, which normally peaks at 3 days after lateral FPI, contributes to the T2 MRI signal, and, consequently, can lead to an overestimation of the lesioned area in MR images. 16 –19 Still, we found that after correcting for tissue shrinkage and brain size, the histological lesion area at 13 days post-TBI was 12% greater than the MRI lesion area at 3 days post-TBI, which likely relates to secondary tissue damage reported by several previous studies. For example, Sato and coworkers 34 showed that neurodegeneration in the cortex peaks at 3 days after lateral FPI and continues for at least 14 days. Other studies have demonstrated progressive neurodegeneration in the cortex and white matter for up to 1 year after lateral FPI. 20,21 Similarly, longitudinal morphometric studies in patients with TBI have demonstrated progressive atrophy in white and gray matter structures. 22 Interestingly, when the animals were divided into moderate and severe injury groups, progression of the lesion was observed in the severe injury group only, with ∼34% progression in the unfolded lesion area. These data suggest that the severity of the primary impact affects the progression of the secondary injury. 8,23
We found a strong positive correlation between the 2D-unfolded MRI lesion area and the MRI lesion volume. 9,24,25 Similarly, the larger the 2D-unfolded histological lesion area, the greater the histological lesion volume. Our data also indicated that the larger the area of the 2D unfolded MRI lesion assessed at 3 days post-injury, the larger the area or volume of the histological lesion 10 days later, suggesting that the severity of the early lesion can be used to predict the severity of the future lesion, and confirming our previous data. 9,24
MRI lesions in the specific cytoarchitectonic cortical areas can predict upcoming function impairments
Prediction of the severity of long-term functional impairment in the acute phase post-TBI is a major challenge. The type of impairment is determined by the brain region affected by the TBI. 8,26 –28 Our data demonstrate that during the 1st week post-TBI, MRI lesions in S1ULp and S2 are associated with poor performance in the beam balance test. Interestingly, the ROC analysis further confirmed that a lesion in S1ULp exceeding 2.9% and in S2 3.9% of the total area indicated that performance in the beam balance test would be impaired. Contrary to what was expected, the composite neuroscore did not correlate with the severity of the lesion in any of the cytoarchitectonic cortical subfields. Previous studies suggest that composite neuroscore is a complex measure of motor, sensory (tactile, proprioceptive, and visual) and reflex functions. 8,29 Apparently the cortical areas processing these functions (particularly the motor areas) did not undergo severe enough permanent damage after lateral FPI to cause an impairment in composite neuroscore.
Additionally, animals with lesions in S1BF, S1ULp, S2 and Ect and PRh cortices during the 1st week post-TBI presented later on with difficulties in spatial learning. An ROC analysis confirmed that damage particularly to the S1BF (>10.3%) and PRh (>1.1%) and Ect (>12.3%) cortices was a strong predictor of spatial learning impairment. This is consistent with reports suggesting that the PRh cortex is involved in spatial learning and memory. 30 –32 These data suggest that poor spatial learning and memory in rats with lateral FPI may relate not only to the hippocampal lesions, but also to impaired cortico-hippocampal sensory processing.
Taken together, our data indicate that the 2D-unfolded cortical maps can be used to predict TBI-induced deficits in the lateral FPI model. It remains to be explored whether quantification of lesions in the subcortical components of the functional connectome will improve our ability to predict the post-TBI behavioral and cognitive performance better than a mere analysis of cortical lesions. 33
Conclusion
The data presented here demonstrate that 2D-unfolded maps generated from T2 maps or histological sections can reliably pinpoint the extent and location of cortical lesions after TBI, and consequently, be used to describe the severity of cortical lesion. Consequently, the 2D-unfolded maps from T2 maps can be used to accurately follow up the evolution of secondary damage in specific cortical areas, and to predict post-TBI functional impairment requiring cortical processing. Overall, our data indicate that the construction of 2D-unfolded maps either from T2 maps or histological sections provides valuable information toward understanding the pathophysiology and progression of injury caused by TBI, and its functional correlates.
Footnotes
Acknowledgments
This study was supported by the Academy of Finland, ERA-NET Neuron (TBI Epilepsy), and FP7-HEALTH project 602102 (EPITARGET). We thank Dr. Olli Gröhn for his helpful comments regarding the manuscript, and Jarmo Hartikainen and Merja Lukkari for their excellent technical assistance.
Author Disclosure Statement
No competing financial interests exist.