
Abstract
Clinical studies suggest that repeat exposures to mild traumatic brain injury (mTBI) or concussion, such as sports-related mTBI, result in verbal, memory, and motor deficits that can progressively worsen and take longer for recovery with each additional concussion. Pre-clinical studies suggest that mild mechanical injury of the brain can initiate a period of heightened vulnerability during which the brain is more susceptible to a subsequent mild injury. It is unknown how long this period of heightened vulnerability lasts and, as a result, appropriate return-to-play guidelines for athletes who have sustained sports-related mTBI could be better clarified. To better understand this pathology and define the duration of heightened vulnerability to subsequent exposure, we employed a well-defined stretch injury model to mechanically stimulate organotypic hippocampal slice cultures (OHSCs) and evaluated both electrophysiological and pathological markers of injury. We found that an initial mild stretch initiated a period of heightened vulnerability to a subsequent stretch that lasted at least 24 h. Two mild stretch injuries delivered 24 h apart significantly increased tissue injury, including cell death, damage to dendrites, increased nitrite production, astrogliosis, and loss of long-term potentiation (LTP). Cell loss, dendrite damage, and nitrite production were not significantly increased when the inter-injury interval was increased to 72 h; however, LTP deficits and astrogliosis persisted. An interval of 144 h was sufficient to prevent the detrimental effects of repetitive stretch. Improved understanding of the brain's response to repetitive mTBI in vitro may aid in translational studies, informing rest periods for the injured athlete.
Introduction
A
The National Football League (NFL) Head, Neck, and Spine Committee has developed safe return-to-play guidelines for their concussed athletes to prevent additional concussion during recovery. The NFL Sideline Concussion Assessment Tool 3 (SCAT 3 modified NFL Assessment) and physician evaluation are used to diagnose concussion, remove the player from the active roster, and evaluate a player's recovery. 6 As symptoms improve, a player is slowly reintroduced to team activities from attending meetings to exercising to returning to practice and play. A concussed player is typically removed from play for 1 week. 6 Clinical studies suggest that athletes who have had one concussion are at a higher risk for multiple concussions. 1 Patients with a history of past concussions may experience more significant verbal, memory, and motor deficits that persist for longer periods following each additional concussion. 1 Because this period of heightened vulnerability has not been studied systematically, safe return-to-play guidelines are disputed. 6 –8 These guidelines may be important for protecting concussed athletes from much more significant injury from repetitive concussions.
Students who have sustained concussion and are still symptomatic report academic trouble such as problems studying, spending more time on homework, and difficulty taking notes. 9 Challenges in learning and forming new memories may suggest injury to the hippocampus. 10 However, concussion is defined by a set of symptoms that may independently arise from injury to the head, neck, and/or body that can confound interpretation of the effects of repetitive impacts on the brain tissue itself. 11 In an effort to evaluate the effects of repetitive mild mechanical loading on brain tissue alone, we used in vitro organotypic hippocampal slice cultures (OHSCs), which maintain complex hippocampal morphology, neuronal connections, and physiological maturation ex vivo, and can be useful for evaluating changes in histology, gliosis, and neuron function following injury. 12 –14 We exposed OHSCs to a well-characterized stretch injury model that delivers a mechanical stimulus relevant to mild brain injury, and we evaluated electrophysiology and pathology following a single or repeat stretch delivered with varying inter-injury intervals to characterize and define the period of vulnerability after initial injury. 13
Methods
Organotypic hippocampal slice cultures
All animal procedures were approved by the Columbia University Institutional Animal Care and Use Committee (IACUC). According to previously published culture methods, hippocampi were removed from P8-10 Sprague–Dawley rat pups and sectioned into 400 μm thick slices.
15
Slices were plated onto silicone membranes (Specialty Manufacturing, Saginaw, MI) coated with poly-L-lysine (0.32 mg/mL; Invitrogen, Carlsbad, CA) and laminin (0.08 mg/mL; Invitrogen). Cultures were initially fed with Neurobasal medium supplemented with 1 mM GlutaMAX, 1X B27 supplement, 10 mM HEPES, and 25 mM
Stretch injury
The stretch-injury device and loading mechanism have been previously characterized in detail. 13,16 In brief, culture medium was aspirated, and each culture well was placed on the injury device, which was pre-warmed to 37°C. An equibiaxial stretch injury was achieved by displacing the well and silicone tissue substrate over a hollow, cylindrical indenter. 13,16 Tissue strains were verified via image analysis of high-speed video with custom MatLab code (Natick, MA). Cultures received 0, 1, or 2 mild stretch injuries 24, 72, or 144 h apart. All samples not scheduled to receive a stretch injury at a given time point were exposed to the sham injury (Fig. 1). For sham injury, samples were clamped on the injury device, but the device was not fired.

Schematic of 24 h interval injury paradigm and stretch injury biomechanics. (A) Samples were imaged prior to and following injuries. For each experiment, the inter-injury interval was either 24
Excitotoxic injury
As a positive control for cell death, a subset of samples exposed to the repetitive injury received an excitotoxic injury, as previously described. 17 On the 3rd day after the second injury and following cell death evaluation, a subset of cultures were challenged with 10 mM glutamate (L-glutamic acid; Sigma) in serum-free medium for 3 h. Culture medium was changed to fresh full-serum medium, and resultant cell death was evaluated 24 h later (see Cell death quantification).
Cell death quantification
Cell death in each sample was evaluated and quantified for each anatomical region of interest (ROI) (dentate gyrus [DG]; cornu ammonis 3 [CA3]; cornu ammonis 1 [CA1]), as previously described, with propidium iodide (PI) (1.5 μM; Invitrogen) immediately prior to the first injury and 72 h following the second injury. 18 For the subset of samples that received excitotoxic injury (positive control) cell death was evaluated again 24 h following excitotoxic exposure. Samples with PI fluorescence >5% in any ROI prior to the first injury were eliminated from the study.
Nitrite quantification
Sample medium from each well was removed 72 h following the second exposure time point (sham or stretch) and assayed for nitrite. The concentration of nitrite was determined with the Griess Reagent Kit (Life Technologies) according to the manufacturer's instructions, reading absorbance at 548 nm on a BioTek Synergy 4 microplate reader (Winooski, VT).
Electrophysiological recordings
Electrophysiological function was quantified as previously described. 18 In brief, electrophysiological recordings were performed between 72 and 120 h after the second exposure time point with 60 channel microelectrode arrays (Fig. 1) (8 × 8 electrode grid, 10 μm electrode diameter, 100 μm electrode spacing; MEA, Multi-Channel Systems, Reutlingen, Germany).
Stimulus-response (S-R) curves were generated as previously described, applying a constant current, bipolar, biphasic stimulus (100 μs positive phase followed by a 100 μs negative phase) of varying magnitude (0-200 μA in 10 μA increments) to electrodes located in the Schaffer collaterals (SC) of each OHSC.
18
The evoked responses were recorded on all electrodes simultaneously. For each electrode, the peak-to-peak response for each stimulus was fit to a sigmoidal curve based upon the following equation:
19
These parameters have been described previously. 18 Rmax represents the maximum evoked response, I50 represents the current necessary to generate a half-maximal response, and the term m is proportional to the slope of the sigmoidal fit and represents the heterogeneity in firing thresholds. 20 Parameter values for each electrode were averaged within a ROI of the OHSC for each tissue slice. Parameters for a ROI and slice were then averaged within experimental groups.
Short-term plasticity was evaluated with delivery of paired stimuli at the I50 with varying inter-stimulus intervals (ISIs) to the same electrodes in the SC, as previously described. 18 ISIs were assigned to one of four bins relevant to short-term synaptic plasticity—Short-Term ISI (20 ms), Early-Mid ISIs (35–100 ms), Late-Mid ISIs (140–500 ms), and Long-Term ISIs (>500 ms). The paired-pulse ratios (PPRs) (response elicited by the second stimulus: response elicited by the first stimulus) for all electrodes in a region for all ISIs in the same bin were averaged together for each OHSC separately. These values were then averaged across samples in the same experimental group for each region and bin separately.
Potentiation following induction of long-term potentiation (LTP) was evaluated for each OHSC utilizing published methods. 18 Baseline evoked response was recorded for 30 min, stimulating at the I50 once every minute to the same electrodes in the SC. LTP was induced by delivering three high frequency stimulation (HFS) trains at the I50 current at 100 Hz. Trains were 1 sec long with a 10 sec delay between trains. Post-induction response was recorded for 60 min, stimulating at the I50 once every minute. The average peak-to-peak voltage of the last 10 min of the pre-induction recording and of the last 10 min of the post-induction recording was calculated for each electrode in the CA1. To calculate percent potentiation for these electrodes, the difference in these responses was normalized to the average peak-to-peak voltage of the last 10 min of the pre-induction recording. An average “% potentiation” was calculated for each slice; these values were subsequently averaged for each experimental group.
Histology and immunohistochemistry
A subset of cultures were prepared for histology and immunohistochemistry 72 h following the second injury time point as previously described. 18 Samples were fixed in neutral buffered 10% formalin (Sigma), dehydrated in a gradient of alcohols followed by xylene, and embedded in paraffin. All samples were cut into 6 μm thick sections manually and mounted on slides.
For histology, one section from each sample was dewaxed and stained with hematoxylin and eosin (H&E) (Gill's Hematoxylin 3 and Eosin Y, Thermo Fisher Scientific) and mounted for routine pathological analysis.
For immunohistochemistry, separate sections were stained with an antibody for microtubule associated protein 2 (MAP-2) (anti-MAP2 AB5622; Millipore; 1:100; n = 4) to visualize dendrites, an antibody for phosphorylated neurofilament heavy (pNF-H) (SMI-31, BioLegend, San Deigo, CA; n = 4; 1:500) to visualize axons, an antibody for glial fibrillary acidic protein (GFAP) to visualize astrocytes (anti-GFAP Ab7260, Abcam, Cambridge, MA; 1:2000; n = 4), and an antibody for IBA1 to visualize microglia and macrophages (anti-IBA1, Wako Pure Chemical Industries, Richmond, VA; 1:400; n = 4), as previously described. 18 As negative controls, additional sections received the same staining protocol without the primary antibodies.
All samples were evaluated by an individual blinded to the identity of the sample sections. Staining was graded on a continuous scale (0–3) depending on pathological indicators predetermined for each stain, as previously described. 18 For H&E, pathological indicators of injury such as shrunken neurons, vacuolization, neuronal loss, and dark neurons were assessed (0: none, 1: rare, 2: occasional, 3: frequent). For MAP-2, intensity and consistency of dendritic staining was assessed (0, uniform staining; 1, patchy loss of staining; 2, extensive loss of staining; 3, complete loss of staining). For SMI-31, samples were assessed for loss of axons and axonal swellings and discontinuities (0, uniform staining; 1, patchy loss of staining; 2, extensive loss of staining; 3, complete loss of staining). For IBA1, relative presence of IBA1-positive cells and morphology of those cells was assessed (0, no IBA1 expression; 1, minimal number of IBA1 positive cells; 2, moderate number of IBA1 positive cells with varying presence of activated microglia [amoeboid shape] and macrophages; 3, high number of IBA1 positive cells with large numbers of activated microglia and macrophages). For GFAP, the relative presence of astrocytes was assessed (0, no GFAP expression; 1, minimal number of GFAP positive astrocytes; 2, moderate number of GFAP positive astrocytes; 3, large number of GFAP positive astrocytes).
Statistical analysis
A univariate general linear mode was used to determine significance for all outcome measures (strain; strain rate; cell death; nitrite; LTP; I50, Rmax, and m S-R parameters; PPR; H&E, MAP-2, SMI-31, GFAP, and IBA1 semiquantitative data) with the respective outcome measure as the dependent factor and the experimental group (sham, single, double) as the fixed factor for each inter-injury interval separately (SPSS v. 19, IBM, Armonk, NY). For cell death, a Bonferroni post-hoc analysis was used to assess significance for each inter-injury interval group separately. To evaluate changes in nitrite concentration a Bonferroni post-hoc analysis was used to determine significance for each inter-injury interval group separately. For LTP, a Bonferroni post-hoc analysis was used to determine significant differences in potentiation among all experimental groups and inter-injury interval groups together. For S-R data, a Bonferroni post-hoc analysis was used to determine significant differences for each parameter (I50, Rmax, m) separately among all experimental groups and inter-injury interval groups together. For PPR, a Bonferroni post-hoc analysis was performed on data from each ISI bin separately to determine significance among all experimental groups and inter-injury interval groups together. For semiquantitative histology and immunohistology data, Dunnett post-hoc analysis was performed for those stains that, showed significance in the ANOVA for each inter-injury interval group separately. Significance was evaluated for all statistical analyses as p < 0.05.
Results
Tissue strain and strain rate were equibiaxial and repeatable
Stretched samples received one or two mild stretch injuries delivered 24, 72, or 144 h apart (Fig. 1A). Injury severity was not statistically different between single and double injury groups or between the first and second injury (Figure 1B, C). Strain was also equibiaxial for all groups (Fig. 1B). The average equibiaxial strain was 12.9% ± 0.3% (± SEM; n = 492). The average strain rate was 5.3 s−1 ± 0.2 s−1 (± SEM; n = 492).
Cell death was more vulnerable to additional injury up to 24 h after an initial mild stretch
Cell death was <5% in all ROI in all sham-injured groups (Fig. 2). Similarly, among samples that received a single mild stretch and a subsequent sham injury (24, 72, or 144 h later), cell death was <5%, as designed by choosing a mild level of stretch. Cell death increased significantly following two injuries delivered 24 h apart as compared with that of samples receiving a single mild stretch or no stretch injury (sham). Cell death was <5% in samples that received no, one, or two mild stretch injuries 72 or 144 h apart, and there was no significant difference in cell death between samples receiving no, one, or two injuries for either inter-injury interval (72 or 144 h). Subsequent excitotoxic exposure, which served as a positive control, increased cell death significantly in all ROI for all inter-injury interval groups. The positive control suggested that OHSCs contained viable cells that were not killed by stretch injury and that a lack of cell death in repetitively injured OHSCs for the 72 and 144 h intervals was not the result of a lack of living cells in the samples.

Cell death resulting from repetitive stretch injury. Cell death increased significantly in all regions of interest (ROI) following two mild stretch injuries delivered 24 h apart, as compared with the time-matched sham and single stretch groups (left, n ≥ 15, ± SEM, *p < 0.05). When the interval between injuries was increased to 72 h (middle) or 144 h (right) cell death did not increase significantly in any ROI compared with the time-matched sham or single stretch groups (n ≥ 12, ± SEM, *p < 0.05 compared to sham and single 24 h interval). Excitotoxic exposure to glutamate following repetitive injury served as a positive control for the presence of living cells (n ≥ 12, ± SEM, *p < 0.05 compared to all other time-matched groups).
Nitrite production was more vulnerable to additional injury up to 24 hours after an initial mild stretch
Nitrite concentration in the medium was significantly increased following the repetitive mild stretch injury with the 24 h interval compared with the sham (Fig. 3). When the interval between exposures was increased to 72 or 144 h, nitrite concentration was no longer significantly elevated following the repetitive injury.

Nitrite concentration in medium following single and repetitive stretch injury. Nitrite was increased significantly following repetitive injury with the 24 h interval (n ≥ 10, ± SEM, *p < 0.05 compared to sham 24 h interval) but not for the 72 or 144 h intervals (n ≥ 6, ± SEM).
Long-term potentiation was more vulnerable to additional injury up to 72 h after an initial mild stretch
Potentiation following the sham exposure (24 h interval) was >50% (Fig. 4). LTP was not significantly reduced by a single mild stretch injury but was significantly reduced by repetitive mild stretch injury (24 h interval). When the inter-injury interval was extended to 72 h, LTP was still significantly depressed compared with that of the 24 h interval sham group. When the inter-injury interval was extended to 144 h, LTP was no longer significantly reduced compared with the sham group for the time-matched controls (144 h interval) or shams of the 24 h interval. Samples that received two sham injuries 144 h apart did not have significantly different LTP compared with that the 24 h interval sham group, suggesting that the extended time course of the experiment was not detrimental to potentiation.

Long-term potentiation (LTP) following single and repetitive stretch. LTP was reduced significantly following repetitive stretch injury for the 24 and 72 h intervals (n ≥ 6, ± SEM, *p < 0.05 compared with sham 24 h interval and 144 h intervals). LTP was not significantly altered when the interval between stretch injuries was extended to 144 h. LTP following sham injury with a 144 h interval was not significantly different from that of sham injury with a 24 h interval.
S-R parameters were not altered significantly by repetitive mild stretch injury
S-R parameters were minimally altered as a result of single or repetitive mild stretch injuries for any of the inter-injury intervals evaluated (Fig. 5). Neither I50 (Fig. 5A), Rmax (Fig. 5B), nor m (Fig. 5C) were significantly different for any of the experimental groups.
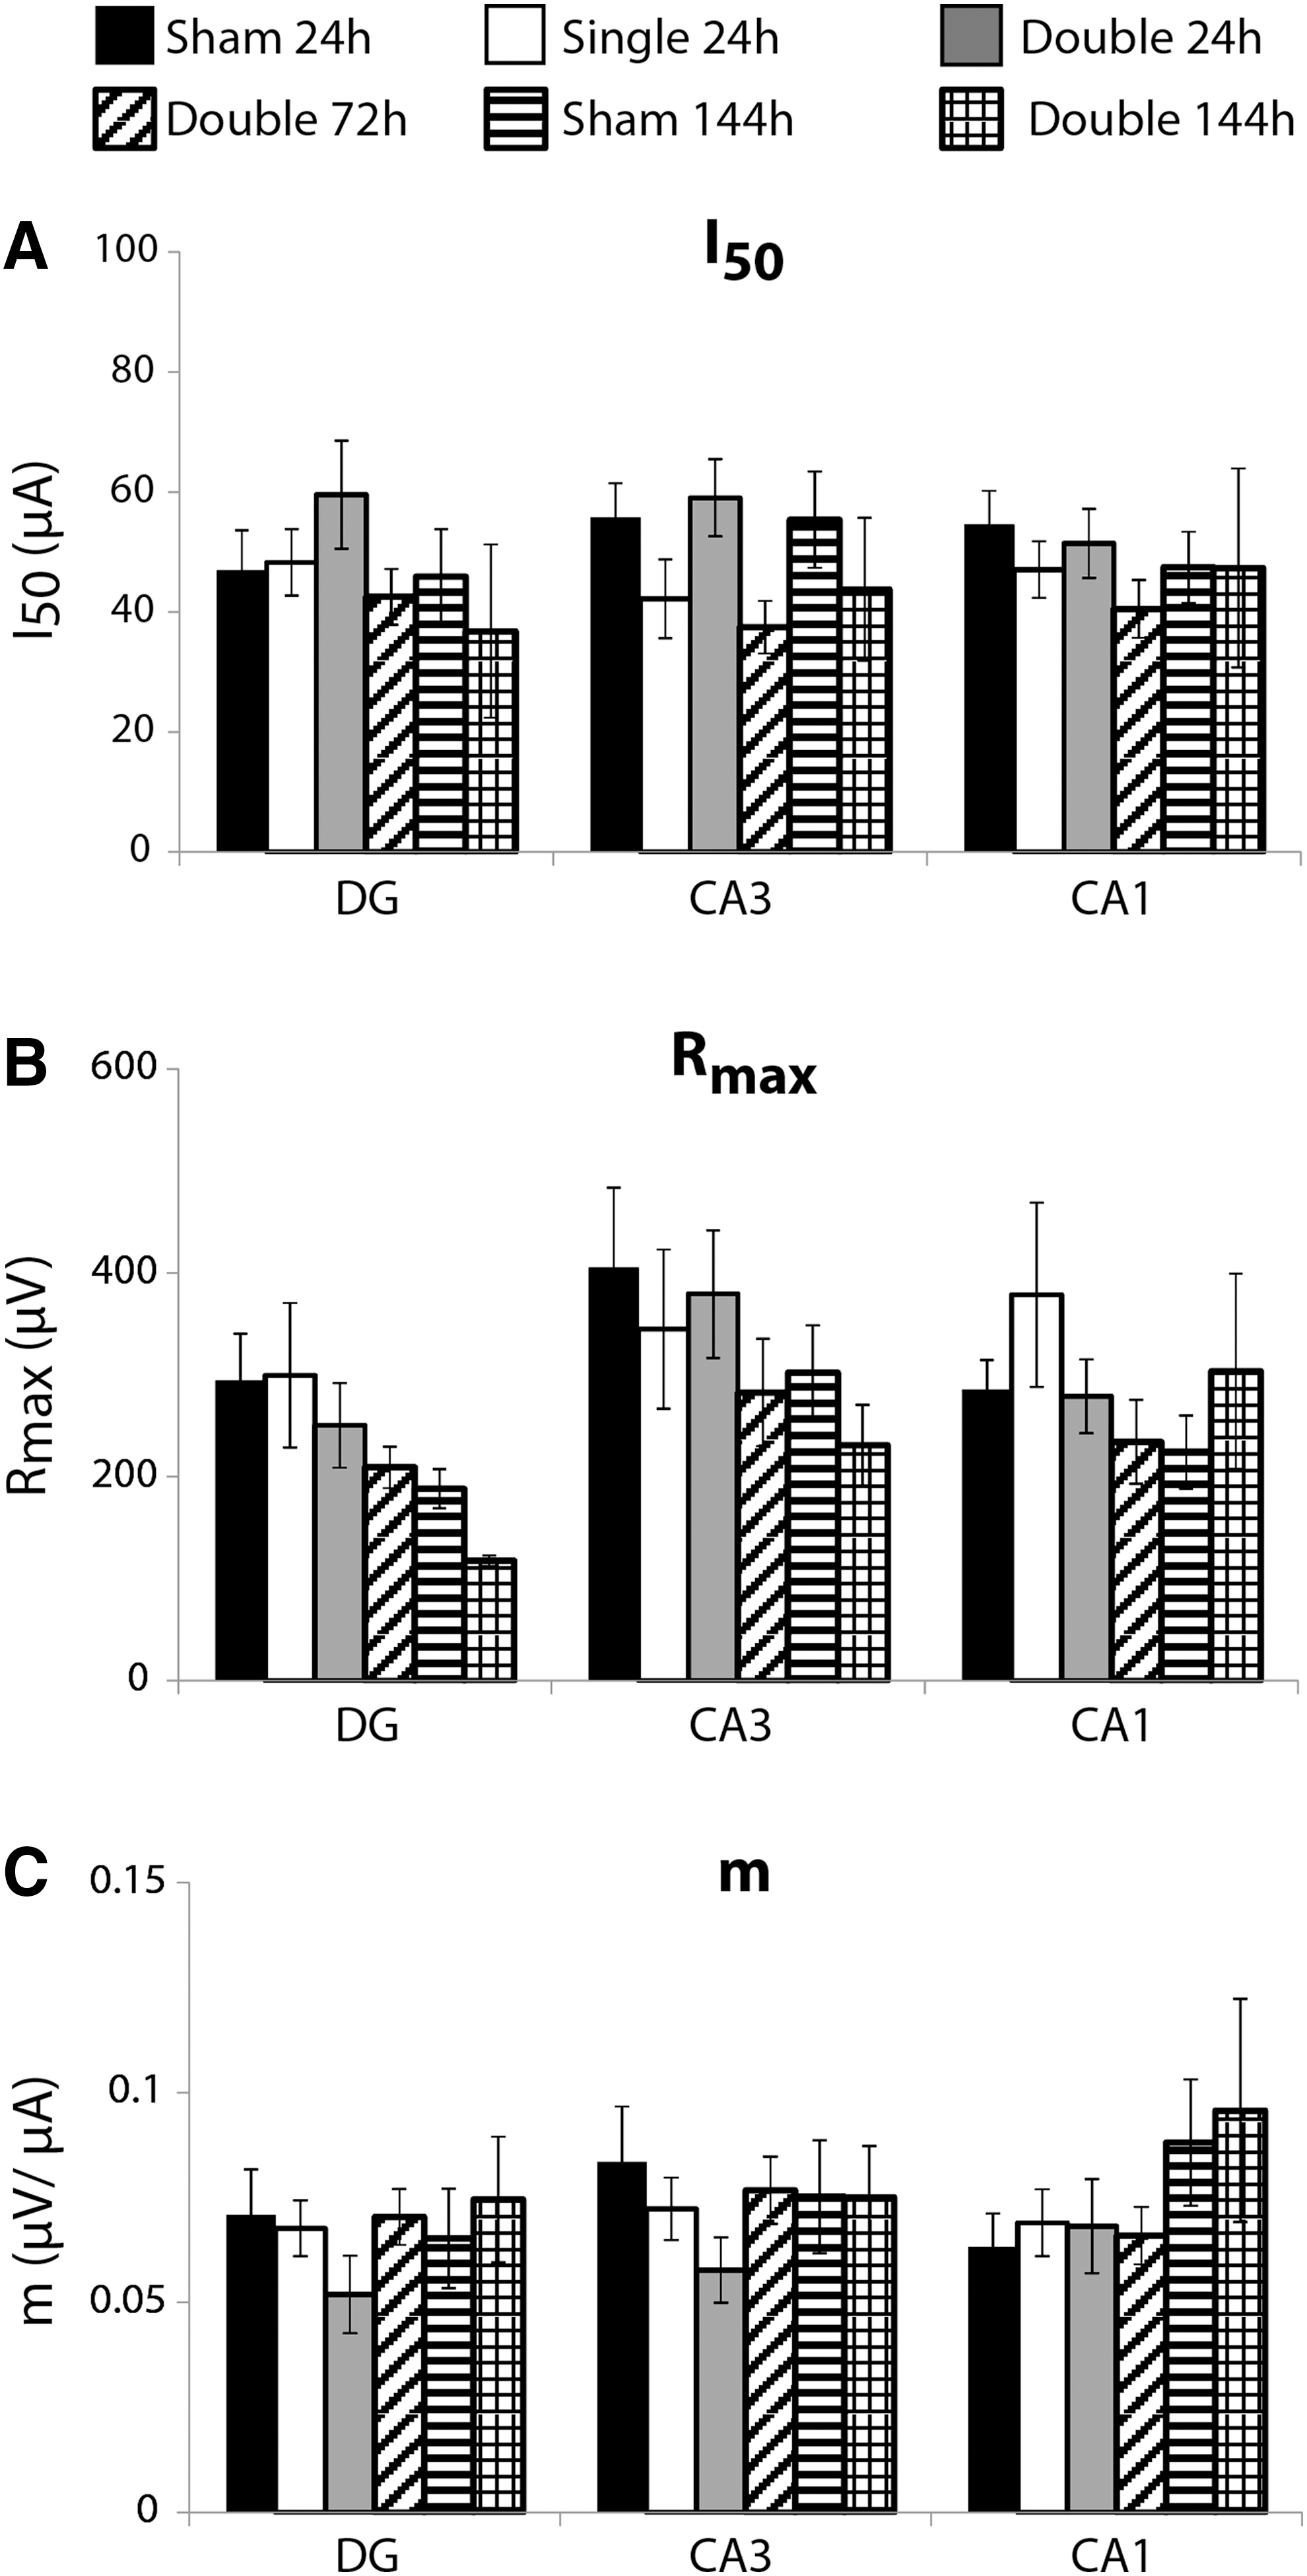
Stimulus-response parameters following repetitive mild stretch injury.
Short-term plasticity was mostly not altered significantly by repetitive mild stretch injury
Short-term plasticity was minimally altered as a result of single and repetitive mild stretch injury (Fig. 6). There was no significant change in PPR for any group for any ROI with the exception of the double injury group with a 72 h inter-injury interval, which was significantly different from that of the 24 h interval single injury group in the DG. There was no significant change in PPR for any experimental group in any ROI for the Early-Mid ISIs (Fig. 6B), Late-Mid ISIs (Fig. 6C), or Late-Term ISIs (Fig. 6D).
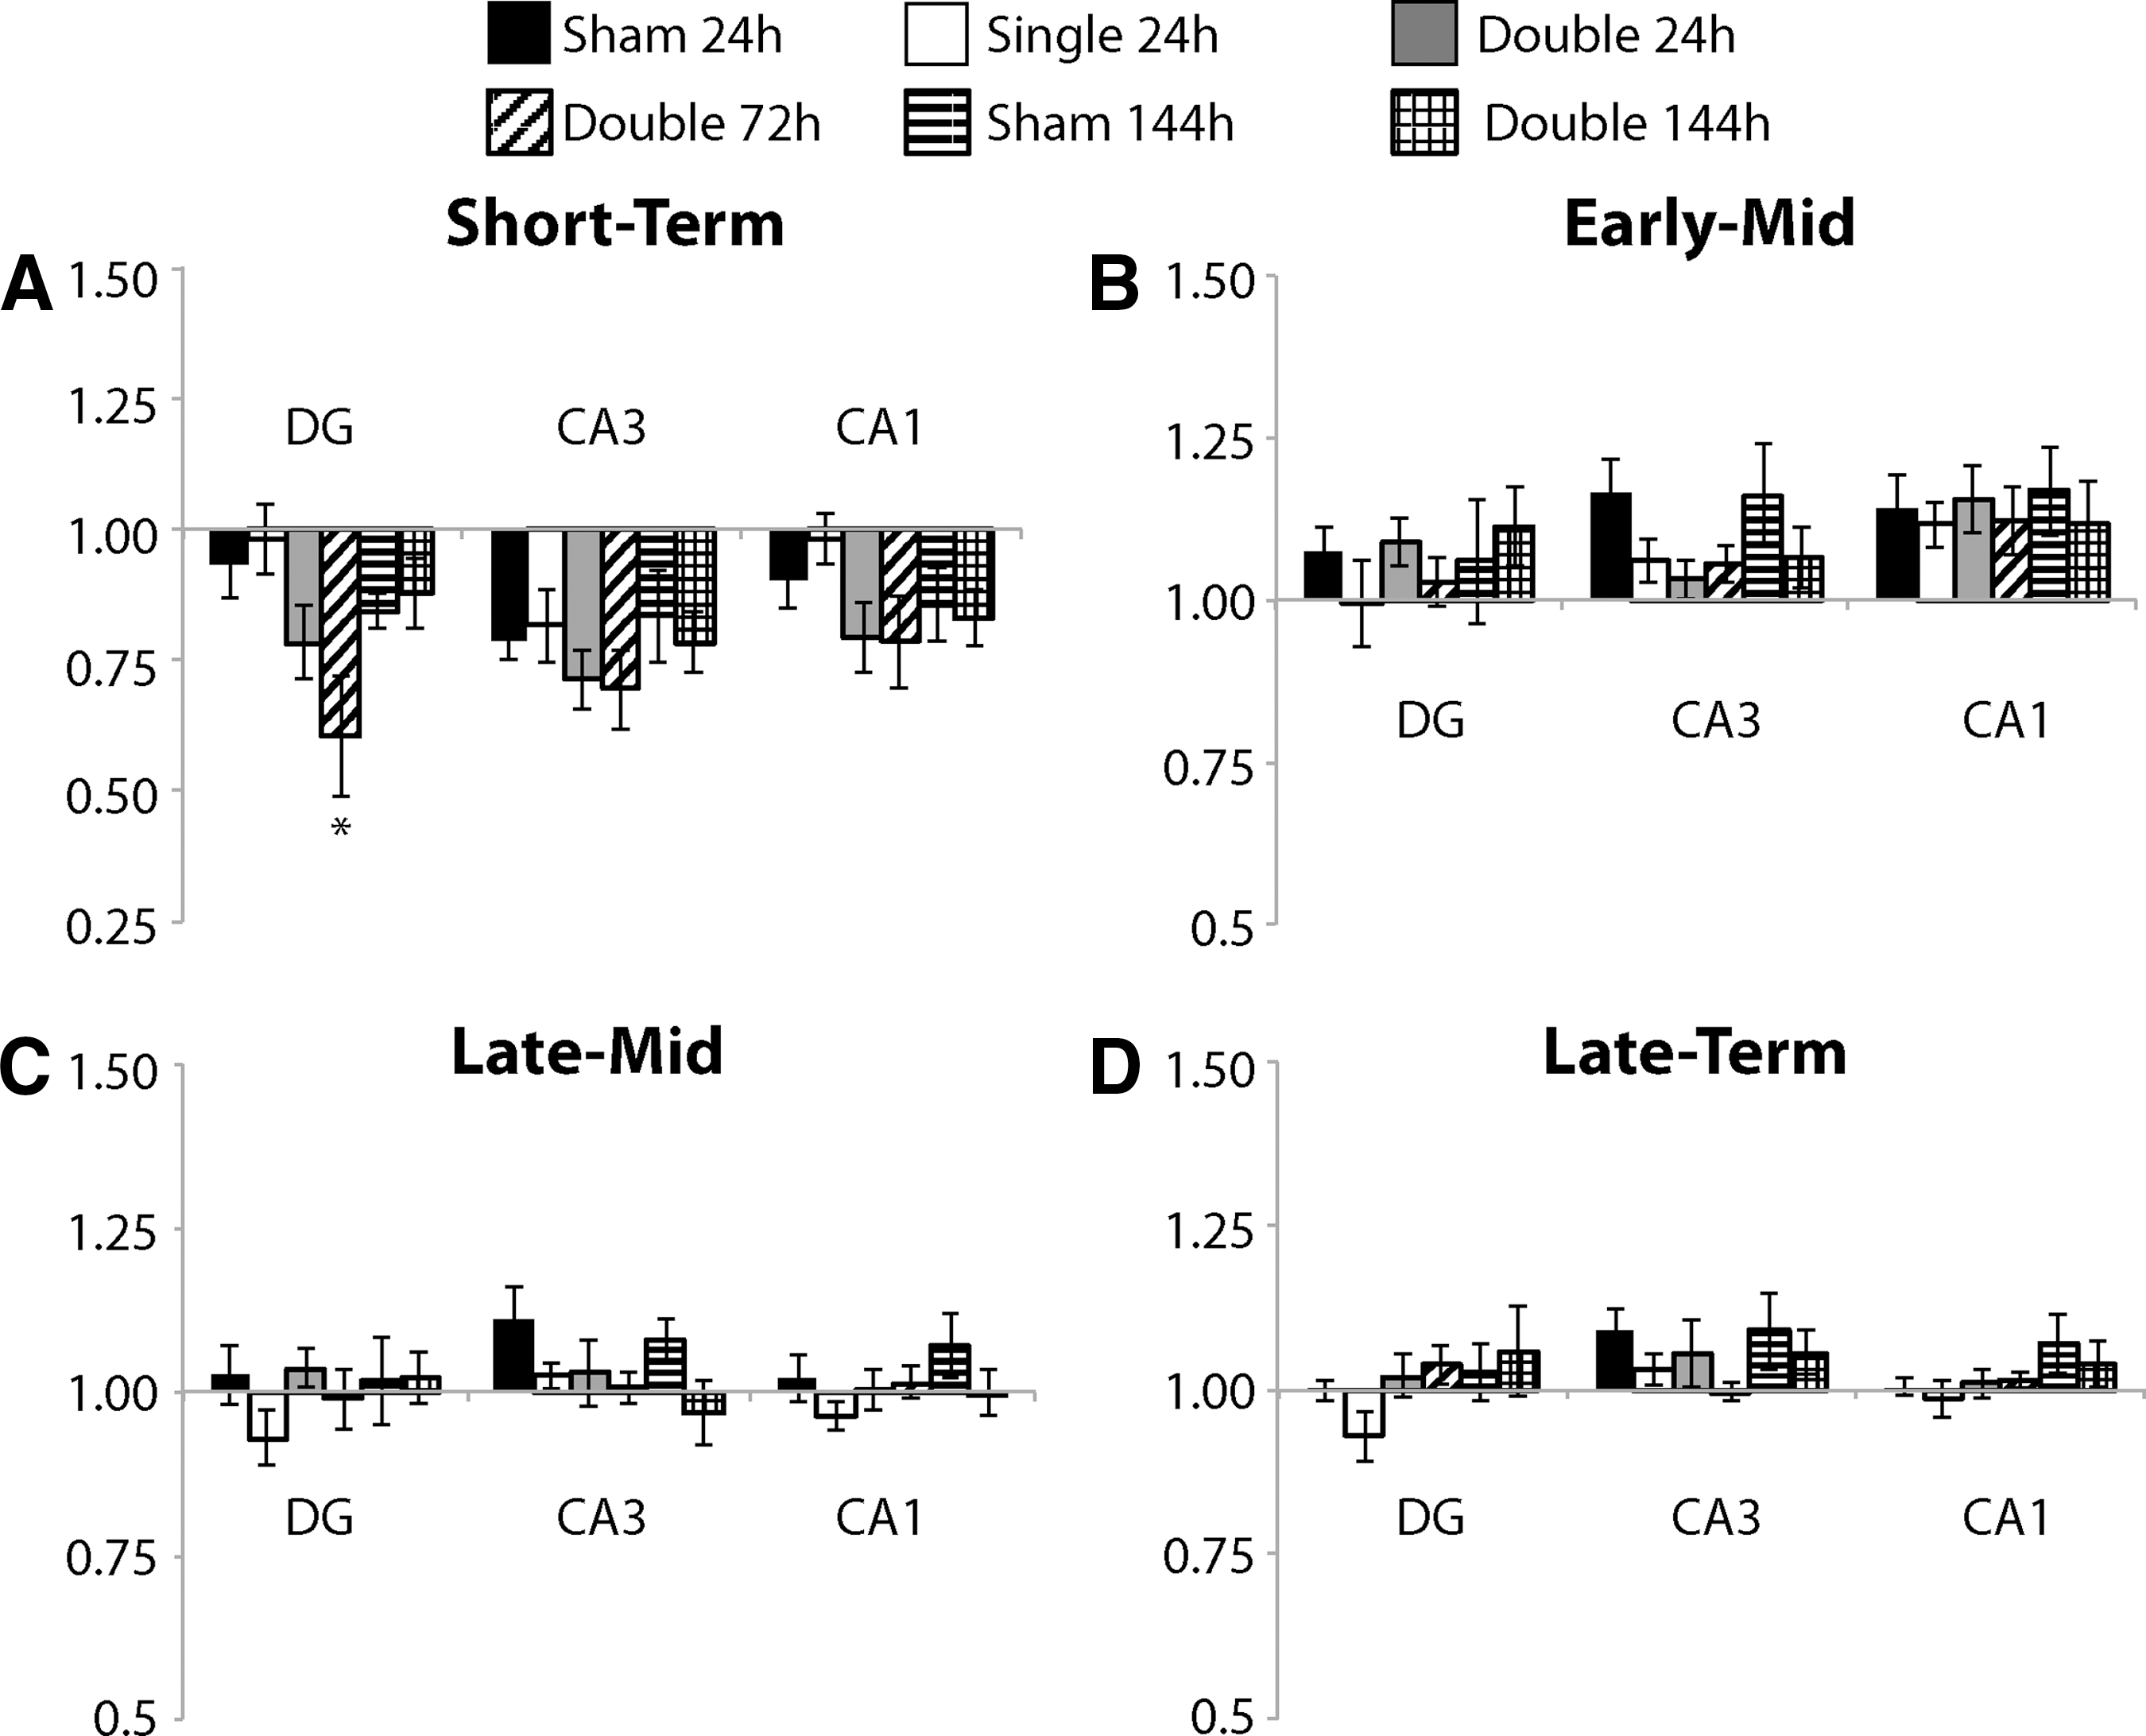
Short-term plasticity following repetitive mild stretch injury.
Cell injury and astrogliosis was more vulnerable to additional injury; astroglial vulnerability persisted for 72 h after mild stretch
Increased cell loss and shrunken cell bodies were observed along principal cell layers of the hippocampus, primarily in the CA1, of repetitively injured OHSCs with the 24 h inter-injury interval (Fig. 7C, E). Semi quantitative analysis of H&E stained sections revealed a significant increase in pathology in repetitively injured samples compared with the sham for the 24 h interval, which was not observed for the 72 or 144 h intervals (Fig. 8A).
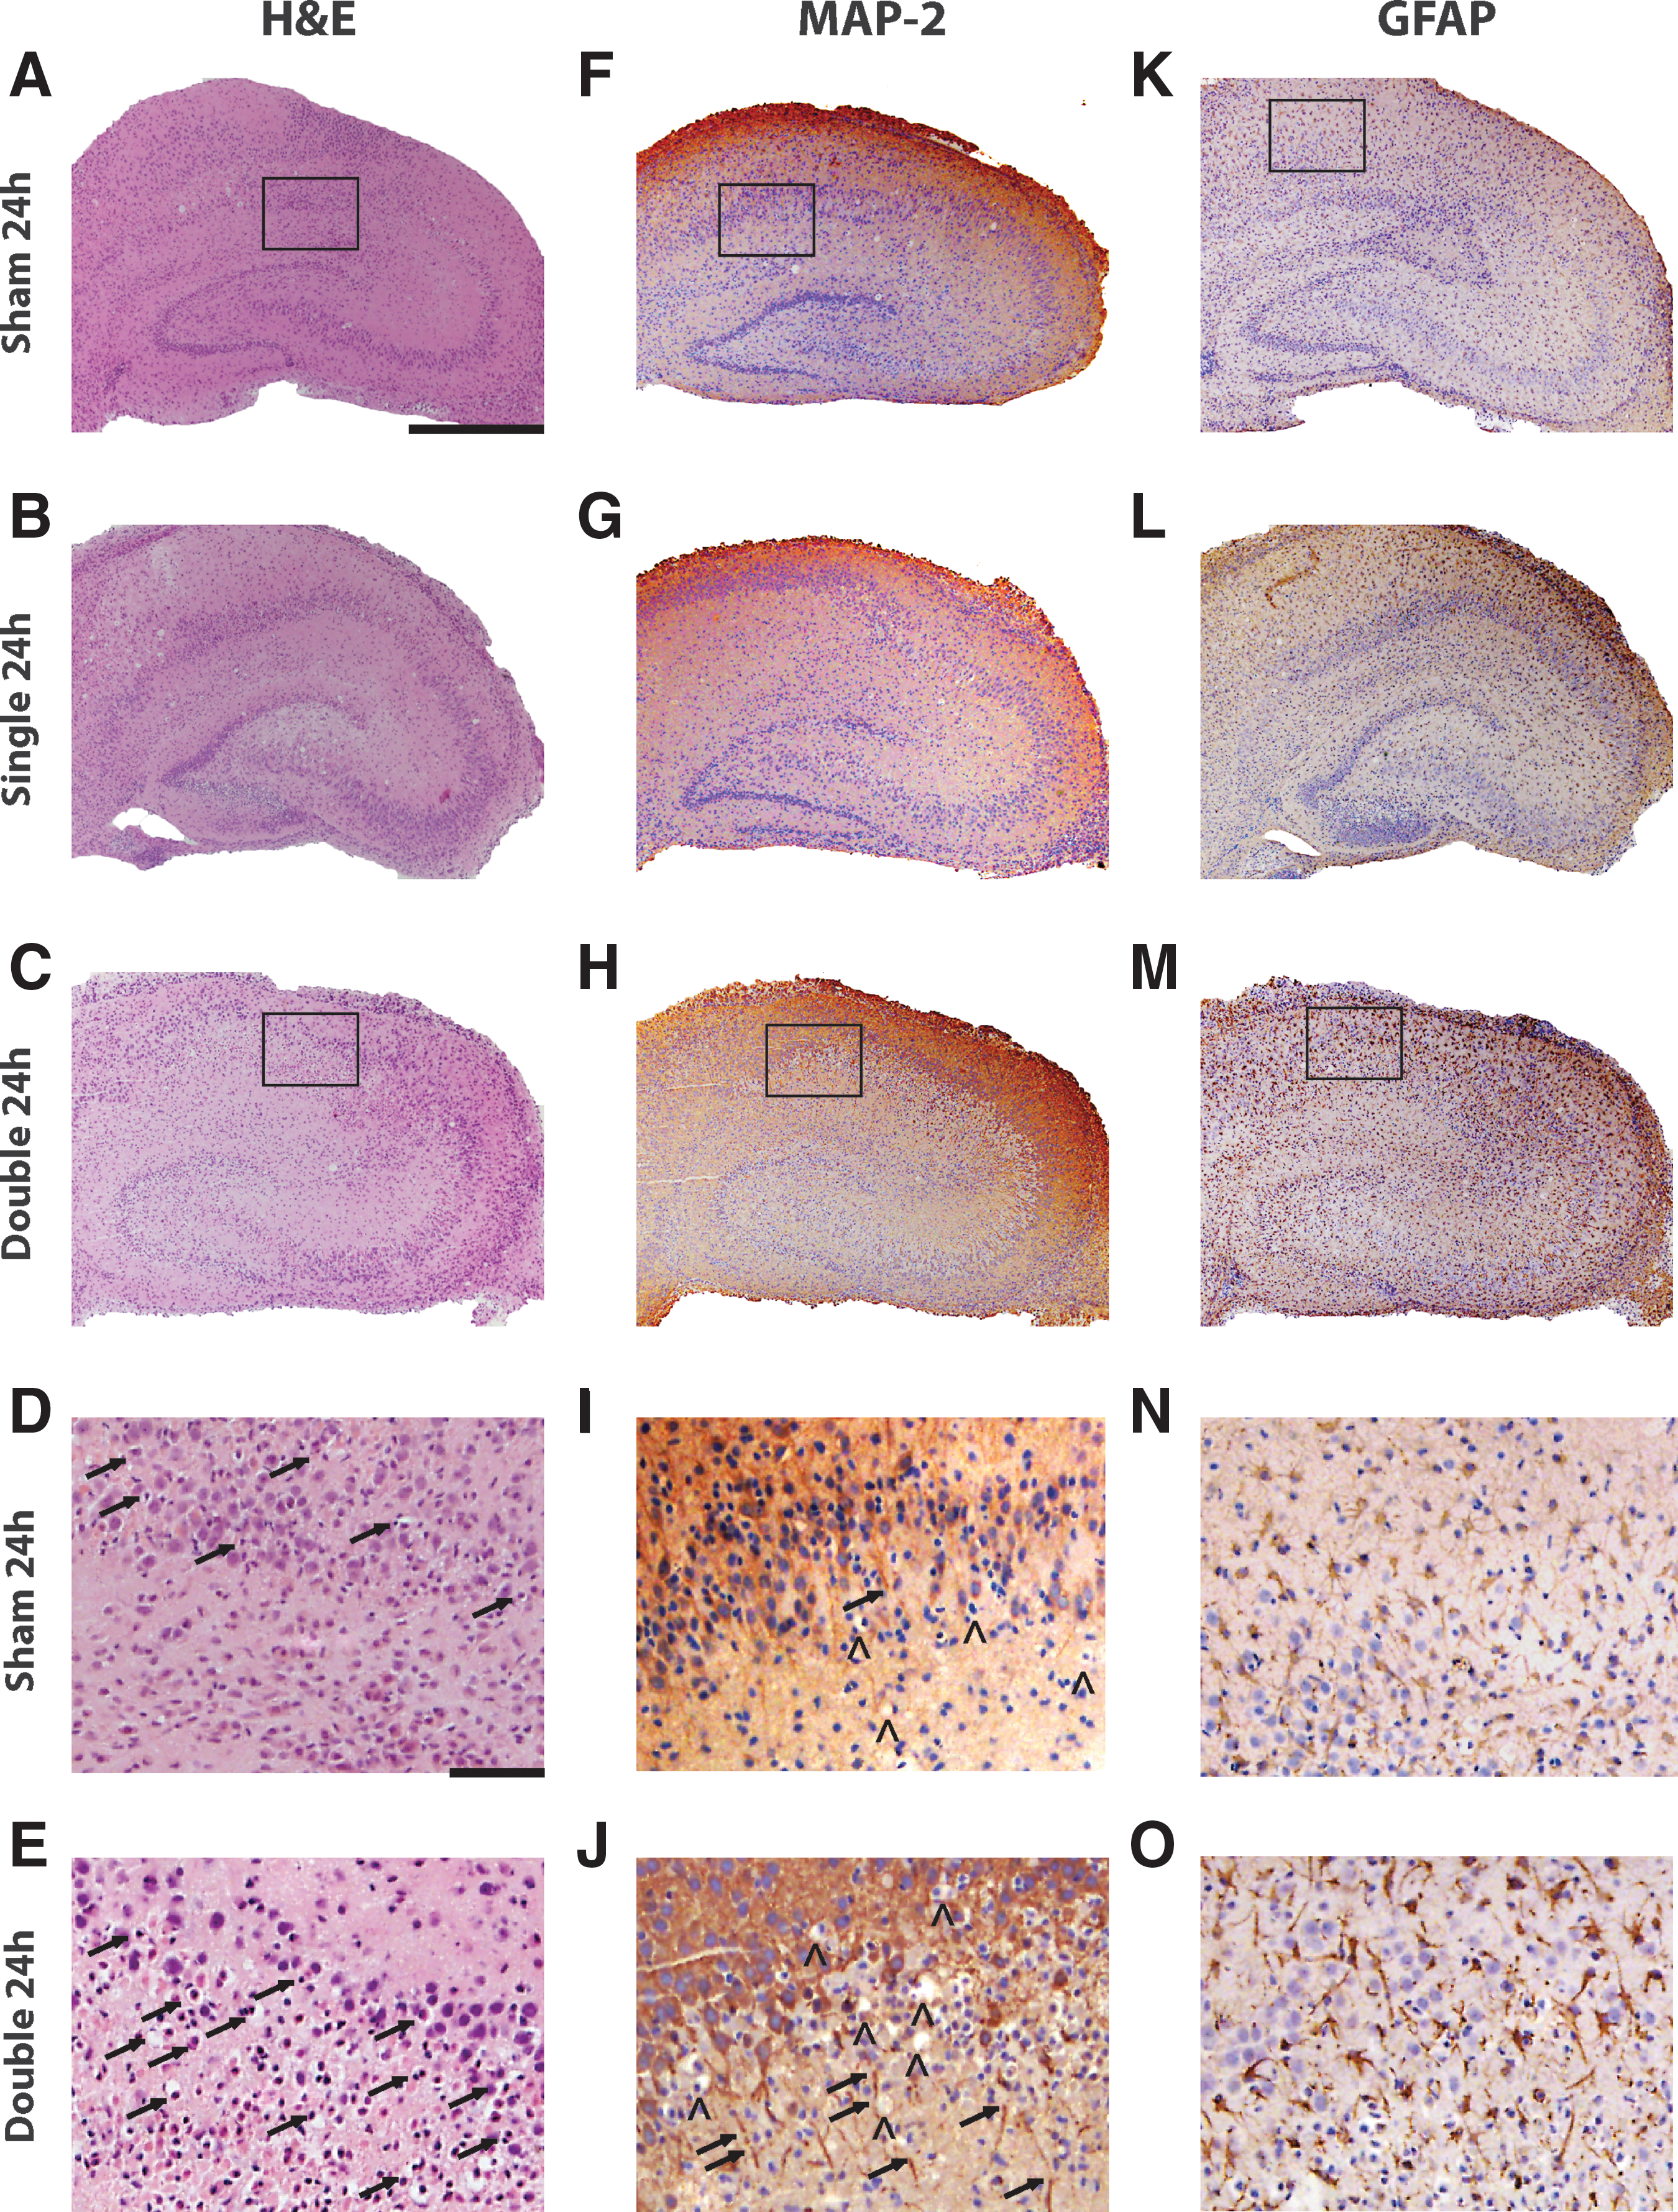
Histology and immunohistology of the 24 h inter-injury interval.
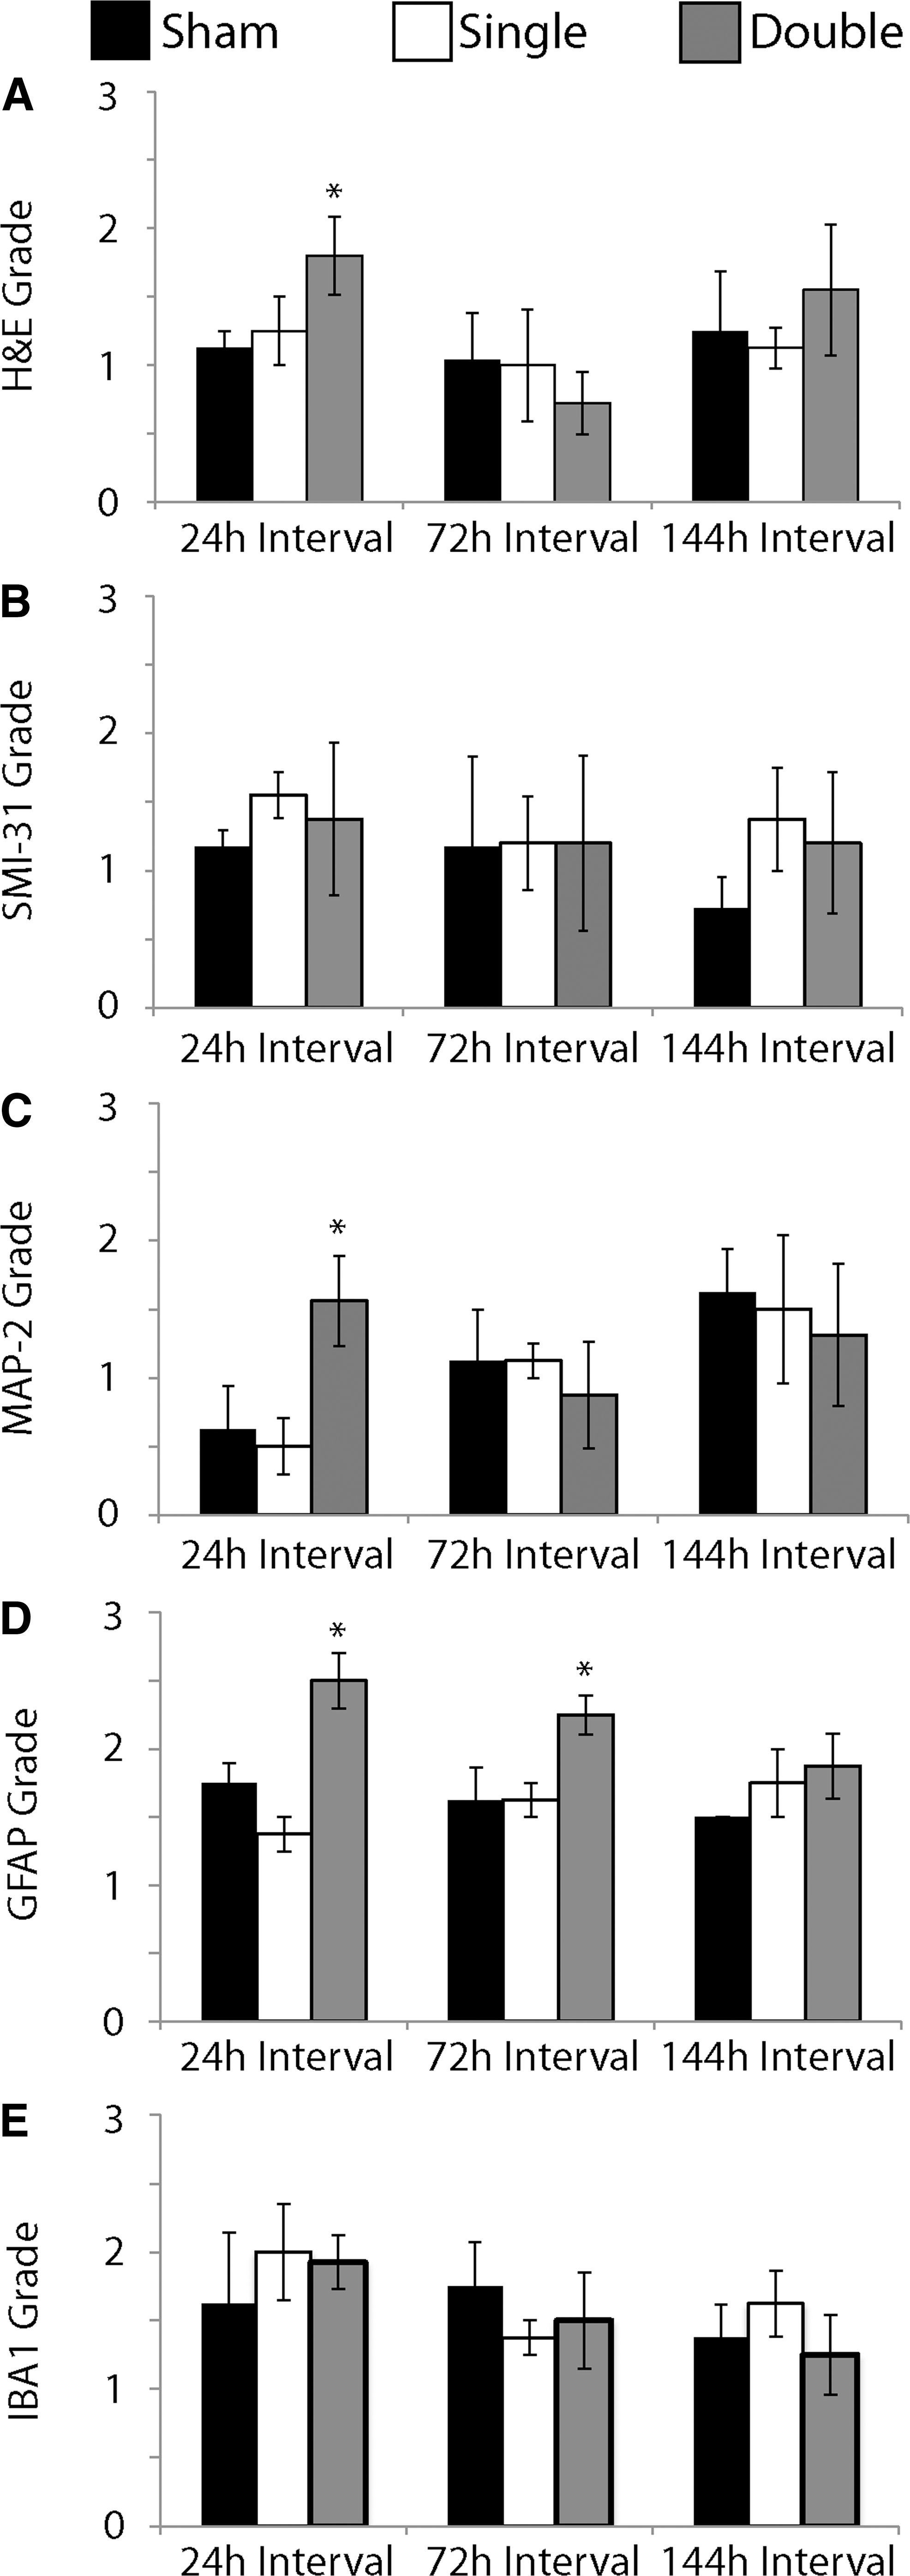
Semi-quantification of histology and immunohistochemistry.
All samples stained with SMI-31 to visualize pNF-H had consistent and complete staining throughout OHSCs (images not shown). There was no significant difference in semiquantitative data for any group and the three different inter-injury intervals for SMI-31 staining (Fig. 8B).
Loss of MAP-2 staining, discontinuities in dendrites, and areas of darker staining were observed along the principal cell layers of the hippocampus of repetitively injured OHSCs with the 24 h interval (Fig. 7H, J). Semiquantitative analysis of MAP-2 staining to visualize dendrites revealed a significant increase in grade, corresponding to increased pathology, in samples that were repetitively injured compared with shams for the 24 h interval (Fig. 8C).
An increase in density of GFAP-positive cells and GFAP immunoreactivity was observed in samples that received repetitive injury with either a 24 h (Fig. 7M, O) or 72 h interval (not shown). Semiquantitative analysis of GFAP staining revealed a significant increase in astrogliosis in these samples compared with their time-matched controls. There was no significant difference in GFAP grade among experimental groups for the 144 h interval (Fig. 8D).
IBA1 staining for microglia and macrophages did not appear different among samples (images not shown). Semiquantitative analysis of IBA1 stained samples confirmed there was no significant difference between each experimental group and its time-matched control for any of the inter-injury intervals (Fig. 8E).
Discussion
Previous studies have suggested that an initial mTBI initiates a period during which the brain is more vulnerable to subsequent injury, such that a second injury results in a supra-additive injury response. 21,22 Ours is the first to study this phenomenon using OHSCs, and we report that this period of increased vulnerability lasted for at least 24 h. For cell death, dendritic loss, and nitrite production, this vulnerability lasted as long as 24 h, but did not exceed 72 h. For LTP and astrogliosis, this vulnerability lasted as long as 72 h but did not exceed 144 h. These findings suggest that increasing the time between mTBI exposures can mitigate a more detrimental injury response and that our culture system may be valuable for further investigation into the mechanisms responsible for this phenomenon.
A major strength of our in vitro stretch injury model is its precise control of the tissue biomechanics, which can be adjusted to concussion-relevant loading. Video analysis and accelerometers have been used to quantify head motion of athletes during safe play as well as play resulting in brain injury. 23 –25 Subsequently, finite element models (FEMs) were used to predict deformation of the brain in response to these head motions and macroscopic kinematics. 23,24,26 In the parahippocampal gyrus, average peak strain out to 8 ms following impacts causing concussion was 10.8% ± 9.4% at 24.5 ± 28.2 s−1 strain rate (mean ± standard deviation). In noninjurious head impacts, strain was significantly lower (4.3% ± 3.7%, 17 ± 9.3 s−1 strain rate). 24 These studies begin to define the macroscopic biomechanics of concussion; however, it is important to note that those approaches have limitations. For example, several studies have examined systematic as well as large random errors associated with helmet-based accelerometers. 27 –29 Additionally, parameters extracted from video analysis can be limited by the frame rate of the recording and ability to extract three-dimensional measures stereographically. 30 Predicting the tissue-level response from macroscopic biomechanics is limited by the biofidelity of the FEMs, many of which have not been adequately validated for shear strain and are constrained by the limited characterization of brain tissue mechanical properties under large deformations at high strain rates. 31,32 To directly characterize the biomechanics of brain tissue for non-injurious head motion, magnetic resonance imaging (MRI) has been used to measure tissue-level strains in the human brain under volunteer-conditions. 33,34 These studies reported that brain motion ≤5% strain was noninjurious. Similarly, using our stretch injury model, we have previously shown that a single stretch injury with strains <20% does not cause significant cell death in OHSCs, independent of strain rate. 35 Therefore, we delivered a ∼12.9% strain, ∼5.3 s−1 strain rate stretch to evaluate the inherent response of isolated brain samples to repetitive injury with loading conditions that mimicked real-world sports injury.
Another strength of the in vitro stretch injury model with OHSCs is that a mechanical stimulus is delivered directly to a brain tissue sample. OHSCs maintain in vivo neural connectivity, complex neuron and glia interactions, and neural function. 35,36 In vitro OHSCs also respond to mechanical injury similarly to the brain in vivo. 35,36 At the conclusion of all experimentation, OHSCs were P30–32, which is approaching the age of adulthood for a rodent and is thought to be comparable to a 10–12-year-old human in terms of brain maturation. Therefore, our model of repetitive mTBI may be especially relevant for study of repetitive mTBI in juveniles. 37 –41 Other clinical and pre-clinical in vivo studies have suggested that increasing the inter-injury interval may mitigate a synergistic injury response. 21,42,43 However, in vivo studies can be confounded by systemic effects, and clinical studies can be confounded by complex patient histories. By corroborating these findings with an in vitro slice culture model, we have shown that this phenomenon is an inherent response of the brain tissue. Our results suggest that heightened vulnerability following an initial mTBI lasts for as long as 72 h, and may have subsided by 144 h post-injury. Other clinical studies suggest that an initial concussion may increase vulnerability to further injury for ≥15 days. 44 –48 In other in vitro studies, the duration of heightened vulnerability was reported to be at least 1 h long, but not longer than 24 h; repetitive injury with a 1 h inter-injury interval resulted in significant cell death and loss of MAP-2 staining. 52 Both the 1 and 24 h inter-injury intervals significantly increased extracellular neuron-specific enolase and S-100β. 52 In most recent in vivo studies, heightened vulnerability lasted ≥3 days, depending on the outcome measure assessed. 42,49 –51 Here, we also showed that the period of heightened vulnerability was dependent upon the outcome measure, which may account for discrepancies among studies.
Repetitive mild injury with a 24 h interval between exposures resulted in as much as 20% cell death. This injury paradigm significantly altered LTP but did not significantly change S-R parameters or most PPRs. Using our previously defined tolerance criteria, a single stretch of 12.9% at 5.3 s−1 is predicted to not alter neuronal function or cause cell death. 15,52 Although it may seem unlikely that cell death may occur in the absence of changes to basal evoked function, our previously published tolerance criteria for single injuries predicted that strains of 20–41% with a 5.3 s−1 strain rate would result in cell death, but would not significantly alter S-R or PPR parameters. 15,52 It may be possible that there exists a spectrum of cell loss and a critical amount of cell loss beyond which changes in basal evoked function are also observed; however, to our knowledge, there have been no studies directly correlating cell loss with basal evoked function or neural function in general. Therefore, a 41% strain, 5.3 s−1 strain rate stretch injury may result in the critical value of cell loss, which was previously reported to result in >40% cell death in the CA3 and CA1, and nearly 30% cell death in the DG. 15 Similarly, in a study of repetitive closed head injury (CHI) in vivo, PPRs of hippocampal tissue harvested from mice that received three CHIs 24 h apart was not significantly different from that of single and sham injury. 53 In this same study, repetitive CHI significantly increased LTP and modified action potential amplitude and width in ipsilateral CA1 hippocampal neurons compared with sham. 53 However, many in vivo studies report that single and repetitive mTBIs result in loss of LTP in hippocampal slices excised from injured animals. 54 –57 For the 72 h inter-injury interval, we observed no change in cell death or basal evoked function; however, LTP was significantly reduced. Several studies have reported altered LTP without significant loss of cells. 18,58 These findings together suggest that repetitive stretch injury may disrupt post-synaptic signaling mechanisms responsible for LTP induction.
Experimental studies suggest that heightened injury vulnerability and a synergistic injury response from repetitive injury are associated with oxidative stress resulting from mitochondrial damage or dysfunction. 21,59 Damage to the mitochondria and production of reactive oxygen species (ROS) have been observed in many studies both in vivo and in vitro following TBI; even mild mechanical stimulation of the brain or brain cells can initiate changes in ROS that can persist for days. 21,60 Stretch injury of isolated primary astrocytes can initiate astrocyte activation and increase nitrite production, which we observed in our studies. 61 Although we did observe a significant increase in astrogliosis for the double injury for both the 24 and 72 h intervals, we did not see a significant increase in nitrite production for the 72 h interval. These results suggest that the observed increase in nitrite production may not be tied directly to astrogliosis. Our data do suggest that repetitive injury resulting in a significant increase in cell death is associated with a significant increase in nitrite. It is unclear whether the observed increase in nitrite caused the increased cell death, or vice versa; however, other studies suggest that oxidative stress may lead to the cumulative and chronic effects of repetitive mTBI, including deficits in cognitive function and neuroplasticity, such as the LTP deficit we observed. 60,62,63 Therefore, indicators of oxidative stress may be promising biomarkers or therapeutic targets for mild injury and for preventing heightened vulnerability following concussion. 63 –65
Previous studies suggest TBI and mTBI can result in loss or abnormalities in neuronal cytoskeletal proteins such as NF-H and MAP-2 in the hippocampus. 66 –68 We observed loss of MAP-2 staining following repetitive mild stretch injury with a 24 h inter-injury interval without a significant difference in pNF-H. In studies of spinal cord injury and TBI, loss of MAP-2 immunoreactivity has been suggested to precede loss of pNF-H, which was delayed up to 1 week following injury. 68,69 Additionally, an in vitro study of repetitive stretch injury of primary hippocampal cells reported cell death and preferential loss of MAP-2-positive cells 24 h following two mild stretch injuries delivered 24 h apart; neurofilament was not evaluated in this study. 22 We may not observe a change in pNF-H because OHSCs were fixed for immunohistochemistry 72 h following the second exposure.
We observed an increase in GFAP-positive cells following repetitive mild stretch injury for the 24 and 72 h inter-injury intervals without a significant change in the presence or activation of microglia and macrophages (Figs. 7 and 8). In vivo studies of TBI and mTBI report gliosis following injury and repetitive injury in the hippocampus. 54,66 However, in vivo TBI can also cause injury to the blood–brain barrier (BBB), which can expose the brain to blood-serum constituents that may independently initiate gliosis. 70 Here, OHSCs were stretch-injured in the absence of a BBB and blood-serum constituents that could have initiated the glial response. The astrogliosis we observed was thus an inherent response of the brain tissue to repetitive mild stretch injury. Astrogliosis can cause injury to neurons; therefore, useful strategies to mitigate injury from repetitive close-head trauma may need to target astrocyte activation. 61
Conclusions from our study are limited to the scope of in vitro OHSCs. Therefore, it will be important to evaluate repetitive mTBI experimentally in vivo and clinically to better identify appropriate rest periods for the injured athlete. Additionally, our samples may be at a similar maturity as the juvenile brain; as such, studies of brain samples at an adult maturity level will be necessary to better understand age-dependent effects on the phenomenon we identified here. We evaluated brain response starting at 72 h following the second exposure, because our previous studies suggested that cell death develops slowly over the course of 72–96 h following a single stretch injury. 22,30 Repetitive injury may have a different time course for development of pathology; evaluation of pathology at more regular intervals over time may be valuable for understanding the tissue's response to each injury repetition and identifying critical time points for intervention. Additionally, although we identified that repetitive injury with the 24 h interval resulted in a significant increase in nitrite production, future studies are necessary to determine the mechanism for this phenomenon and the role of oxidative stress in this response.
In this study we have shown that heightened vulnerability following mild mechanical injury is an inherent phenomenon of brain tissue. LTP deficits, astrogliosis, nitrite production, cell loss, and dendritic damage experienced a supra-additive increase with repetitive injury. We quantified the duration of this heightened vulnerability and found that LTP and astrogliosis remained vulnerabile to repetitive injury for a longer period of time than some structural or biochemical indicators of tissue health such as cell loss, dendritic damage, or nitrite production. These findings suggest that rest periods to increase the interval between concussions may be effective for preventing a synergistic pathological response to subsequent injury.
Footnotes
Acknowledgments
This research was funded in part by Grant 1 R49 CE002096 from the National Center for Injury Prevention and Control of the Centers for Disease Control and Prevention to the Center for Injury Epidemiology and Prevention at Columbia University Medical Center. The contents of the manuscript are the sole responsibility of the authors and do not necessarily reflect the official views of the funding agency. The authors acknowledge Roy Wang, Elise Gill, Kimberly A. Lynch, Tiffany Ong, Shruthi Nammalwar, Ayelet Lobel, Andrea I. Ortuño, Lamia Ateshian, Andrew A. Dobitsch, and Stephanie Yang for their skilled technical assistance in culture preparation and maintenance, stretch injury, and data analysis.
Author Disclosure Statement
No competing financial interests exist.