
Abstract
Yucatan micropigs have brain and spinal cord dimensions similar to humans and are useful for certain spinal cord injury (SCI) translational studies. Micropigs are readily trained in behavioral tasks, allowing consistent testing of locomotor loss and recovery. However, there has been little description of their motor and sensory pathway neurophysiology. We established methods to assess motor and sensory cortical evoked potentials in the anesthetized, uninjured state. We also evaluated epidurally evoked motor and sensory stimuli from the T6 and T9 levels, spanning the intended contusion injury epicenter. Response detection frequency, mean latency and amplitude values, and variability of evoked potentials were determined. Somatosensory evoked potentials were reliable and best detected during stimulation of peripheral nerve and epidural stimulation by referencing the lateral cortex to midline Fz. The most reliable hindlimb motor evoked potential (MEP) occurred in tibialis anterior. We found MEPs in forelimb muscles in response to thoracic epidural stimulation likely generated from propriospinal pathways. Cranially stimulated MEPs were easier to evoke in the upper limbs than in the hindlimbs. Autopsy studies revealed substantial variations in cortical morphology between animals. This electrophysiological study establishes that neurophysiological measures can be reliably obtained in micropigs in a time frame compatible with other experimental procedures, such as SCI and transplantation. It underscores the need to better understand the motor control pathways, including the corticospinal tract, to determine which therapeutics are suitable for testing in the pig model.
Introduction
E
Yucatan micropigs are emerging as a useful model for SCI studies. 9 Though their brains have been mapped for stereotaxic purposes, little is known regarding the anatomy and neurophysiology of their spinal cord tracts. 10 –12 This information is important to advance the model. For human SCI therapeutics research, EPs may be valuable tools to assess the tolerance of injured spinal cord pathways to treatments, such as intraparenchymal cell transplants. For these interventions, residual signals post-SCI can provide a baseline to determine whether an intervention compromises retained connectivity. An example is whether the volume and rate of delivery of a cellular injection exceeds a critical threshold and causes additional injury, evidenced by sustained reduced conduction. Such methods are infrequently used in SCI clinical trials, exposing patients to increased risk to their preserved neurological function. This type of safety testing has been studied for intracerebral injections in the Gottingen minipig model. 13
EPs require both time and technical proficiency. Intraoperative testing should be conducted in a time frame compatible with other study procedures, not excessively prolonging anesthesia. Reliable, accurate, and rapid testing requires experience and development of suitable methodology. We sought to develop robust methods for EP stimulation and recording in the Yucatan model. 9,14,15 In addition, we assessed the time required to conduct different combinations of the tests because both the risk for complications, and costs, are increased with the duration of surgical procedures. 16,17
During this study, aspects of porcine MEPs and SSEPs, such as pathways, detection frequency, reproducibility, latency, and amplitude, were characterized across the sample. We also studied the motor and sensory EPs elicited by epidural stimulation of the dorsal surface of the thoracic spinal cord at sites selected to span a subsequent contusion injury. We hypothesized that epidural stimulation (ES) would be associated with larger amplitudes and superior signal-to-noise ratios increasing the sensitivity of EP detection. The muscle detection sensitivity of transcranial versus epidural evoked potentials was determined. Because our current porcine model is based on thoracic SCI and treatments to increase locomotor recovery, this study emphasized the detection of lower extremity muscles. We focused on an electromyography (EMG) readout, as compared to direct spinal cord potentials, with a view to repeated longitudinal assessments, not requiring subsequent surgical exposure of the spinal cord.
Methods
Experimental design
The experiments assessed the feasibility to acquire reliable EPs before and after laminectomy and before thoracic contusive SCI. To define reference values, we determined the consistency of EPs between animals that differed, to some extent, in age and weight. EPs were obtained from 26 animals in four ways: 1) transcranial electrical stimulation (TcES) to evoke MEPs in limb muscles; 2) transcranial somatosensory recordings (SSEPs) elicited by repetitive peripheral nerve stimulation; 3) MEPs; and 4) SSEPs evoked by epidural stimulation (Fig. 1). Of 26 animals, 10 underwent all four testing modalities. In 8, we focused on testing TcES compared to epidural motor stimulation (motor group), and in 8 epidurally and peripheral nerve evoked SSEPs were compared (sensory group).

Key landmarks for the porcine electrophysiology protocol (
The more limited testing helped determine the time-saving as compared to testing all four modalities. However, each animal had at least a minimum baseline motor and sensory data set. For each type of EP, the percentage of successful recordings/total stimuli and the range of values were determined. The relative sensitivity and consistency of the EP tests was ascertained. After the baseline assessments, animals received a spinal cord contusion. Injury-related conduction changes will be discussed in another report. Preliminary data related to intracortical and direct wave stimulation are provided to address issues related to the corticospinal tract.
Procedures with animals
The experimental procedures were approved by the Institutional Animal Care and Use Committee of the University of Miami (Miami, FL). Twenty-six female Micro-Yucatan miniature Swine (Sinclair BioResources, Windham, ME), ages 5–10 months, weighing between 15 and 25 kg, were housed, fed, and cared for in accord with United States Department of Agriculture and Association for Assessment and Accreditation of Laboratory Animal Care regulations. Female animals were selected because their urethra and bladders are much easier to manage than males post-SCI. Anesthesia was induced with ketamine/xylazine (30–45 mg/kg, 2–4 mg/kg). Pigs were intubated, ventilated, and maintained with low doses of isoflurane (1–2%) during placement of intra-arterial and venous lines. A 3-lead EKG was collected, intra-arterial blood pressure was monitored (using a sensor placed inside the superficial branch of the femoral artery), and a central line used to deliver fluids and drugs. Cefazolin 30 mg/kg intravenously was administered for antibiotic prophylaxis and post-operatively every 8 h for up to 24 h. Temperature was regulated using Bair Hugger blankets in response to rectal temperature measurements. For EP testing, gas anesthesia was switched to a total intravenous anesthesia (TIVA) protocol that included: propofol (25–150 mcg/kg/min); ketamine (10–180 mcg/kg/min); and fentanyl (25–100 mcg/kg/h). TIVA was continuously regulated to ensure adequate anesthetic depth and yet enable effective stimulation and recording.
Intraoperative electrophysiology
Cadaveric studies were performed to correlate key intra- and extracranial landmarks. Previous studies suggested that the motor cortex in the pig is in the cruciate gyrus between coronal and cruciate sulci, 12,18,19 and the limb somatosensory cortex extends onto the interhemispheric face of the cruciate sulcus (Fig. 1A). 20 Reference external skull marks were traced (e.g., nasion, inion, vertex, and midline) to establish where to place electrode screws over the desired cortex. We adapted the international 10–20 nomenclature; FC1 and FC2 were assigned to points 7.5 mm toward the nasion from vertex and 5 mm lateral to the midline for motor stimulation. For sensory recordings, CP1 and CP2 were assigned to points 7.5 mm toward the inion 5 mm lateral to the midline. Fz was assigned to a midline reference point 2 cm anterior to the vertex and used to improve the lateralization of SSEP detection.
To reduce impedance and improve both motor cortex stimulation and signal recordings from the somatosensory cortex, two small incisions of 1 cm were made in the skin over the described positions. Superficial pilot holes were drilled in the skull and sterilized stainless steel screws (15 mm length, 1.1 mm diameter) with a flattened tip were advanced to serve as electrodes. To avoid complications such as infection, the electrode screws were removed at the end of EP recording and the skin was approximated with surgical tape. Three animals at the beginning of the study were assessed using human intraoperative surface corkscrew needles in contact with the skull surface. Only small and inconsistent SSEPs were recorded with high voltages needed to obtain MEPs. These experiments are not included in this report because placing cranial screws through the bone led to much better recordings.
Somatosensory evoked potentials from peripheral nerve stimulation
Stimulation was applied to the tibial and median nerves of each side by placing subdermal needle electrodes (1.2 cm, 27 Gauge, Neuroline twisted pair; Ambu, Copenhagen, Denmark) near the usual location of the nerves. Stimulation sites were refined by trial-and-error testing, assessing twitch strength in the muscles of the hooves. Hindlimbs and forelimbs were stimulated separately in a left-to-right interleaved sequence and recorded in the contralateral cortex. Repetitive stimuli (1.1 Hz, 300 μs) were given at intensities twice the threshold required to visualize twitching in the muscles distal to the stimulation point. For somatosensory recordings, skull screws were connected to the recording channels in referential mode. The signal was filtered (10-Hz low frequency, 300-Hz high frequency, Protector IOM, Xltek; Natus Medical Inc., Pleasanton, CA) with an average of 1000 sweeps recorded. Recording arrays used were: CP2–CP1 and CP2–Fz for the left tibial nerve and CP1–CP2 and CP1–Fz for the right tibial nerve. Sciatic nerve potentials were acquired to verify adequate tibial nerve stimulation. Long needle electrodes with a 3-mm uninsulated tip (7.5 cm, 25 gauge, Neuroline monopolar; Ambu) were placed through the sciatic notch in each side. Median nerve stimulation was performed in a similar manner using the same cortical recording arrangements. The stimulation and recording parameters selected resemble those used in human neuromonitoring. 21
Transcranial motor evoked potentials
To depolarize the motor cortex, stimulation trains were delivered through a stainless steel alligator clip clamped to the electrode screws (Fig. 1C) with an impedance <2.5 kOhms. Stimuli intensities ranged from 200 to 400 V in trains of five pulses (pulse duration, 0.5 ms; interstimulation interval [ISI], 5.0 ms; Protector IOM, Xltek, internal stimulator; Natus Medical Inc.). For hindlimb muscle depolarization, stimulation parameters were assessed using the anode over the right cortex and the cathode over the left side (FC2–FC1). This stimulus arrangement elicited bilateral depolarization. Multi-pulse stimulation was necessary to overcome the effects of the anesthetics and increase motorneuron recruitment. 6,22 –24
Free running EMG was observed during MEP collection to ensure minimal background noise. The filters for EMG were the same as for MEPs, but set to epochs of 10 sec. For muscle evoked recordings and EMG, two types of needle electrodes were used: 1) small bipolar needles for superficial small muscles (1.2 cm, 27 gauge, Neuroline twisted pair; Ambu) and 2) a combination of two longer monopolar needles for larger deep muscles (5 cm, 25 gauge, Neuroline; Ambu). Needle electrodes were placed in the muscles of the left and right forelimbs (extensor carpi radialis; ECR) and hindlimbs (gastrocnemius [GAS], tibialis anterior [TA], biceps femoris [BF], vastus lateralis [VL], and rectus femoris [RF]; Fig. 1D,E). Additional hindlimb muscles were tested in some pigs during MEP recordings: lateral digital extensor (LDE; (n = 6); vastus medialis (n = 8); and abductor hallucis (AH) in 10 pigs. In 16 animals, the effect of positioning needle electrodes in the lateral belly versus the midline of the TA muscle was compared (Fig. 1D) to assess the importance of being in proximity to the exact motor point. Signal recorded from the muscles was amplified and then filtered using settings suggested in previous reports (1.5-Hz low frequency, 875-Hz high frequency, Protector IOM, Xltek; Natus Medical Inc.). 22,23
Spinal cord exposure and epidural lead placement
The skin was sterilely prepped with chlorhexidine and an incision created between T5 and T10. A consistent surface counting method was used to identify the laminectomy level, verified in some animals using fluoroscopy, and after perfusion, by counting nerve roots. Muscles were detached from spinous processes, retractors placed, and a complete T7/T8 laminectomy created to expose spinal cord segments T8/9. With the dura exposed, two double-contact strip electrodes (custom made, width 7.3 mm, length 4 cm with contact diameters 4.5 mm and rated impedance <150 ohms; Cortac Electrodes; PMT Corporation, Chanhassen, MN) were slipped into the dorsal epidural space 1 cm cranial and 1 cm caudal to the laminectomy boundaries. The remaining ligamentum flavum and epidural fat maintained the electrodes in contact with the dura mater. These levels were selected to span the planned spinal cord contusion injury. For this report, we consider these electrodes to stimulate over T6 and T9, but they could have partially reached into the rostral T5 and distal T10 segments.
Motor and sensory epidural EPs were triggered and recorded. Next, the contusive injury was created. Before closing, the electrodes were removed and the incision closed in layers. In 1 control animal, a sequential transection was performed while collecting EPs to assess for possible false-positive conduction after complete transection. In this pig, we acutely determined the minimum substrate of residual spinal cord that could convey signals. For transection, the dura was incised and tacked laterally to allow cord visualization. Sequential precision incisions were made into the cord, first in the left half and then in the remaining right half. Under the high magnification provided by a surgical microscope, it was possible to distinguish the midline and gray and white matter. After transection and EP recording, the dura was repaired and the incision closed.
Somatosensory evoked potentials from epidural stimulation
SSEPs were triggered from the spinal cord electrodes using stimuli of 5–10 mA, 1.3 Hz, and 200-μs intervals. Recordings averaged 1000 sweeps, using the same cortical recording sites as described for peripheral nerve stimulation. ES of the dorsal spinal cord stimulates both sides; thus, bilateral CP2–CP1 and unilateral CP2–Fz, CP1–Fz were used to compare activity within the left and right sensory cortices (being CP1–CP2 redundant and therefore not recorded). Several groups have reported stimulation over the dorsal columns to elicit SSEPs 25 –29 ; nonetheless, because the parameters varied between reports, stimulation/recording parameters presented here were adapted from peripheral nerve SSEP techniques.
Epidural motor evoked potentials
Epidural motor stimulation (ES) was performed independently at T6 and T9 using reported parameters, 30 trains of three or five pulses (0.05 ms, ISI 0.5 ms) were delivered at intensity ranges of 30–50 V (MultiPulse Stimulator D-185; Digitimer Ltd., Hertfordshire, UK). Signals were recorded from the same muscles used for transcranial MEP (TcMEP) testing to obtain comparable MEPs.
Preliminary assessments
Later in the study we conducted three preliminary assessments: 1) Attempts to record D waves from the thoracic dural surface. Detecting D waves indicates a corticospinal tract at the recorded level in the spinal cord. 2) Direct intracortical stimulation to assess the forelimb and hindlimb locations for the injection of anterograde tracers to define the corticospinal tract extent. 3) Attempts to measure conduction between the two epidural electrodes by stimulating one and recording from the other. This might be a useful post-injury technique to test for retained conduction through the injury epicenter.
Statistical analysis
Somatosensory evoked potentials
Typical values were established from cortical recordings obtained in 18 animals in which tibial, median, and epidural stimuli were applied. The recording arrays CP1–CP2 and CP2–CP1 and CP1–Fz and CP2–Fz were compared for signal resolution quality. Positive and negative peaks of SSEPs were marked and their latency value in milliseconds was determined. Averages and standard deviations were calculated for the consistent peaks, P18 and N24 for median nerve and epidural stimulation, and P29 and N35 for tibial nerve stimulation. Amplitudes were measured in segments P14–N24 and P29–N35. P14 values out of the 10- to 30-ms range and peak-to-peak amplitude values <0.2 uV were excluded.
Motor evoked potentials
Amplitudes were measured using peak-to-peak values and latencies marked at the beginning of the first deflection. The presence, latency, and amplitude of the most similar four of six collected waveforms from each monitored muscle were calculated and compared among different animals to establish the typical range for each muscle. Samples with amplitudes <40 μV and latencies were <6 ms were excluded from analysis. To determine which muscles were more responsive to cortical stimulation under the experimental conditions, the percentage of detection from each side was determined.
Epidural MEPs (EpiMEPs) obtained while stimulating the cord above and below the laminectomy were measured in 18 animals. The detection rate of TcMEPs and EpiMEPs and their amplitudes and latencies were compared to ascertain which form of motor stimulation most reliably triggered hindlimb muscles. The mean difference between the latencies of MEP onset for each muscle from T6 and T9 was calculated. These values will allow subsequent comparison of MEPs post-SCI.
To determine whether the differences between recorded values were sufficiently consistent to be considered independent, we applied statistical tests. The t-test and one-way analysis of variance (ANOVA) were used to compare two or more groups respectively, with p values ≤0.05 considered significant. Excel (2010; Microsoft, Inc., Redmond, WA) and GraphPad software (version 4.1; GraphPad Software Inc., La Jolla, CA) were used for analysis and graphical representation of the data.
Results
In this study, no animals experienced obvious seizures. In a previous animal, not part of this study, 1 animal had a surgical complication related to neuromonitoring and cortical stimulation. In this animal, a probable brain abscess was detected on post-mortem exam. This problem had been clinically silent, but appeared to be linked to the placement of a skull screw. In this animal, the screws were attached permanently. After detecting this complication, we removed the screws at the close of each procedure. The surgical exposure of the spinal cord did not abolish ascending or descending evoked potentials in any animal, verifying the safety of the laminectomy procedure. This is important so that subsequently observed changes can be interpreted to be caused by the contusion event. We emphasize the average findings across the 26-animal sample because the utility of the testing depends on its reproducibility in the population, not just in individual animals. Latencies showed greater similarity between animals than amplitudes.
Somatosensory evoked potential findings
SSEP assessments were reliable (summarized in Table 1). In Figure 2A–C, the characteristic features of SSEPs obtained using midline spanning and midline referenced (Fz) cortical arrays in response to peripheral nerve and epidural stimulation is shown. Control values recorded from the sciatic (or popliteal) nerve verified effective tibial nerve stimulation. Detection percentages were calculated as the incidence of clearly definable peaks detected over the total number of animals tested (18). The latency value is shown for each peak and the segment P1–N1. Tibial and sciatic nerve conduction latencies to the cortex were used to estimate the central sensory conduction velocity (CSCV). An average value of 46.4 m/s was estimated by applying the formula CSCV = total distance (tibial nerve to cortex / tibial nerve-evoked SSEP latency – sciatic nerve latency).

Characteristics of porcine evoked potentials. (
SSEP, somatosensory evoked potential; Lat, latency; Amp, amplitude; SD, standard deviation; SEM, standard error of the mean.
Comparing the latencies of positive and negative somatosensory evoked potential peaks
In all stimulation/recording modalities, a positive peak designated as P1 had the shortest latency, followed by N1 and P2. The average latencies from median and tibial nerves were P1 (19 and 27 ms), N1 (24 and 34 m), and P2 (34 and 43 ms). P1, N1, and P2 latencies differed statistically (one-way ANOVA; p < 0.0001), substantiating their independence. Latency values of SSEP peaks (P1, N1, and P2) were consistent between animals in response to epidural, tibial, and median nerve stimulation. Thoracic ES generated responses with latencies similar to the median nerve. There was no difference in latency consistency between cross-midline or unilaterally referenced skull electrode arrays. The low relative standard error of the mean (SEM) percent (SEM/latency) for the SSEPs of 1–3% indicates that the mean values are useful references for the population.
Amplitudes recorded from Fz referenced versus contraipsilateral arrays
SSEP segment amplitudes P1–N1 and N1–P2 were larger in midline Fz versus cross-midline arrays for both T6 and T9 ES (t-test; p < 0.001). However, for the tibial and median nerves, there was no significant difference in either amplitude or latency values between these arrays. Amplitudes from tibial nerve stimulation were 8 × smaller (
Percentage detection of somatosensory evoked potentials
ES was very effective to generate high-amplitude SSEPs from both T6 and T9 with consistent and definable peaks in all recording arrays and animals. Regarding waveform, the second peak N was more definite than the first peak P. In 6% of animals, the first peak was not detected from median nerve stimulation when recording with the CP1–Fz array. All other arrays were positive for both P and N in 100% of the animals.
Motor evoked potential findings
MEPs require combinations of events, neuronal-axonal excitation, and motor neuron firing and are more sensitive to inhalational anesthesia than SSEPs. 31 We determined the most consistently detected of nine muscles in response to either cranial or epidural stimulation. In Table 2, muscles are ranked based on MEP detection frequency. Means, SD, and SEM are shown. The percentage detection of both muscles (e.g., 18 animals, 36 muscles) is indicated by M, whereas the percent detection of at least one of the two muscles is indicated by S. In Figure 2, panels D and E show the usual shape and consistency of MEPs recorded from TA in response to transcranial stimulation and ES at T6 and T9.
MEP measurement reliability per muscle in the Micro-Yucatan miniature Swine using transcranial and neurogenic stimulation. N = total number of animals in which a muscle was tested; M = positive signal per muscle (left or right); S = positive signal per subject (bilateral).
Only early response values were calculated.
MEP, motor evoked potential; Amp, amplitude; Lat, latency; TcMEP, transcranial motor evoked potential; SD, standard deviation; SEM, standard error of the mean.
Differences in symmetry of detection of muscles, transcranial motor evoked potential versus epidural motor stimulation
The bilateral stimulation of muscles is necessary for a neuromonitoring protocol. For TcMEP, the only completely reliable muscles for bilateral detection were the TA and ECR. For other muscles, the detection frequency varied from high to low, as indicated in Table 2 and Figure 3. ES increased the frequency of detection in several muscles, but was associated with more failures to record bilaterally than TcES. We calculated an index of asymmetric detection as the percent difference unilateral- bilateral detection × animal number per muscle. When summed across the tested muscles, the values are TcES = 846, T6 ES = 921.8, and T9 ES = 1028.4. Complete symmetry would be zero. Normalized to TcES, ES at T6 and T9, respectively, are associated with 1.1 and 1.2 greater asymmetry. This may reflect asymmetrical ES current flows attributed to slight deviations from midline, or perhaps more likely, induced inequality of the cerebrospinal fluid (CSF) space attributed to a greater pressure on one side of the dura than the other, with the effect to narrow the CSF space on one side and expand it on the opposite side. 32
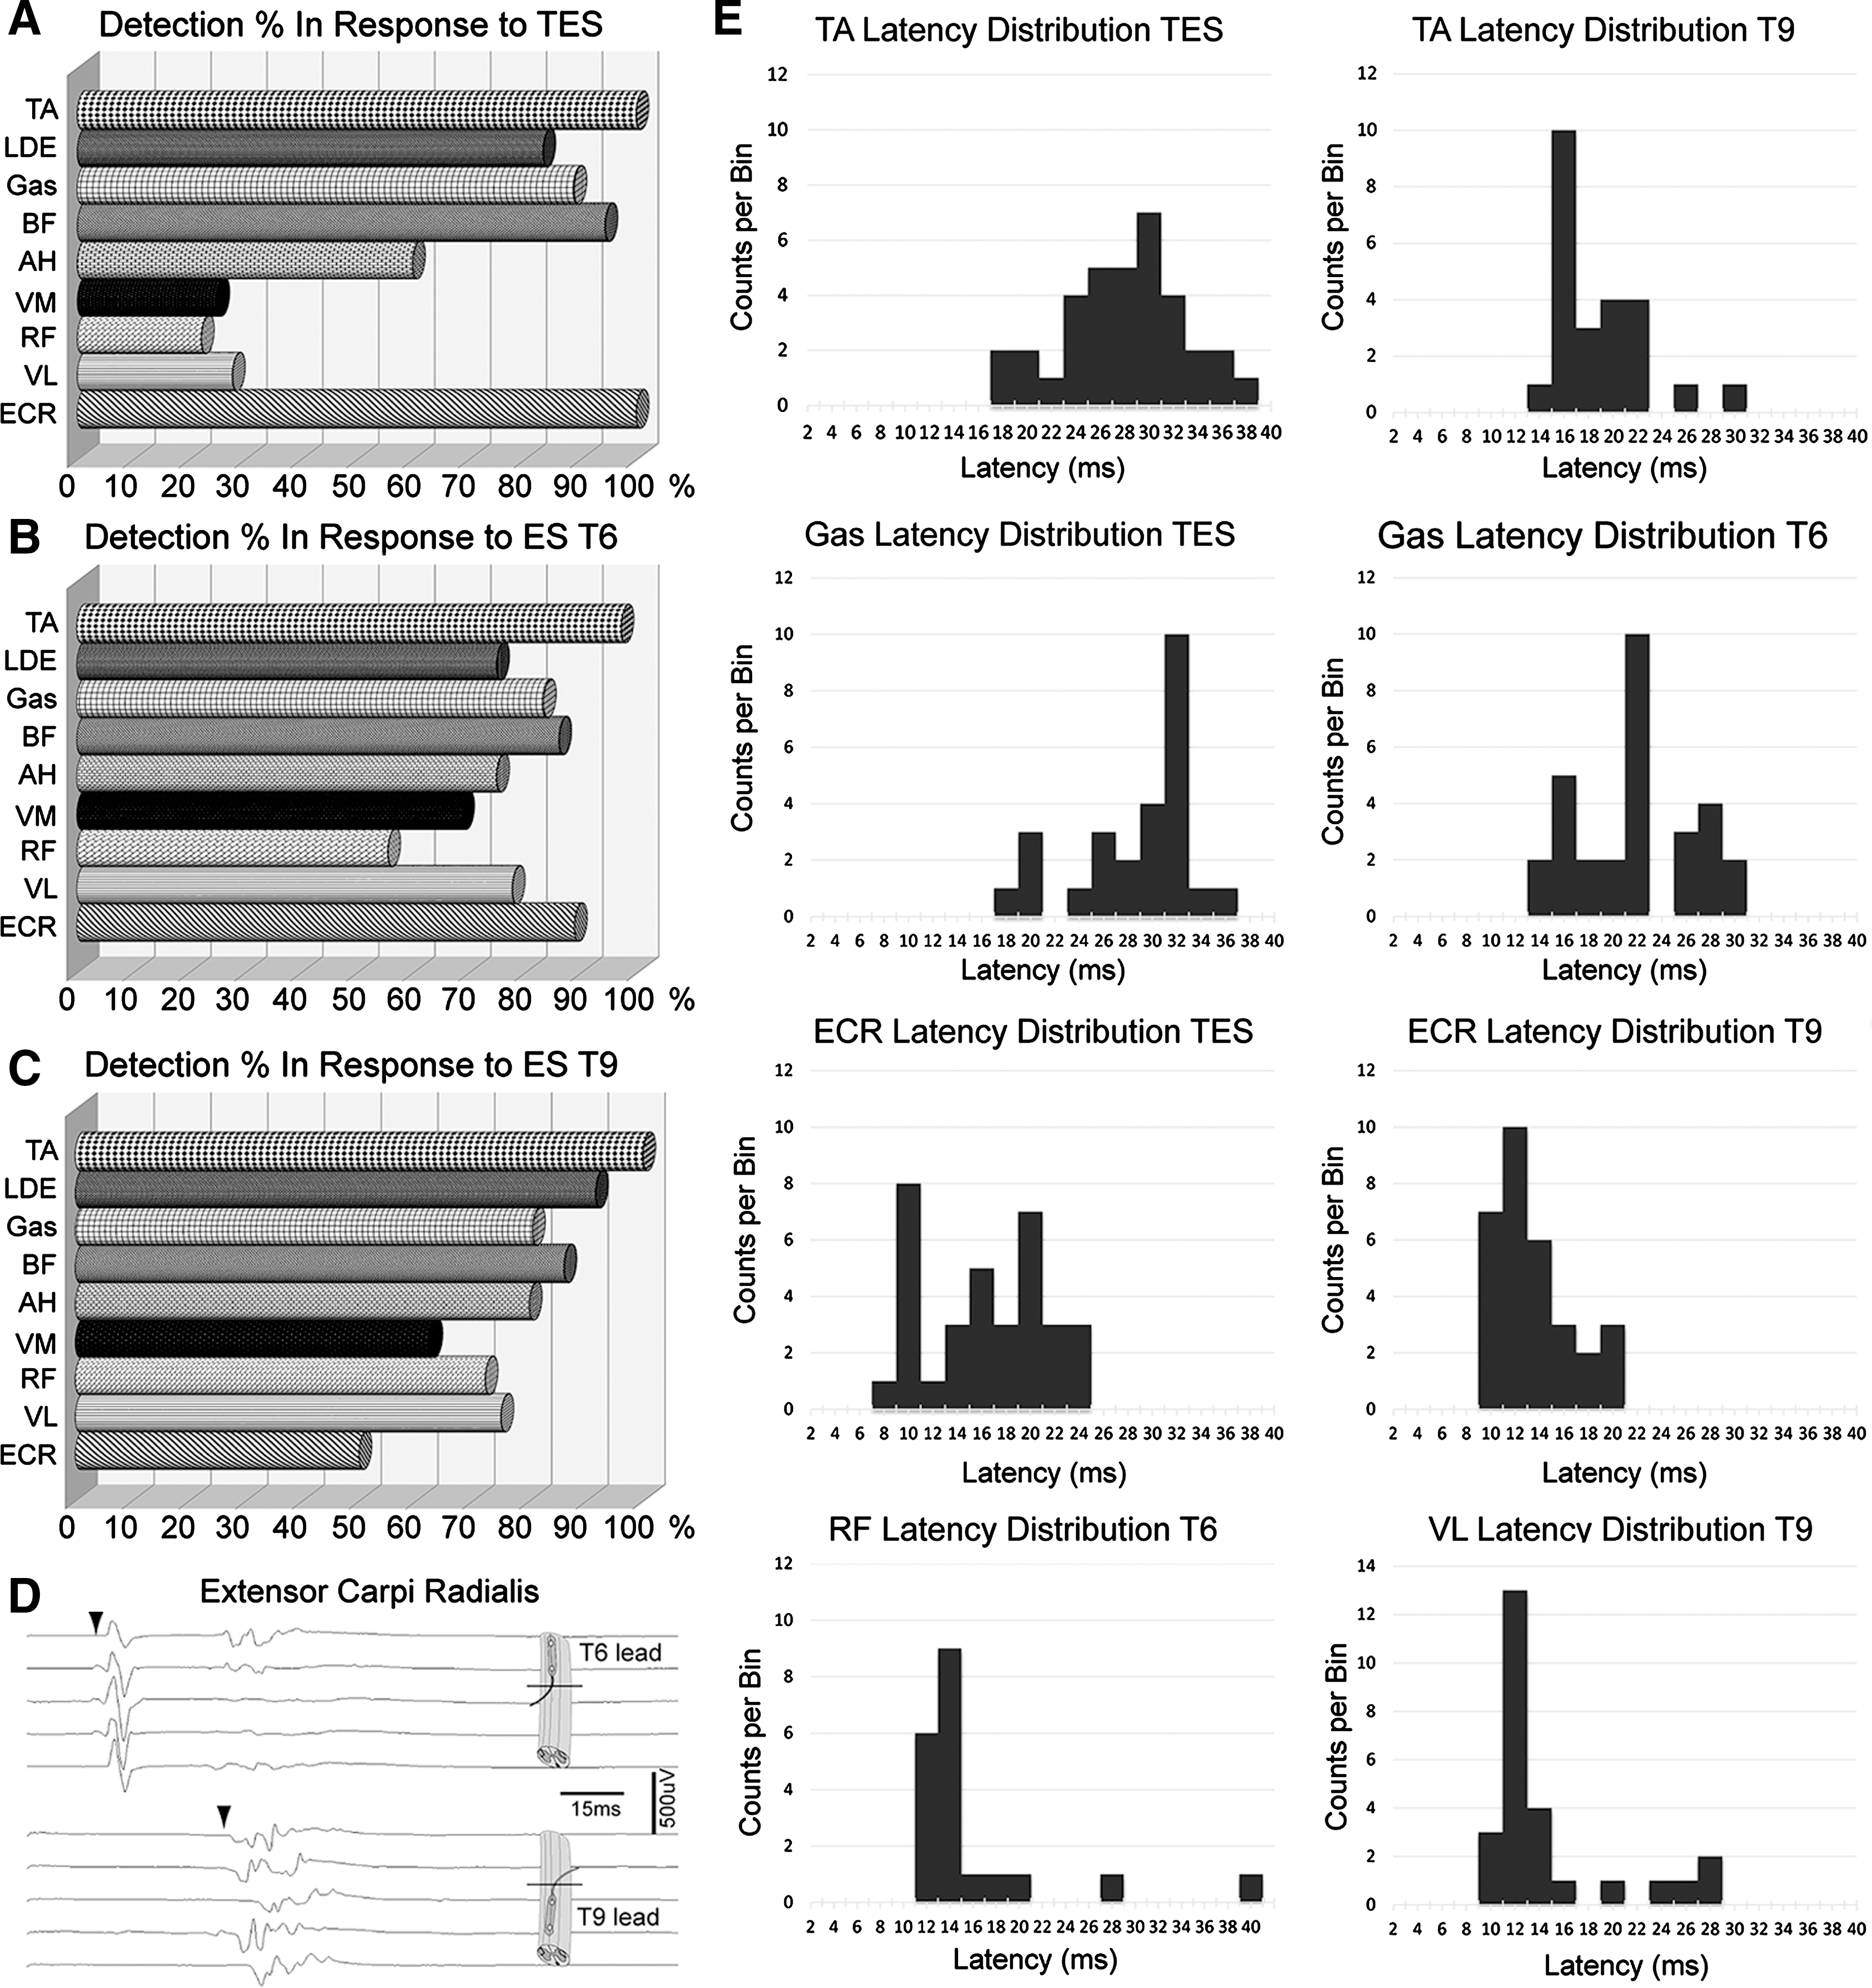
Detection percentages of each muscle in 18 animals, considering at least one muscle present from left or right side. (
Motor evoked potential latency and amplitude differences
MEP latencies were more consistent than amplitudes (Supplementary Fig. 3) (see online supplementary material at
The mean latency difference between T6 and T9 ES stimulation for all muscles was 2.5 ± 0.5 ms SD, indicating the absence of iatrogenic cord injury attributed to the laminectomy. This short latency made it difficult to record signals in between the electrodes because of obscuration by the stimulation artifact. Possibly, the ES electrodes could be positioned further rostral and caudal to increase latency and facilitate cross-lesion conduction testing, but there is some risk of injury related to blindly advancing the paddle electrodes.
The latency values obtained in response to the three stimulation sites (T6, T9, and TcES) differed significantly (ANOVA; p < 0.001) for muscles with small SDs (AH, BF, Gas, and TA), but not for the large vastus medialis and lateralis muscles. Representative latencies between TcES and ES are shown in Figure 2D. TcES and ES latencies were fairly consistent among subjects with SDs generally less than 6 ms. The smallest latency SDs were in response to T9 ES.
MEP amplitude variability between animals was substantial with either TcMEPs or ES. ES at T6 and T9 generated less mean amplitude variability in TA and AH when compared to transcranial stimulation. The amplitude of TcES MEPs was greatest in the forelimbs extensors, ECR (
Needle position had little effect on tibialis anterior motor evoked potentials
In 9 animals, we sought to determine whether MEPs are sensitive to the relative position of the electrodes within the most reproducible muscle (TA). We placed an extra pair of recording needle electrodes in a position lateral to the midline of the belly of the muscle (Fig. 1D). Signal was detected in all animals. Although the shape of the MEP was slightly different (Fig. 2E), there was no significant difference in latencies or amplitudes in between the two recording locations for TcES (t test; p > 0.05; Table 3). There was a small increment in amplitudes in response to ES for electrodes in the middle of the TA belly. In larger muscles, it may be necessary to seek the motor point and maintain the joint angles in a uniform position to reduce EMG detection and amplitude variability.
Two different recording electrode positions tested in the same tibialis anterior muscle.
TcES, transcranial electrical stimulation; ES, electrical stimulation; SD, standard deviation.
Forelimb extensor carpi radialis motor evoked potential in response thoracic epidural stimulation
ES at T6 and T9 elicited unexpected bilateral responses in forelimb ECR with two distinct latencies. ECR MEPs were detected for 89% of T6 ES stimuli and 56% from T9 (Table 2). The first MEP response had a mean latency from T6 of
Impact of progressive transection on somatosensory evoked potentials and motor evoked potentials
In the progressive T9 transection experiment, the first increment of dorsal incision slightly increased the latency, consistent with the intraoperative monitoring literature. When the full left dorsal hemisection was completed, the right cranial SSEP was lost (Fig. 5). The effect of this extent of lesion on the left TA MEP was an increase in latency and a 15 × reduction in amplitude. Thus, there must be some functioning motor pathways in the spared left spinal tissue after dorsal hemisection. Next, the right spinal cord was progressively incised until only a ventral bridge remained in continuity. This was associated with the persistence of small amplitude MEPs. This indicates that motor fibers in the ventral spinal cord convey MEPs. The absence of detected potentials after complete transection confirms that observed potentials are not artefactual.
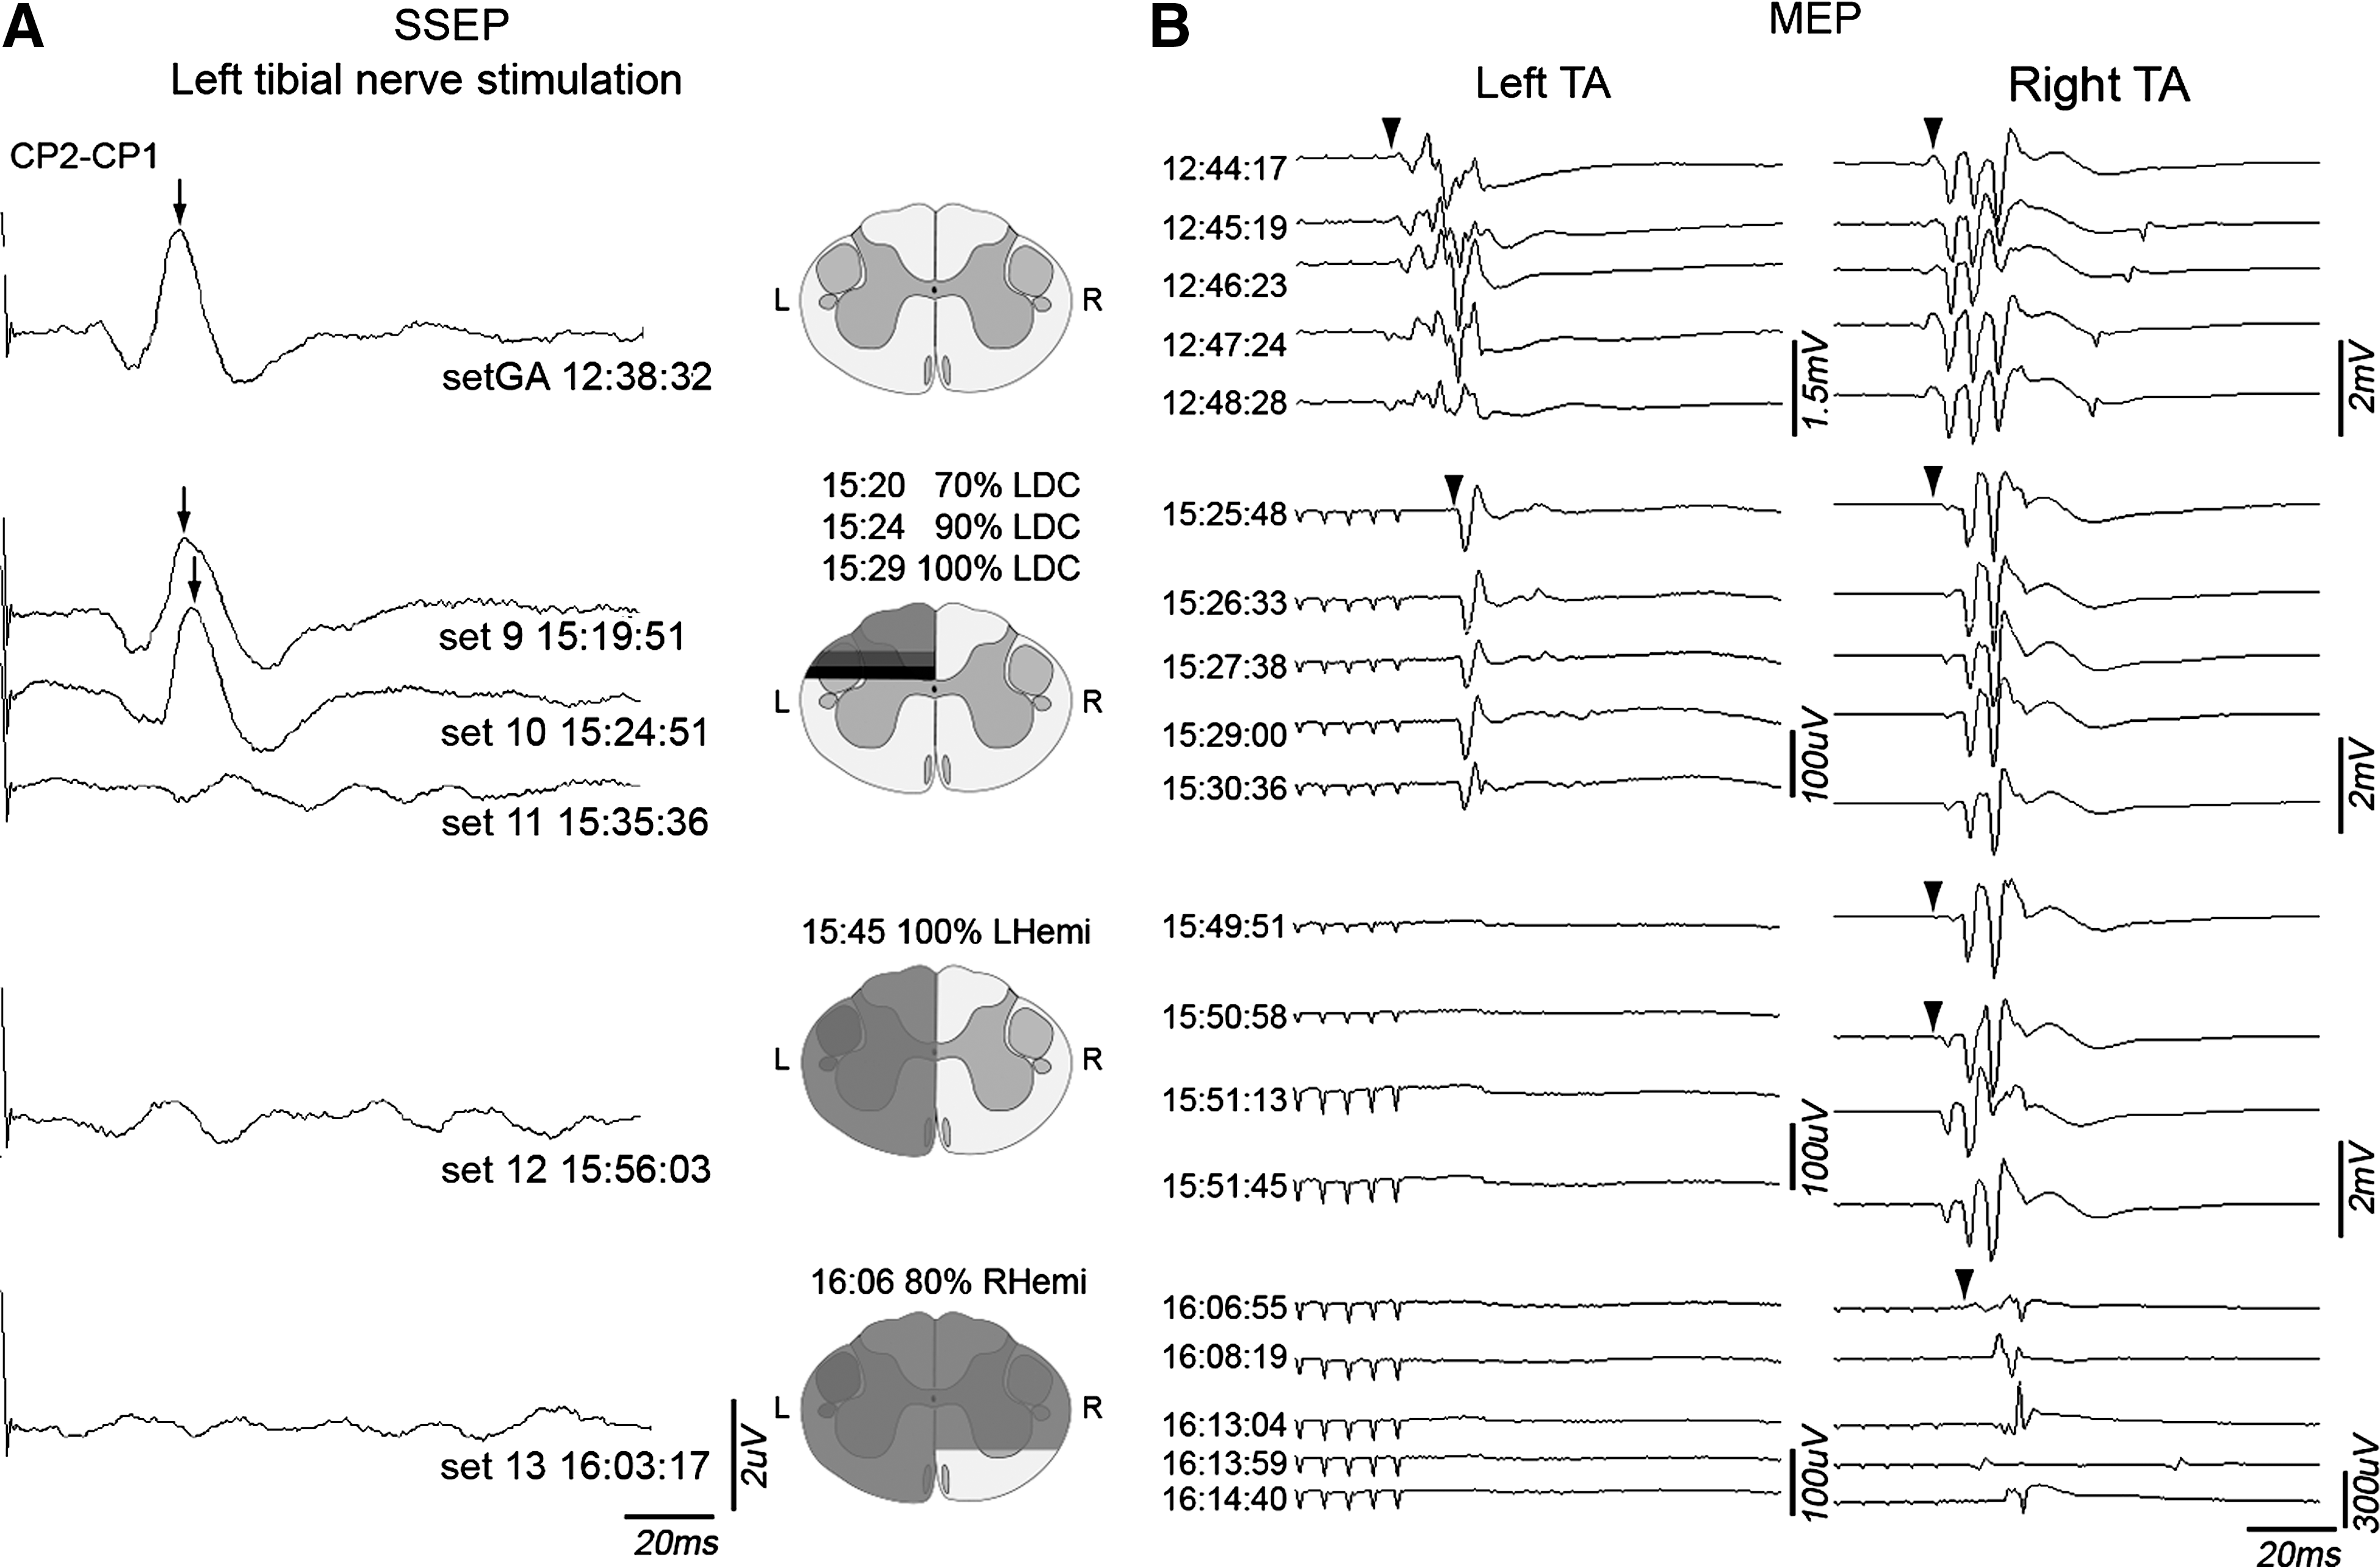
Sequential spinal cord transection in a single animal; EPs were recorded before and after several transection steps. (
Evoked potential procedure duration
After the electrophysiology assessments, each study animal underwent a thoracic contusion injury and was subsequently randomized to receive a cell transplant or control injection. Thus, the time required to perform the measures was important. Unlike established human neuromonitoring, these studies required troubleshooting and determination of the best stimulation and recording parameters. Insertion of the cranial screws for stimulation and recording and localization of the sciatic nerve was time-demanding as was recording from multiple muscles. If a laminectomy is performed, the insertion of epidural stimulating electrodes is very time efficient.
CST, corticospinal tract; MEPS, motor evoked potentials; CaM, calcium and calmodulin; TA, tibialis anterior.
Discussion
We set out to develop intraoperative neuromonitoring techniques to aid our studies of SCI and transplantation in the Yucatan porcine model. Our findings refined our understanding of neurophysiological similarities and differences between humans and Yucatan minipigs. Further study is needed to clarify the cortical motor system and its projections. A general theme was that recordings to and from the upper extremity were more robust. Whether the generally smaller amplitudes for lower extremity recordings reflect differences in cortical representation, technical factors, or spinal tract anatomy requires further study.
Somatosensory evoked potential recordings
SSEPs were reliable measures. Median nerve and epidural stimulation evoked large amplitudes in all cortical arrays, allowing identification of peaks at P18 and N24. Tibial nerve stimulation produced smaller amplitude recordings with P29 and N35 peaks that were more susceptible to electrical noise. To determine whether sensory conduction is retained through an SCI, it may be better to stimulate from the sciatic nerve or the epidural space caudal to the injury site to improve the signal-to-noise ratio. Neutral (midline) referenced arrays had larger amplitudes than contralateral cortex referenced arrays, independent of the stimulation site. This was most evident for stimulation from the epidural thoracic segments. One explanation is a desynchronization effect because ES excites both sides of the spinal cord, and thus both cortexes are active at the same time during a CP1–CP2 recording.
The robust sensory stimulation observed with ES is attributed to the stimulation of more sensory fibers than can be excited from the tibial nerve. Ascending sensory fibers from the proximal leg and trunk below the stimulation level, as well as segmental nerve roots, may contribute to the SSEP. ES is thus more potent to generate cortical sensory signals, but has less specificity. In the sequential transection experiment, the detection of right cranial SSEPs was lost after left dorsal column transection. This indicates that the SSEP signal is carried in a dorsally located pathway.
The latency values found in the Yucatan micropig in response to peripheral nerve stimulation are similar to values reported in other large animal models. 12,33 Owen and colleagues reported a 35-ms tibial-evoked cortical SSEP in the hog. Although those are larger pigs, this value is within the range of our measurements.
Motor neuromonitoring
The most reliable muscles for TcES monitoring were unknown to us, so we tested the responsiveness of nine pairs of limb muscles. TA was the most consistently detected muscle in response to either transcranial or epidural stimulation. Recording from a “reliable” muscle is useful to address technical factors to optimize the recordings. Tibialis anterior and abductor hallucis MEPs are used in human clinical intraoperative monitoring protocols because of their reliability. 34 AH was not as consistently detected in this study. In response to TcES, amplitudes recorded in the forelimb (ECR) MEPs were larger as compared to hindlimb muscles, providing a reliable control measure.
In awake humans, the latency of TA recordings in response to transcranial magnetic stimulation (TMS) is approximately 30 ms in anesthetized patients. 35,36 TA latency values in anesthetized humans using TcES delivered through screw electrodes are slightly longer (mean, 35 ms; SD, 3.8 ms). 37 In the pigs, mean TA latency after TcES was 27 ms, compatible with the shorter overall length of the pigs (approximately 105 cm).
Given the lack of knowledge regarding motor and sensory pathways in the pig, we considered the possibility that ES current spread to a thoracic corticospinal tract (CST) could produce an antidromic signal going directly to the motor cortex without intervening synapses, 38 confounding the interpretation of epidural SSEPs (arising in the dorsal columns). Antidromic stimulation of motor fibers is used to measure motor axon conduction velocity. 39 We regard this possibility as an unlikely source of SSEP contamination because the latency of the cortical sensory response from T6 ES was 16–17 ms. SSEPs have at least two intervening synapses: in the gracilis nucleus and the thalamus. TA MEP latencies were used to estimate the time required for antidromic motor tract transmission. We subtracted the latency of T6 ES stimulation (20.5 ms) from the latency of TcES (27.1 ms) stimulation. This 6.6-ms difference does not match the SSEP latency.
Epidural versus cranial motor stimulation
ES elicited MEPs in more hindlimb muscles than cortical stimulation, and with larger amplitudes. MEPs from RF, LDE, and VL, infrequently detected from TcES (<20% per muscle), were readily detected using thoracic ES (80% at T6 and 90% at T9). ES appears to recruit more motor axons and tracts than cranial stimulation. The observation may also reflect that large muscles close to the body axis are mainly innervated by brainstem reticulo- or rubrospinal tracts in quadrupeds. 40 –43
Epidural stimulation leads to motor evoked potentials in forelimb muscles
ES at T6 and T9 elicited an MEP in ECR, the only monitored forelimb muscle indicating the presence of axons that project from or through these thoracic levels to cervical motoneurons. These axons may be long ascending propriospinal axons extending from the lumbosacral enlargement involved in the forelimb-hindlimb coordination of quadrupedal locomotion, and are of interest in recovery from SCI. 44,45 The ECR MEPs evoked by T6 and T9 ES had distinct short and long latency waveforms (Table 1). The shorter latency may be attributed to more direct activation of axons terminating on ECR motoneurons. The longer latency potentials had a multi-spike appearance, in keeping with a multi-synaptic origin. Also notable is that T6 and T9 ES evoked MEPs simultaneously from both upper and lower extremity muscles, as shown in Figure 4 (bilateral ECR and TA). This multi-segmental motor stimulation 30 may allow ES to be valuable to study propriospinal plasticity and repair post-injury. It would be of interest in subsequent studies to determine whether lower extremity peripheral nerve stimulation could trigger ECR MEPs, as reported by Calancie, in persons with chronic complete SCI. 46
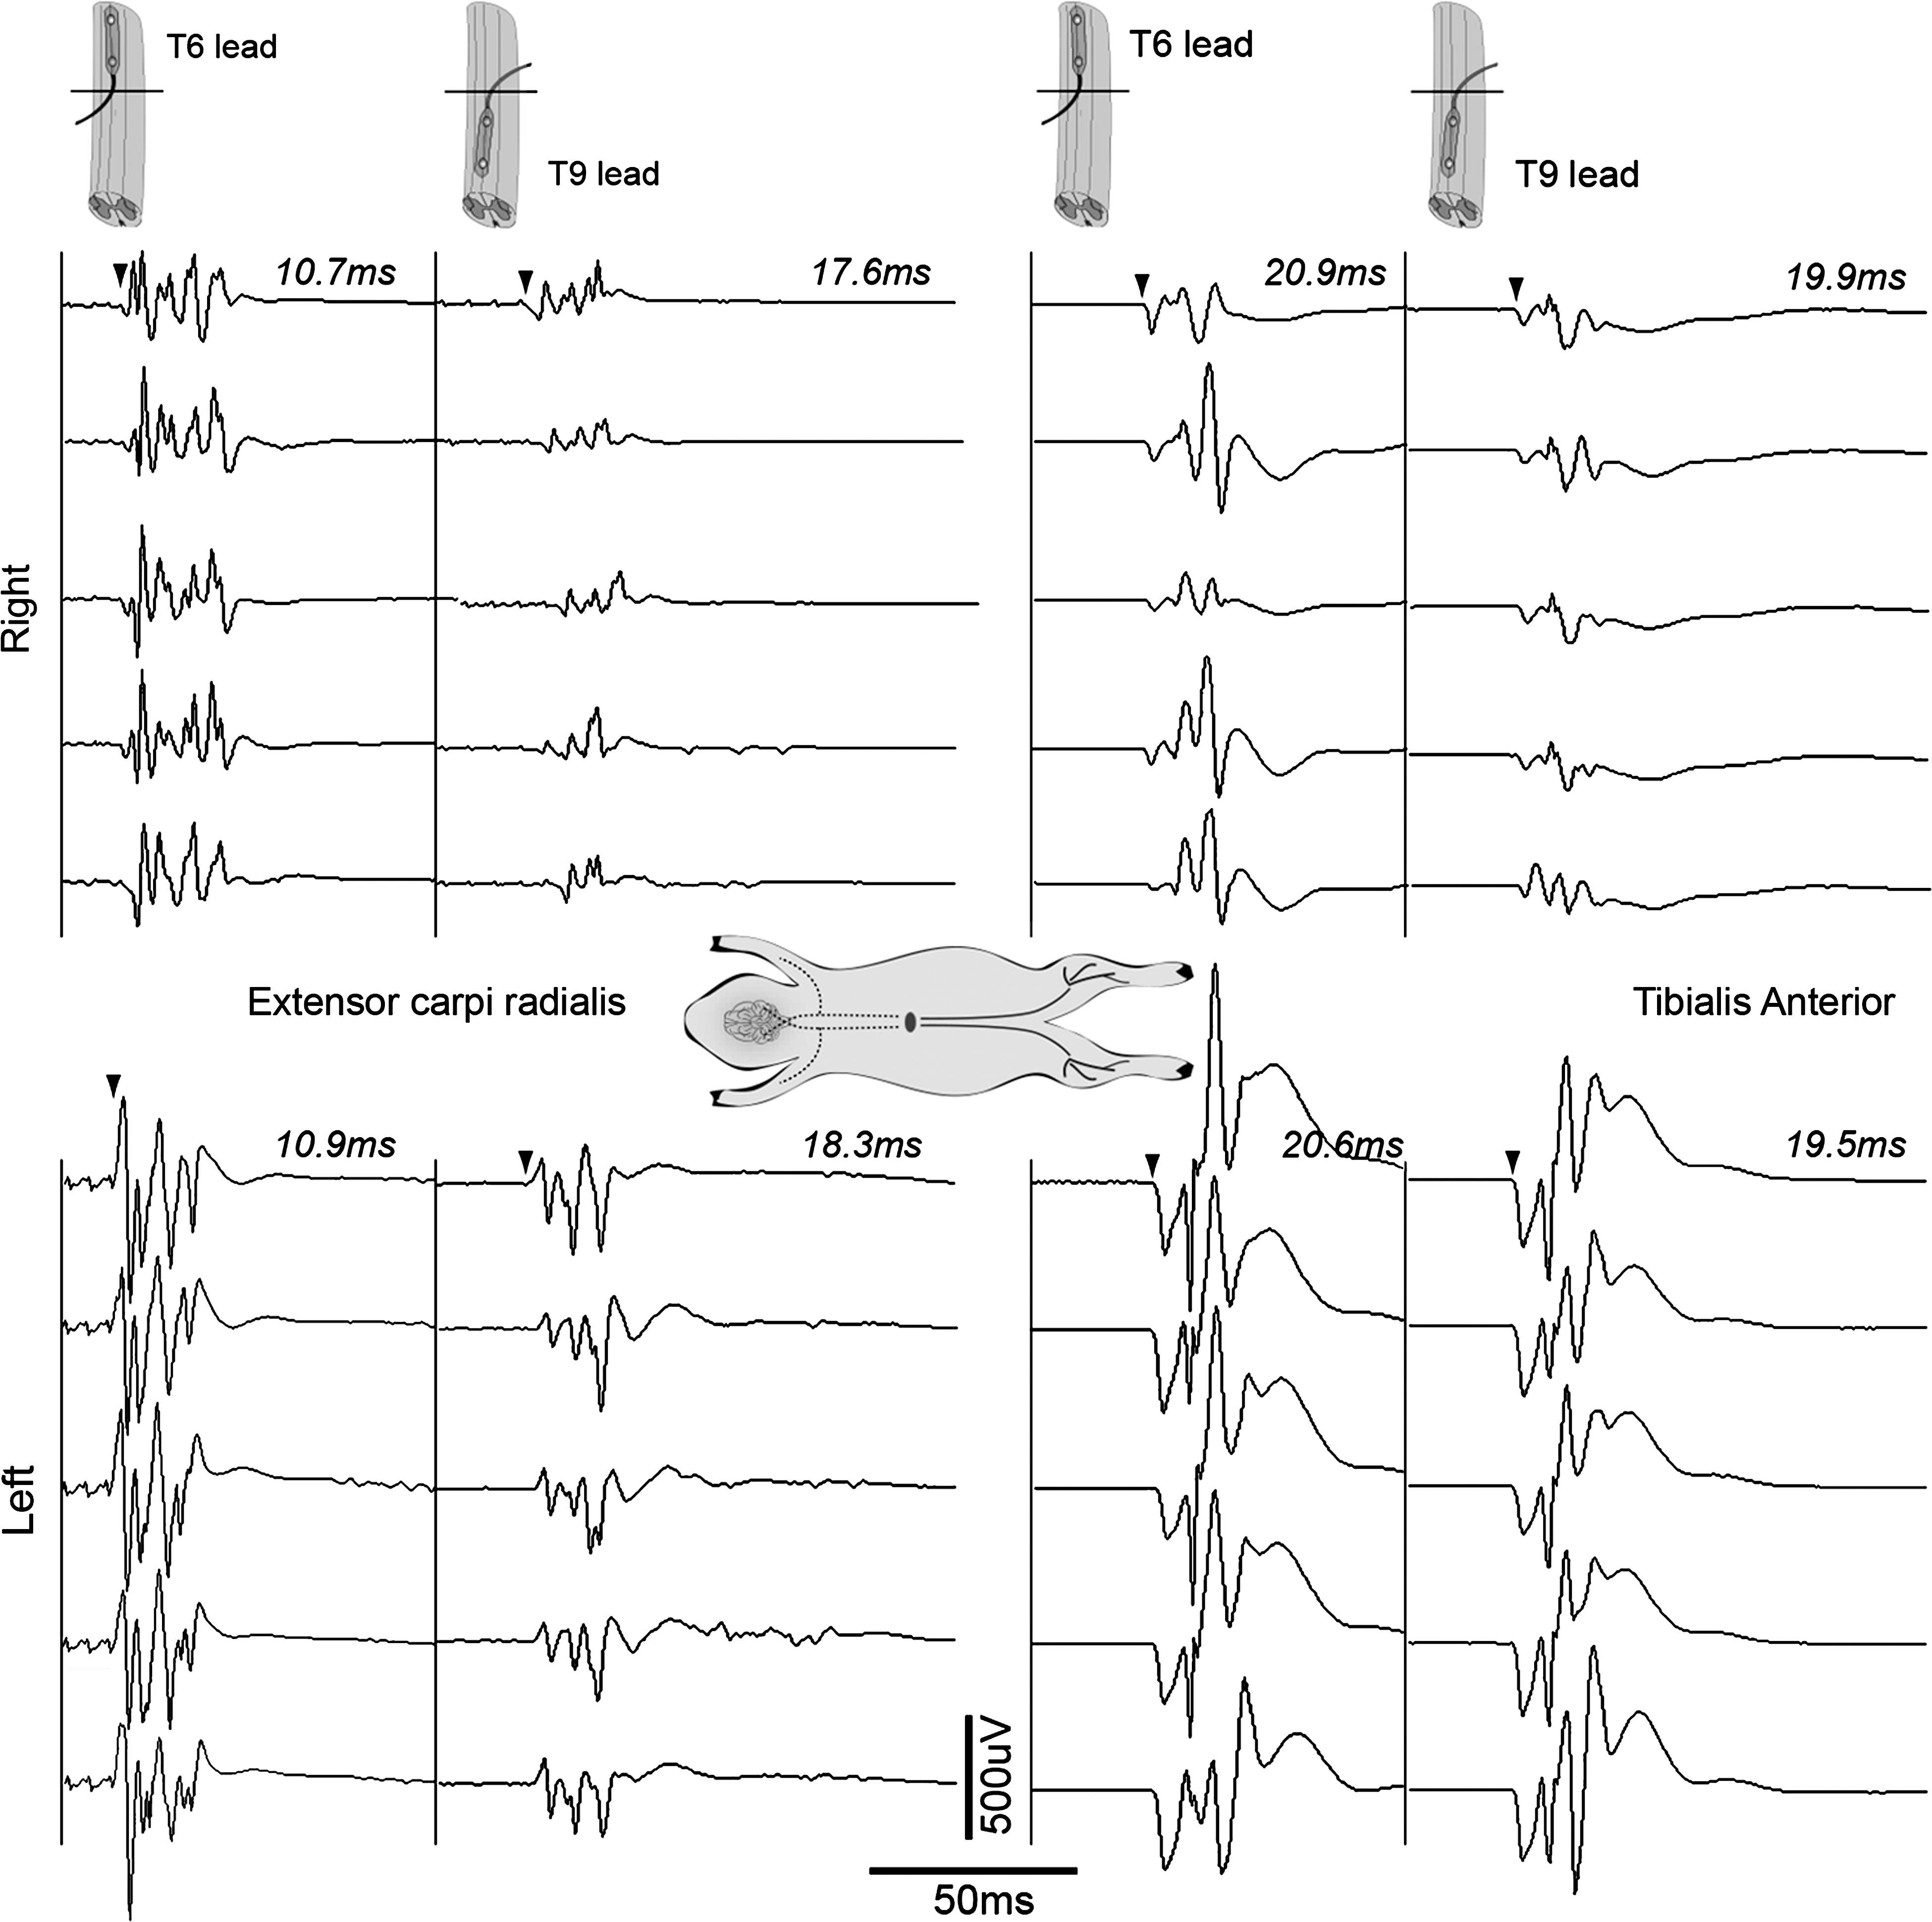
Forelimb and hindlimb MEPs after thoracic epidural stimulation. Five MEP samples collected simultaneously from left and right ECR and TA in response to ES, first, at T6 and then at the T9/10 segment. As expected, the caudal lead evokes shorter latencies in the leg muscles compared to the T6 segment. However, in the forelimb muscle there is a 7-ms difference in latencies evoked from the epidural T9 position when compared to T6 suggesting differing pathway activation (see Discussion). The difference in amplitudes between sides suggests a deviation of the epidural lead contacts towards the left. ECR, extensor carpi radialis; ES, electrical stimulation; MEPs, motor evoked potentials; TA, tibialis anterior.
Is there a corticospinal tract in Yucatan minipigs?
Evidence for a spinal CST in the pig is lacking. Older studies suggested that the CST did not descend below the upper cervical level, 19 having mainly corticobulbar terminations. In the cat, cortical input to the reticulospinal system has been shown to mediate transmission to motor neurons of the spinal cord. 47 To determine whether a spinal CST is present, modern neuroanatomic tracing, neurophysiology, and imaging techniques, such as diffusion tensor imaging, will be useful. 48 Given the association between a large pyramidal tract and the evolution of hand function in primate species, a spinal CST may not be an important source of motor control in hooved quadruped animals.
Whether or not there is a spinal CST, we obtained motor transmission from electrical excitation near the cortical surface; thus, motor neuromonitoring can be used in these animals.
The location and topography of the motor cortex also requires further study. The great majority of cortex is devoted to the snout.
20
Apparently, there is no separate motor cortical gyrus; the cruciate gyrus includes both motor and somatosensory cortex without sulcal delineation. The hindlimb representation is described to reside within the interhemispheric wall of the cruciate gyrus deep to overlying cortex (see diagram, Supplementary Figs. 1 and 2) (see online supplementary material at
A small and deeply located limb representation may also account for the high stimulation intensities required. We conducted a localization pilot study in 3 animals using direct cortical stimulation while recording EMG. The purpose was to localize the forelimb and hindlimb regions for injection of anterograde tracers (see Supplementary Fig. 1) (see online supplementary material at
Another technique to identify CST conduction is to record D waves from dorsally placed epidural electrodes within the spinal canal in response to single-pulse cortical stimulation. D waves are “direct” axonal potentials without intervening synapses. Typically, this conduction occurs in the CST, but, theoretically, D waves might arise from other directly stimulated tracts. I waves are generated attributed to inhibitory signaling within the motor cortex and confirm that the observed excitation is cortical. We attempted to record D waves in 3 animals using an epidural electrode placed at T6. In Supplementary Figure 4 (see online supplementary material at
High-voltage TcES generated a bimodal distribution of ECR latencies at 10 and 20 ms in some animals. High-voltage stimulation may have reached subcortical levels, and the different MEP latencies may reflect transmission in different pathways. The contribution of multiple tracts to MEPs in response to TMS has been characterized in the rat, where the responses had a similar latency dispersion to the bimodal distribution we found. 34
The progressive transection experiment was suggestive that both dorsolateral and ventral motor pathways could be stimulated with TcES. Dorsolateral pathways may include the CST and rubrospinal, and ventral pathways the reticulospinal and CST.
Sources of variability in the study
MEP variability is widely reported in the literature, including similar porcine models. 53 –55 Some inconsistency is attributed to technical factors, but the age, size, anatomy, and neurophysiology of the animals may also contribute. 53 Intraoperative EPs are markedly influenced by level of anesthesia, rate of drug metabolism, electrode impedance, monitoring noise, body temperature, blood pressure, spinal cord blood flow, and motor neuron excitability. 51,52 Maintenance of core temperatures is challenging under general anesthesia; we often had to supplement our heating methods to correct low temperature levels.
Anesthetics may contribute to intersubject variability; ketamine increases MEP amplitude values and intersubject variability in humans. 56 Another possible source of variation may be incomplete development and myelination of central nervous system pathways. 30 The age of the pigs used in the studies is largely based on cost and husbandry issues that favor younger smaller animals. We are conducting histological studies to assess whether tracts show mature myelination in these juvenile animals.
Despite reducing impedance with skull seated screw electrodes, it was still necessary to apply high voltages and multiple pulses to generate TcES-MEPs. As shown in Supplementary Figure 2 (see online supplementary material at
Regarding ES, we could not visualize the epidural electrode contacts after they were placed under the lamina, and they may not always be optimally positioned to stimulate through the dura. Our electrodes were relatively stiff, and thus the contacts may not be fully seated to optimize conductance. Further, the thickness of the CSF layer in the Yucatan subdural space varies between spinal levels and animals (unpublished magnetic resonance imaging and ultrasound data) affecting current distribution. These factors might also account for the detection of only a unilateral MEP detection in some muscles.
Neuromonitoring protocol
In summary, an intraoperative electrophysiological protocol was created for the Yucatan model, the most reliable muscles to be monitored were established, and reference ranges determined. A basic neuromonitoring protocol would consist of median and tibial nerve SSEPs, and MEPs recorded from ECR in the upper and TA in the lower extremities. Taking extra time to localize the sciatic nerves could provide larger SSEP amplitudes from the legs, increasing sensitivity. Motor and sensory epidural stimulation spanning the planned contusion site will yield even larger amplitudes to detect preserved transmission from above and below the injury. Further, this methodology will be useful to isolate the transmission impairment to the injury site.
Important questions for future studies are to define the pathways that mediate quadruped locomotion and optimize stimulation techniques. The utility of the model to test therapeutics intended for human use is linked to whether similar systems contribute to motor function between Yucatan micropigs and humans. The model may offer insights into the role of propriospinal circuits in regulating motor function.
Footnotes
Acknowledgments
This work would not have been possible without the generous support of The Miami Project to Cure Paralysis and The Buoniconti Fund, and by grants from The State of Florida Department of Health.
Author Disclosure Statement
No competing financial interests exist.
References
Supplementary Material
Please find the following supplemental material available below.
For Open Access articles published under a Creative Commons License, all supplemental material carries the same license as the article it is associated with.
For non-Open Access articles published, all supplemental material carries a non-exclusive license, and permission requests for re-use of supplemental material or any part of supplemental material shall be sent directly to the copyright owner as specified in the copyright notice associated with the article.