
Abstract
Non-invasive measurements of brain metabolism using 18F-fluorodeoxyglucose (FDG) with positron emission tomography (PET) may provide important information about injury severity following traumatic brain injury (TBI). There is growing interest in the potential of combining functional PET imaging with anatomical and functional magnetic resonance imaging (MRI). This study aimed to investigate the effectiveness of combining clinically available FDG-PET with T2 and diffusion MR imaging, with a particular focus on inflammation and the influence of glial alterations after injury. Adult male Sprague Dawley rats underwent a moderate controlled cortical impact (CCI) injury followed by FDG-PET, MRI, and histological evaluation. FDG uptake showed significant alterations in the corpus callosum, hippocampus, and amygdala after TBI, demonstrating that a relatively “focal” CCI injury can result in global alterations. Analysis of MRI T2 intensity and apparent diffusion coefficient (ADC) also showed significant alterations in these regions to include cytotoxic and vasogenic edema. Histology showed increased glial activation in the corpus callosum and hippocampus that was associated with increased FDG uptake at sub-acute time-points. Glial activation was not detected in the amygdala but neuronal damage was evident, as the amygdala was the only region to show a reduction in both FDG uptake and ADC at sub-acute time-points. Overall, FDG-PET detected glial activation but was confounded by the presence of cell damage, whereas MRI consistently detected cell damage but was confounded by glial activation. These results demonstrate that FDG-PET and MRI can be used together to improve our understanding of the complex alterations in the brain after TBI.
Introduction
T
One common pre-clinical model of TBI is the controlled cortical impact (CCI) injury, which results in a focal impact leading to local neuronal damage and glial activation. 4,5 Although no model of TBI can identically represent all aspects of human brain injury, CCI has been shown to be replicable and consistent and to demonstrate several aspects of clinical TBI, including memory dysfunction and neuronal loss. 6 Specifically, the hippocampus, corpus callosum, and amygdala, which have been suggested to be particularly sensitive to TBI, are affected in the CCI model. Clinically, damage to these regions is related to memory dysfunction, learning difficulties, motor skill deficit, depression, and anxiety. Hippocampal damage is associated with learning and memory impairments after TBI, 7 whereas dysfunction of the amygdala has been linked to post-traumatic stress disorder (PTSD). 8 –10 Additionally, corpus callosum damage plays a significant role in hemispheric communication. 11 These regions have been shown to demonstrate significant neuronal and glial changes following TBI.
Both neurons and glia play a significant role in the metabolic function of the brain. 12 Previous work in our laboratory with a mild lateral fluid percussion injury model has identified a connection between depressed glucose uptake and axonal damage as well as rising glucose uptake with glial activation. 13 However, only one study has investigated the glucose uptake profile in the CCI model using non-invasive imaging of 18F-fluorodeoxyglucose (FDG) with positron emission tomography (PET), investigating the influence of transplanted stem cells after TBI. 14 FDG is a radiolabeled glucose analog that is transported into cells and phosphorylated but cannot be metabolized further; therefore, it accumulates within cells and can be detected via PET imaging. 15 Clinical data and animal studies have shown that TBI results in a long-term reduction in cerebral FDG uptake and this phenomenon is more likely to present as injury severity increases (for review, see Byrnes and colleagues 16 ).
Magnetic resonance imaging (MRI) is currently more widely used for evaluating TBI compared with FDG-PET imaging. Following lateral fluid percussion TBI injury, T2-weighted MRI demonstrates hyperintense regions in the injured cortex at 24 h post-injury, which is associated with edema, 17 whereas T2* imaging has identified regions containing microhemorrhages. 18 In the clinic, measures of apparent diffusion coefficient (ADC) have been associated with worsening outcomes. 19,20 Vasogenic edema, which results from endothelial disruption, is generally indicated when both T2 and ADC values increase, whereas cytotoxic edema, which is the accumulation of water in cells, is indicated when T2 increases but ADC decreases. 21 However, it is currently unclear if FDG-PET can be used synergistically with MRI to improve diagnostic and prognostic measures after TBI. Therefore, this study aimed to examine the capabilities and the sensitivity of multi-modality imaging at detecting diffuse damage to the brain after a focal CCI, with a focus on glial activation in brain regions suspected to be affected by TBI: the hippocampus, amygdala, and corpus callosum.
Methods
Study design
The study was designed as a repeated measures cross-sectional study with one acute cohort (1 day post-injury; n = 3), three sub-acute cohorts (days 2, 4, and 8 post-injury; n = 4/time-point), and two chronic cohorts (days 12 and 21 post-injury; n = 4/time-point). All six cohorts obtained baseline PET/computed tomography (CT) and MRI scans prior to injury and a second PET/CT scan at one of the following time-points after moderate CCI injury: FDG-PET at 1, 3, 7, 11, or 20 days and MRI at 2, 4, 8, 10, or 21 days. The acute cohort was scanned at baseline and again at 3 h post-injury (FDG-PET) and 1 day post-injury (MRI). Animals were euthanized on days 1, 2, 4, 8, 12, and 21, after PET and MRI scans, and tissue was extracted for immunohistochemical analysis. A naïve cohort (n = 4) was evaluated for histological comparison only. Animal groups are summarized in Table 1.
CCI, controlled cortical impact; FDG, 18F-fluorodeoxyglucose; MRI, magnetic resonance imaging; PET, positron emission tomography.
Moderate traumatic brain injury
Adult male Sprague Dawley rats (150–200 g) were given free access to food and water and a 12 h light/12 h dark cycle. All animal procedures were approved by the Uniformed Services University IACUC. CCI was performed as previously described. 22 Rats were anesthetized with isoflurane (4% induction, 2% maintenance) and temperature was measured rectally and maintained at 36.5–37.5°C. The animal was placed in a standard rodent stereotaxic frame and positioned using ear and incisor bars. A 5 mm craniotomy was performed over the left cortex at −2.5 mm lateral and −3.0 mm posterior from bregma. Following the craniotomy, the CCI device (Impact One™, Leica Microsystems, Buffalo Grove, IL) with a 3 mm impactor tip was placed in the center of the craniotomy site and a moderate injury was induced with 5 m/sec speed, 200 msec dwell time, and 2 mm deformation depth. 22 The skull flap removed for craniotomy was not replaced after injury, as this replacement is known to exacerbate post-injury inflammation, 23 and the skin was sutured. For 2 days post-injury, rats received acetaminophen in the drinking water (200 mg/kg).
PET/CT imaging
FDG-PET/CT images were acquired using a Siemens Inveon Multimodality (Siemens Medical Solutions USA, Malvern, PA) scanner in the small-animal PET/CT facility of the Translational Imaging Core, Center for Neuroscience and Regenerative Medicine (CNRM). To avoid affecting TBI outcomes and because we employed reference region normalization techniques, animals were not fasted. Animals were anesthetized with isoflurane (4% induction; 1.5–2% maintenance) and injected intravenously with 1–2 mCi (37–74 MBq) FDG. Subjects were maintained under anesthesia for the duration of the uptake and imaging session. Vital signs were continuously monitored. A three-bed CT scan was acquired for anatomical localization and attenuation correction. CT data were acquired (80 kVp, 500 uA; exposure time 320 msec) with a bin of 4 using low magnification in “Rat Mode” (charge-coupled device [CCD] readout: transaxial 2944 and axial 1920). CT data were reconstructed in real time using a modified-Feldkamp algorithm (bilinear interpolation, Shepp-Logan filter) and corrected for beam hardening. CT image dimensions were 352 × 352 × 536 with a voxel size of 0.23 mm isotropic. PET data were acquired with a coincidence-timing window (Dt) of 3.432 nsec and energy window (DE) of 350–650 keV in list mode for 30 min following a 45-min uptake period. PET sinograms were reconstructed as a single, high-resolution static frame using a 3D-OSEM/MAP algorithm (2 OSEM iterations, 18 MAP iterations, requested resolution: 0.5 mm) with scatter, attenuation, and decay corrections applied. The intrinsic resolution of the PET scanner is approximately 1.4 mm full-width at half maximum (FWHM) at the center of the field of view. PET image dimensions were 256 × 256 × 159 with a voxel size of 0.39 × 0.39 × 0.80 mm.
MR imaging
In vivo MR imaging was performed on a 7 T small-animal Bruker BioSpec 70/20 USR Superconducting Magnet System (Bruker-Biospin, Ettlingen, Germany) equipped with 650 mT/m gradient coils. Animals were anesthetized with 1% isofluorane and placed in an MR-compatible head holder. Two-dimensional (2D) multi-shot echo planar imaging (EPI) (repetition time [TR]/echo time [TE] = 6250/26 msec; 8 segments) was used to acquire diffusion-weighted imaging (DWI) data with an unweighted (b = 0 sec/mm2) image and 5 diffusion-weighted images (b = 100, 200, 400, 800, 1000 sec/mm2) using a Stejskal-Tanner diffusion preparation with parameters of Δ = 9 msec and δ = 3.2 msec; field of view = 25.6 × 25.6 mm2, matrix = 256 × 256, slice thickness/gap = 0.95/.05 mm and 3 nonlinear directions. Multi-echo 2D rapid acquisitionwith relaxation enhancement (RARE) sequence was used to acquire T2-weighted images (TR = 10,000 msec, TE = 20, 60, 100, 120 msec, rare factor 4, field of view = 25.6 × 25.6 mm2, matrix = 256 × 256, and slice thickness = 1 mm).
PET and MR image processing
Image post-processing and analyses of FDG-PET data were performed using VivoQuant™ software version 1.22patch2 (Invicro, LLC, Boston, MA). T2 and ADC maps were generated using a nonlinear with constant algorithm (Levenberg-Marquardt) and a linear (OLS) least squares estimations algorithm, respectively. FDG, T2, and ADC maps were resampled to match CT voxel size (0.23 mm isotropic) and dimensions (352 × 352 × 536). For each subject, the T2-weighted image was manually registered with the CT image (6-parameter, rigid) and the generated transformation matrix was applied to the T2 map. The ADC map was manually registered with the CT image (6-parameter, rigid) and the scanner transformation matrix was applied to the PET image to produce a co-registered set of images: FDG, CT, T2, and ADC map. Co-registered images were uniformly cropped to a region surrounding the brain (170 × 170 × 240), which were manually reoriented (x,y,z-rotation) and automatically registered to a 14-region rat brain atlas using an algorithm that combines a rigid transformation of the data and scaling of the atlas. All images were reviewed for quality assurance. Quantitative output was obtained for ipsilateral, contralateral, and combined hemisphere regions. For PET, whole-brain standard uptake values (SUVs) were calculated as activity concentration/(injected activity/body weight) for each cohort and significant differences between cohorts were assessed using an ordinary one-way analysis of variance (ANOVA) with Tukey's post-test to correct for multiple comparisons. In addition, baseline whole-brain SUVs were compared with post-injury whole-brain SUVs using repeated measures two-way ANOVA without correcting for multiple comparisons. There were no statistical differences between cohort SUVs or between baseline and post-injury SUVs at any time-point. Therefore, the whole-brain uptake was used as a stable reference region and the activity concentrations for the hippocampus, corpus callosum, and amygdala were normalized to the uptake concentration of the entire atlas (whole-brain normalization) for inter-subject comparison.This relative measurement uses a semi-quantitative normalization technique to improve reproducibility and to minimize error propagation.
Histology
A 5 mm segment of the brain encompassing the lesion epicenter was dissected following euthanasia and perfusion with 10% buffered formalin. Brain tissue was sectioned at 20 μm and immunolabeled for microglia (Iba-1, 1:100, Wako Chemicals USA, Richmond, VA), astrocytes (GFAP, 2.5:1000, Abcam, Cambridge, MA), and neurons (NeuN, 5:1000, Millipore, Billerica, MA). Fluorescent secondary antibodies (Alexa-Fluor Secondaries, Invitrogen, Grand Island, NY) were used to visualize primary antibodies. Images were then captured on a NanoZoomer system (Hamamatsu, Bridgewater, NJ) or an Olympus BX43 microscope (Olympus America, Center Valley, PA). Fluorescent immunohistochemistry was quantified in 5–8 brain sections per animal within the amygdala, corpus callosum, and hippocampus as previously described using pixel density measurement in Scion Image (Scion Corporation, Frederick, MD). 24 Regions of interest were identified using the Inveon atlas from the FDG-PET scans as a guide (Fig. 1). Density measurements were obtained at a 20 × magnification in the hippocampus and corpus callosum, producing a 0.358 mm2 region of analysis, and a 10 × magnification in the amygdala, producing a 1.4 mm2 area of analysis.
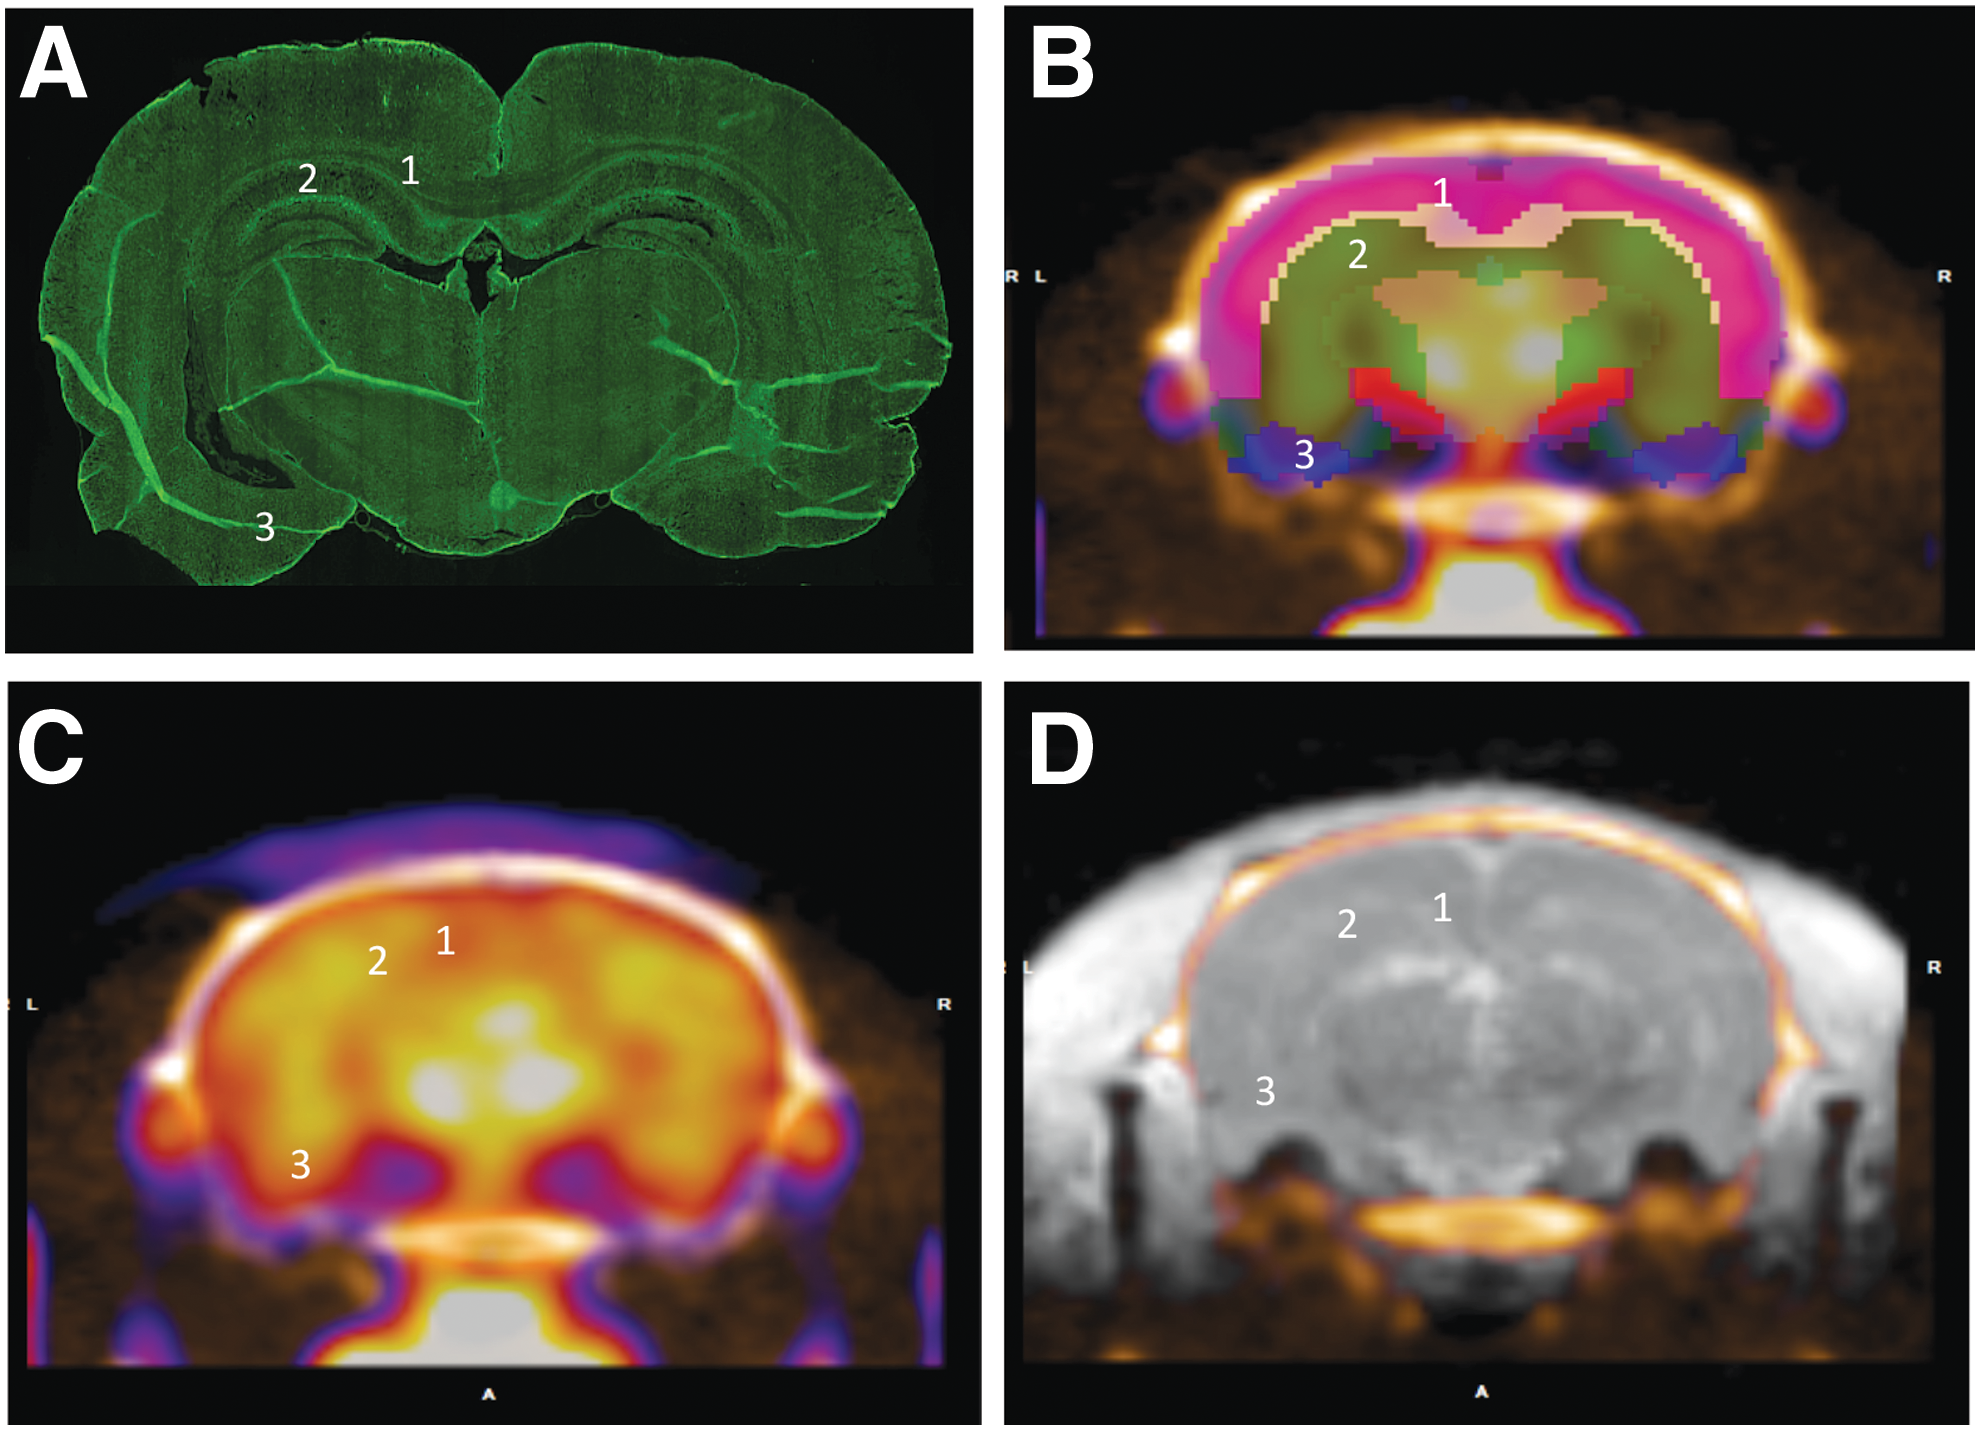
Location of regions of interest.
Statistical analysis
Immunohistochemisty pixel density values were compared with naive tissue with Kruskal-Wallis nonparametric analysis with Dunn's post-test. Imaging results were evaluated for outliers using the ROUT method and graphical analysis. No outliers were identified and baseline measurements were compared with post-injury using repeated measures two-way ANOVA without correcting for multiple comparisons. Correlations were computed between pairs without assuming Gaussian distributions using a nonparametric Spearman correlation test. All data are shown as mean ± standard error of the mean (SEM). All statistical tests were performed using the GraphPad Prism Program, version 7.0a for Macintosh (GraphPad Software, San Diego, CA). A p value <0.05 was considered statistically significant.
Results
Overall
The relative FDG uptake, MRI T2, and MRI ADC values were assessed for the corpus callosum, hippocampus, and amygdala for the whole, ipsilateral, and contralateral regions for the six cohorts at baseline and post-injury times. Globally, there were no statistical differences in whole-brain SUVs at any time-point. Detailed regional analysis (Table 2) revealed distinct histological and imaging patterns that indicate inflammation, cell activation, and possible cell dysfunction with cytotoxic edema.
p < 0.05, ** p < 0.01, *** p < 0.001, **** p < 0.0001.
ADC, apparent diffusion coefficient; FDG, 18F-fluorodeoxyglucose.
Corpus callosum
The corpus callosum showed significantly increased FDG uptake, T2, ADC, and glial activation. Descriptive data and statistics for the corpus callosum are summarized in Table 3. FDG uptake in the ipsilateral region demonstrated an acute decrease followed by a statistically significant increase at sub-acute time-points. This uptake remained significantly elevated through 11 dpi, before reducing at 20 days (Fig. 2A). FDG uptake in the entire corpus callosum and the contralateral regions followed a similar pattern (Supplementary Fig. 1A; see online supplementary material at

FDG uptake, T2, ADC values
p < 0.05, **p < 0.01, ***p < 0.001, ****p < 0.0001, # indicates non-parametric analysis.
ADC, apparent diffusion coefficient; FDG, 18F-fluorodeoxyglucose; SD, standard deviation.
MRI T2 and ADC values were measured 1 day after PET image acquisition (except for the 11-day group, for which values were measured 24 h prior to PET due to scheduling conflicts). Acutely, T2 values in the ipsilateral corpus callosum were increased and ADC values were unchanged. T2 values (Fig. 2B) at sub-acute time-points were generally elevated and significantly increased at 8 dpi in comparison with baseline, whereas ADC values were only slightly decreased (Fig. 2C). Yet, ADC values significantly increased at 8 dpi. This bimodal response in ADC may indicate early sub-acute cytotoxic edema followed by vasogenic edema at day 8. In the entire corpus callosum, T2 measurements were elevated in comparison with baseline at days 1, 2, 8, 10, and 20 and at days 1, 2, 8, and 10 in the contralateral corpus callosum (Supplementary Fig. 1A). ADC values were significantly reduced at 2 and 10 dpi in the contralateral corpus callosum (Supplementary Fig. 1).
Astrocytes were identified with an antibody against glial fibrillary acidic protein (GFAP; Fig. 2D), which was negligible in naïve corpus callosum. GFAP was slightly, though not significantly, elevated at most time-points with a significant increase at 4 dpi. Microglia and macrophages were identified using an antibody against the Iba1 protein. Iba1 immunolabeling was observed in naïve tissue and was significantly elevated at 8 dpi (Fig. 2E). Expression of this marker also showed a trend toward elevation at all other time-points, but did not reach statistical significance. There was no significant correlation between immunohistochemical values and imaging values in the corpus callosum, although FDG uptake, T2, and ADC show significant changes at the same sub-acute time-points that histology demonstrated glial activation.
Hippocampus
FDG uptake in the hippocampus is bimodal and is accompanied by elevated glial activity, increased T2, and decreased ADC. Descriptive data and statistics for the hippocampus are summarized in Table 4. FDG uptake was significantly elevated acutely and at 20 dpi in the ipsilateral hippocampus, but returned to baseline between days 1 and 11 (Fig. 3A). The entire hippocampus showed the same pattern, but the contralateral hippocampus only showed elevated FDG uptake at 20 dpi (Supplementary Fig. 1B).
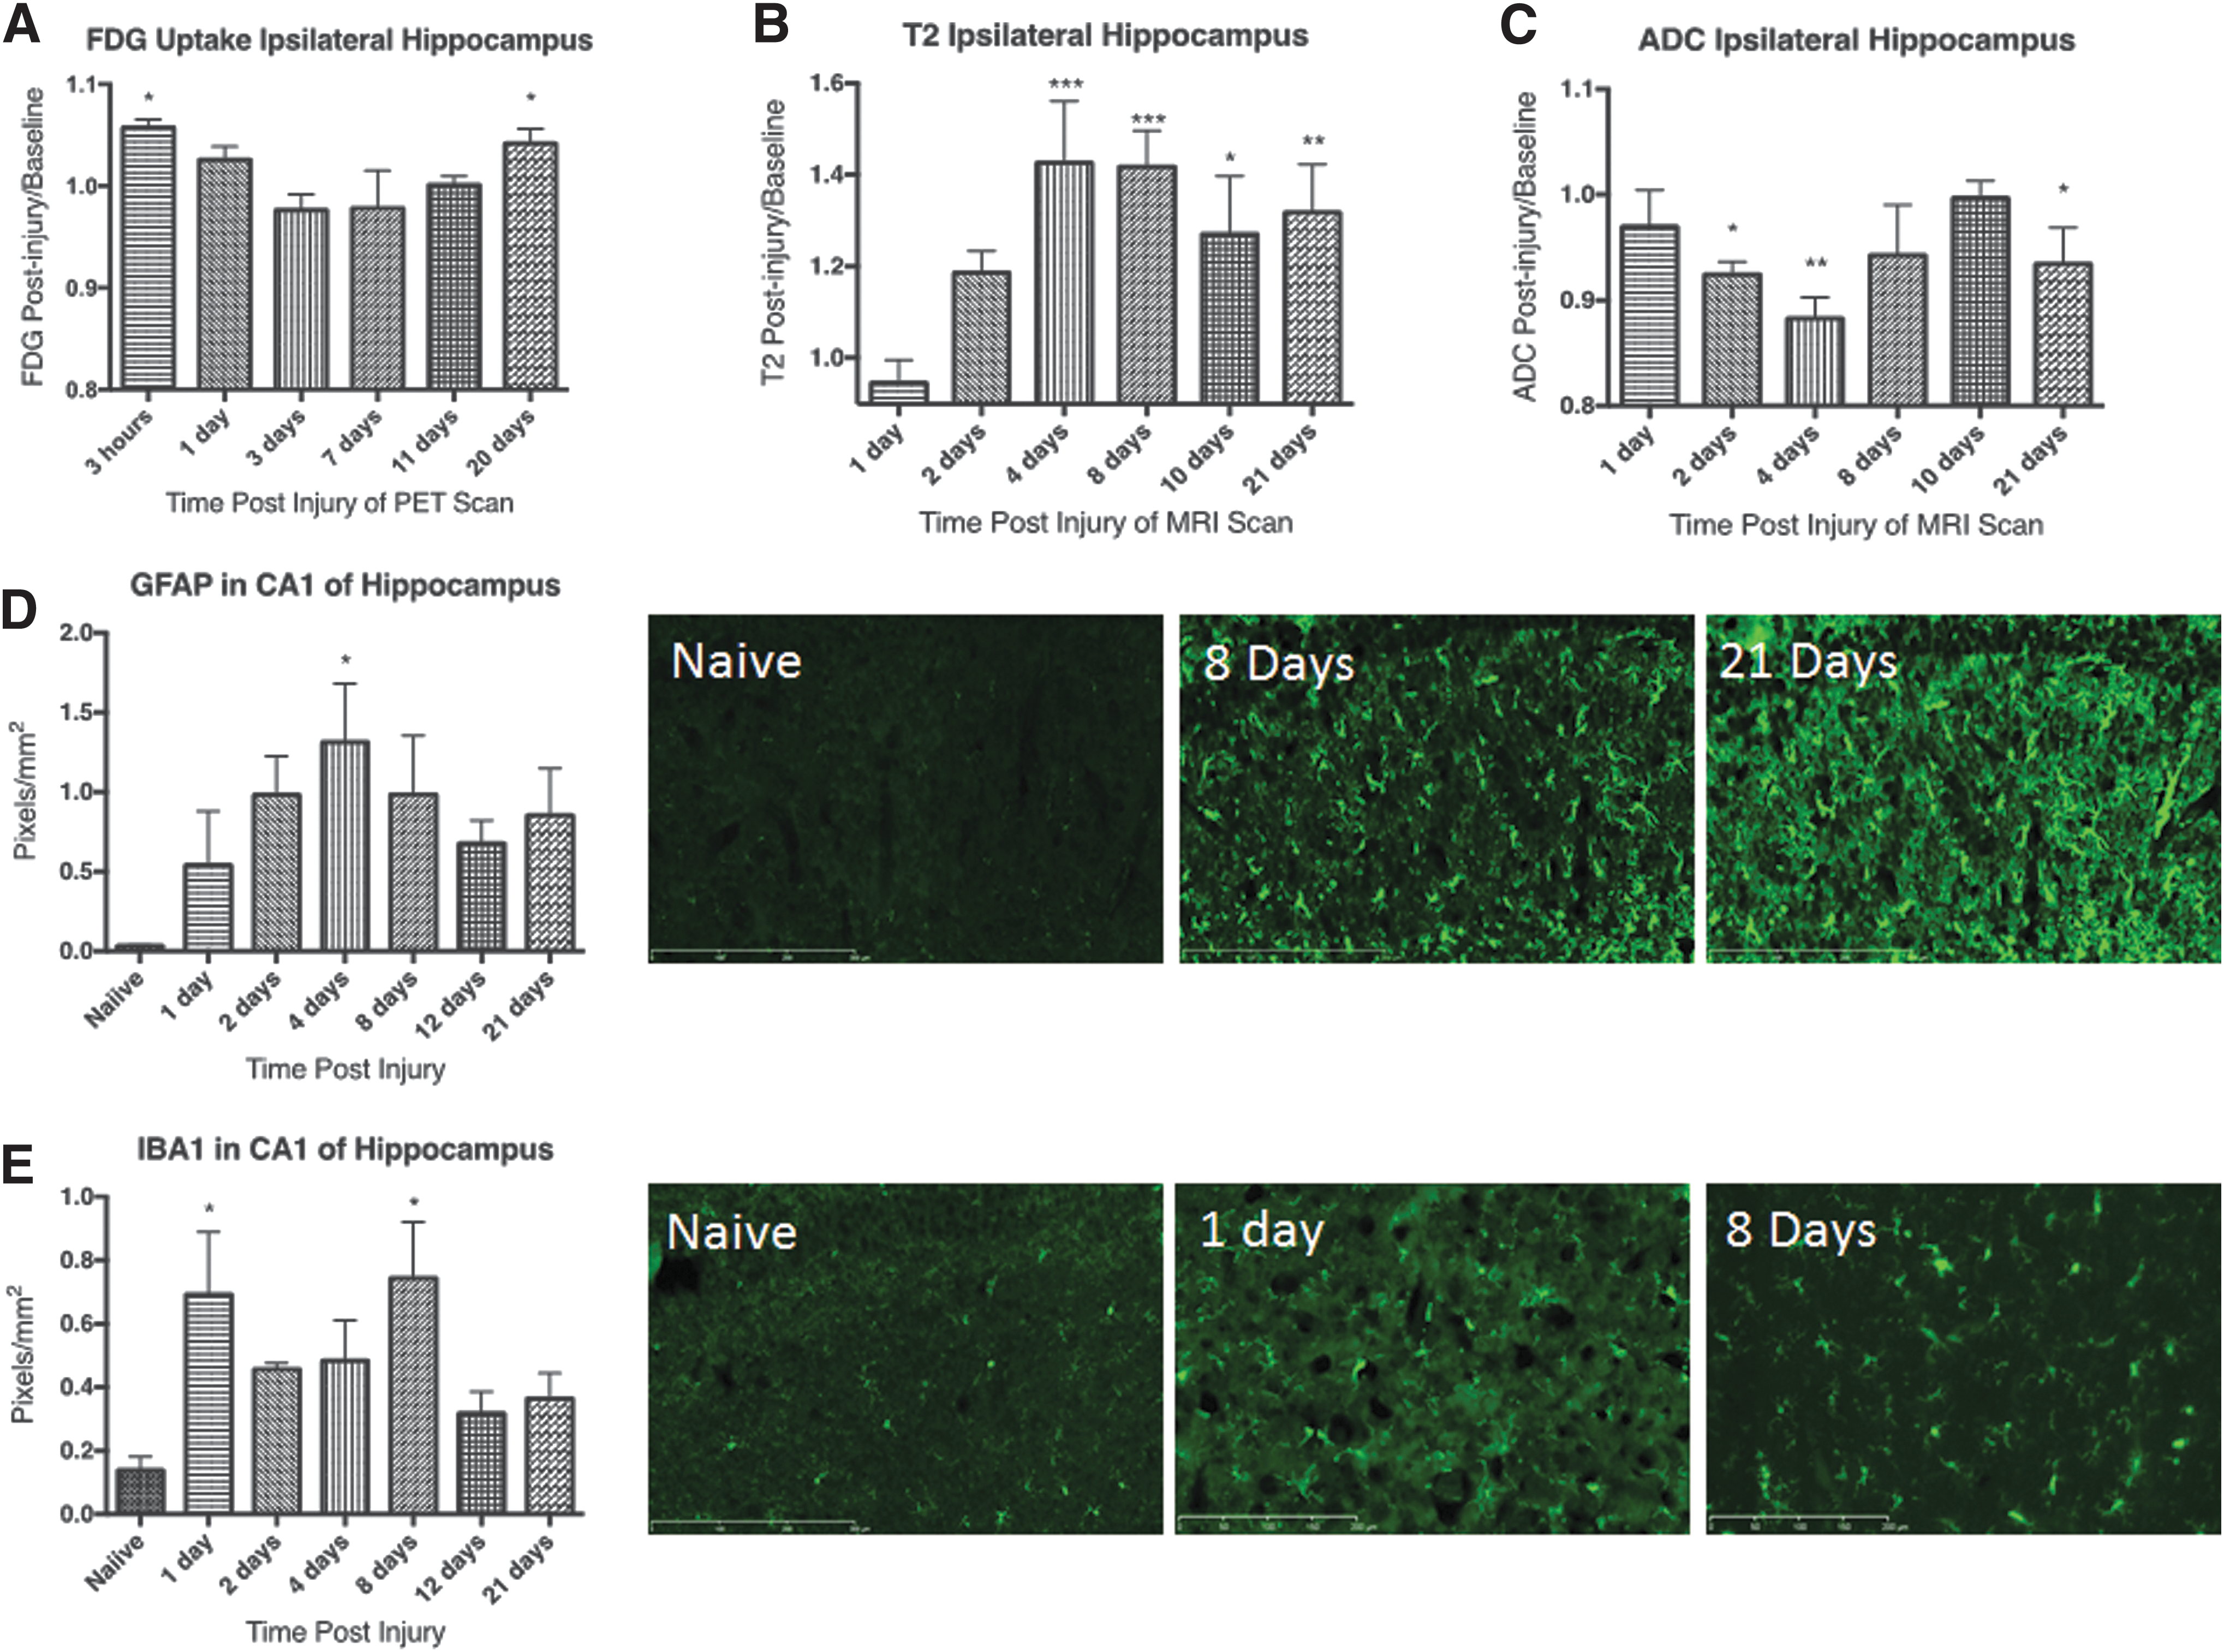
FDG uptake, T2, and ADC values
p < 0.05, ** p < 0.01, *** p < 0.001, **** p < 0.0001, and # indicates non-parametric analysis.
ADC, apparent diffusion coefficient; FDG, 18F-fluorodeoxyglucose; SD, standard deviation.
Edema was identified by elevated T2 values at days 4, 8, 10, and 21 in the ipsilateral hippocampus (Fig. 3B). ADC values, on the other hand, were significantly decreased at days 2, 4, and 21 in the ipsilateral hippocampus (Fig. 3C). This finding may indicate cytotoxic edema at early time-points with mixed edema (cytotoxic + vasogenic) at day 10. In the entire hippocampus, T2 values were elevated at days 2, 4, 8, 10, and 21 and at 2 and 4 dpi in the contralateral hippocampus. ADC values were significantly decreased at all days except day 10 in the entire hippocampus and days 2, 4, and 8 in the contralateral hippocampus.
Similar to the corpus callosum, immunostaining for GFAP showed nearly undetectable levels in naïve tissue and an acute increase (Fig. 3D). The elevation in GFAP expression reached statistical significance at day 4. Expression of GFAP remained elevated but quantitation did not reach statistical significance for the remaining time-points evaluated.
Immunostaining for Iba1 was elevated in the hippocampus after injury (Fig. 3E). Quantitation of Iba1 pixel density showed significant elevations above the naïve group at 1 and 8 dpi, with trends toward significance at all other time-points. Considering the robust activation of microglia and astrocytes along with significant cytotoxic edema, the FDG uptake profile at sub-acute time-points might indicate mixed cellular response (activation + cell dysfunction) with competing effects on FDG uptake.
Amygdala
The amygdala shows a significant decrease in FDG uptake after CCI in addition to cytotoxic edema, and neuronal damage, but no significant glial response. Descriptive data and statistics for the amygdala are summarized in Table 5. The most pronounced changes in FDG uptake were observed in the amygdala. FDG uptake in the ipsilateral amygdala was acutely increased followed by a pronounced depression that was significant at 3 and 7 dpi (Fig 4A). The entire region and contralateral amygdala independently showed similar patterns (Supplementary Fig. 1C).
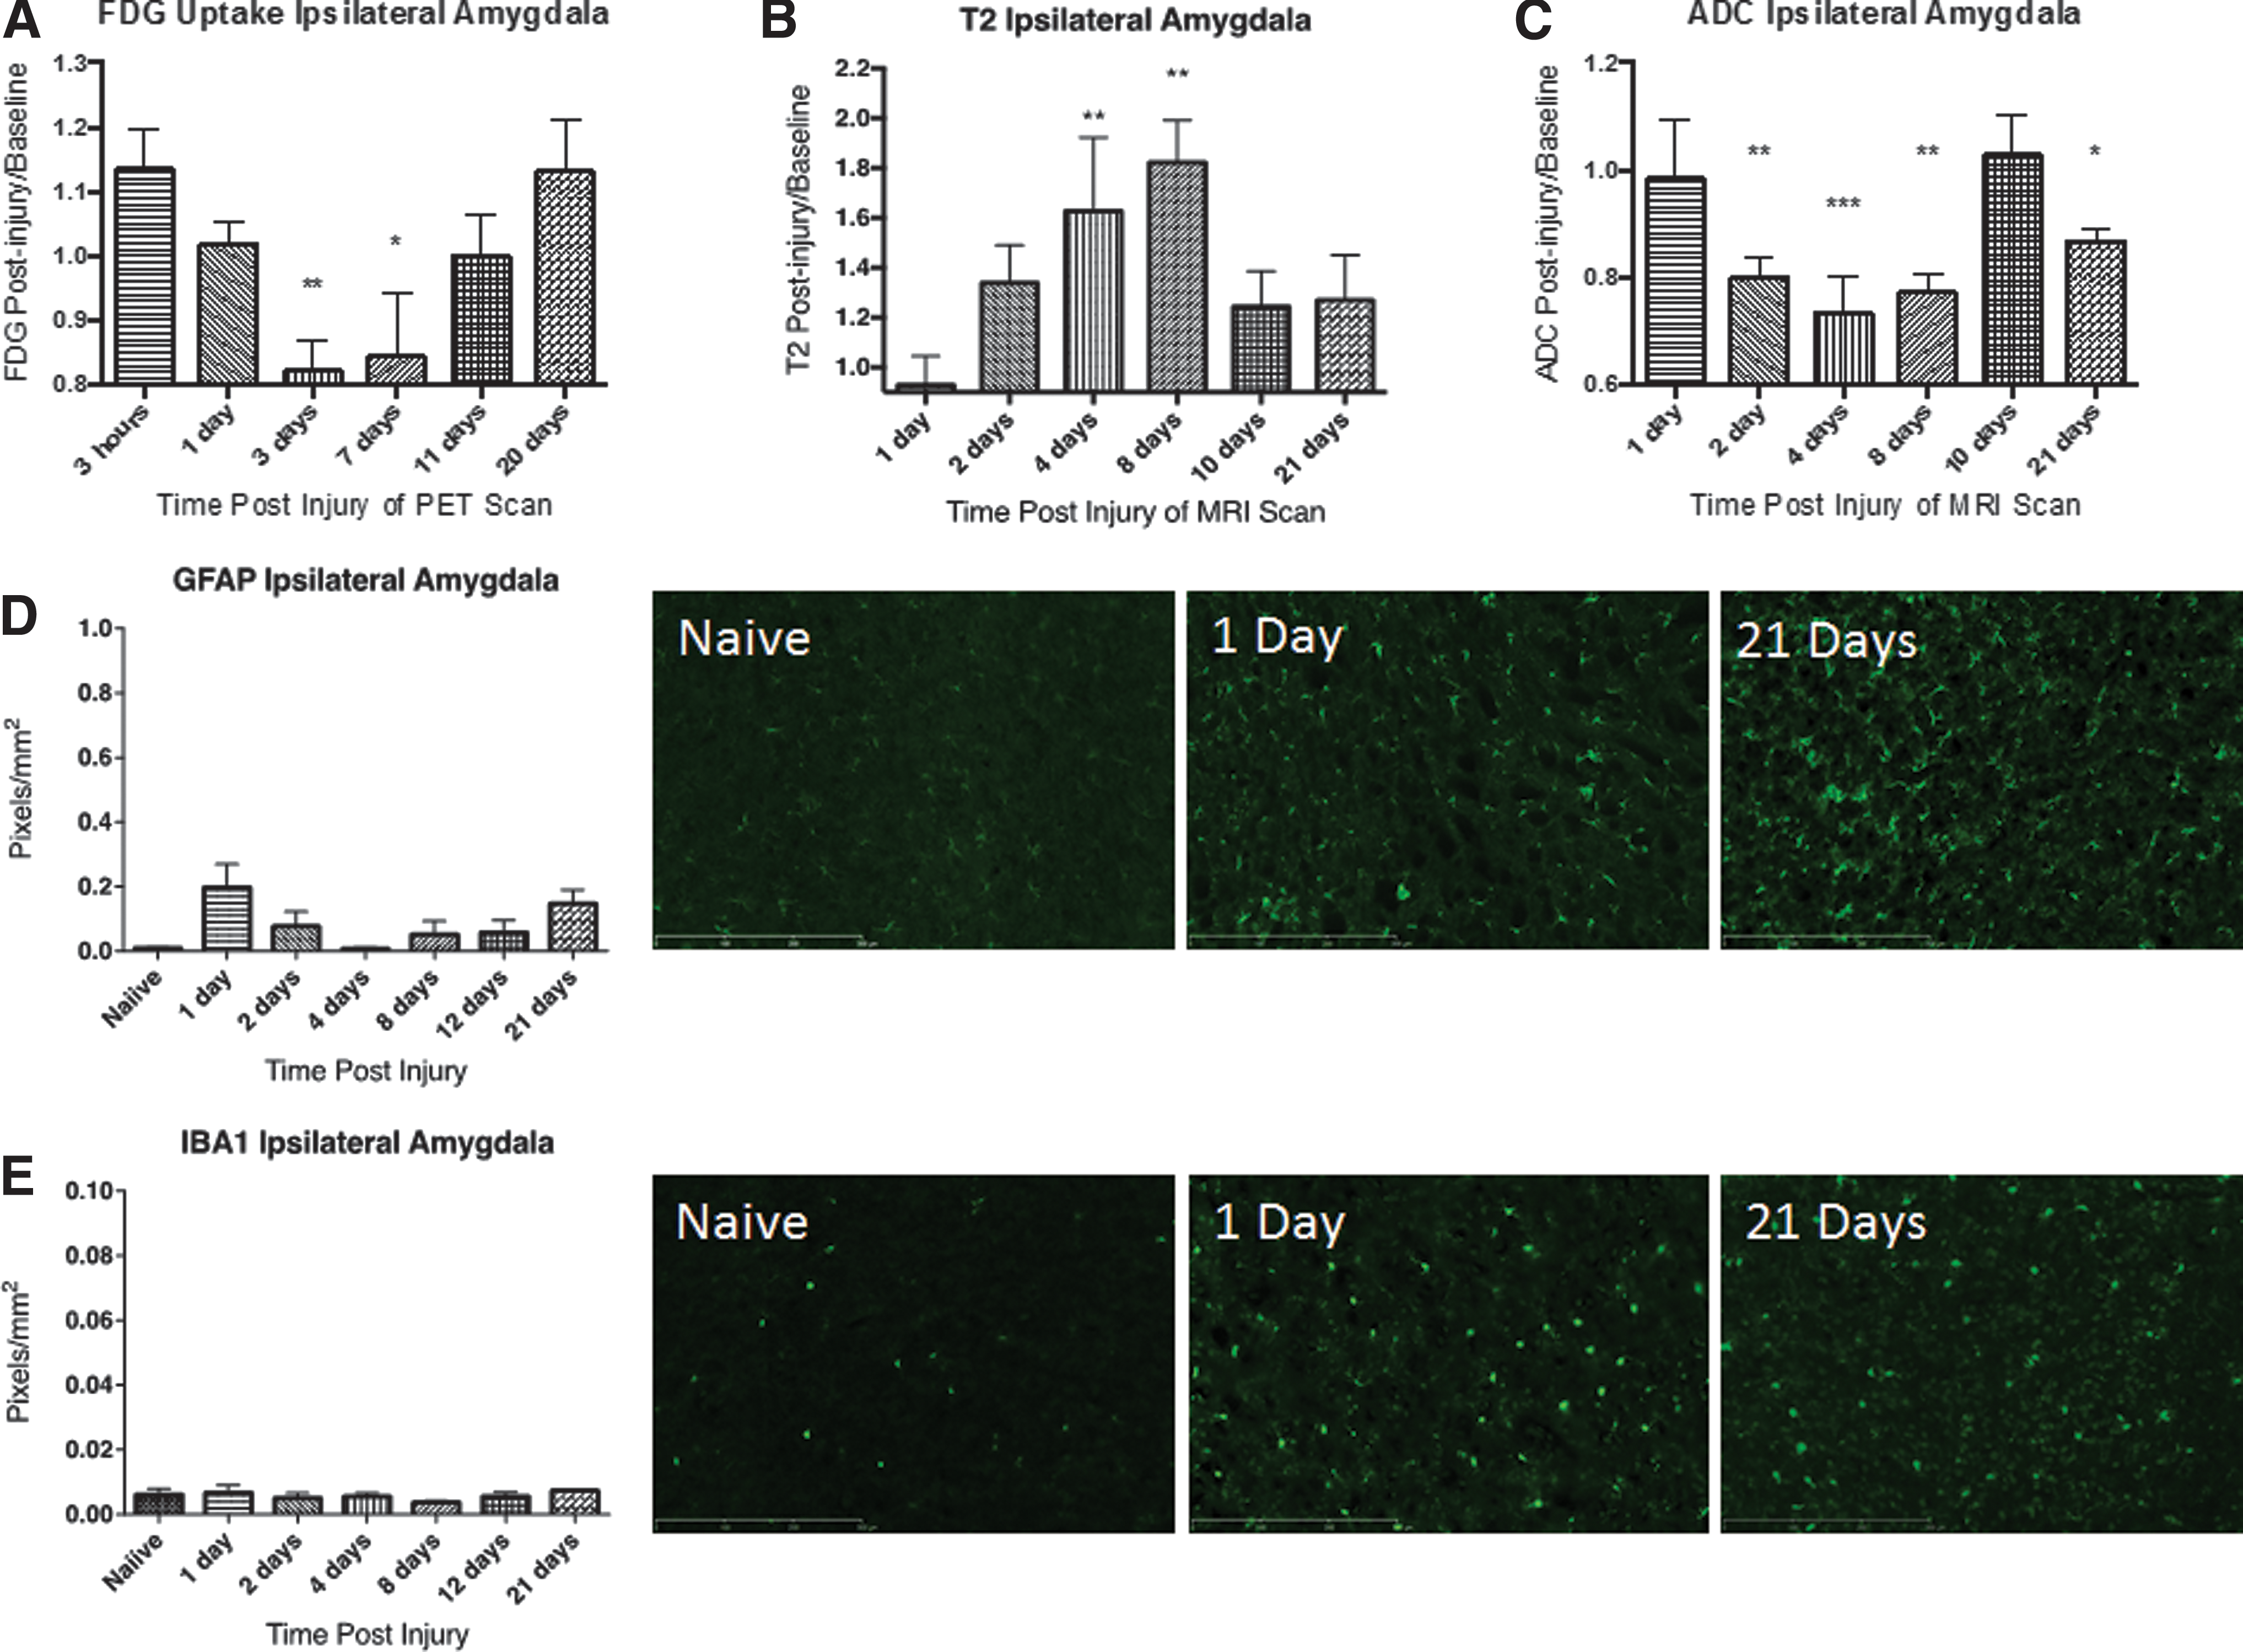
FDG uptake, T2, and ADC values
p < 0.05, ** p < 0.01, *** p < 0.001, and # indicates non-parametric analysis.
ADC, apparent diffusion coefficient; FDG, 18F-fluorodeoxyglucose; SD, standard deviation.
T2 values were found to be significantly elevated at 4 dpi in the ipsilateral amygdala (Fig. 4B). In contrast, ADC values paralleled FDG uptake, with significant reductions observed at 2, 4, 8, and 21 dpi (Fig. 4C). T2 and ADC values were found to follow the same patterns in the entire amygdala and contralateral amygdala as the ipsilateral amygdala (Supplementary Fig. 1C) and indicated cytotoxic edema.
GFAP expression slightly increased at 1 dpi but did not reach statistical significance, with a return to baseline at 4 dpi. A second slight elevation was observed at 21 dpi; however, this also did not reach statistical significance. There was no significant alteration in Iba1 immunolabeling in the amygdala at any time-point after CCI injury (Fig. 4E).
Due to the pronounced reduction in FDG uptake and lack of significant corresponding glial changes, we investigated the effect of CCI on amygdala neurons. The NeuN antibody recognizes a DNA binding protein in the nucleus, and was observed as a nuclear stain in tissue from naïve animals (Fig. 5). At 1 dpi, NeuN staining was still observed in the nucleus but staining was also observed in the cytoplasm. By 2 dpi and continuing through 4 dpi, NeuN staining in the amygdala was absent, although DAPI counterstain showed no marked reduction in cell presence. NeuN immunolabeling returned by 8 dpi, although the density of the stain and the nuclear localization were diminished. This lighter, cytoplasmic stain remained through 21 dpi and suggests that neuronal damage without simultaneous glial activation corresponds to a decrease in FDG uptake. This damage also corresponds with elevated T2 and decreased ADC (interpreted as cytotoxic edema) and would indicate cell death.

Representative images of neurons in the amygdala. NeuN immunolabeling was performed 24 h after PET imaging at 1, 2, 4, 8, 12, and 21 dpi. NeuN in the amygdala is lost acutely with no change in DAPI staining at any time-point but NeuN staining is partially recovered by 8 days. Bar = 50 μm. PET, positron emission tomography.
Correlation
The Spearman correlation showed a significant correlation between the corpus callosum and the hippocampus for Iba1 (p = 0.0229, r = 0.48) and GFAP (p = 0.0077, r = 0.59), but there were no correlations between immunohistochemistry values in the amygdala and the other two regions. Hence, the amygdala seems to show a different pathology from the other regions investigated.
The corpus callosum demonstrated no significant correlations between immunohistochemical values and imaging values. However, Spearman correlation showed a trend toward correlation (p = 0.063, r = 0.40) between Iba1 and T2 measures that did not reach statistical significance. In the hippocampus, a significant negative correlation was observed between Iba1 and ADC (p = 0.0194, r = −0.49) and a trend toward a negative correlation (p = 0.062) was observed for Iba1 and FDG (p = 0.062, r = −0.44).
FDG was significantly correlated with T2 (p < 0.0001, r = −0.72) and ADC (p = 0.016, r = 0.50) in the amygdala but no imaging parameters were correlated with immunohistochemistry in the amygdala. Hence, PET and MRI provided complementary information in the amygdala, but the underlying pathology was not completely identified with Iba1 and GFAP.
Discussion
The research presented is a descriptive analysis of the effectiveness of measuring TBI outcomes with FDG-PET and MRI T2 and DWI in distinct brain regions and comparing these outcomes with histological markers of cell activation. In general, significant astrocyte and microglial activation was observed in the corpus callosum and hippocampus at sub-acute time-points. Both regions showed acute cell activation (not significant), which remained elevated at chronic time-points. There were no significant changes in cell activation in the amygdala at any time-point. Due to limited tissue availability, NeuN staining was completed in the amygdala but not in the hippocampus or corpus callosum. Qualitative analysis of NeuN in the amygdala showed a distinct loss or alteration in staining. Overall, immunohistochemistry demonstrated elevated glial responses in the neuron-rich hippocampus and the neuron-free corpus callosum, but limited glial responses in the amygdala with acute loss of NeuN staining.
MRI T2 measurements showed significant increases at sub-acute time-points for all three regions and at chronic time -points for the hippocampus. Additionally, DWI (ADC) measurements significantly decreased at sub-acute time-points for hippocampus and amygdala. Increasing T2 and decreasing ADC values are typically interpreted together to indicate cytotoxic edema. A significant increase in ADC was observed at 8 dpi in the corpus callosum, which could indicate vasogenic edema. The corpus callosum was the only region to demonstrate increased ADC and a lack of cytotoxic edema. Otherwise, T2 and ADC MRI parameters showed a rather consistent response profile for the hippocampus and amygdala and, therefore, these regions would appear to have a similar underlying pathology based on MRI results.
Unlike MRI, the relative FDG uptake profile showed variable results for acute and sub-acute time-points for the three regions and may indicate a somewhat different underlying pathology for these regions. The FDG uptake was significantly increased in the corpus callosum and significantly decreased in the amygdala at sub-acute time-points. Different from the amygdala and corpus callosum, the hippocampus did not show a significant change at sub-acute time-points, yet it was the only region to show a significant increase at acute and chronic time-points. It is interesting to note the lack of significance in the hippocampus at sub-acute time-points.
The corpus callosum represents a region with altered glial response without the influence of neurons. At sub-acute time-points, we show significantly increased FDG uptake in concert with significantly increased T2 and bimodal ADC values (decreasing trend followed by a significant increase). Neuron death or dysfunction was not assessed with immunohistochemistry in the corpus callosum, but the lack of cytotoxic edema seems to indicate minimal cell dysfunction. Astrocyte and microglia labeling peaked or was markedly elevated at the same time-point of increased FDG uptake. This is similar to a 2003 study by Chen and colleagues demonstrating an acute increase in astrocyte response in the corpus callosum. 5 In clinical TBI, a number of studies have revealed periods of hyperglycolysis after moderate to severe TBI, particularly in regions near the injury epicenter. 25 Further, Wu and associates 26 demonstrated that white matter failed to show reduced glucose uptake after TBI, whereas gray matter did show a reduction. The lack of cell death and increased cell activation at sub-acute time-points seem to suggest that increased FDG uptake is associated with significant glial activation.
Our most surprising finding was evidence of a significant decrease in FDG uptake in the amygdala after injury. This structure, which is relatively distant from the injury site, showed a strong reduction in FDG uptake at sub-acute time-points before returning to baseline uptake levels by 11 dpi. Significant cytotoxic edema was evident at these same time-points based on T2 and ADC measurements and could indicate neuronal damage. Due to technical complications, it was not possible to quantify the NeuN-positive cells, but qualitative analysis of NeuN showed reduced or altered staining. Previous studies have shown that NeuN staining is lost or altered following neuronal damage. 27 Research has shown that CCI results in a significant loss of interneurons in the amygdala at these same time-points, 28,29 and our NeuN data agree with these findings, suggesting marked damage to neurons. Taken together, decreased FDG uptake and cytotoxic edema determined from MRI demonstrate neuronal dysfunction without significant cellular activation at sub-acute time-points.
The hippocampus region reflects both neuronal damage and glial activation, and exhibited a significant increase in FDG uptake at acute and chronic time-points. Despite a significant increase in astrocyte and microglia activation at sub-acute time-points, FDG uptake did not increase. Chen and co-workers showed very similar results to our current investigation, demonstrating an increase in astrocyte response in the ipsilateral hippocampus that returned to baseline levels by the conclusion of the study, despite minor differences in the injury parameters. 5 Neuronal death or dysfunction was not measured in the hippocampus, but previous studies have shown that the hippocampus is vulnerable to CCI-mediated neuronal death, occurring as early as 24 h post-injury and continuing for weeks after injury. 30 –32 Sub-acute changes in T2 and ADC indicate significant cytotoxic edema that provides evidence of neuronal dysfunction or death. We posit that neuronal death/damage and glial activation combine to mimic a baseline level of FDG uptake at sub-acute time-points, which would explain the lack of significance in FDG uptake at these times.
Analysis and interpretation of these data show a pattern of responses that are dependent on both the glial and neuronal responsiveness of the region investigated. The imaging parameters appear to have a different sensitivity to the underlying pathology. For example, T2 values were consistently elevated regardless of cellular composition and indicated non-specific edema, whereas ADC values were generally depressed, which indicated cytotoxic edema and cell dysfunction. It appears that dysfunctional neurons lead to a decrease in FDG uptake as witnessed in the amygdala, whereas astrocyte and microglial activations lead to an increase in FDG uptake as observed in the corpus callosum. If responses in both cell types (neurons and glia) are present, there appears to be a “canceling” of effects and FDG uptake remains near baseline levels as displayed in the hippocampus at sub-acute time-points.
A few limitations of this study include small cohorts that limited power, correlative, and statistical significance at some time-points and the lack of quantitative assessment of NeuN in all regions. The lack of significant statistical correlation between immunohistochemistry and imaging findings is not surprising because the imaging parameters used in this study are non-specific for a single variable but are influenced by multiple factors. Future work should include quantitative analysis of NeuN in all regions and multiple correlations tests to account for the multiple variables influencing imaging results. Despite the lack of correlation, we show a pattern of FDG uptake, T2, and ADC changes that, when taken together, indicate that these non-invasive imaging techniques are sensitive to the underlying pathology and alterations in cellular activation and dysfunction.
Another limitation of this study was the non-specificity of the imaging techniques. Even though FDG-PET and the basic MRI techniques utilized in this work have high clinical relevance and are widely available, they are non-specific and indicate a broad range of physiological conditions including inflammation and cell dysfunction. Other PET tracers available in academic research centers are more specific for activated microglia such as 11 C-PK11195 33,34 or 18F-DPA-714. 35 In addition, cell death can be measured using novel PET tracers such as 18F-ML-10, which can pass an intact blood-brain-barrier (BBB). 36 Used together, these tracers would provide a more specific measurement of cell activation and cell death. Future work should further explore the profile of glial and neuronal responses with targeted PET tracers for a more thorough investigation of brain responses.
Another limitation of this study is the use of template-based region of interest (ROI) analysis. Altered glucose uptake patterns have been observed in a number of pre-clinical and clinical TBI models (for review, see Byrnes and colleagues 16 ). More importantly, these uptake patterns are often correlated with functional impairments. We have previously shown that pre-clinical mild TBI, using a lateral fluid percussion (LFP) model, resulted in an acute reduction in FDG uptake that slowly returned to baseline levels by 10 dpi. 13 That study previously utilized the Siemens Inveon Research Workplace software package with a hand-drawn ROI located in the ipsilateral cortex or subcortical tissue, including the corpus callosum, hippocampus, and amygdala. The progression to using the VivoQuant software provides the ability to utilize a template rat brain atlas, which allows for the analysis of more regions in a more concise and reproducible manner than hand-drawn ROI. It is possible that the reduced uptake observed in our initial study of LFP is similar to the reduction observed in the amygdala in the current study, demonstrating consistent alterations in glucose uptake across injury models and injury severities. However, future work should include voxel-based analysis techniques with statistical parametric mapping to improve robustness and reproducibility.
Conclusion
In summary, in this study we show: 1. Based on histology, glial activation was identified in the corpus callosum and hippocampus but was limited in the amygdala. Based on NeuN staining, neuronal damage was identified in the amygdala. 2. Based on FDG-PET alone, normalized FDG uptake provided a relatively consistent measure of cell activation or infiltration (corpus callosum) and cell dysfunction/death (amygdala) when each effect was observed in isolation. FDG-PET was sensitive to the injury but was unable to accurately reflect tissue response when the two effects (activation and dysfunction) were present simultaneously in the tissue (hippocampus). 3. Based on MRI measurements alone (T2 and ADC), cell death or cytotoxic edema was identified in the hippocampus and amygdala. In addition, vasogenic edema in the corpus callosum was identified at sub-acute time-points. MRI was sensitive to the injury but had limited specificity for detecting the underlying pathology such as cell activation. 4. Based on the PET and MRI combined, cell activation and cell dysfunction were accurately identified in the corpus callosum and hippocampus, whereas cell dysfunction without cell activation was accurately identified in the amygdala.
Ultimately, the combination of MRI with FDG-PET significantly improves sensitivity to the underlying processes involved with the tissue response to TBI. Additional clinical studies focusing on combining FDG-PET with MRI techniques could improve our knowledge of the pathophysiology of TBI.
Footnotes
Acknowledgments
This study was funded by the Department of Defense (DoD) in the Center for Neuroscience and Regenerative Medicine. The opinions or assertions contained herein are the private ones of the author(s) and are not to be construed as official or reflecting the views of the DoD or the Uniformed Services University of the Health Sciences (USUHS).
Author Disclosure Statement
No competing financial interests exist.
References
Supplementary Material
Please find the following supplemental material available below.
For Open Access articles published under a Creative Commons License, all supplemental material carries the same license as the article it is associated with.
For non-Open Access articles published, all supplemental material carries a non-exclusive license, and permission requests for re-use of supplemental material or any part of supplemental material shall be sent directly to the copyright owner as specified in the copyright notice associated with the article.