
Abstract
In this study, structural connectivity after mild traumatic brain injury (mTBI) was examined from a network perspective, with a particular focus on post-traumatic complaints. Fifty-three patients with and without self-reported complaints at 2 weeks after uncomplicated mTBI were included, in addition to 20 matched healthy controls. Diffusion weighted imaging was performed at 4 weeks post-injury, and neuropsychological tests measuring processing speed and verbal memory were administered at 3 months post-injury to determine cognitive outcome. Structural connectivity was investigated using whole brain tractography and subsequent graph theory analysis. In patients with mTBI, eigenvector centrality within the left temporal pole was lower than in healthy controls. In patients without complaints, global and mean local efficiency were lower than in patients with complaints, although no differences were found between either subgroup and the group of healthy controls. Neuropsychological test scores were similar for patients with mTBI and healthy controls. However, patients with complaints showed higher processing speed than patients without complaints. Within the total mTBI group, a trend was found toward a correlation between lower network clustering and higher processing speed. Additionally, significant correlations were found between higher betweenness centrality values of language areas and lower verbal memory scores in patients with mTBI. In conclusion, our findings may indicate that global graph measures of the structural connectome are associated with pre- and/or non-injury-related factors that determine the susceptibility to developing (persistent) complaints after mTBI. Further, correlations between graph measures and neuropsychological test scores could suggest early compensatory mechanisms to maintain adequate cognitive performance.
Introduction
M
Diffusion tensor imaging (DTI) has been used in multiple studies of mTBI to study white matter. 10 However, findings so far vary significantly, especially regarding the anatomical location and direction of changes in diffusion parameters (e.g., fractional anisotropy [FA] and mean diffusivity [MD]). 10 A recent DTI study has shown that diffusion parameters were similar for acute mTBI and healthy control (HC) subjects. 11 Further, in instances of diffusion changes after mTBI, the relationship with post-traumatic complaints is unclear. Recent DTI studies have not shown differences in diffusion parameters between patients with and without complaints, 11 –13 which casts doubts on the influence of structural injury on the development of complaints after mTBI.
Most of the conducted DTI studies on mTBI have used methods that detect changes in diffusion parameters, either in regions of interest or in white matter skeletons. 10,14 It could be argued that modeling white matter tracts as a network (i.e., connectome) results in a better approximation of the brain's complex topological features and of interactions between regions. 15 –17 Especially in a heterogeneous condition such as mTBI, studying connectivity of structural networks may be valuable for exposing patterns of white matter alterations that remain latent with traditional methods that have been used so far. In this context, networks (or graphs) are defined by their anatomical regions (nodes) and connections between regions (edges), which may be weighted, for example, by the number of reconstructed streamlines. Subsequently, graph theory can be applied. 18 With this method, various graph measures can be calculated to study characteristics of the whole network or its individual nodes. Graph theory measures are subdivided into three main domains: integration, segregation and influence. 17 Integration refers to the overall organization of a network in terms of connectivity and information transfer. A well-known measure of integration is global efficiency. Segregation describes the formation of separate clusters within a network or connectivity at a more regional level, and an important measure is clustering coefficient. Lastly, influence describes the importance of separate nodes within a network, which can be captured by computing centrality measures, such as betweenness and eigenvector centrality. Nodes that occupy a central position within the network are referred to as hub nodes. 19 Damage to hub nodes, for example as a result of TBI, may have far-reaching effects on network function. 20
Graph theory has proven powerful in revealing many (subtle) aspects of the pathophysiology of a wide range of neurological and psychiatric diseases. 15,21 Quite recently, graph theory has been adopted as a method of studying functional and structural connectivity in patients with TBI. 20,22 –29 Studies on structural connectivity have included children and adolescents with acute 29 and chronic mTBI, 22 and adult patients with chronic moderate to severe TBI. 23 –26 These studies have shown changes in network integration, segregation and influence. For example, lower global efficiency and higher clustering of structural networks was reported, 24,29 as well as reduced centrality of hub nodes, such as the cingulate cortex. 25 Further, lower global efficiency and centrality were found to be related to lower cognitive performance. 24,25 Regarding adults with mild TBI, only one study on structural networks has been published thus far. 30 Using network-based statistics, 31 this study demonstrated reduced, predominantly frontal, structural connectivity in patients with high levels of self-reported symptoms. In addition, a graph theory study examined functional connectivity in patients with mTBI and reported changes in local measures, predominantly within the frontal and temporal regions, which were associated with post-traumatic complaints. 27 Despite these interesting results, the structural connectome in patients with mTBI is still poorly understood.
The present study is the first to perform diffusion tractography followed by graph theory analysis in adult patients with uncomplicated (i.e., without abnormalities on CT) mTBI in the subacute phase after injury. Given the novelty of graph theory in the field of mTBI, determining which graph measures are most suitable for studying this condition is not straightforward. Therefore, an exploratory approach was used in the current study, and selection of graph measures was made, based on elaborate reviews of graph theory analysis 17,18,21,32 and previously published graph theory literature on TBI. 20,22 –25,27,29 Graph measures related to integration, segregation and influence were computed, and the association with the presence or absence of post-traumatic complaints was examined. Because cognitive and affective complaints are among the most persistent complaints after mTBI, 1,3 patients were selected who reported complaints within these domains. An additional research goal was to examine whether global and local graph measures in the subacute phase were predictive of cognitive performance at 3 months post-injury. In particular, it was examined whether global network measures were related to scores on tasks that measure processing speed.
Methods
Study participants
Data from the patient group described in previously published fMRI research were used for the current diffusion weighted imaging (DWI) study. 33 Fifty-three patients (18–65 years of age; 35 male) with mTBI were enrolled between March 2013 and February 2015 in the University Medical Center Groningen, the Netherlands (a level 1 trauma center). mTBI was defined as a Glasgow Coma Score of 13–15 and/or loss of consciousness ≤30 min. 34,35 The following exclusion criteria were used: lesions on admission CT scans, neurological and psychiatric comorbidity, admission for prior TBI, drug or alcohol abuse, insufficient comprehension of Dutch language, mental retardation, and contraindications for MRI (any implanted ferromagnetic devices and objects, pregnancy, and/or claustrophobia). Further, 20 HC subjects were recruited among social contacts and via advertisements, and were group-matched with the total mTBI group for age, sex, and educational level. HC had no history of TBI.
Study approval was obtained from the local Medical Ethics Committee of the University Medical Center Groningen, the Netherlands, and all participants provided written informed consent after the study and procedure had been fully explained. All study procedures were conducted according to the declaration of Helsinki.
Clinical measures
At 2 weeks post-injury, a post-traumatic complaints checklist composed of 21 frequently occurring complaints was administered to patients. A detailed description of this questionnaire is available in previously published material. 4,36 For the present study, patients were selected based on the number of complaints, and divided into two groups. Having post-traumatic complaints (PTC-present) (n = 33; 17 male) was defined as reporting three or more complaints with at least one complaint in the cognitive and/or affective domain, and no complaints (PTC-absent) (n = 20; 18 male) was defined as two or fewer complaints.
HC and patients (at ±3 months post-injury) also underwent neuropsychological testing. Because mental fatigue, concentration, and memory problems are common complaints after mTBI, the following tests were applied: Trail Making Test A (TMT-A; processing speed), 37 Stroop I Test (verbal speed), 38 Digit-span Test backward (working memory), 39 and the Dutch version of the Rey Auditory Verbal Learning Test (RALVT; immediate and delayed verbal memory). 40 Three patients did not return for neuropsychological follow-up. Raw scores, corrected for age and education level, were used for statistical analyses. To control for task underachievement, participants with a score <85 on the Amsterdam Short Term Memory Test 41 and/or >5 on a brief version (neurological impairment and amnestic disorders subscales) of the Structured Inventory of Malingered Symptomatology 42 were excluded from analyses. These participants included one HC and nine patients with mTBI (four PTC-absent and five PTC-present patients).
MRI acquisition
Participants underwent MRI scanning (patients at ∼4 weeks post-injury) using a 3 T Philips Intera MRI scanner (Philips Medical Systems, Best, The Netherlands) equipped with a 32 channel SENSE head coil. For anatomical reference, a high resolution transversal T1-weighted image was acquired with the following parameters: repetition time (TR) 9 ms, echo time (TE) 3.5ms, flip angle 8 degrees, field of view (FOV) 256 × 232 mm, and voxel size 1 × 1 × 1 mm). Acquisition of diffusion weighted images was performed using single-shot echo planar imaging with the following parameters: TR 8884 ms, TE 60 ms, FOV 240 × 240 mm, acquisition matrix 96 × 95, 55 slices (thickness 2.5 mm), reconstructed voxel size 2.5 × 2.5 × 2.5 mm, 60 diffusion directions, b-value 1000 sec/mm2. In addition, seven volumes without diffusion weighting (b = 0 sec/mm2) were acquired and averaged in a single volume by the MR scanner.
For detection of post-traumatic lesions, the following sequences were used: coronal T2*-gradient echo (TR 875 ms, TE 16 ms, FOV 230 × 183 mm, voxel size 0.49 × 1.12 × 4 mm) and transversal susceptibility weighted imaging (TR 35 ms, TE 15 ms, FOV 230 × 183 mm, voxel size 0.90 × 0.90 × 2 mm). These sequences were examined for microbleeds (1–10 mm) by an experienced neuroradiologist. Within the control group, no microbleeds were detected. Within the patient group, 28% showed one or more microbleeds. Seventy percent of all lesions were located within the frontal regions, 14% within the temporoparietal regions, 14% within other regions, and 2% within the corpus callosum. No statistical differences in the presence (χ2 = 0.046, p = 0.831) or number (U = 327, p = 0.936) of lesions were found between the PTC-present (median 0 lesions, range 0–37) and PTC-absent (median 0, range 0–26) groups.
Imaging data processing
Figure 1 shows the DWI and T1 processing pipeline. The T1-weighted scans were preprocessed using the recon-all function of FreeSurfer version 5.3 on a cluster of processors running Linux (Ubuntu 12.04.5 LTS, CPU model AMD Opteron Processor 6272). FreeSurfer starts with removing the non-brain tissue 43 followed by automated Talairach transformation, segmentation of the subcortical white matter and deep gray matter volumetric structures, 44,45 and intensity normalization. 46 It then proceeds with tessellation of the gray matter–white matter boundary, automated topology correction, 47,48 and surface deformation following intensity gradients to optimally place the gray/white and gray/cerebrospinal fluid borders at the location where the greatest shift in intensity defines the transition to the other tissue class. 49 –51 Finally, registration to a spherical atlas based on individual cortical folding patterns is performed 52 followed by parcellation of the cerebral cortex into units with respect to gyral and sulcal structures, 53,54 which has been shown to be a reliable way of defining subject-specific regions of interest (ROIs). Default parameters were used for all processing steps. The quality of FreeSurfer results was examined in each subject by overlaying the subcortical segmentation and the white and pial surfaces on coronal, sagittal, and axial T1 slices. The T1.mgz (i.e. the FreeSurfer T1 image) and aparc+aseg.mgz (i.e. image containing ROIs constructed by the FreeSurfer pipeline) files were converted to the Neuroimaging Informatics Technology Initiative (NIfTI) format (T1.nii and aparc+aseg.nii) to be used in further analyses.

Data processing pipeline.
Diffusion data were processed using ExploreDTI, 55 version 4.8.5, using MATLAB (MATLAB Release 2014b, The MathWorks, Inc., Natick, MA), which was run on a cluster of processors running Linux (CentOS 6.6, CPU model Intel Xeon E5 2680v3). First, the FreeSurfer T1.nii files were processed using the mask function from ExploreDTI, applying a kernel size of morphological operators of 5 and a threshold of 0.05. Subsequently, diffusion data were corrected for motion and eddy currents, 56 and susceptibility distortions 57 with the masked T1.nii files as undistorted (target) scans, followed by constrained spherical deconvolution (CSD) tractography, 58 –60 resulting in one streamline file per subject. Default parameters were used for all processing steps in ExploreDTI, except for the aforementioned masking of the T1.nii file (because the applied parameters resulted in producing proper masking results). The corrected diffusion results were quality checked in every subject by 1) viewing all three planes of the diffusion weighted images in a movie loop, 2) viewing the axial slices of the color coded FA map, and 3) viewing all three planes of the color-coded FA map overlaid on the T1 volume.
Network construction
First, it was ascertained that every ROI that was planned to be used in the analysis was present (i.e., “dissected”) in the aparc+aseg files of all subjects. The cerebellum, which was not fully covered in all scans, and the ventricles were excluded from the analysis, resulting in 85 ROIs in each subject (see Table S1) (see online supplementary material at
Image quality assurance
Visual quality assurance of the FreeSurfer results yielded 12 scans that had to be (partially) rerun after some slight manual modifications. The final result was a proper delineation of all surfaces and subcortical ROIs in all subjects. Quality checking of the results of the ExploreDTI pipeline yielded no extra concerns in this regard; therefore, all subjects could be used in further analyses.
Network analyses
Graph analysis was performed on weighted streamline matrices using the Brain Connectivity Toolbox (BCT) version 2016-16-0118 in combination with in-house developed MATLAB (v2011b) scripts. Graph measures were selected based on previously conducted graph theory studies on TBI. The following global (i.e., computed for the total network) measures were computed: global efficiency (Eglob), mean local efficiency (Eloc), normalized mean clustering coefficient (γ), and modularity (Q). Also, the following local (i.e., for individual nodes) measures were computed: nodes' degree (K i ), local efficiency (Eloc i ), clustering coefficient (C i ), betweenness centrality (BC i ), and eigenvector centrality (EC i ). Table 1 provides a description of all measures used in the current study, categorized by domain of network organization (integration, segregation, and influence 17,18 ). For a detailed description of these measures we refer the reader to the article by Rubinov and Sporns. 18
Because inter-individual variations exist in the whole brain number of reconstructed streamlines, for example as a result of sex and age differences, 61 prior to graph analysis connectivity matrices were normalized using the BCT weight conversion function. Subsequently, graph measures were computed over a range of network density thresholds (0.01–0.28, with increments of 0.01, obtained using the BCT threshold proportional function), aimed at reducing the influence of spurious connections. A range of thresholds was used to avoid unwanted modifications of graph measures that may occur when using a fixed threshold. 62 The upper limit was set at 0.28, at which all participants' connectivity matrices showed maximum density (i.e., unthresholded matrices). To obtain a scalar that was independent of selecting a single threshold, the area under the curve (AUC) was calculated across thresholds for every subject. These values were used for statistical group analyses.
Statistical analyses
Analyses of demographics and clinical measures were conducted using the statistical package for Social Sciences (SPSS; version 22.0; Armonk, NY: IBM Corp). Data were assessed for normality using Shapiro–Wilk tests. Normally distributed continuous variables were analyzed using one way analysis of variance (ANOVA) and two-sample t tests. Non-normally distributed continuous variables were analyzed using Kruskal–Wallis and Mann–Whitney U tests. Pearson's χ2 tests were used for categorical variables. Group comparisons of neuropsychological test scores were performed using analysis of covariance with inclusion of age and education level as covariates.
Permutation tests (10,000 random permutations) were conducted in MATLAB (v2011b) to assess differences in the AUC values of global and local graph measures between mTBI patients and HC, between patients with and without PTC, and between each of the patient subgroups separately and HC. Group differences in global measures were considered significant at a false discovery rate (FDR) of 0.05 (number of global measures was four). 63 Each of the local measures were deemed significant at the same FDR of 0.05 (number of nodes was 85). In addition, the common language effect size indicator (CL) was calculated to estimate effect sizes. 64 Because there was a difference in the ratio of male to female subjects between patients with and without complaints, global and/or local graph measures that were significantly different between these groups were also compared between male and female patients (with an FDR of 0.05). This comparison was made within the PTC-present group only, because the PTC-absent group contained only two female patients. To account for a potential influence of microbleeds, global and local graph measures were also compared between patients with and without lesions (with an FDR of 0.05).
Using MATLAB, partial Spearman's rank correlations were computed between graph AUC values and neuropsychological test scores in the total group of mTBI patients with correction for age and education level. For the global network measures (Eglob, mean Eloc, γ and Q), correlations were computed between AUC values and scores on tests measuring processing speed (TMT-A and Stroop I). In addition, the issue of whether local graph measures of specific nodes were associated with scores on verbal memory (RALVT) and verbal working memory (Digit-span backward) tests was assessed. Nodes were selected based on the cognitive domains that were assessed by the specific tests. Hence, correlations were computed between graph AUC values of temporal nodes + the opercular and triangular parts of the inferior frontal gyri (i.e., Broca's area) and RAVLT scores, and between AUC values of frontoparietal nodes and Digit-span Test backward scores (node selections are listed in Table S1). Again, results were considered significant at an FDR of 0.05 (i.e., corrected for the number of global measures or nodes).
Results
Demographics and clinical characteristics
Demographics and clinical characteristics of this study population are listed in Table 2. The total group of patients with mTBI was matched with HC on age, sex, education level, and handedness. Injury and other characteristics were similar for PTC-present and PTC-absent patients, except for sex (χ2 = 8.224; p = 0.004). Regarding neuropsychological tests, no differences were found between patients with mTBI and HC when adjusting for age and education level. However, PTC-present patients had lower scores (indicating better performance) on TMT-A than PTC-absent patients (F = 5.94, p = 0.02). Regarding cognitive complaints, fatigue was reported by 91% of the PTC-present group, forgetfulness and (mental) slowness by 78%, and poor concentration by 73%. One patient in the PTC-absent group reported fatigue, and no cognitive complaints were reported in this group.
Kruskal-Wallis test.
Pearson's χ2 test.
Education level was based on a Dutch classification system, according to Verhage (Verhage, [1964]: Intelligence and age: Study with Dutch people from age 12 to 77. Dissertation Van Gorcum, Assen, The Netherlands.), ranging from 1 to 7 (7 being highest).
Mann–Whitney U test.
Post-traumatic amnesia was documented for 95% of the PTC-absent patients.
ANCOVA with covariates age and education level.
ANCOVA, analysis of covariance; GCS, Glasgow Coma Score; HC, healthy controls; PTC, post-traumatic complaints; RALVT, Rey Auditory Verbal Learning Test; TMT, Trail Making test.
Group differences in global network measures
In Figure 2, global measures are depicted across thresholds for the two patient subgroups and HC. There were no differences in AUC values between patients with mTBI and HC. Significantly lower AUC values were found in PTC-absent patients than in PTC-present patients for Eglob (p uncorrected = 0.0074; p FDR = 0.0258; CL = 0.71) and Eloc (p uncorr. = 0.0129; p FDR = 0.0258; CL = 0.69). A trend was found toward higher values of γ in PTC-absent patients (p uncorr. = 0.08; CL = 0.36). Regarding Q, AUC values did not differ significantly between patient subgroups (p uncorr. = 0.45). Differences were not found for any of the global measures when comparing patient subgroups separately with HC.

Global network measures across density thresholds for patients with (PTC-present) and without (PTC-absent) post-traumatic complaints, and healthy controls (HC).
Secondary analyses showed no significant differences between male and female patients in the PTC-present group for AUC values of Eglob and Eloc. Further, no differences were found between patients with and without microhemorrhagic lesions.
Group differences in local network measures
Regarding most of the local measures, no significant differences were present between patients with mTBI and HC, or between patient subgroups. However, AUC values for EC i of the left temporal pole were found to be significantly lower in both the total group of patients with mTBI (p uncorr. = 0.0001; p FDR = 0.0085; CL = 0.31) and the PTC-present subgroup separately (p uncorr. = 0.0002; p FDR = 0.0170; CL = 0.3) compared with HC (Fig. 3). A trend towards lower EC i of the orbital part of the left inferior frontal gyrus was found in mTBI patients compared with HC (p uncorr. = 0.0013, p FDR = 0.055; CL = 0.3).
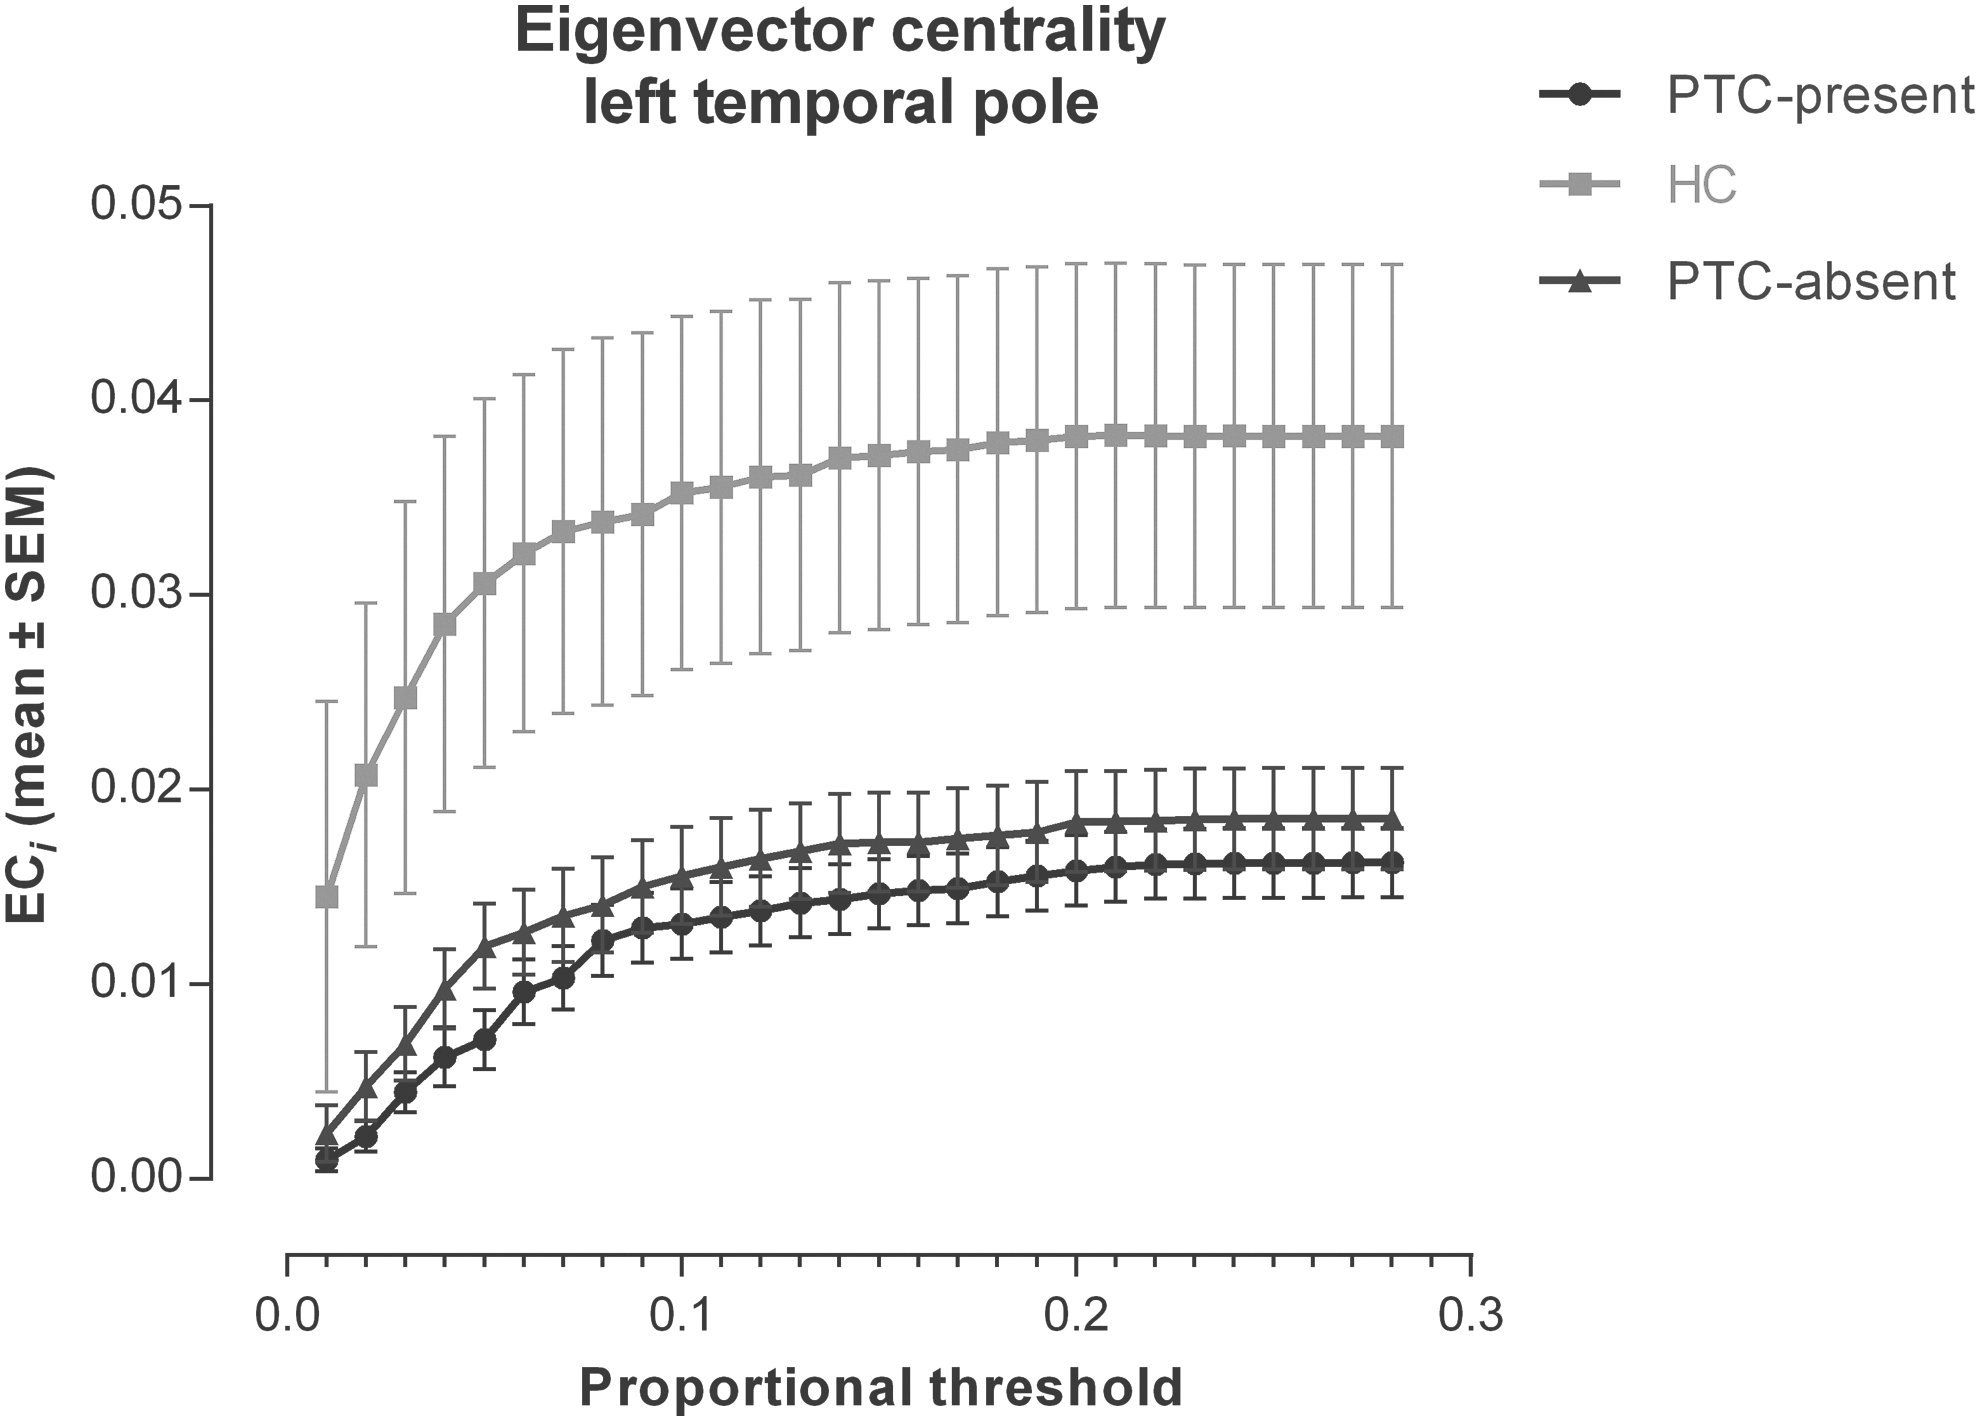
Eigenvector centrality of the left temporal pole across density thresholds in healthy controls (HC) and patients with (PTC-present) and without (PTC-absent) complaints.
No differences in local measures were found between patients with and without microhemorrhagic lesions.
Associations between graph measures and neuropsychological tests
Within the mTBI group there was a partial correlation observed at trend level between higher γ values and higher TMT-A scores corrected for age and education level (ρ = 0.31, p uncorr. = 0.05; p FDR = 0.22). In other words, lower network clustering corresponded higher processing speed. Regarding local measures in the mTBI group, there was a significant negative partial correlation between BC i values of the opercular part of the left inferior frontal gyrus and immediate recall scores on the RAVLT (ρ = −0.57, p uncorr. = 0.0001; p FDR = 0.006); and between BC i values of left superior temporal gyrus and delayed recall scores on the RAVLT (ρ = −0.49, p uncorr.. = 0.002; p FDR = 0.03). Thus, higher betweenness centrality of these nodes corresponded with lower memory performance.
Discussion
This is the first study that has applied graph theory analysis to structural networks (reconstructed from DWI data) in a large sample of adult patients with uncomplicated mTBI. Global measures were similar when comparing the total mTBI group with HC. Within the mTBI group, PTC-absent patients had lower global measures (Eglob and Eloc) than PTC-present patients. For local measures, lower eigenvector centrality within the left temporal pole was found in patients with mTBI compared with HC, possibly reflecting temporal lobe injury. Neuropsychological performance was similar for patients with mTBI and HC. Nevertheless, in patients with mTBI, a trend was found toward a relationship between lower network clustering and higher processing speed, and this finding was associated with post-traumatic complaints. More specifically, our findings might indicate a (compensatory) shift toward a more random network configuration in PTC-present patients, possibly facilitating faster information transfer throughout the network. Additionally, higher betweenness centrality of areas involved in language processing was related to poorer memory performance, which may suggest a possible compensatory role for language hubs in patients with post-mTBI memory problems.
The use of graph theory to study structural brain networks obtained from DWI has increased rapidly over the past few years in the field of TBI as well. Studies have reported differences in various graph measures between patients with chronic moderate to severe TBI and HC, showing that lower global efficiency and centrality values were associated with worse cognitive performance. 24 –26 These studies suggest that changes in structural network configuration may explain deficits following more severe TBI. To date, only one study has investigated the structural connectome in adult patients with mTBI using network-based statistics. 30 In this study, whole brain structural connectivity (number of streamlines) was found to be similar for both patients with acute mTBI (with on average three symptoms) and HC. In the present study, several graph measures were compared between patients with mTBI and HC, which to our knowledge was done here for the first time. One local measure, namely eigenvector centrality of the left temporal pole, was lower in patients with mTBI than in HC. Eigenvector centrality is a self-referential measure that reflects the level of importance (hub status) of the neighbors of a node. This could mean that connectivity of hub nodes adjacent to the temporal pole was disturbed in patients with mTBI, which can be explained given the vulnerability of this area to TBI. 65 Although eigenvector centrality of other vulnerable areas, such as the frontal lobes, was similar for patients and HC, we did find a trend toward lower eigenvector centrality of the left inferior frontal gyrus in the mTBI group. In patients with moderate to severe TBI, reduced eigenvector centrality of hub regions, such as the cingulate cortex, has been reported. 25 However, this was not found in the current study. Moreover, global measures were also similar in the total group of patients with mTBI and HC, which might indicate that mTBI causes minor local network changes that do not affect global network functioning. Another possible explanation for these findings may be the time interval between injury and scanning, which in the current study was ∼30 days. A study by Yuan and coworkers has shown that global efficiency of structural networks in children and adolescents with mTBI (within 96 h post-injury) was lower compared with HC, which may suggest that changes in structural networks are more prominent in the acute phase. 29 However, it also has to be taken into account that the brains of young patients with mTBI may be more vulnerable to injury than those of adult patients, considering ongoing developmental processes. 66
Recent studies using non-graph theory methods on DTI data did not demonstrate differences between adult patients with and without complaints in the acute and subacute stages after mTBI. 11 –13 The present study showed that, using CSD tractography and graph theory, it is possible to discern differences in structural network connectivity between patients with and without post-traumatic complaints in the subacute phase post-mTBI. PTC-absent patients had lower values on global measures of network integration (Eglob) and segregation (Eloc) than PTC-present patients, although local measures did not differ. Contrary to our results, a recent study has shown that reduced frontal structural network connectivity (number of streamlines) was associated with higher levels of symptoms reported acutely after mTBI. 30 Moreover, one graph theoretical study on functional networks showed only a relationship between local graph measures of frontotemporal regions and post-traumatic complaints in mTBI, without any significant findings regarding global measures. 27 Remarkably, our findings also demonstrated that network measures in both PTC-present and PTC-absent patients did not differ significantly from those of HC, which might imply that the injury itself does not cause major perturbations in the structural network in patients with mTBI. An exciting idea is that differences in structural connectivity may be related to pre/non-injury-related factors, such as personality characteristics, which may explain differences in susceptibility to developing (persistent) complaints. In healthy subjects, for example, it has been demonstrated that a more random functional network in terms of higher global efficiency was related to higher scores on a neuroticism questionnaire. 67 As it was found that PTC-present patients had higher global efficiency than PTC-absent patients, it could be hypothesized that neuroticism also plays a role in developing complaints after mTBI.
Although several cognitive complaints were reported by patients with mTBI, performance scores on neuropsychological tests at follow-up fell within the normal range, which is consistent with the existing literature. 6,68,69 Mental fatigue is commonly reported after mTBI, also in the current patient sample, and this complaint has been found to be related to processing speed in patients with acute and chronic mTBI. 70,71 In the present study, a trend was found toward a moderate correlation between better (faster) performance on the TMT-A and lower network clustering in the group of mTBI patients, which might be reflective of an early compensatory process to ensure adequate cognitive performance in the long term. Interestingly, PTC-present patients performed better on the TMT-A than PTC-absent patients, which might be related to (compensatory) increased mental effort and subsequent mental fatigue. Our results also show a trend toward lower network clustering in PTC-present patients, compared with PTC-absent patients. Although speculative, these findings may complement fMRI studies that have found higher activation during working memory processing in patients with mTBI compared with HC, which was also thought to be associated with enhanced mental effort to maintain normal task performance. 72,73 In addition, we found a significant association between lower scores on a verbal memory task and higher BC i of language areas in the left hemisphere, which might also reflect a compensatory process via increased usage of the phonological loop in patients with mTBI. 74 Perhaps more important, hub status of these nodes appears to be predictive of memory processing at follow-up. Further studies are required to elucidate the association between structural networks and cognitive outcome after mTBI.
Most of the DTI studies on mTBI so far have used voxel-based or ROI analyses and none have used graph theory. A systematic review of the literature has shown that results of these studies vary significantly regarding the presence or absence of diffusion abnormalities, direction (e.g., increased or decreased FA or MD) and anatomical location of abnormalities, and associations with neuropsychiatric complaints in patients with mTBI. 10 The authors report that these mixed results may be partly attributed to the heterogeneous nature of mTBI itself and of patient samples included in these studies (e.g., number of patients, injury severity, and time post-injury). Further, they found that data acquisition parameters are of influence. For example, a low number of diffusion weighted images (<20) may lead to more variable results. The current study has several methodological strengths that deal with these concerns. First, in comparison with several other studies, sufficient sample size was used and attempts were made to reduce heterogeneity (e.g., matching injury-to-scanning intervals of mTBI subgroups). Second, a high number of diffusion weighted images was acquired (i.e., 60). Third, whereas many studies so far have used DTI tractography, here, CSD tractography was used, which is capable of identifying crossing fiber tracts, resulting in fewer “false negative tracts.” 58
There are also some limitations that should be mentioned. First, the b-value applied (1000 sec/mm2) in the present study is relatively low for CSD, in which higher b-values are able to resolve crossing fibers at even lower angles. Second, readers should not delude themselves that by weighting the connectivity matrices for streamline count, the number of axons was directly investigated (which could be considered a measure of white matter connection strength). The number of streamlines can be affected by a multitude of uninteresting and biologically irrelevant factors in addition to the actual number of underlying axons/tracts. 75,76 Rather, streamline sets were constructed in the diffusion field, of which it is known that “false positive tracts” (i.e., streamlines that were found, but should not have been reconstructed if it were for the underlying white matter) and “false negative tracts” are present in addition to “true positive tracts,” leading to the proper conclusion that we were at best investigating indirect measures of connection strength. Nevertheless, it has been shown that within-subject similarity of diffusion tractography network measures is higher than between-subject similarity; 77 therefore, current findings are probably reflective of various biological processes. To date, no other methods have been developed that come near the method of diffusion tractography regarding the reconstruction of “fiber tracts” in vivo, especially when it comes to whole brain connectivity. Third, there is no consensus regarding many of the choices that have to be made with (DWI) graph analysis (e.g. regarding parcellation of the brain, selection of streamlines that pass through or end in an ROI, normalization of weighted matrices, graph thresholding, and multiple comparison correction 32,78 ), and results may vary accordingly. Fourth, imaging was performed in the subacute phase post-injury only, and not acutely after injury as well. Therefore, we were not able to determine whether our findings (also) reflected possible compensatory processes to acute injury. Lastly, although the current study provides novel perspectives on mTBI, replication studies are needed to demonstrate the reliability of our findings.
Conclusion
In conclusion, this study has demonstrated relatively minor differences in graph properties of the structural connectome in patients with uncomplicated mTBI when compared with HC. Interestingly, within the mTBI group, values of global and local efficiency were lower in PTC-absent patients than in PTC-present patients, whereas both patient subgroups did not differ from HC. Possible indications were found for early compensatory mechanisms in patients with mTBI involving network clustering and betweenness centrality of language areas, to ensure adequate cognitive performance at follow-up. Diffusion weighted structural graph analysis in neuroscience is still in its infancy; however, it is a promising tool in further disentangling the role of structural injury in uncomplicated mTBI, possibly leading to clinically relevant clues for future diagnostics and treatment of patients with mTBI.
Footnotes
Acknowledgments
This study was funded by the Dutch Brain Foundation (grant no. Ps2012-06). The authors thank Dr. Jan Cees de Groot for his assistance in assessing clinical MRI sequences, and Robert Harris for proofreading the manuscript.
Author Disclosure Statement
No competing financial interests exist.
References
Supplementary Material
Please find the following supplemental material available below.
For Open Access articles published under a Creative Commons License, all supplemental material carries the same license as the article it is associated with.
For non-Open Access articles published, all supplemental material carries a non-exclusive license, and permission requests for re-use of supplemental material or any part of supplemental material shall be sent directly to the copyright owner as specified in the copyright notice associated with the article.