
Abstract
Post-concussion impairments may result in unsafe driving performance, but little research is available to guide consensus on when concussed individuals should return to driving. The purpose of this study was to compare driving performance between individuals with and without a concussion and to explore relationships between neuropsychological and driving performance. Fourteen participants with concussion (age 20.2 ± 0.9 years old) and 14 non-concussed age- and driving experience–matched controls (age 20.4 ± 1.1 years old) completed a graded symptom checklist, a brief neuropsychological exam, and a 20.5 km driving simulation task. Participants with a concussion completed driving simulation within 48 h of becoming asymptomatic (15.9 ± 9.0 days post-concussion). One-way analyses of variance were used to compare total number of crashes, tickets, and lane excursions, as well as standard deviation of lateral position (SDLP) and standard deviation of speed. Pearson's correlations were conducted to explore the relationship between the neuropsychological and driving performance separately by group (α = 0.05). Participants with a concussion committed more frequent lane excursions (concussed 10.9 ± 4.5; controls 7.4 ± 2.4; p = 0.017) and exhibited greater SDLP, compared with controls, during the first curve (concussed 45.7 ± 21.3 cm, controls 27.4 ± 6.1 cm; p = 0.030) and final curve (concussed 39.6 ± 24.4 cm; controls 33.5 ± 21.3 cm; p = 0.036). Poorer performance on symbol digit modalities (r = −0.54), Rey Osterrieth Complex Figure (r = −0.53), verbal memory (r = −0.77), and motor speed (r = −0.54) were correlated with more frequent lane excursions in the concussed group, but not in the control group. Despite being asymptomatic, concussed participants exhibited poorer vehicle control, especially when navigating curves. Driving impairments may persist beyond when individuals with a concussion have returned to driving. Our study provides preliminary guidance regarding which neuropsychological functions may best indicate driving impairment following concussion.
Introduction
C
Concussion-related symptoms typically resolve within 7 days following injury. 3,5 However, 26% of individuals with a concussion continue to experience neuropsychological deficits once asymptomatic (i.e., following symptom resolution). 5 Because symptom resolution causes individuals with a concussion to perceive that they have fully recovered from their injury, they often are unaware of their deficits and may feel that they are ready to return to driving. It seems likely that neuropsychological deficits would negatively affect an individual's ability to drive. However, there is little research available to guide consensus on when individuals who sustain a concussion should return to driving. In fact, consensus statements regarding concussion address return to sport and return to school, but do not address return to driving. 6 Driving in an impaired state carries serious consequences that may affect both the individual with a concussion and others on the road.
Driving is a highly complicated activity that requires the timely interaction of visual, motor, and cognitive skills to adequately respond to a dynamic, constantly changing environment. 7 Driving impairments are well documented in populations with less subtle neurological disorders, such as moderate and severe traumatic brain injury, Alzheimer's disease, Parkinson's disease, and various other neurological conditions, 8 –13 but little is known about how mild neurological impairments, such as concussion, influence driving performance. Although it makes intuitive sense to restrict or reduce driving following concussion, only 48% of individuals intend to reduce their driving at any point after sustaining a concussion. 14 Research has shown that patients assessed within 24 h following concussion are slower to identify hazards within their field of view while driving. 15 Individuals with a history of concussion have greater risk of collision, 16 but do not differ in hazard detection. 17 Combined, these studies suggest that driving performance is impaired following concussion, but driving impairments likely eventually resolve. However, it seems likely that a concussed individual will return to driving before or once they perceive that they have recovered. 15
The primary purpose of this study was to compare driving performance between individuals with a concussion and non-concussed matched controls. Driving performance was assessed within 48 h following symptom resolution because this is the most likely time at which a concussed individual would return to driving. We hypothesized that individuals who have sustained a concussion would perform worse on a driving test, compared with non-concussed matched controls. We also aimed to determine if neuropsychological performances correlated with simulated driving performances among individuals with a concussion and non-concussed matched controls.
Methods
Fourteen individuals with a concussion between 18 and 25 years old and 14 controls individually matched for age, gender, and years of driving experience (Table 1) completed an institutional review board–approved informed consent, a demographic form, graded symptom checklist, driving simulation, and neuropsychological exam. All participants were of driving age and had not sustained more than three previous self-reported concussions. 18 All but two participants possessed a class C driver's license. One concussed participant possessed a class B commercial driver's license, so we recruited a matched control with the same license type and occupation (bus driver). Any participant who reported a history of other major neurological disorders/injury, current use of any medications that evokes drowsiness, or heavy use of alcohol/drugs was excluded. Participants in the concussed group were diagnosed with a concussion by a healthcare professional using the criteria outlined by the 2013 Consensus Statement on Concussion in Sport 6 and completed testing within 48 h of experiencing symptom resolution. Concussed participants were recruited during their initial evaluation provided by our clinical research laboratory and included both Division I collegiate athletes and college students. The concussed group consisted of two collegiate athletes referred by the athletic association and 13 college students referred by the University Health Center. Participants in the non-concussed group were required to have no history of a concussion within the past 24 months. Control participants were recruited using flyers posted on campus. All participants were provided with a small monetary compensation for their time.
Significant difference.
SD, standard deviation.
Graded symptom checklist
The graded symptom checklist is a 7-point Likert scale grading system that was used to confirm that all participants had experienced symptom resolution prior to data collection. 19 We administered the graded symptom checklist to both concussed and non-concussed participants to assess whether they experience 18 concussion-related symptoms on a regular basis (defined as three or more times per week) prior to the assessment. 20 An investigator (JDS, NLH) read the list of symptoms and the participant verbally graded each symptom on a scale of 0 to 6, where 1 to 2 means that the symptom is mild, 3 to 4 means that the symptom is moderate, 5 to 6 means that the symptom is severe, and 0 means that they do not experience the symptom more than three times per week. We then administered the graded symptom checklist again to determine how each participant was currently feeling (defined as within the past 48 h). We calculated the total symptom score on a regular basis and at the assessment time by summing the responses across all of the symptoms (max = 108; Table 2). All participants were deemed asymptomatic based on our criteria that their total symptom score for how they were currently feeling was less than 10 points greater than their total symptom score for how they felt on a regular basis. 19
Lower score indicates better performance.
ROCF: Rey Osterrieth Complex Figure.
Driving performance
Performance during driving a desktop simulator that was powered on STISIM drive software, version 3 (STI Inc., Hawthorne, CA) was used a measure of driving ability. Images from the simulator were projected on three 25″ screens (145° of horizontal field of view). Participants used a Logitech steering wheel and two pedals to navigate through the scenarios (Fig. 1). All participants first completed a 5-min familiarization program to get acquainted with the driving simulator scenarios and tasks and to reduce simulator discomfort. Participants then completed a 20.5 km driving simulation task involving daily-life traffic in urban, suburban, and rural areas (Fig. 2). This evaluation scenario comprised driving on straight and curvy (three curves: left/smooth, right/smooth, left/sharp) two-lane and four-lane roads, overtaking, speed adaptations, and stopping at crosswalks and red lights. Within the 20.5 km drive, events such as a child suddenly crossing the street, a car suddenly pulling out, or oncoming vehicles drifting in the driver's lane, were used to evaluate hazard perception and emergency brake responses. Computer-generated outcome variables for the whole simulation drive included total number of crashes, tickets, and lane excursions (center line crossings and road edge excursions). For each segment of the drive, we also collected sensitive data of vehicle control and risk of crashes, such as SDLP and standard deviation of speed. 21 SDLP is a measure of lateral vehicle control and reflects the amount of weaving of the car. Standard deviation of speed is a measure of longitudinal vehicle control and refers to the variability in speed. These variables were collected at 60 Hz. We administered the driving simulator sickness questionnaire 22 following the driving simulation familiarization and evaluation scenarios to monitor symptoms of the simulator adaptation syndrome, but no participants experienced discomfort during the driving simulation.

Driving simulator equipment and set-up.
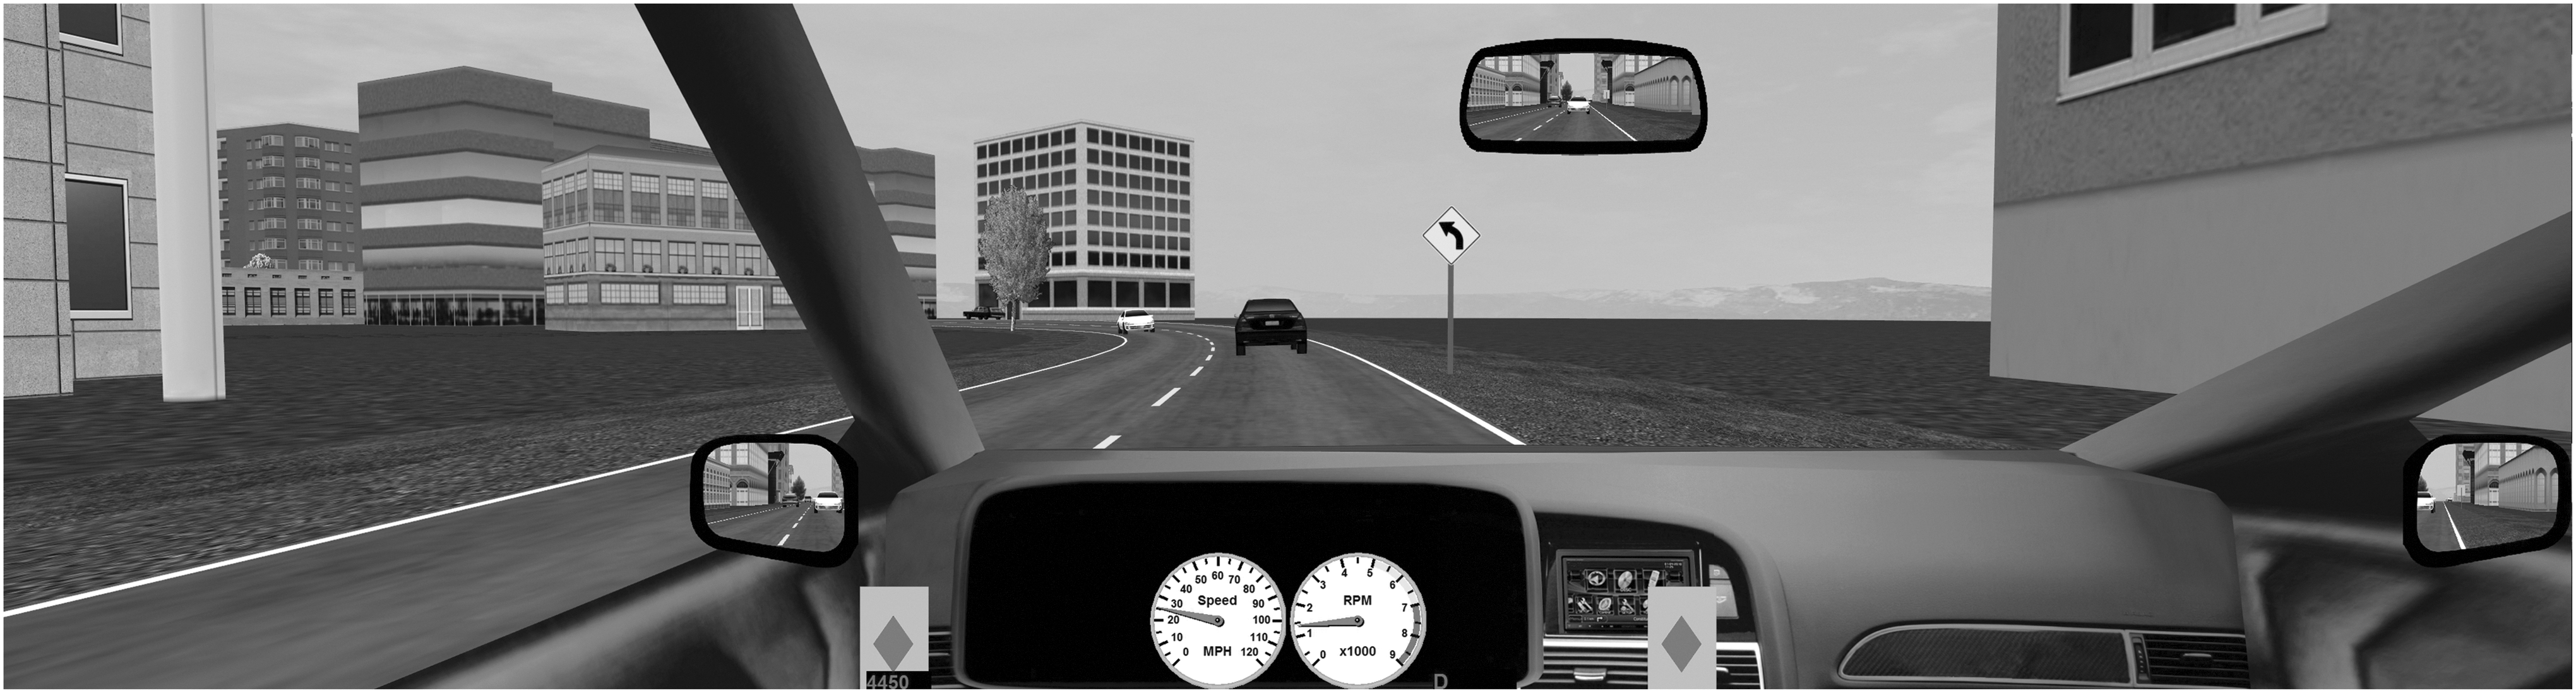
Example driving simulator scenario.
Neuropsychological assessment
Each participant completed a brief neuropsychological evaluation (counterbalanced with Driving Simulator Assessment) administered by an experienced researcher (JDS, NLH). These assessments were chosen because they are widely used and representative of a comprehensive battery of neuropsychological functions. Assessment order was randomized.
Trails Making Test. 17
Participants completed the Trail Making Tests A and B to assess visual tracking and task switching. In Trails A, participants were instructed to connect 25 circles in ascending order. Trails B consists of circles that include both numbers (1–13) and letters (A-L). The participant drew a line to connect the circles in an ascending, but alternating pattern (i.e., 1-A-2-B-3-C, etc.). Investigators recorded the total time in seconds to complete Trails A and B
Symbol digit modalities test. 17
Participants completed the symbol digit modalities test to evaluate attention, working memory, and psychomotor speed. The participant viewed a reference key that consists of a grid of nine symbols each numbered 1 through 9. A blank grid was presented under the key where the symbols were present, but the corresponding numbers were not. The participant had 90 sec to fill in as many numbers as possible. The investigator recorded the number of correct responses
Rey Osterrieth Complex Figure (ROCF) copy and recall. 18
Participants completed the ROCF to evaluate visuo-spatial ability and visuo-constructive skills. Participants were asked to reproduce the ROCF to the best of their ability. The investigator recorded the time to complete the copy of the ROCF. Five minutes after completion of the copy test, the participants were asked to reproduce the ROCF from memory. The investigators scored for the accuracy and placement of 18 specific design elements.
Mental Rotation Task (Fig. 3). 19,20

Example mental rotation image (rotated).
Participants completed a mental rotation experiment using the online psychology laboratory (Cognition Laboratory Experiments) via Hanover College. 23 During the mental rotation test, participants compared two three-dimensional objects to determine whether they are the same image or if they are mirror images. The test had pairs of images each rotated either 0°, 60°, 120°, or 180°. Some pairs were the same image rotated, and others were mirrored. Participants were shown 70 same and mirrored pairs and were judged on how accurately and rapidly they distinguished between pairs.
Computerized neuropsychological evaluation. 24
Participants completed CNS Vital Signs, which includes the following subtests: verbal memory, visual memory, finger tapping, symbol digit coding, Stroop test, shifting attention, and continuous performance. Domains examined included verbal memory, visual memory, psychomotor speed, reaction time, complex attention, cognitive flexibility, processing speed, executive function, simple attention, and motor speed. Neuropsychological outcome measures that exceeded 1.5 times the interquartile range were deemed outliers and excluded from corresponding analyses. 25
Statistical analyses
To address our primary purpose, one-way analyses of variance were used to compare differences between groups in total symptom scores, neuropsychological performance, and simulated driving performance after checking the normal distribution of data by Shapiro Wilk test (α = 0.05). Dependent variables included the following outcome measures: total symptom score, Trails A/B time, symbol digit modalities number correct responses, ROCF time and accuracy, mental rotation time and accuracy, verbal memory, visual memory, psychomotor speed, reaction time, complex attention, cognitive flexibility, processing speed, executive function, simple attention, and motor speed, as well as the following driving performance measures: total number of crashes, tickets, and lane excursions. We also compared standard deviation of lateral position (SDLP) and standard deviation of speed throughout simulation subsections. Pearson's correlations were conducted to explore the relationship between the neuropsychological and driving performance variables separately for the concussed and control group (α = 0.05). Correlations were considered to be weak below 0.10, moderate between 0.10 and 0.49, and strong between 0.50 and 1.00. 26
Results
Descriptive and statistical results for demographic and driving performance variable comparisons are presented in Table 1. Descriptive and statistical results for graded symptom checklist and neuropsychological assessment variable comparisons are presented in Table 2. Concussed and control participants did not differ on any demographic variable total symptom scores or any neuropsychological assessment (p > 0.05).
Concussed participants committed more frequent lane excursions, compared with controls (concussed 10.9 ± 4.5; controls 7.4 ± 2.4; p = 0.017), but did not differ in total crashes or tickets (Table 1). Further analyses revealed that individuals with a concussion committed more road edge excursions, but not centerline crossings, compared with controls. Concussed participants exhibited greater SDLP than controls during the first smooth left (concussed 0.46 ± 0.21 m; controls 0.27 ± 0.06 m; p = 0.030) and final sharp left curves (concussed 0.40 ± 0.24 m; controls 0.34 ± 0.21 m; p = 0.036), but not the second smooth right curve. Concussed participants also exhibited greater standard deviation of speed maintenance in the final left curve of the simulation, compared with controls (concussed 9.00 ± 2.30 km/h; controls 6.14 ± 1.87 km/h; p = 0.036). Concussed and control participants did not differ on any other driving simulation outcomes.
All significant correlations for the concussed and control group are presented in Table 3. We observed several strong (r > 0.50) and significant correlations between neuropsychological assessments and driving performance among both the concussed and control group (Table 3). Most notably, we found that poorer performance on symbol digit modalities (r = −0.54), ROCF accuracy (r = −0.53), and the CNS Vital Signs verbal memory (r = −0.77) and motor speed (r = −0.54) domains were significantly correlated with committing more frequent lane excursions among the concussed group, but not the control group. Slower ROCF recall time was significantly correlated with total crashes (r = 0.72) among the concussed group, but not the control group. Concussed participants with worse performance on CNS Vital signs cognitive flexibility (r = −0.60) and executive function (r = −0.61) received more total tickets. Fewer correlations were found between neuropsychological variables and simulated driving performance in the control group (Table 3).
Indicates that a higher values represents poorer performance.
(+)When test performance decreased, driving performance declined.
(−)When test performance decreased, driving performance improved.
ROCF, Rey Osterrieth Complex Figure; SDMT, Symbol Digit Modalities Test; N.S., not significant.
Discussion
Despite being considered asymptomatic, individuals who had sustained a concussion presented with poorer driving performance, compared with non-concussed matched controls. We also observed several correlations between driving performance and neuropsychological assessments among the concussed group that were not observed among the control groups, providing preliminary results that may help guide future research efforts aimed at developing a comprehensive driving evaluation for individuals with a concussion.
Asymptomatic participants with a concussion were less able to center the vehicle in the lane, especially when navigating curves, resulting in 32% more lane excursions (concussed 10.9 ± 4.5; controls 7.4 ± 2.4). Further analysis revealed that individuals with a concussion more frequently crossed the road edge (right side), but not the center line. Excursions into the road shoulder are less likely to have safety consequences because no traffic is typically present on the road shoulder. Though the differences in lane excursions suggest that concussion affects driving performance, lane excursions alone do not seem to contribute significantly to the understanding of driving impairment and crash risk. 27 However, lane position variance (SDLP) increments as a result of driving under the influence of drugs and alcohol studies show very strong associations with motor vehicle crashes. 28 Lane position variance is also a sensitive measure of vehicle control to detect driving difficulties in patients with neurological conditions, including Parkinson's disease, 29 traumatic brain injury, 30 and multiple sclerosis. 31 The difference in average SDLP values between the concussed and control groups ranged between 0.06 m for the smooth left curve and 0.19 m for the sharp left curve. These SDLP differences are similar to those found in Parkinson disease (between 0.06 m and 0.13 m), 10 traumatic brain injury (between 0.20 and 0.25 m), 30 and multiple sclerosis (0.52). 31 These results suggest that drivers with asymptomatic concussion may (temporarily) exhibit similar driving difficulties, compared with drivers with other neurological conditions. However, direct comparison with other studies warrants caution since SDLP greatly depends on the type of simulator used, the speed, and design of the driving simulator scenarios.
Similarly, standard deviation of speed is an important measure of driving safety. 32 Unlike in our study, Neyens and colleagues did not find significant differences in standard deviation of speed between patients with mild traumatic brain injury and controls during a coin sorting task. 33 Difficulties experienced with vehicle control emerged particularly while navigating left curves. Competent drivers take a left curve by slowing down while approaching the curve near the road edge, drive nearer to the midline of the lane during the middle stretch of the curve, and exit the curve closer to the road edge while gradually speeding up. 34 The concussed group showed more variability in speed adaptation and tended to drive closer to the road edge when compared with the non-concussed group. Further research is needed to determine whether impairments in lateral and longitudinal vehicle control following concussion predispose individuals with a concussion to motor vehicle crashes.
The results of this study raise two pertinent questions: 1) Do the observed impairments on simulated driving mean that driving should be restricted following concussion? and 2) If so, how should readiness to return to driving be determined? We found that driving impairments persist throughout the full duration of concussion symptom recovery. Recommendations regarding readiness to return to driving following concussion are greatly needed, particularly because most individuals with a concussion and medical providers underestimate the need to restrict driving. 14 Only 29% of general practitioners and emergency departments routinely give advice about when a person should return to driving. 35 Among those who do provide recommendations, most suggest waiting at least 24 h and others leave the decision to return to driving up to the patient's discretion. 35 Consensus statements regarding concussion do not address return to driving. 6,36 Further investigation will be necessary to determine the time-point at which individuals with a concussion should return to driving and what assessment comprise the best evaluation of fitness to drive in populations that sustain concussion.
The observed differences between groups suggest that concussed individual may have lingering subclinical neuropsychological and motor impairments that influence their driving performance at a time-point when they are considered asymptomatic. A comprehensive driving evaluation is needed to ensure fitness to drive among individuals with a concussion, but evidence concerning methods used to determine fitness to drive following concussion is lacking. 37 Our study provides preliminary guidance regarding which neuropsychological functions may best indicate continued driving impairment following concussion. Poorer attention, working memory, psychomotor speed, visuo-spatial ability, visuo-constructive skills, cognitive flexibility, executive function, verbal memory, and motor speed were all associated with poorer measures of driving performance among the concussed group, but not the control group. Previous studies suggest that these measures also are sensitive to driving impairments in patient populations with other neurological conditions. 38,39 The significant correlations between neuropsychological performances and driving performances in the concussed group and the lack of significant correlations in the control group may be partly explained by a greater heterogeneity (higher standard deviation in most of tests) in the concussed group than in the control group. These results provide a starting point to guide further research ultimately aimed at providing clinicians tools to guide driving recommendations based on neuropsychological performance.
Neuropsychological measures, such as those identified in our current study, may help to identify those who need to undergo further on-road testing. On-road driving studies or naturalistic driving studies can also help identify the problems individuals with concussion experience on the road. Many of the observed neuropsychological domains were those assessed using a computerized neuropsychological assessment commonly used for concussion assessment. Though computerized administrations of neuropsychological assessments have shortcomings, it is promising that a tool that is already widely used for concussion assessment may be useful for guiding recommendations for driving following concussion.
This study is not without limitations. We utilized a small sample size of 28 college-aged individuals. Sustaining a concussion may influence driving performance differently in other age groups. Though driving simulation has been validated as an effective means of evaluating driving abilities, 40 on-road driving performance may differ. Future studies should consider evaluating driving following concussion using on-road driving tests. We chose to assess driving performance within 48 h following symptom resolution because this is the most likely time at which a concussed individual would return to driving; however, symptom resolution does not equate to full concussion recovery. Future studies are needed to track driving performance further out from symptom resolution. We also did not assess whether participants with a concussion were at greater risk of being involved in a motor vehicle crash.
Conclusion
Despite being asymptomatic, concussed participants exhibited poor vehicle control, especially when navigating curves. These results suggest that driving impairments may persist beyond when individuals with a concussion have returned to normal driving. A comprehensive driving evaluation is needed to ensure fitness to drive among individuals with a concussion and our study provides guidance regarding which neuropsychological functions may best indicate continued driving impairment following concussion. Further research with a larger sample size is needed to determine when it is safe to return to driving following concussion.
Footnotes
Acknowledgments
This study was funded by the Office of the Vice President of Research at the University of Georgia.
Author Disclosure Statement
No competing financial interests exist.