
Abstract
A full understanding of the mechanisms behind spinal cord injury (SCI) processes requires reliable three-dimensional (3D) imaging tools for a thorough analysis of changes in angiospatial architecture. We aimed to use synchrotron radiation μCT (SRμCT) to characterize 3D temporal-spatial changes in microvasculature post-SCI. Morphometrical measurements revealed a significant decrease in vascular volume fraction, vascular bifurcation density, vascular segment density, and vascular connectivity density 1 day post-injury, followed by a gradual increase at 3, 7, and 14 days. At 1 day post-injury, SRμCT revealed an increase in vascular tortuosity (VT), which reached a plateau after 7 days and decreased slightly during the healing process. In addition, SRμCT images showed that vessels were largely concentrated in the gray matter 1 day post-injury. The maximal endothelial cell proliferation rate was detected at 7 days post-injury. The 3D morphology of the cavity appears in the spinal cord at 28 days post-injury. We describe a methodology for 3D analysis of vascular repair in SCI and reveal that endogenous revascularization occurs during the healing process. The spinal cord microvasculature configuration undergoes 3D remodeling and modification during the post-injury repair process. Examination of these processes might contribute to a full understanding of the compensatory vascular mechanisms after injury and aid in the development of novel and effective treatment for SCI.
Introduction
T
There is no effective treatment for patients with SCI, because the main mechanisms underlying the pathological process have not yet been fully elucidated. After traumatic injury, the initial physical damage disrupts the integrity of the spinal cord parenchyma, which inevitably leads to mechanical injury of the spinal cord vasculature. 5,6 Vessel injury contributes to local hypoxemia, and progressive vascular dysfunction also causes neuronal cell death, inducing secondary injury cascades after SCI. 7 –9
Previous research has demonstrated that angiogenesis does occur during the injury healing process. The newly generated vessel might also act as a scaffold and offer guidance for axonal sprouting. 10 The vasculature provides direct nutritional support to the lesion site, which is essential for the survival of the neuronal parenchyma and might play a crucial role during recovery from SCI. 11 –15 The complex vessel architectural repair and modification involved in the pathological process after SCI remain largely unknown, however.
Several studies have characterized a subset of the vascular morphological responses after SCI using different imaging methods such as histological immunostaining and visualization with a scanning electron microscope (SEM), a two-photon microscope, or three-dimensional (3D) imaging of solvent-cleared organs (3DISCO). 5,16 –19
The vasculature is known to exhibit a complex and unique 3D structure. Characterization of the normal and traumatized spinal cord microvasculature in 3D is expected to give further insight into the pathological process of SCI. Further, 3D visualization of microvasculature will also be helpful to study the therapeutic effect of certain treatments on angiogenesis after SCI.
Immunostaining destroys integrity of the specimen, and a distinct 3D architecture of spinal cord microvasculature cannot be obtained using this method. 5 Two-photon laser scanning has limitations because of low penetration depth. 17,20 SEM is incompatible with studies in living animals or intact spinal cord. 16 In addition, although methods for tissue transparency (such as 3DISCO) and transgenic mice have made it much easier to obtain accurate 3D morphological data of the vasculature from whole tissue, it is difficult to extract relevant quantitative parameters, which may hinder further development. 18,19
The recently developed microcomputed tomography (CT) is a powerful imaging technique used to differentiate the 3D anatomical structure of the vasculature within intact organs. 21 –24 Imaging methods based on the use of injected contrast agents have been applied to visualize spinal cord microvasculature, 18,25,26 but this method is constrained by its inherent physical properties. The intramedullary artery cannot be detected because of the limited resolution available with this technique.
The advent of synchrotron radiation (SR) addresses this issue and offers a brilliant light source suitable for high-resolution stereoscopic microtomography and quantitative morphometric analysis of dense vascular networks. 27 In the central nervous system, imaging of micro-structures via synchrotron radiation μCT (SRμCT) has been applied widely in the brain. 28 –34 The 3D morphology of spinal cord microvasculature before or after injury has been previously evaluate by our group. 35,36 The utility of SRμCT, however, for thorough examination of microtomography and quantification of micro-vascular changes during the healing process after SCI across multiple time points has not yet been investigated.
The purpose of this study is to characterize temporal-spatial changes in the angioarchitecture induced by acute trauma in a contusive thoracic cord SCI model using SRμCT. We hypothesized that SRμCT could effectively reveal 3D microvascular morphology in the normal and injured spinal cord. In addition, vascular morphometric parameters were used to assess the pathological changes in angioarchitecture after SCI. This study presents novel findings in characterization and quantitative analysis of 3D morphological changes in the microvasculature after SCI. The results of the current study might offer key insights into the vascular mechanisms underlying the pathological processes of SCI and aid in the development of novel therapies that target micro-vessels in the treatment of patients with SCI.
Methods
Experimental animals and ethics statement
All animal protocols were approved by the Animal Ethics Committee of Central South University, Changsha, China. Animal care and use were performed in accordance with the guidelines of the Administration Committee of Affairs Concerning Experimental Animals in Hunan Province, China. Male Sprague–Dawley (SD) rats (220–250 g) obtained from the Animal Center of Central South University were used in these experiments. All animals were housed in a temperature-controlled room with a 12-h light/dark cycle and free access to food and water and were acclimatized for at least 7 days before experimental use.
Spinal cord contusion injury model
Animals underwent acute contusive SCI using a modified Allen method, which has been described previously. 18 In brief, adult male rats were anesthetized deeply with 4% halothane and sedated during subsequent surgical procedure with 2% halothane. A laminectomy was performed carefully at the T10 vertebra level to expose the spinal cord. A modified Allen weight drop apparatus (a moderate vertical impacting load, 8 g weight at a vertical height of 4 cm, 8 g × 4 cm) was used.
Immediate intramedullary hemorrhage and edema were observed. The rat's tail swung pendulously, and both hindlimbs were retracted convulsively after the impact, indicating a successful SCI. The incision was closed using 3-0 silk threads. Penicillin G (5 wu, IM) was injected into the quadriceps femoris during the operation in each rat and subsequently once per day in both hindlimbs for 5 days. Finally, the rats were allowed to recover in their cages with free access to food and water, and their bladders were manually voided twice daily. The number of animals used in each experiment is outlined in Table 1.
SRμCT, synchrotron radiation micro-computed tomography; PCNA/RECA-1, proliferating cell nuclear antigen/anti-endothelial cells antibody.
SRμCT scanning
For SRμCT scanning, rats were euthanized at each time point and underwent the standard vascular perfusion procedure as described previously. 18,35 In brief, an abdominothoracic incision was performed rapidly to expose the heart. An obtuse cannula was inserted into the thoracic aorta via the left ventricle followed by heparinized saline perfusion to ensure the effective removal of circulating blood. Thereafter, 4% paraformaldehyde in phosphate buffered saline (PBS) (pH 7.4) was perfused for vessel network fixation. A proportional temporary mixed silicone rubber (Microfil MV-122, Flow Tech, CA) was infused into the aortic cannula by syringe (6–8 mL/min) for 5 min. 35
After the perfusion procedure, the infused animals were preserved in the refrigerator at 4°C overnight to achieve effective casting of the entire vascular system. On the following day, a 5-mm long segment of the spinal cord including the injury area was harvested and fixed in 4% paraformaldehyde in PBS. The sample was dehydrated using gradient alcohol immersion and dried at room temperature for 2 h before SRμCT scanning.
High-resolution vasculature imaging was performed at the beamline BL13W1 (the radiological imaging and biomedical application station) of the Shanghai Synchrotron Radiation Facility (SSRF) in China. A schematic depiction of the scanning is shown in Fig. 1. The sample was fixed on the sample stage, which maintained the sample location in the center of the image field of the charge-coupled device (CCD) detector. To obtain fine contrast images of the vasculature, the imaging parameters were set as outlined in Table 2.
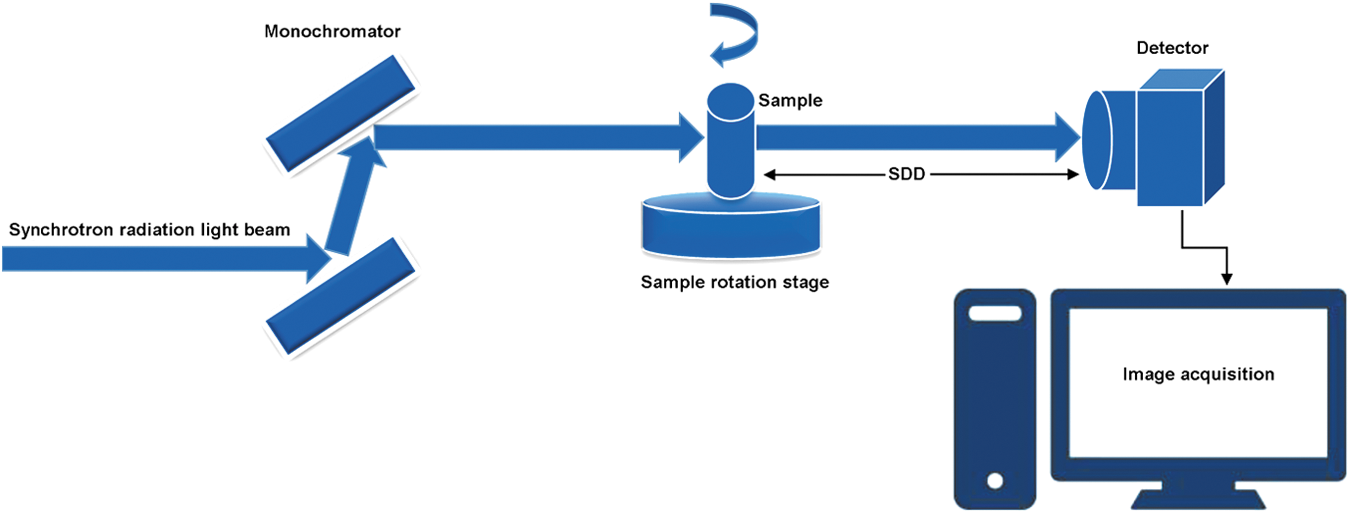
Schematic depiction of PPCT scanning at the BL13W1 biomedical beamline at the Shanghai Synchrotron Radiation Facility in China. The samples were fixed on a sample rotation stage. The inner structure was recorded by an image detector located at a 3 cm distance from the sample stage after transmission of monochromatic synchrotron radiation X-ray beam through the sample and delivery to the image acquisition system. SDD, sample-to-detector distance.
SRμCT, synchrotron radiation micro-computed tomography; CCD, charge-coupled device.
Image processing and 3D vascular quantitative analysis
Tomographic reconstructions were performed using the GPU-CT reconstruction software applied by the BL13W1 experimental station based on the filtered back projection (FBP) algorithm. 37 The 3D visualizations were acquired with Image Pro Analyser 3D software (Version 7.0, Media Cybernetics, Inc., Rockville, MD). To analyze the differences among different time points post-injury, a 5 mm length of spinal cord was selected from each group. After the vasculature was extracted from the parenchyma based on the iterative gray level threshold, the input vasculature for centerline extraction was narrowed using the voxel erosin plug-in in the Image Pro Analyser 3D software to calculate the vascular morphological parameter. 38,39 Once the centerline was extracted, the quantification parameters of the vascular network could be calculated.
Figure 2 presents a schematic graph of the vascular parameters. The vascular bifurcation points (VB) were identified initially. A vascular segment was defined as a section of the blood vessel between two vascular bifurcation points. The vascular volume fraction (VVF) represents the ratio between the voxels belonging to a vascular structure and the total number of voxels in the biological tissue. The vascular segment density (VSD) and vascular bifurcation density (VBD) were calculated as the fraction of the total number of segments and the bifurcation per selected sample volume, respectively. The vascular connectivity (VC) was defined as the maximum number of vessel branches before the vascular structure split into two portions. The vascular connectivity density (VCD) represented the average number of connections per sample selected volume.

Diagram of the vascular morphology parameters. (
The vascular tortuosity (VST) was calculated as the length of the vascular segment centerline (L2) divided by the minimum distance (L1) between the source and target bifurcation points. 39
Immunofluorescence and quantification of angiogenesis
At the time of euthanasia, the remainder of the animals were perfused as described above. Spinal cord tissue was subsequently harvested and embedded in optimal cutting temperature compound (OCT) (Sakura Finetek USA, Torrance, CA) for the collection of sections with 10-μm thickness. Sections were blocked with 10% goat serum diluted in PBS for 1 h, followed by incubation with a mouse monoclonal anti-endothelial cell antibody (RECA-1) (1:200; Abcam plc, Cambridge, UK) and a rabbit monoclonal proliferating cell nuclear antigen (PCNA) antibody (1:200; Abcam) diluted in 3% goat serum in PBS overnight at 4°C.
After washing three times in PBS, the sections were incubated with secondary Alexa Fluor 488 goat anti-rabbit immunoglobulin G (IgG) (H + L) (1:1000, Jackson, West Grove, PA) and Cy3 goat anti-mouse IgG (H + L) (1:1000, Jackson) antibodies diluted in 3% goat serum for 30 min at room temperature. The sections were washed with PBS and coverslipped with Mowiol mounting medium containing 4',6-diamidino-2-phenylindole (DAPI, Vector Laboratories, Inc., Burlingame, CA) to label the nuclei.
We selected slides with sections harvested approximately 400 μm from the injury epicenter and examined the tissues with an Olympus BX51 Microscope (Olympus America, Center Valley, PA). The cells were co-stained with PCNA/RECA-1 to reveal vessel proliferation. RECA-1 staining indicated the presence of a vessel. The numbers of positively stained cells in five random visual fields (50 μm × 50 μm) of the anterior horn of the gray matter (GM) in one spinal cord section per rat were counted in each group.
Statistical analysis
All experimental data analyses were performed using SPSS 17.0 software (University of Cambridge, UK). In all figures, data are presented as the mean ± standard deviation (SD). The data were subjected to an arcsine transformation before statistical analysis to attain a more normal distribution. For comparison of groups sampled at various distances from the injury site, we used two-way analysis of variance (ANOVA) with repeated measures, followed by the Holm-Sidak post-hoc test. For data in which only one variable after injury was analyzed, a one-way ANOVA was performed, followed by the Dunn post hoc test. Statistical significance was accepted for p values of <0.05.
Results
3D vasculature visualization and quantitative analysis of vessels
The microvasculature to the spinal cord plays a crucial role in both injury progression and the maintenance of normal functions of the spine. To detect the complex anatomical architecture of the spinal cord, contrast agents were used in capillary bed casting. The spinal cord microvascular network was visualized in high detail in all images. We routinely observed vessels with a sufficient imaging resolution of approximately 7.4 μm with synchrotron radiation (Fig. 3A).

Three-dimensional (3D) spinal cord microvasculature reconstruction and vessel quantification. (
We successfully established an effective approach for generation of high resolution 3D images derived from two-dimensional (2D) slices. Using the synchrotron radiation combined with a tomography algorithm, the 3D morphology of the relative connectivity, courses, and space nature of the vessel arrangement within the spinal cord were vividly displayed (Fig. 3B). To extract quantitative vascular parameters from the synchrotron dataset, a fully automated 3D vascular analysis algorithm was used, according to methods reported previously. 21
After the centerlines of the vasculature structures had been extracted, the trajectories and geometric morphological parameters of vascular segments, such as bifurcation and tortuosity, were obtained successfully (Fig. 3B, 3C, 3D, 3E). The ability of SR to extract vascular parameters within intact organs presents new opportunities for spinal cord vascular network characterization.
Morphology of the normal vascular network in the thoracic spinal cord
The ventral and transverse views of the arterial supply of the normal thoracic spinal cord were displayed clearly in the optimization images, and a color code indicated the different vessel thicknesses (Fig. 4A, 4C). In addition, the 3D arrangement of the extrinsic and intrinsic arteries of the spinal cord was clearly depicted and largely matched the schematic diagrams (Fig. 4B, 4D).
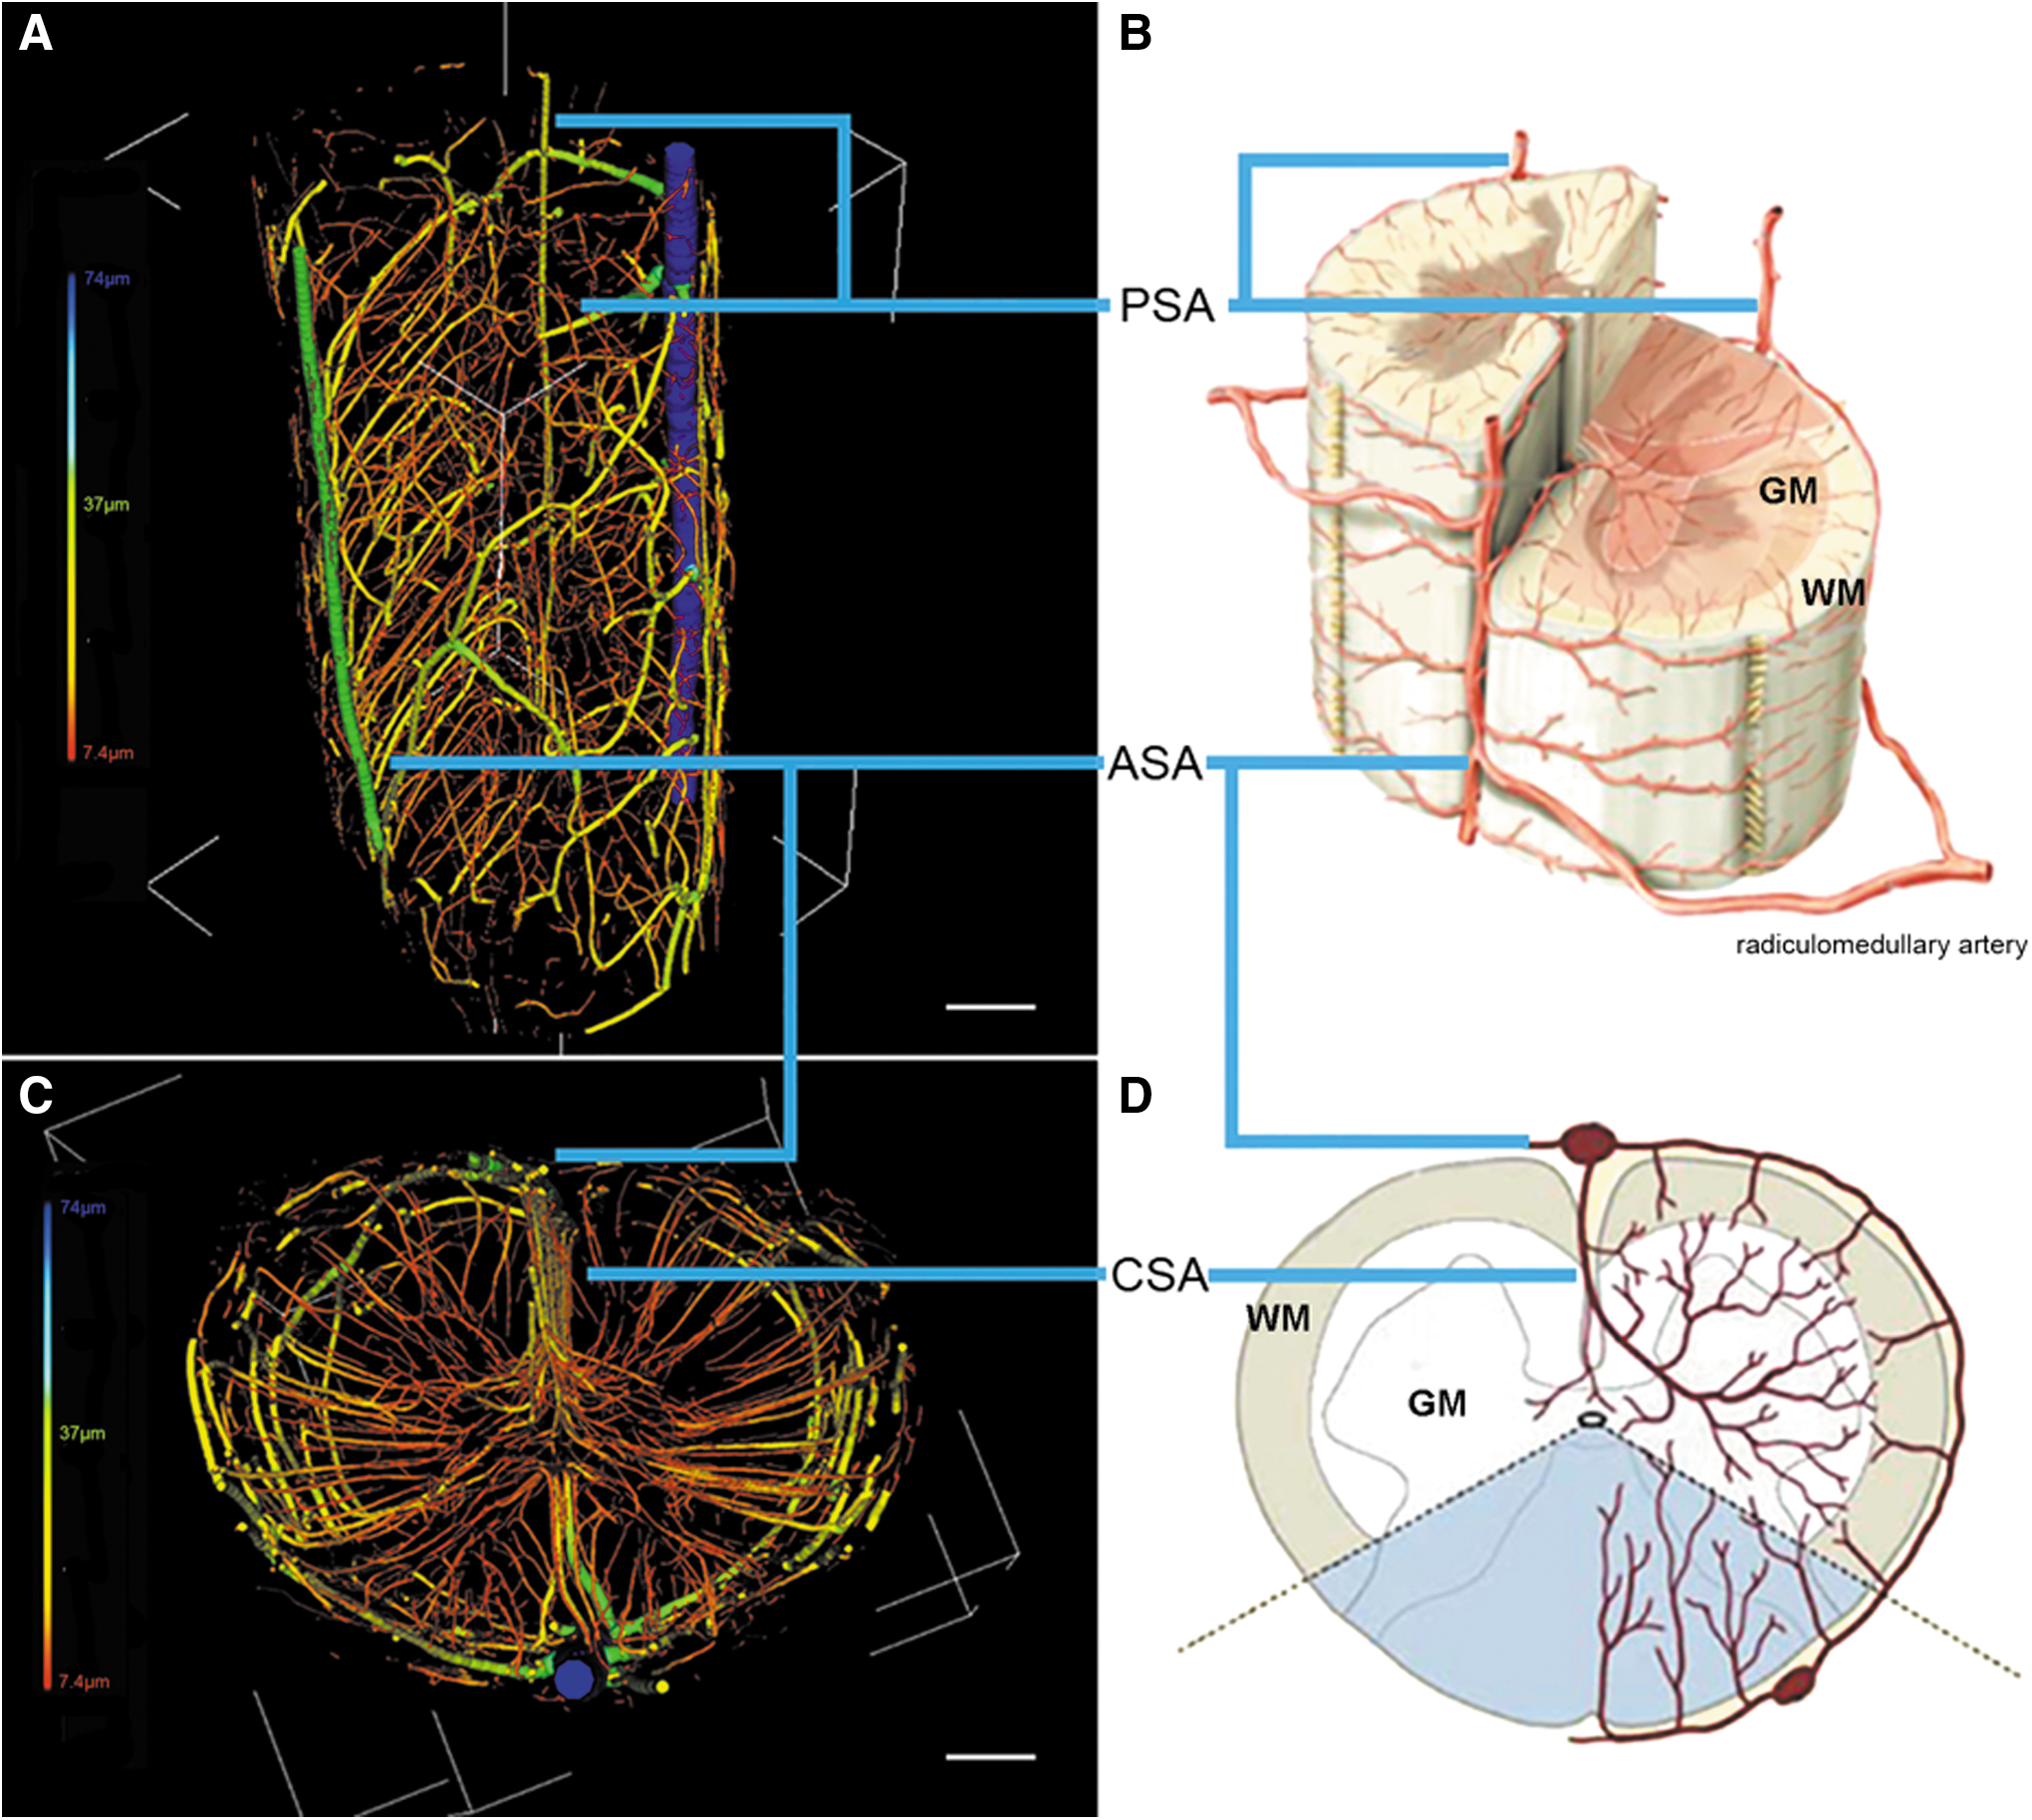
Three-dimensional digital atlas of spinal cord angioarchitecture with a schematic depiction of the normal thoracic spinal cord. (
Three longitudinal extrinsic spinal cord arteries are present, one anterior and two posterior, both arising from the radiculomedullary artery, which are the main circumferential arteries outside the spinal cord parenchyma (Fig. 4A). The intrinsic arteries within the spinal cord parenchyma can be separated into a central system and a peripheral system (Fig. 4C).
The blood flow of the central system is centrifugal, is derived from the anterior spinal artery (ASA), and supplies the central two thirds of spinal cord capillaries, including the dense capillary networks that support the spinal gray matter (GM) and the inner regions of white matter (WM). The peripheral system is a centripetal circuit that covers the spinal cord along its entire length, giving rise to perforating branches and forming an impressive anastomotic network between the anterior and posterior spinal arteries. Vessels in this circuit supply much of the posterior WM, dorsal horns, and most of the peripheral WM. The centrifugal and centripetal vascular circuits meet in a complex network of terminal capillary beds with the GM appearing as a distinctive “butterfly” shape embedded within the spinal cord. Further, the vascular network intensity appeared more abundant in the GM than in the WM.
Characterization of 3D vascular morphology before and after spinal cord injury
The trauma to the spinal cord primarily causes immediate vascular disruptions at the injury epicenter at 1 day post-injury. From the 3D synchrotron radiation images, we observe the ruptured vessels at the injury epicenter, which begins near the central canal and is confined initially to the capillaries of the GM (Fig. 5A). The injury was not constrained to the epicenter and expanded rostrally and caudally along the spinal cord. Except for an avascular cavity formed at the injury epicenter (Fig. 5C), the adjacent areas were also affected because of the development of hemorrhage and edema within the spinal cord after SCI. Given the disruption of blood flow, a post-traumatic decrease in local blood led to hypoxia and hemorrhage. 40
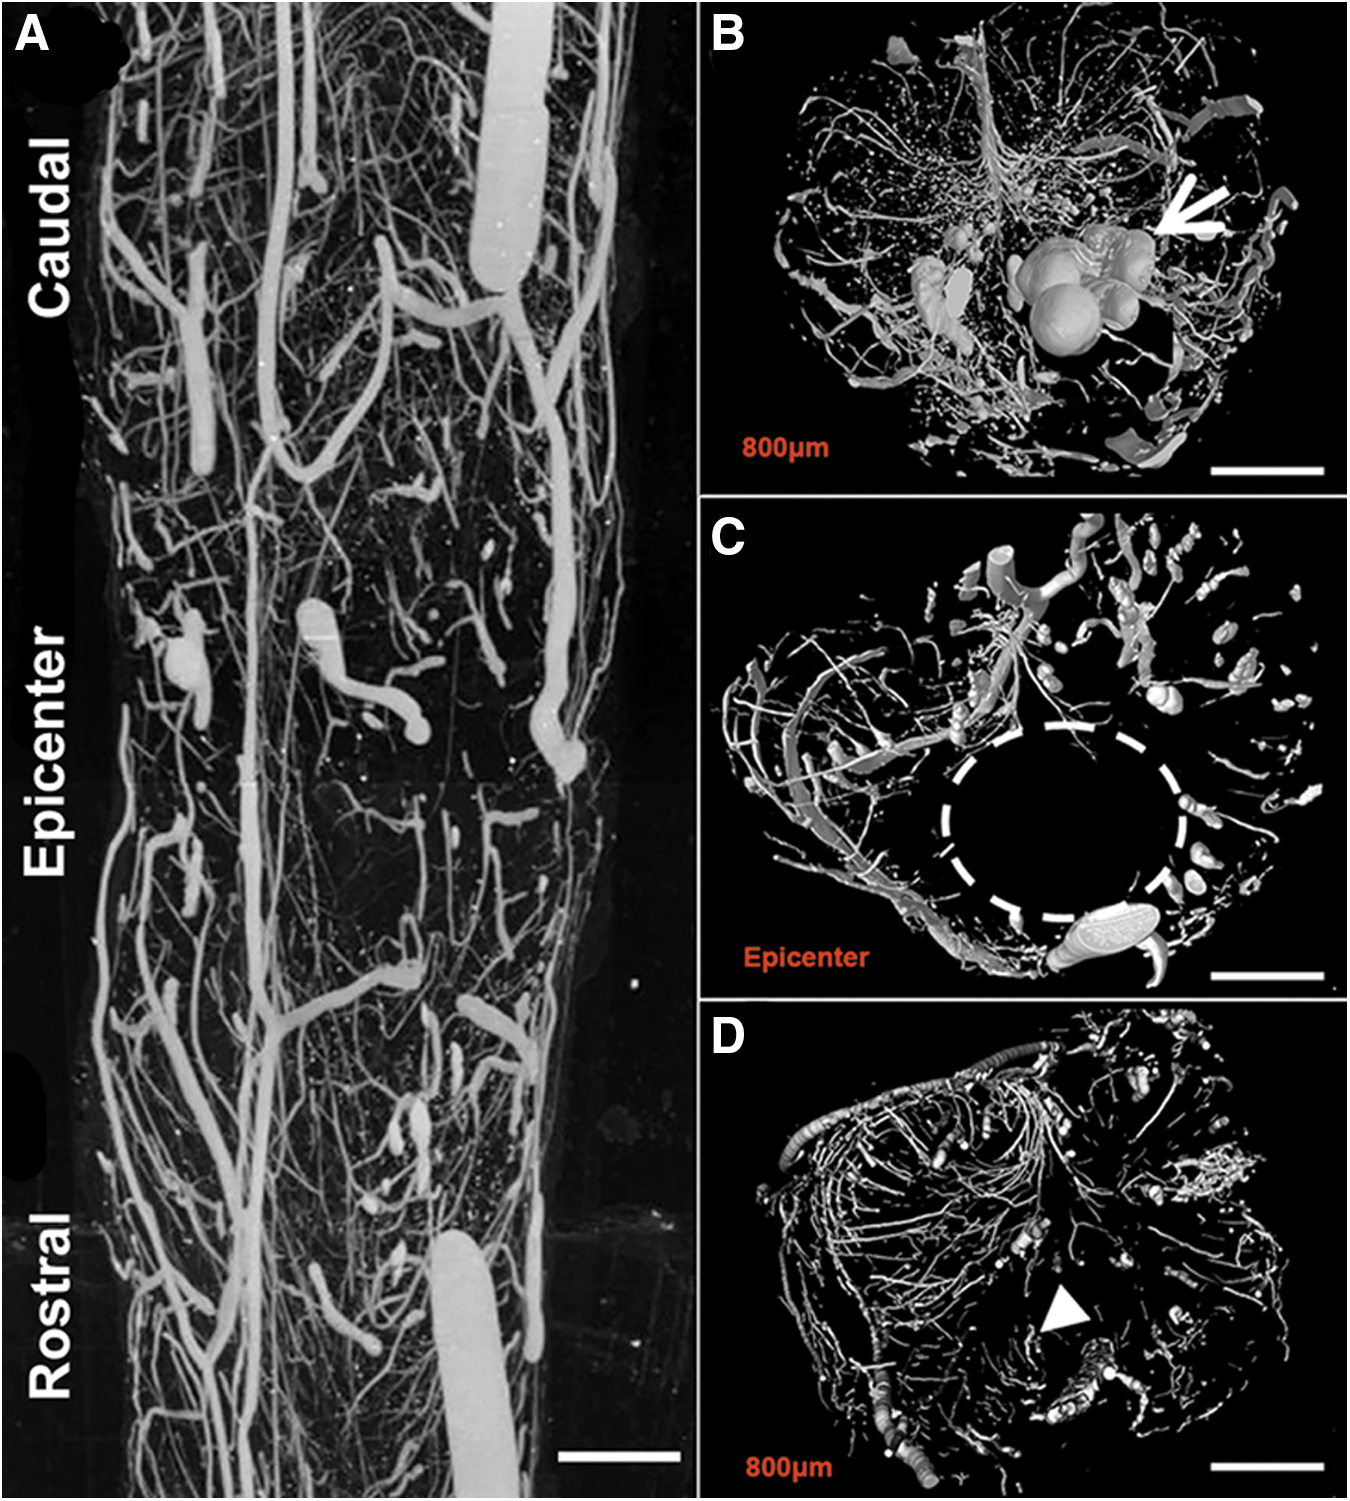
Three-dimensional (3D) pathologic morphology changes of spinal cord microvasculature 1 day post-injury (
Increased vascular permeability was associated with the leakage of contrast media into the spinal cord parenchyma arising from the weak site of the vessel (Fig. 5B). A subset of vessel morphology was distorted because of increased intramedullary pressure caused by local hypoxia (Fig. 5D). This finding reveals that the structural destruction and volumetric collapse of the microvasculature were directly induced by the acute trauma.
Figure 6 presents a region of interest of similar size selected from the control and the 1 day post-injury spinal cord microvasculature of the SR dataset (Fig. 6A, 6B), where the blue line represents the centerline of the vasculature and the red-colored dot refers to the bifurcation points (Fig. 6C, 6D). Because the vascular morphology varies between the GM and WM, we analyzed the morphology changes between the two areas and observed that the GM vessel segment and bifurcation were more susceptible to injury and were significantly decreased compared with vessels of the WM 1 day post-injury (Fig. 6E, 6F).
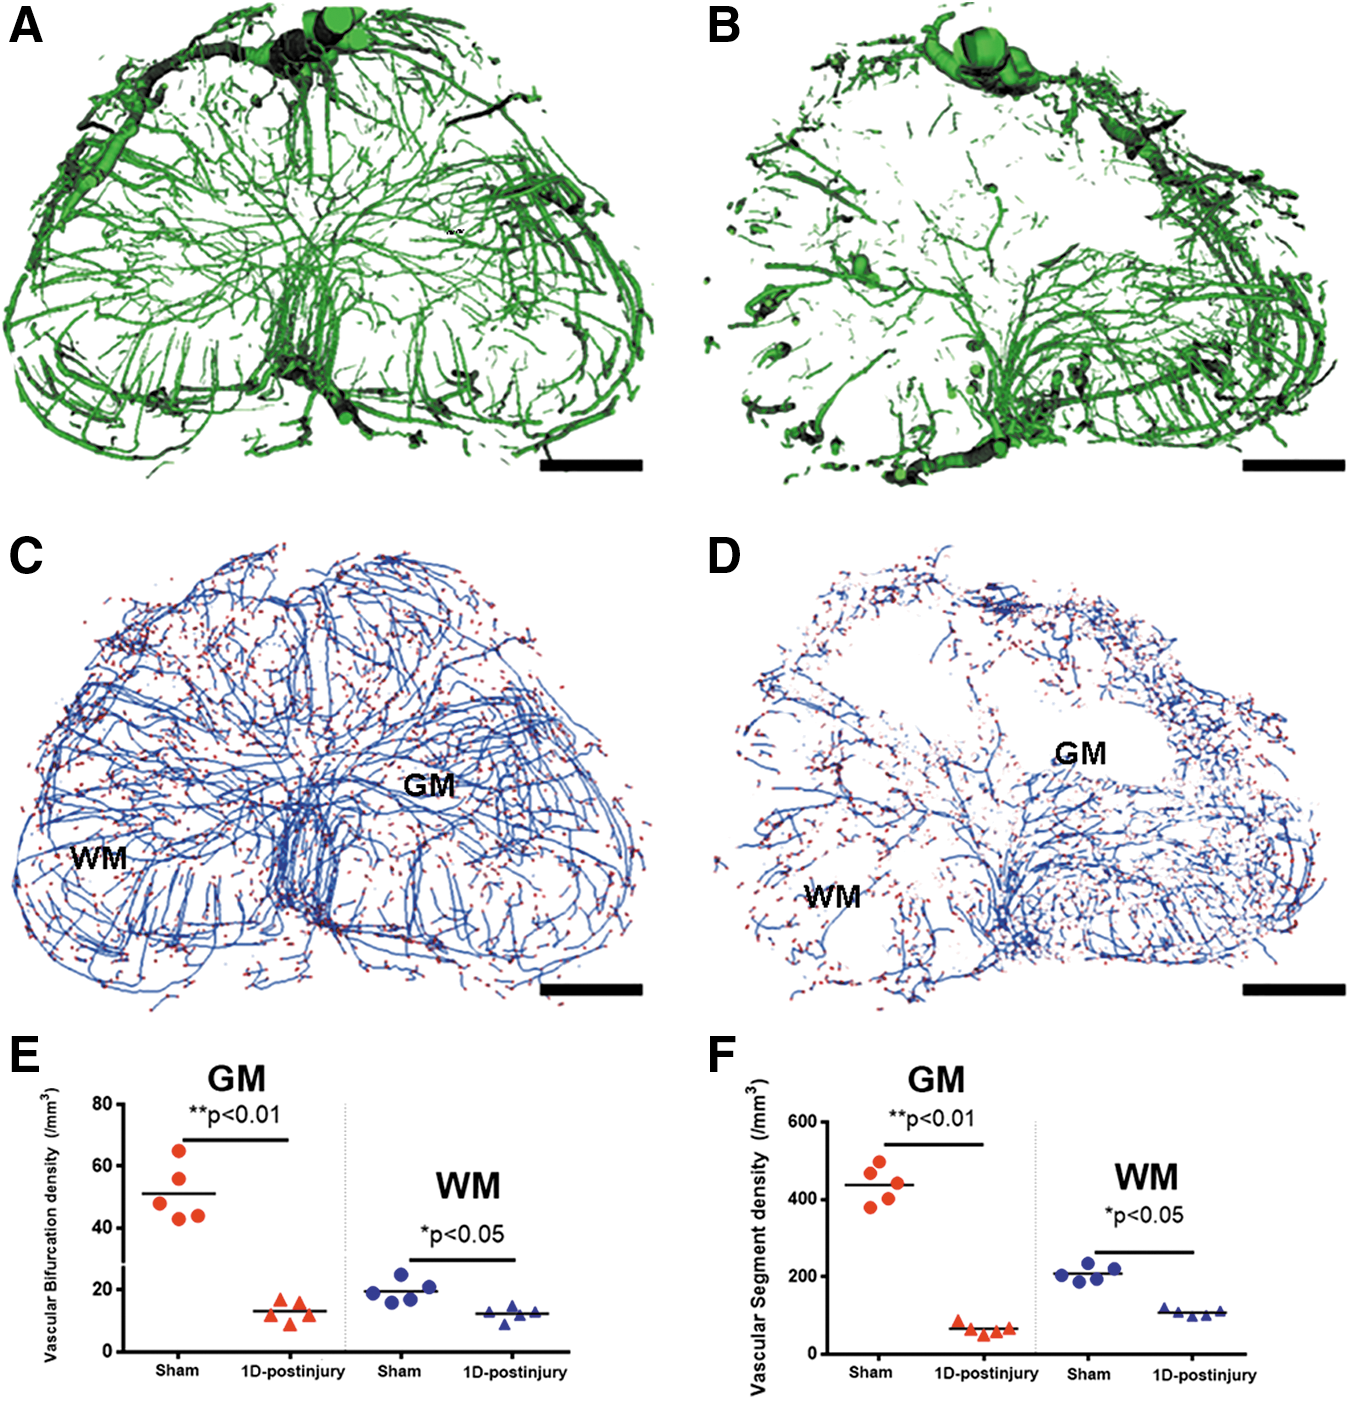
Three-dimensional (3D) vessel changes in spinal cord gray matter (GM) and white matter (WM) after injury. (
Gross 3D visualization and vascular remodeling after SCI
Approximately similar 5 mm regions near the 10th thoracic spinal cord containing the injured area at different post-injury time points were selected for quantitative analysis. A series of 3D digital maps of the transverse view of structural vascular changes throughout the SCI process was obtained from SRμCT (Fig. 7A). The continuous distribution of vessel thickness is depicted with different color coding.
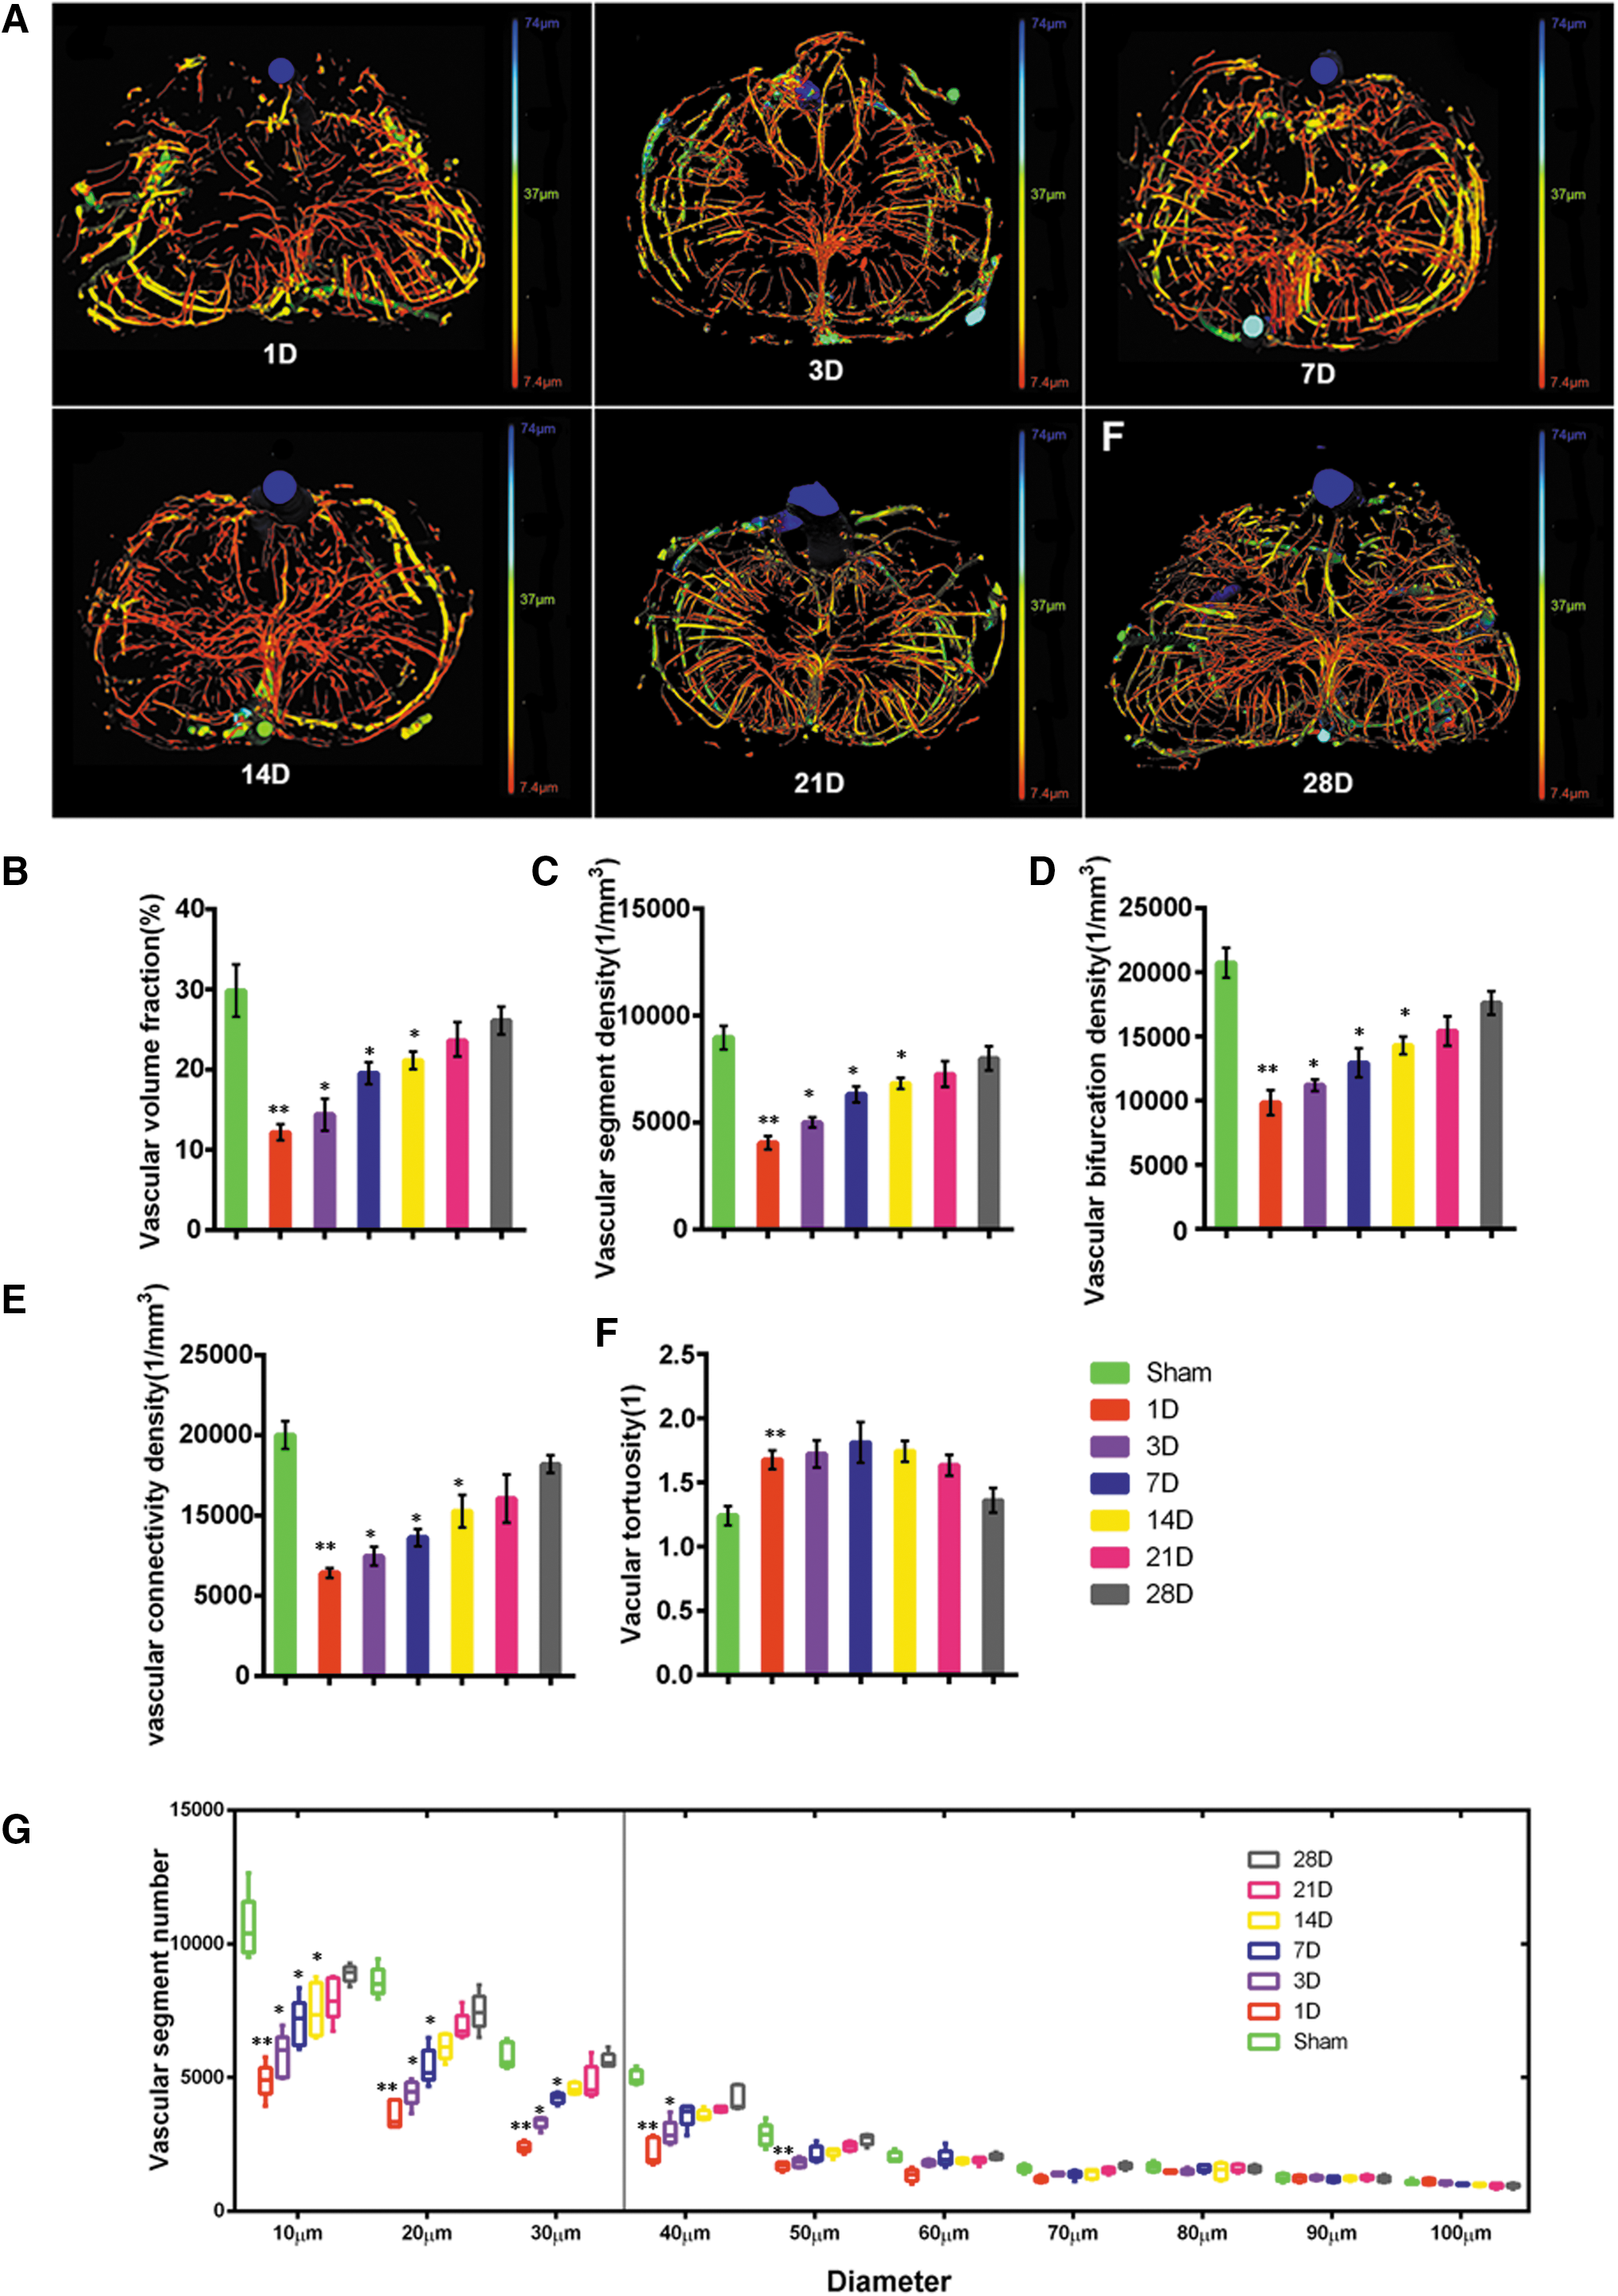
Three-dimensional (3D) morphological alteration of the microvasculature in the injured spinal cord at different post-injury time points. (
At 1 day post-injury, we observed that although the extrinsic arteries around the surface of the spinal cord were present, the integrity of the angioarchitecture within the traumatized region exhibited immediate damage. The intramedullary arteries in the center of the GM appeared distorted and holes developed. Based on the vascular analysis, the VVF, VBD, VSD, and VCD were significantly decreased compared with the sham groups (Fig. 7B, 7C, 7D, 7E).
Certain injured vessels slowly recovered reperfusion function during the later stages. The vessel parameters exhibited a gradual increase at 3, 7, and 14 days post-injury, but vessels failed to recover to the normal level by 28 days post-injury. An increase in vascular tortuosity (VT) at 1 day post-injury plateaued at day 7 and decreased slightly during the vascular healing process until 28 days post-injury after SCI (Fig. 7F). In addition, the distribution of blood vessel size in the normal and injured spinal cord demonstrated reduced perfusion in vessels of all sizes.
The number of vessels gradually increased from 3 days post-injury until 14 days post-injury, particularly vessels with a diameter less than 30 μm. We found that the number of larger vessels with a diameter greater than approximately 70 μm was nearly the same before and after SCI, which indicated that the larger vessels remain at a steady state during the repair process (Fig. 7G).
Endogenous angiogenesis after SCI
In the current study, we observed a dynamic angiogenical response after contusion injury. The schematic depiction of randomly selected images of the anterior horn of the GM at 400 μm rostral to the injury epicenter for angiogenesis quantification is shown Fig. 8A. The number of proliferation vascular endothelial cells (VECs) was quantified in RECA-1 labeled vessels co-stained with PCNA, indicating the presence of endogenous angiogenesis (Fig. 8B). These results demonstrated that angiogenesis occurs as early as 3 days post-injury with maximal angiogenesis occurring at 7 days post-injury.
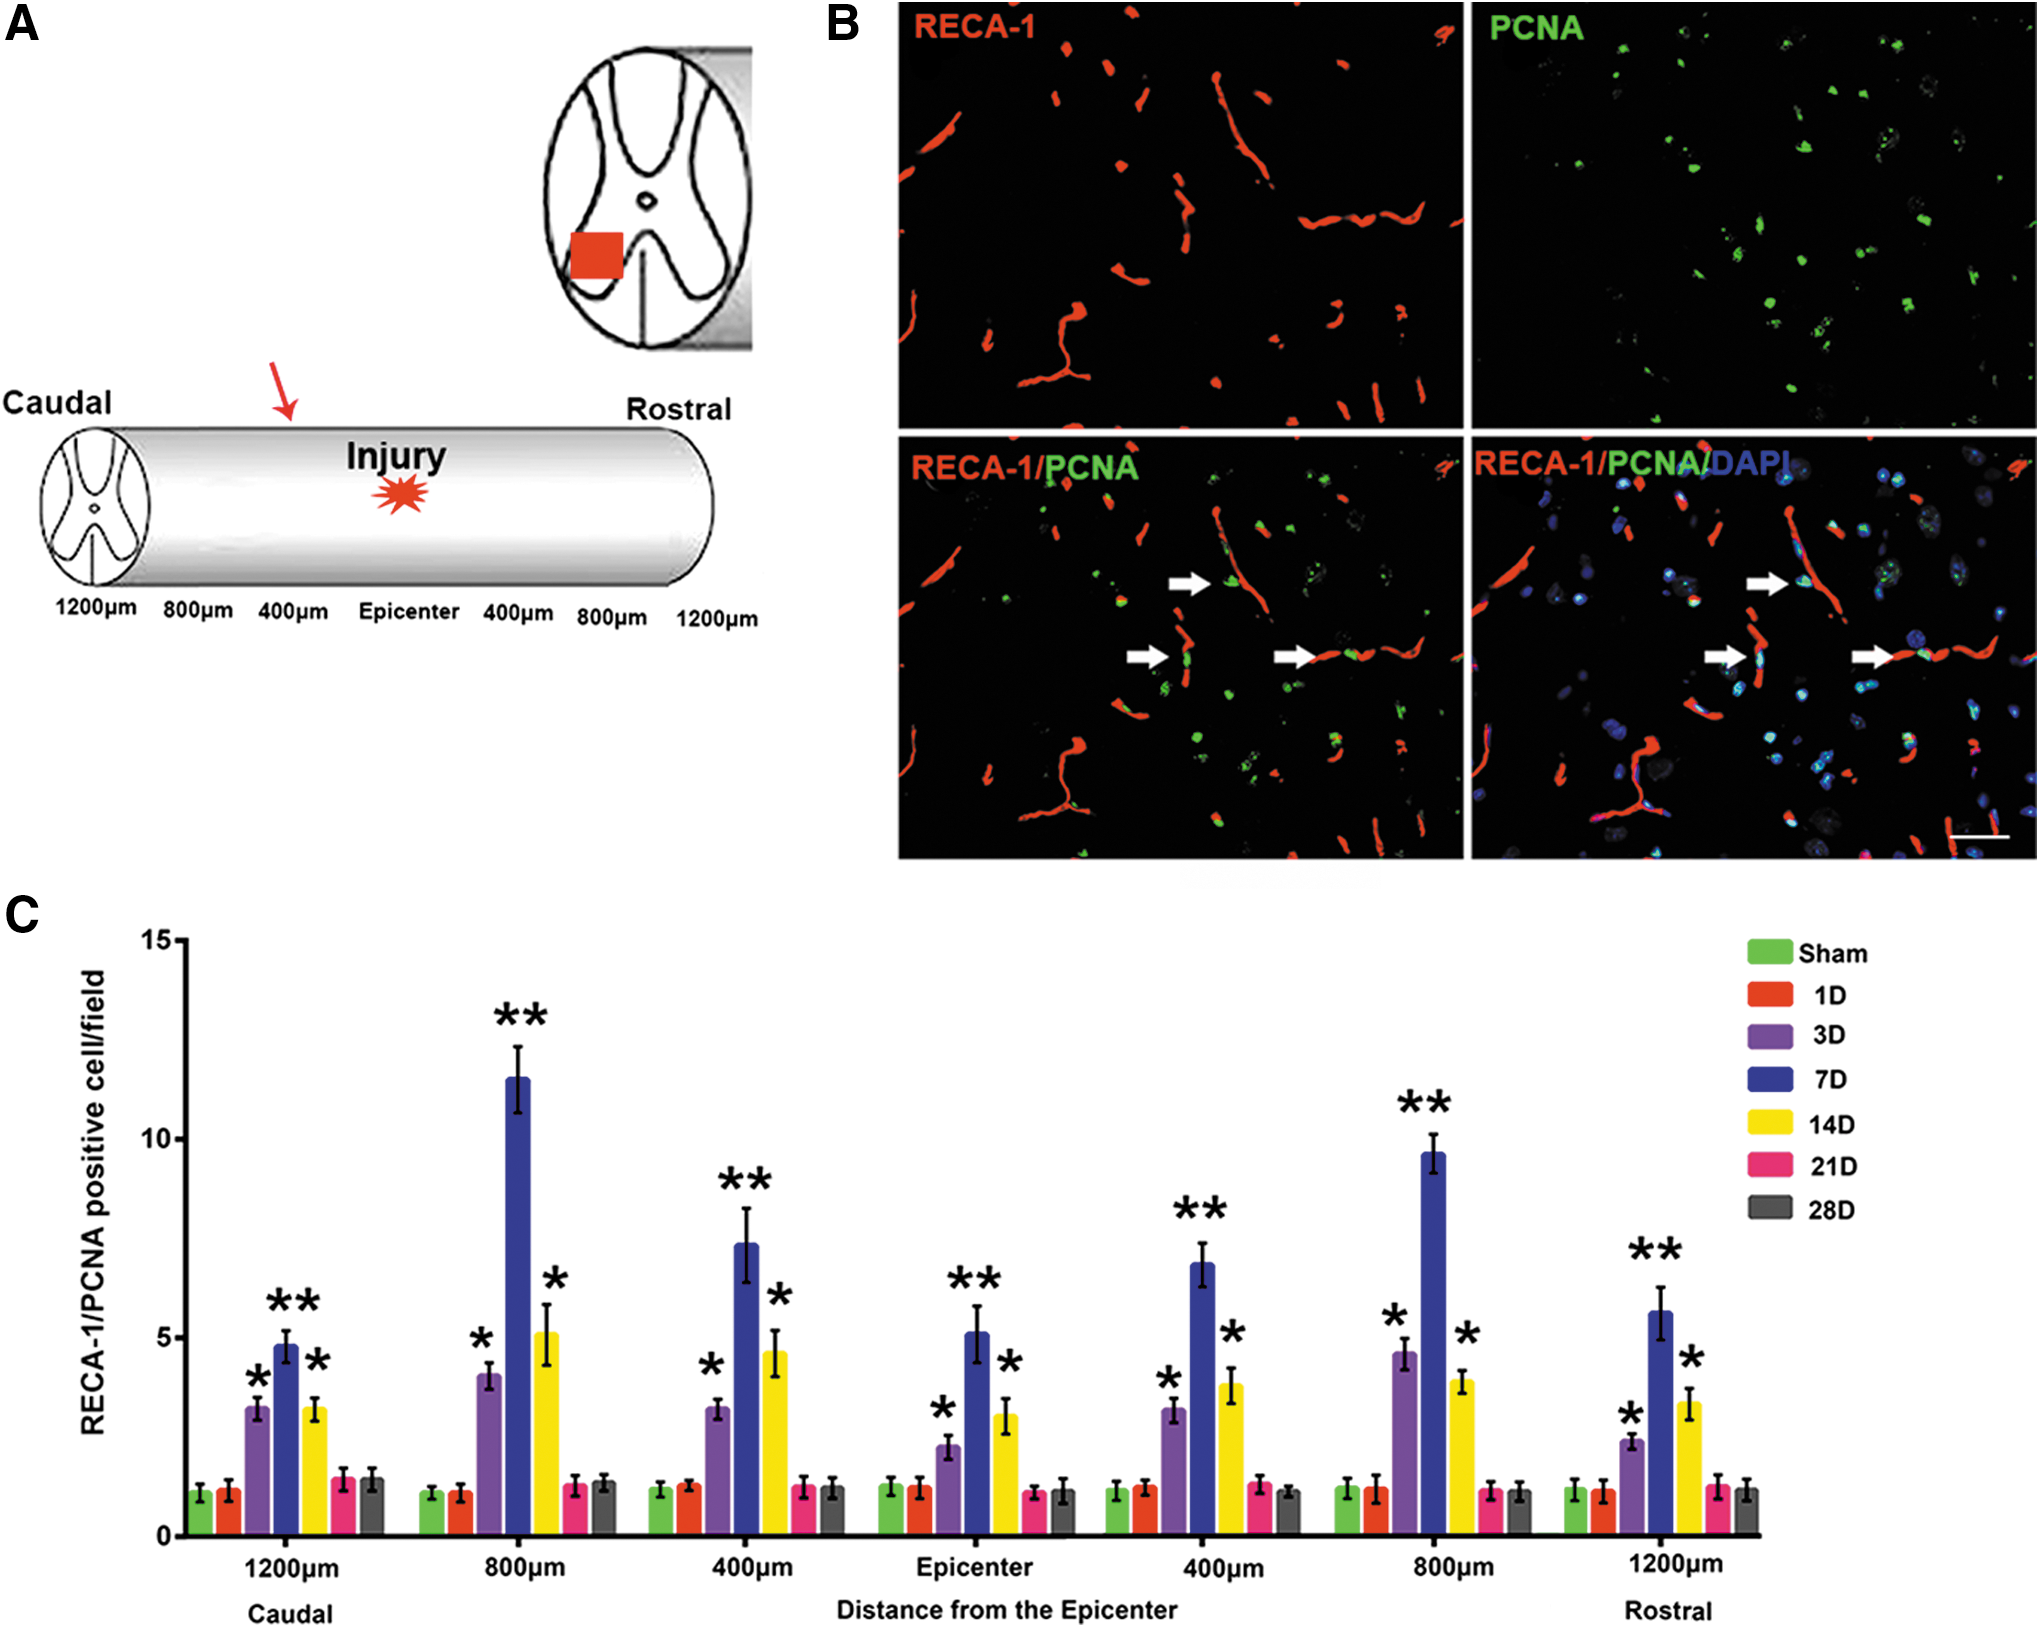
Endogenous angiogenesis after spinal cord injury. (
Compared with the sham groups, a significantly higher level of endogenous angiogenesis was detected as early as 3 days until 14 days post-injury at all distances from the injury epicenter (Fig. 8C). In addition, compared with the spinal cord at the 3 and 14 day time points, the spinal cord at 7 days post-injury demonstrated a greater abundance of proliferating ECs labeled with (RECA-1/PCNA), spanning all distances from the injury epicenter (Fig. 8C).
3D morphology of spinal cord cavity caused by injury
Figure 9 presents the 2D slices obtained from SRμCT cut into the transverse, coronal, and sagittal planes that reveal a midline cystic cavity involving the central canal, dorsal horns, and medial portions of the ventral GM at 28 days post-injury (Fig. 9A, 9B, 9C).
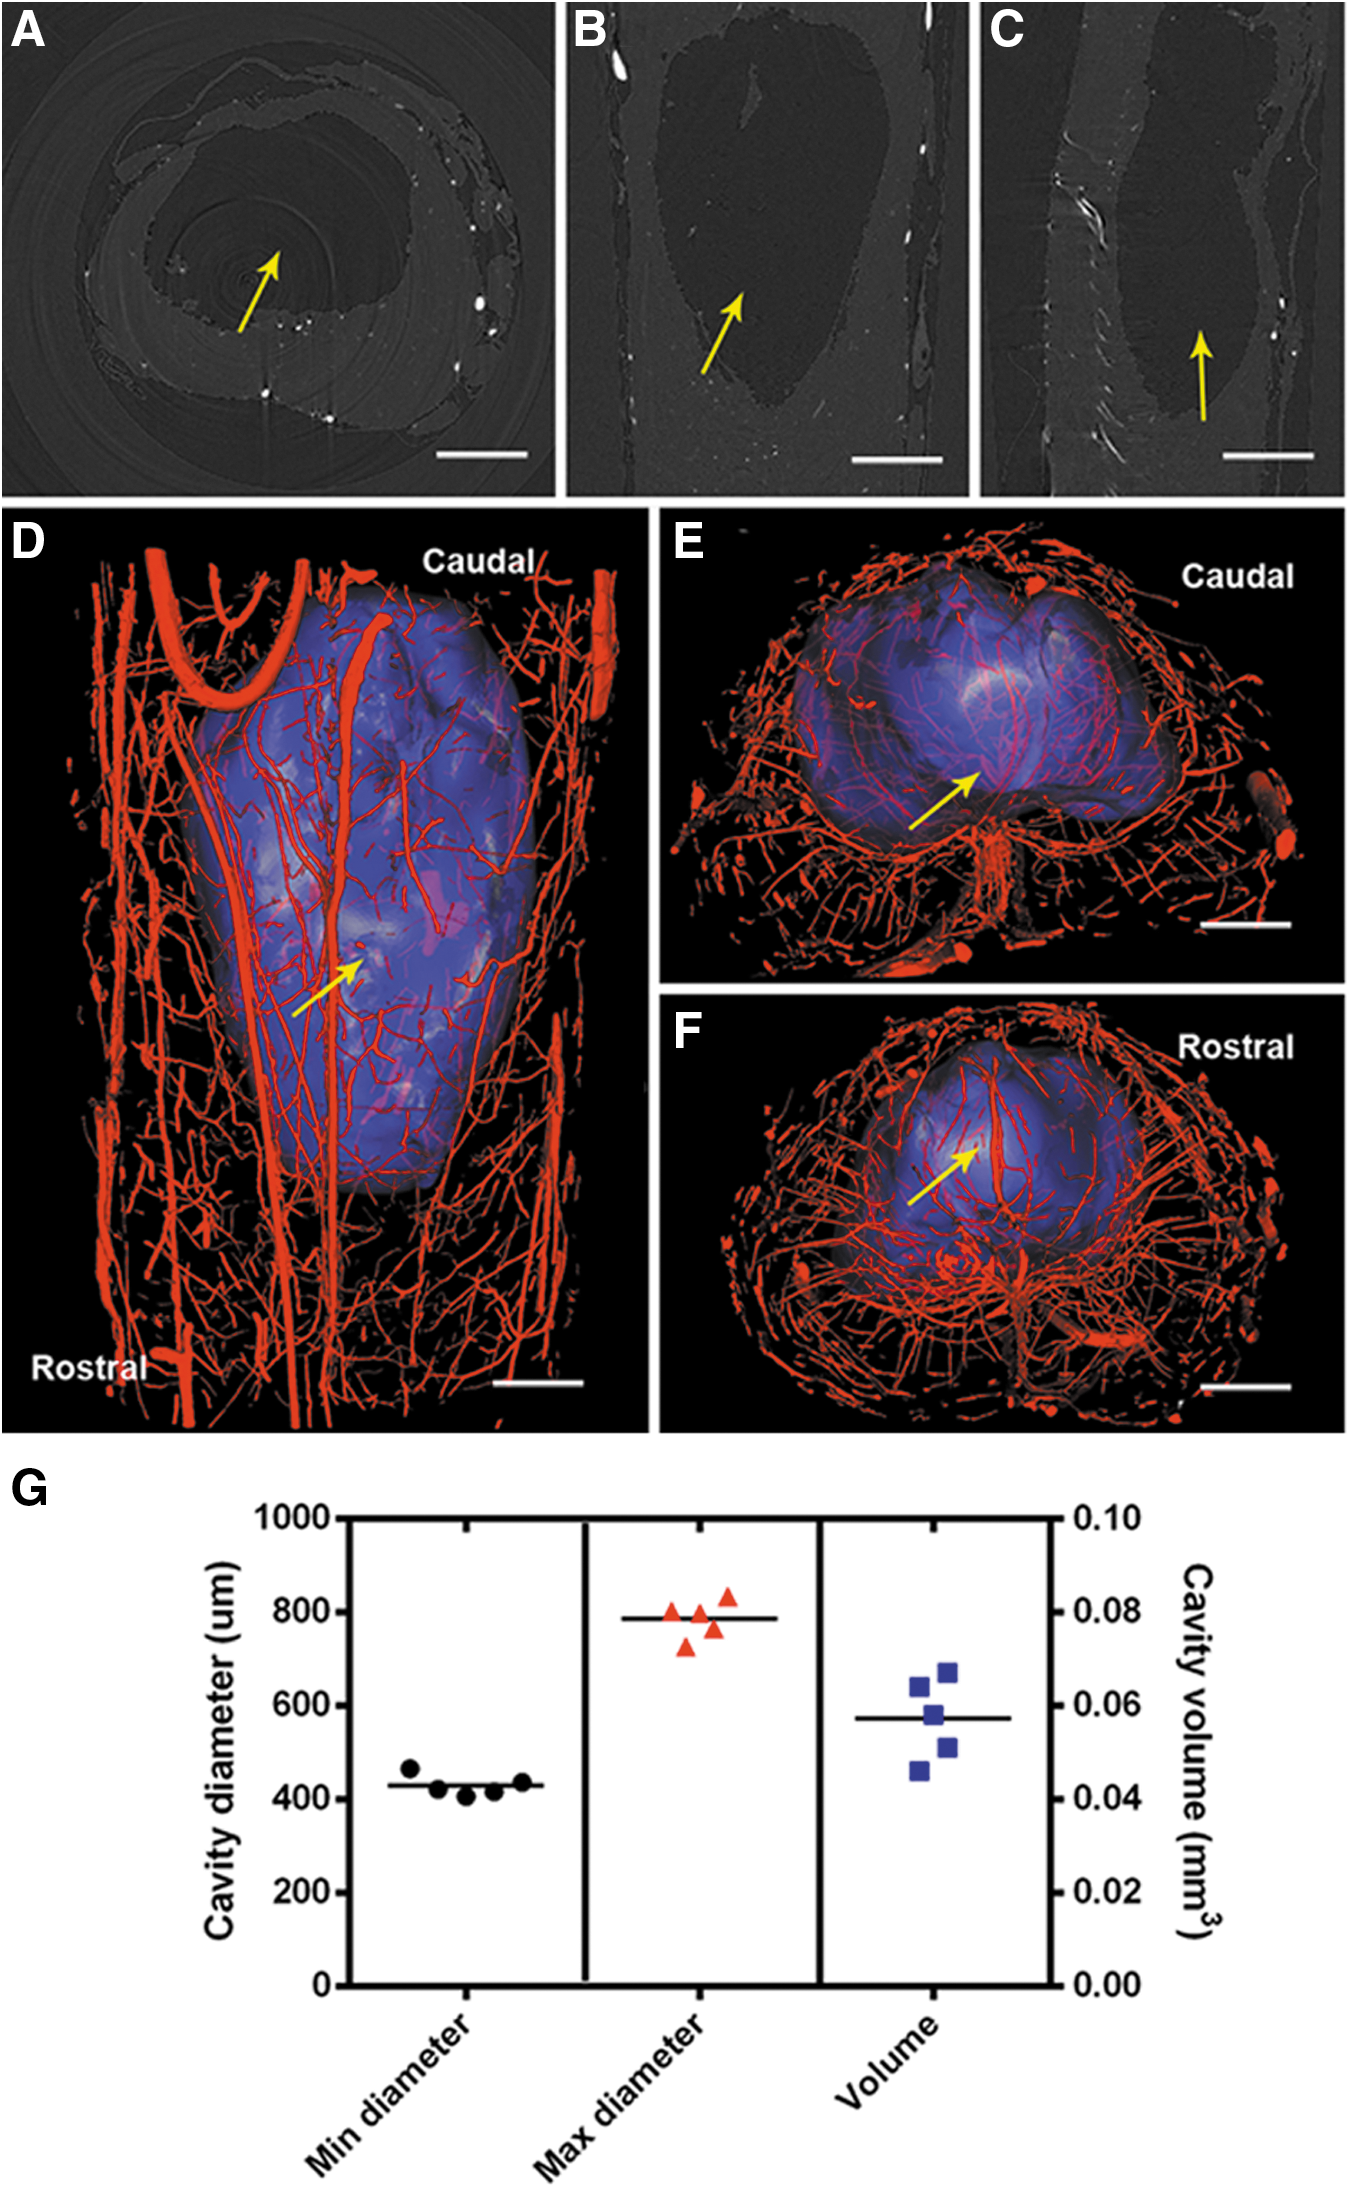
Three-dimensional (3D) morphology of spinal cord cavity at 28 days post-injury (
After the series of 2D slices was obtained, the 3D morphology of the spinal cord cavity was successfully reconstructed and demonstrated in different perspectives—namely, the top view and caudal and rostral view of the spinal cord cavity (Fig. 9D, 9E, 9F). In our study, five animals demonstrated cavity formation via SRμCT scanning. The minimum diameter of the cavity is 428.8 ± 14.14 μm, the maximum diameter is 785 ± 2 6.16 μm, and the cavity volume is 0.057 ± 0.009 mm3 (Fig. 9G).
Discussion
The spinal cord microvasculature has a strict and intricate 3D arrangement that plays a vital role in maintaining the normal physiological function of the spinal cord by precisely regulating blood flow. 41 Systematic structural analysis of the spinal cord microvasculature network might yield information crucial for understanding the normal function of spinal cord microvasculature and pathological changes that might occur after injury.
In our study, we successfully produced a 3D rendering of the normal spinal cord microvascular network using the state-of-the-art SRμCT. The centrifugal and peripheral artery systems are interwoven densely in the GM regions forming the typical butterfly outline. In addition, the vascular density in the GM, which contains many neurons, is significantly higher than that in the WM. This relative difference in vascular density suggests that the nutritional and metabolic requirements of the neurons in the GM are higher.
Using image post-processing techniques, we quantitatively analyzed the 3D microvasculature distribution in the thoracic spinal cord. In addition to obtaining the frequency distribution of vascular diameters, data describing vascular nodes, segments, connectivity, and degrees of distortion could also be obtained. These parameters can be used to describe the 3D morphology of blood vessels and objectively reflect the real status of the spinal cord microvasculature.
Apart from the morphological blood vessel measurements, the vascular diameters could be identified using different color codes that allowed better visualization such that the distribution patterns of the complex microvessels in the spinal cord could be intuitively recognized by the naked eye. The conventional histological method fails to represent the entire spinal cord microvasculature adequately because of its invasiveness. 5
After SCI, there is vascular damage resulting in intramedullary hemorrhage and concomitant local hypoxia. 42 As a result, there is induction of endogenous angiogenesis, which is accompanied by complex vascular remodeling. 7,8,42,43 The angiogenesis after injury is temporary and incomplete, however. 7,8 To date, few studies have observed the 3D microscopic morphological changes of vessels that occur during angiogenesis after injury. Notably, the integrity of the complex 3D vascular network relates to its function; when an abnormality exists in the vascular structure, vessel function is often abnormal. 41,42
Previously, our group used μCT to perform a 3D visualization study on injured microvasculature in the spinal cord, but because of the limited resolution, the progressive changes in the microvascular network reconstruction post-injury were not completely elucidated. 18,25,26 Thus, the application of a higher resolution instrument to interpret the dynamic repair and reconstruction process of injured spinal cord microvasculature from a 3D perspective can help us understand further the mechanisms of this pathology. This can also lead to the development of effective strategies for promoting the recovery of spinal cord neurological function post-injury.
In this study, SRμCT served as a powerful technological platform. For the first time, we successfully demonstrated 3D mapping of the temporal-spatial changes of the spinal cord microvasculature at different time points during the post-injury healing process. We observed that blood vessels have instantaneous damage after SCI. The injured region is not limited to the epicenter, but instead, it expands to the cephalic and caudal side of the spinal cord and forms an oval-shaped region of injury, as viewed from a 3D perspective.
We noticed that the vascular damage in the injury epicenter of spinal cord is severe, and the parenchyma of the spinal cord, which is a region without vessels, subsequently loses blood perfusion. The vessels in proximity to the injured region are also damaged, as indicated by contrast reagent leaking out of the vessels in adjacent segments and resultant decrease in number of vessels. The effect on the surrounding vessels might be the result of local bleeding and hypoxia leading to increased intramedullary pressure after injury. 44,45 These results indicate that reducing local bleeding and intramedullary pressure at an early stage could be an effective strategy to prevent further damage to the spinal cord parenchyma and improve the post-injury recovery of neurological function. 46,47
By analyzing the vascular morphological parameters of the spinal cord GM and WM, we found that with an injury from an external force, vessels in the GM more easily experience damage than those in the WM. This fragility has a fatal impact on neurons in the GM, which are highly dependent on the nutrition supply.
We used histological staining to observe endogenous angiogenesis after injury. The angiogenesis rate reached its peak value at day 7. The rate began to attenuate, and it disappeared 2 weeks later, which is consistent with previously reported data. 7,8 Through further quantitative analysis of microvascular changes at different time points after SCI, we found that the diameters of the involved vessels are primarily less than 70 μm. The large extramedullary vessels covering the spinal cord, however, such as the ASA and the posterolateral artery, were not damaged.
In addition, although morphology was slightly distorted, the central sulcus artery could still be visualized after injury, potentially playing a role in the recovery of neurological function after SCI by providing nutrition to the injured parenchyma. Moreover, we found that the diameters of the microvessels that formed from trauma-induced angiogenesis were mainly less than 30 μm. The VSD, node density, VVF, and VC exhibited a gradual increase at 3, 7, and 14 days post-injury, which is consistent with the rate of vascular proliferation, but they did not return to normal levels. Further, the degree of microvascular distortion increased after injury and subsequently decreased before gradually recovering to a normal level.
These findings suggest that in addition to an increased number of vessels, the spinal microvasculature also experiences 3D microscopic structural remodeling, modification, and re-organization during the post-injury healing process to functionally adapt and effectively supply nutrition to the spinal cord parenchyma. Studies have shown that because of abnormal morphology, early regenerated blood vessels cannot play their respective normal physiological roles. 41
Synchroton provides more meaningful information on the pathological changes of microvasculature during the SCI process. In addition, this approach has completely revolutionized the traditional 2D histological study of microvascular morphology after SCI. SRμCT maintains the integrity of the examined tissue and also accurately reflects the 3D pathological changes in the microvascular morphology. Spinal cord parenchyma might become liquefied and necrotic and eventually form spinal cord cavities after injury. 48,49 In our study, we reproduced the morphology of 3D spinal tissue cavities for the first time, and we did not observe blood vessel in the cavities.
SRμCT has many advantages for 3D visualization of microvasculature. 28,33,50 Nevertheless, because of the in vitro nature of our current study, additional experiments including in vivo testing will be needed to validate the effectiveness of this technical approach. We believe that the application of this technology might offer a powerful technological platform for the study of angiogenesis after SCI and also help evaluate the efficiency of different treatment strategies on angiogenesis after SCI.
Conclusion
The results of the current study demonstrated that SRμCT provides precise 3D images and data for qualitative and quantitative study of spinal microvascular angiogenesis after injury. Damage of spinal cord microvasculature plays an important role in pathogenesis of SCI and recovery of spinal cord neurological function. The protection of the blood supply after SCI cannot be overemphasized, making a distinct characterization of the unique complex microvascular architecture essential. In addition, SRμCT could be used in future studies to explore the effect of certain treatments on functional recovery after SCI targeting the promotion of vascular regeneration.
Footnotes
Acknowledgments
This work was performed at the SSRF BL13W1, Shanghai, China, and was supported by the National Natural Science Foundation of China (Nos. 81171698, 81301542 and 81371956) and the Hunan Provincial Innovation Foundation For Postgraduate (No. CX2015B060). The authors thank Prof. Tiqiao Xiao for kind assistance in SR imaging at the BL13W1 station.
Author Disclosure Statement
No competing financial interests exist.