
Abstract
The brain and heart are two vital systems in health and disease, increasingly recognized as a complex, interdependent network with constant information flow in both directions. After severe traumatic brain injury (TBI), the causal, directed interactions between the brain, heart, and autonomic nervous system have not been well established. Novel methods are needed to probe unmeasured, potentially prognostic information in complex biological networks that are not revealed by traditional means. In this study, we examined potential bidirectional causality between intracranial pressure (ICP), mean arterial pressure (MAP), and heart rate (HR) and its relationship to mortality in a 24-h period early post-TBI. We applied Granger causality (GC) analysis to cardio-cerebral monitoring data from 171 severe TBI patients admitted to a single neurocritical care center over a 10-year period. There was significant bidirectional causality between ICP and MAP, MAP and HR, and ICP and HR in the majority of patients (p < 0.01). MAP influenced both ICP and HR to a greater extent (higher GC, p < 0. 00001), but there was no dominant unidirectional causality between ICP and HR (p = 0.85). Those who died had significantly lower GC for ICP causing MAP and HR causing ICP (p = 0.006 and p = 0.004, respectively) and were predictors of mortality independent of age, sex, and traditional intracranial variables (ICP, cerebral perfusion pressure, GCS, and pressure reactivity index). Examining the brain and heart with GC-based features for the first time in severe TBI patients has confirmed strong interdependence and reveals a significant relationship between select causality pairs and mortality. These results support the notion that impaired causal information flow between the cerebrovascular, autonomic, and cardiovascular systems are of central importance in severe TBI.
Introduction
T
An understanding of physiology in terms of information exchange within a network is key to characterizing the fluctuations and instability observed in routine physiological parameters— something that is known to vary with disease. The traditional view of homeostasis sees physiological stability in the face of external perturbation, achieved by an integrative negative feedback system. In such a model, the healthy state should be characterized by stability of measured physiological parameters with any fluctuations resulting from exogenous influence. Conversely, physiological instability would be expected to result from failure of homeostasis. This viewpoint is increasingly recognized as incomplete. In fact, fluctuations in physiological measurements, such as heart rate and blood pressure, are ubiquitous in health. The loss of variability (“decomplexification”) is a characteristic of disease, rather than an indication of healthy physiological stability. Physiological decomplexification is observed in a number of diseases, 12,13 in situations of physiological challenge, 14 and can be an early predictor of outcome post-TBI. 8 Given that such physiological fluctuations are present in health and reduced in disease, they must arise internally by some physiological mechanism rather than through exogenous influence. A more appropriate description may be that of homeokinetics, a concept borrowed from the physics of complex systems, which suggests that functional equilibrium is a result of dynamic rather than static processes. 15 Spontaneous fluctuations are now famously known to arise spontaneously in complex networks, 16,17 and it is highly plausible that this may be the case in physiological systems, which consist of a large number of interacting biological subsystems. Temporal self-similarity (“scaling”) is characteristic of such networks observed also in physiological fluctuations 18 varying in both chronic disease 19 and under acute physiological or pharmacological perturbation. 14 It is the connectivity of such networks that determines their dynamics.
A sufficiently complex network permits a degree of adaptability to “absorb” external shocks whilst at the same time the fluctuations can allow an agile response to internal changes—exactly as is observed in physiology. Such a systems approach may give new insights into physiological control and illness, but unfortunately the detailed biological subsystems are too numerous to be measured. However, in the setting of TBI, signals such as heart rate (HR), mean arterial pressure (MAP), and intracranial pressure (ICP) are likely superficial surrogates of these hidden subsystems; connectivity in the underlying biological system may be reflected as causal connectivity between the recorded signals.
Granger causality (GC) has been widely used since its introduction by Granger in the 1960s as a statistical tool for directed, functional connectivity and causal inference, initially in economics, 20 but now increasingly well established in neuroscience and neuroimaging primarily within the brain through magnetoencephalography(MEG)/electroencephalography (EEG) or functional magnetic resonance imaging (fMRI). 21,22 With time-series variables, it provides an estimation of information transfer and the “cause-and-effect” relationship between two variables with minimal assumptions of the underlying physical mechanisms. 21 Some have looked at the cardio-respiratory system causality 23 and cardio-cerebral interactions reflecting central modulation of ANS outflow. 10 Studies involving TBI patients have been limited to EEG/MEG signal analysis showing network connectivity disruption 24,25 and after spinal cord injury 26 and subarachnoid hemorrhage (SAH). 7 This study uses GC analysis to explore evidence of interconnectivity between the cerebrovascular, cardiovascular, and autonomic systems using routinely measured surrogate signals (ICP, MAP, and HR) in a large cohort of 171 severe TBI patients and evaluates possible biological significance by relating it to outcome as a proxy for disease severity and likely network impairment.
Methods
Patient selection and data acquisition
Data recordings from patients admitted to the Neurosciences and Trauma Critical Care Unit at Cambridge University Hospitals (Cambridge, UK) after severe TBI between 2002 and 2012 were examined for retrospective analysis. An intraparenchymal probe was placed as per departmental clinical protocol for the recording of ICP (Codman & Shurtleff Inc., Raynham, MA). Invasive blood pressure was recorded from an indwelling radial artery catheter and HR was derived from routine cardiac monitoring. All signals were continuously sampled using ICM+ software (Cambridge, UK;
Total data recording length varied between patients from <1 h to 14 days. We were particularly interested in those that had time for the disease process to evolve. As such, only those with at least 72 h of recording of ICP, MAP, and HR, along with the Glasgow Coma Scale (GCS) and Glasgow Outcome Scale (GOS), were selected. For the time period specified, 198 patient recordings were accessed. Those known to have more than 2-h gaps (n = 10) and over 24 h from ictus at the time of admission (n = 17) were excluded. One hundred seventy-one patients entered our analysis. Because recordings in the first 24 h tended to be either incomplete attributed to surgical intervention or confounded by artefacts because of sedation holds in apparently less severely injured patients, we selected the second 24-h period for our analysis. All were sedated, mechanically ventilated and managed according to a cerebral perfusion pressure (CPP)-orientated protocol 27 during their stay in critical care. Data collection and analysis were approved by institutional review. Pressure reactivity index (PRx), a moving Pearson correlation between ICP and MAP, was additionally calculated as a measure of cerebral autoregulation.
Conditional Granger causality analysis
Assuming that variable X and variable Y are the measured time courses of two physiological signals, bivariate GC quantifies the ability of unique past information in one of the time series in predicting future values of the other. Specifically, if incorporating past values of X improves the prediction of the current value of Y, one says that X Granger causes Y. The causal information flow between three time-series variables, ICP, MAP, and HR, required a multivariate extension, often referred to as “conditional” Granger causality analysis (GCCA). 28 For example, GCCA could infer a causal relationship from MAP to ICP only if past information in the MAP helped predict future ICP, after taking into account the influence of HR. Mathematical theory behind GC is described extensively elsewhere. 20,29,30 We used the code published by Seth and colleagues implemented in MATLAB 31,32 (R2014a; The MathWorks, Inc., Natick, MA). GC values were derived from a 24-h recording period with 8640 data points recorded in parallel for ICP, MAP, and HR. Data were scrutinized for covariance stationarity and normalized to zero mean/unit variance by following the Box and Jenkins differentiation approach. 33 The optimal model order was obtained during the regression analysis using the Akaike information criteria. 34 With the model residuals, an F-statistic was calculated with p < 0.01 used as the threshold for significance of causal interaction after appropriate Bonferroni correction. Six output variables were grouped into three pairs to reflect extent of bidirectional causal information flow: pair 1 (ICP-to-MAP and MAP-to-ICP); pair 2 (ICP-to-HR and HR-to-ICP); and pair 3 (MAP-to-HR and HR-to-MAP).
Statistical analysis
Statistical analysis was undertaken using IBM SPSS Statistics for Macintosh (version 21.0; IBM Corp., Armonk, NY). PRx, mean values for ICP, CPP, MAP, and HR, and GC for 171 patients over 24 h were computed. Outcome was assessed at 6 months post-TBI using the GOS. 35 Groups were dichotomized into survival versus death, as well as favorable versus unfavorable outcome (good recovery or moderate disability vs. severe disability or death). Interval data are expressed as mean ± standard deviation (SD) or 95% confidence interval (CI), or median with interquartile range (IRQ), and compared with one-way analysis of variance, or Kruskal-Wallis nonparametric testing, as appropriate. Categorical data were compared using chi-squared testing. Paired-sample Wilcoxon signed-rank test was used to compare the mean GCs between pairs of variables (e.g., pair 1, ICP-to-MAP vs. MAP-to-ICP). The Mann-Whitney U test (two groups) and Kruskal-Wallis test (for >2 groups) were used to compare the GC between outcome groups. Pearson's correlation was used to examine correlation between continuous variables. A multivariable logistic regression model was used to identify independent predictors for the dichotomized outcomes. Variables were normalized, as appropriate, if found not to follow a normal distribution before inclusion in the logistic regression model. p < 0.05 was chosen to represent a significant difference. All statistical tests were two-tailed, and correction for multiple comparisons was made.
Results
Patient demographics
From Table 1, 171 patients were included in the study; 129 patients were male (75.4%) and 42 were female (24.6%). Average age was 38.1 ± 15. Based on the initial post-resuscitation GCS, 107 (62.6%) sustained severe TBI (GCS ≤8). At 6 months post-injury, 131 (76.6%) survived and 40 (23.4%) died.
Good outcome = GOS 5, moderate disability = 4, severe disability = 3 and 2, and death = 1
Numerical data expressed as mean ± standard deviation and compared with analysis of variance. Categorical data expressed as number (percentage) or median (IQR) and compared with chi-squared test.
GOS, Glasgow Outcome Score; GCS, Glasgow Coma Scale; IQR, interquartile range.
Establishing directional causality
Table 2 shows GC values (mean ± SD). There was significant causality in both directions between variable pairs, where the threshold was set at p < 0.01 (no significant change at the p < 0.05 level). Over 94% of patients for pairs 1 (ICP and MAP) and 3 (MAP and HR) variables and 86.5% of patients for pair 2 (ICP and HR) variables, this was significantly lower than other pairs (McNemar's test; p < 0.05).
ICP, intracranial pressure; MAP, mean arterial pressure; HR, heart rate; SD, standard deviation.
Pairs 1 and 3 showed significant asymmetry in GC magnitude. Figure 1 visually depicts the causal interaction strength and direction between ICP, MAP, and HR using GC-weighted arrows where MAP was the dominant causal variable between MAP-to-ICP versus ICP-to-MAP (p < 10–12) and MAP-to-HR versus HR-to-MAP (p < 0.00001). There was no difference between variables in pair 2, ICP-to-HR versus HR-to-ICP (p = 0.85).
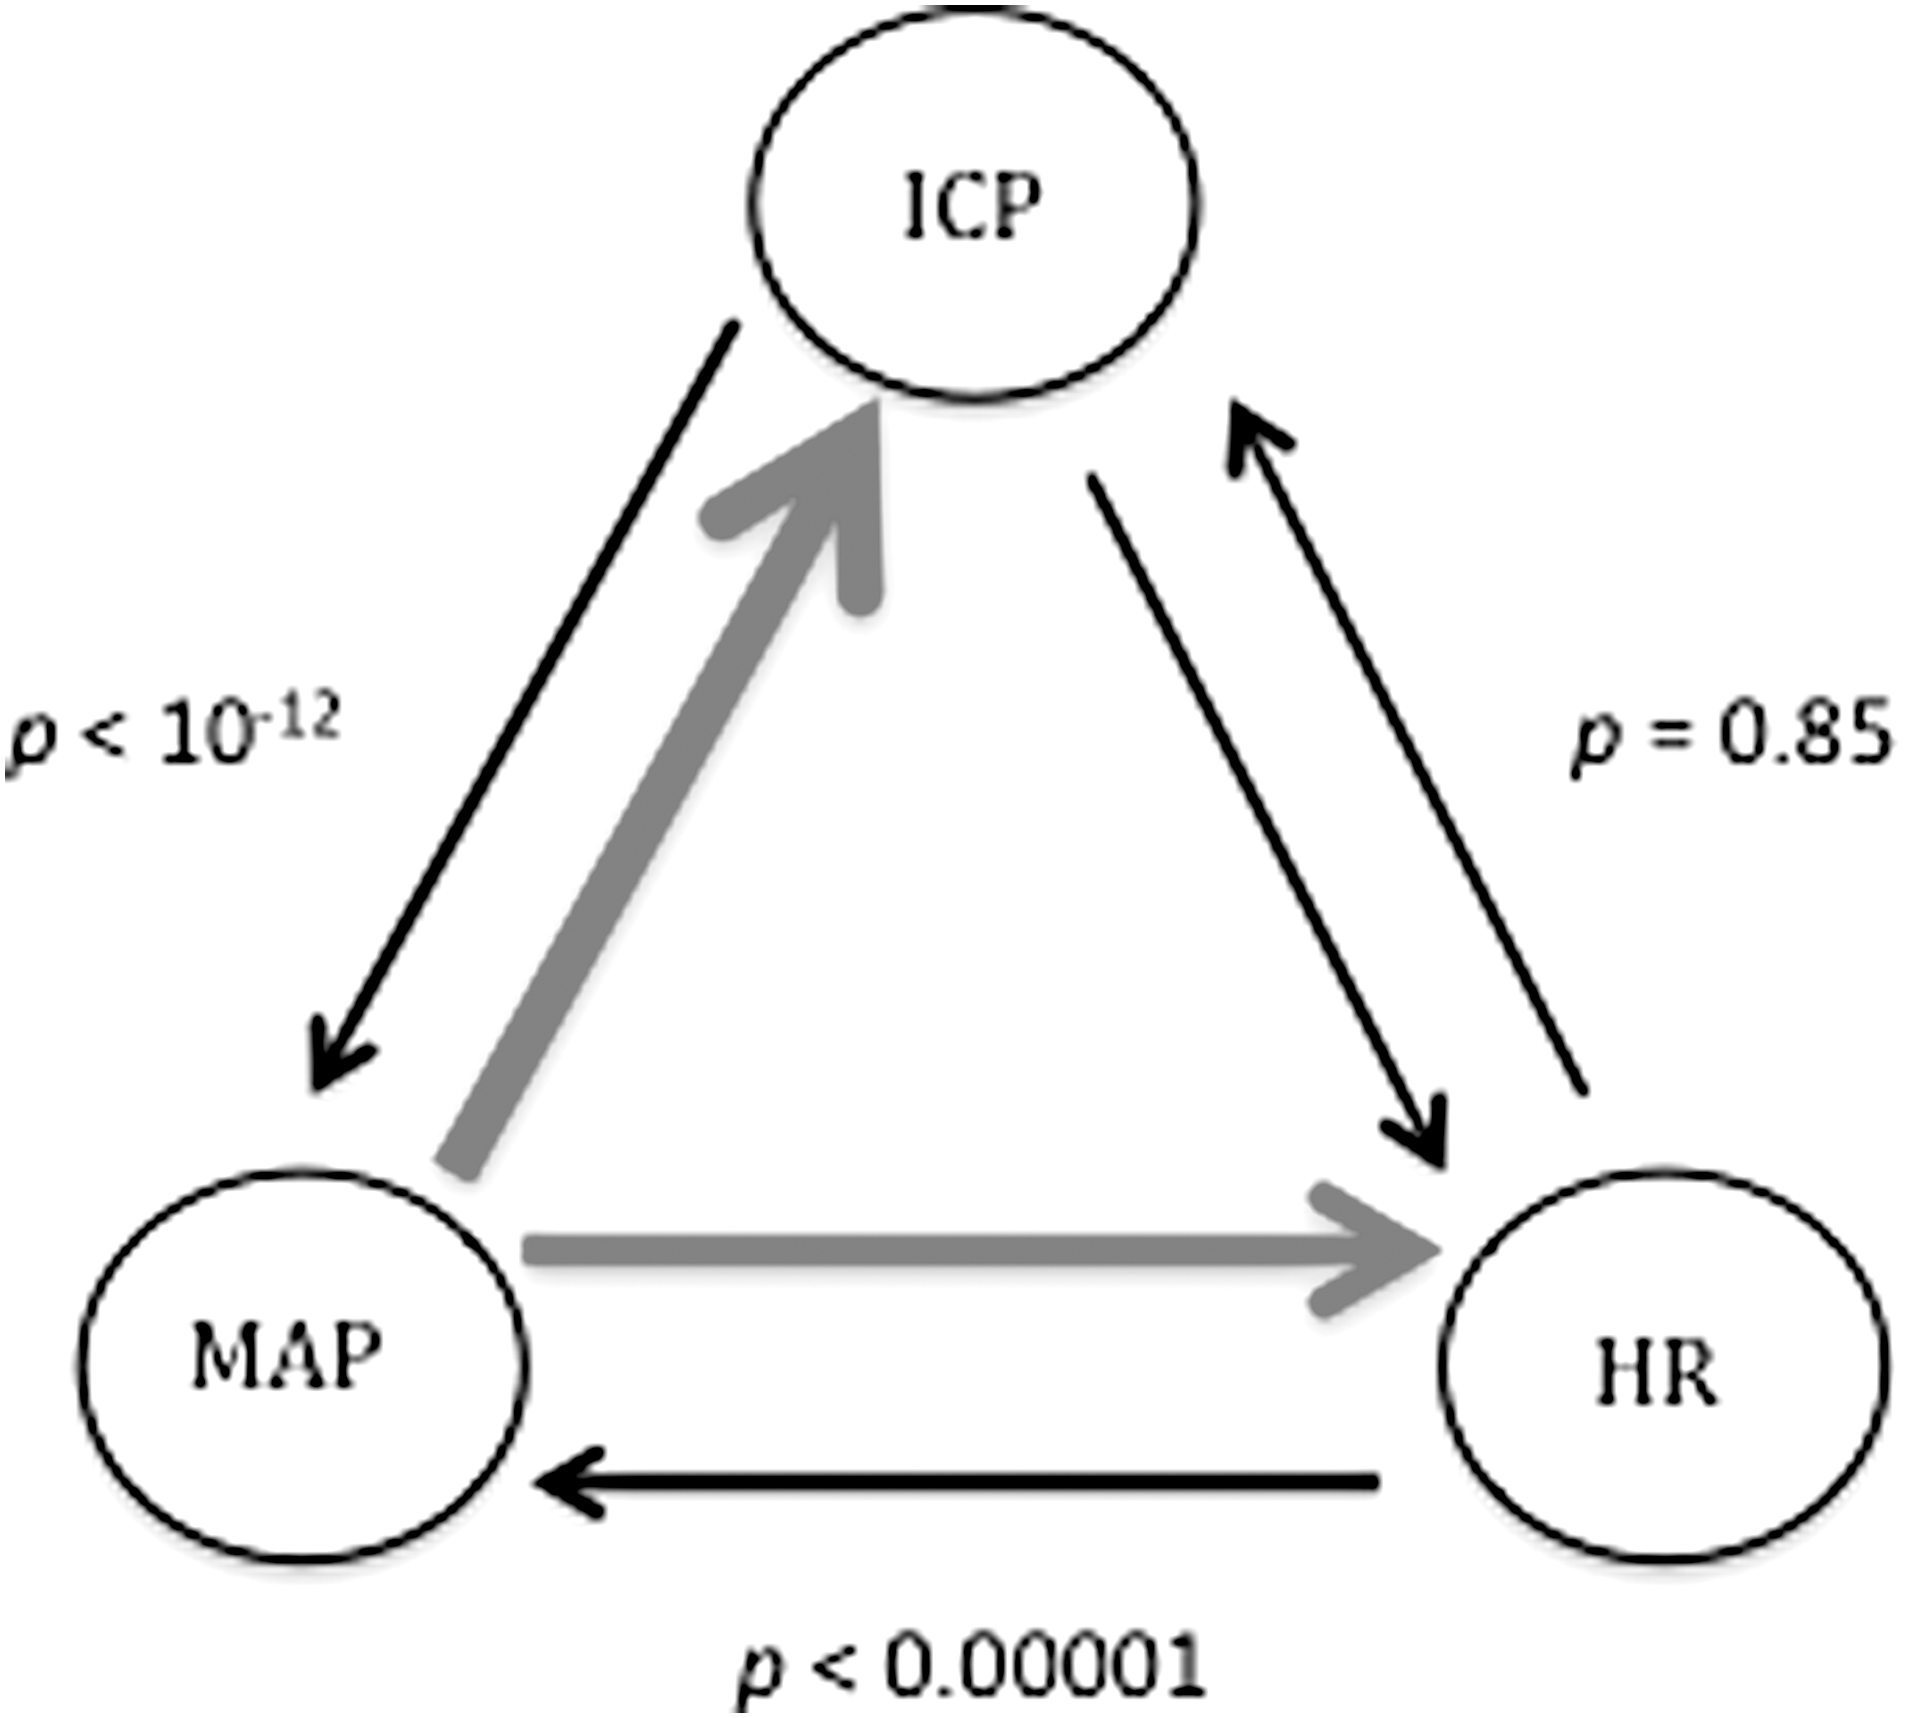
Graph of the three pairs of variables showing strength of causality with weighted arrows. Dominant direction of causality in red. p values from the paired-sample Wilcoxon signed-rank test comparing difference in mean Granger causality in both directions. ICP, intracranial pressure; MAP, mean arterial pressure; HR, heart rate.
Correlation of cardio-cerebral causality with outcome
Figure 2 shows mean and 95% CIs for ICP, CPP, and PRx separated by GOS outcome groups. PRx was the only traditional intracranial variable in this early monitoring period that showed significant difference across disability groups (p = 0.039). Those that died had a significantly more positive PRx than those that had good outcome (p = 0.013).
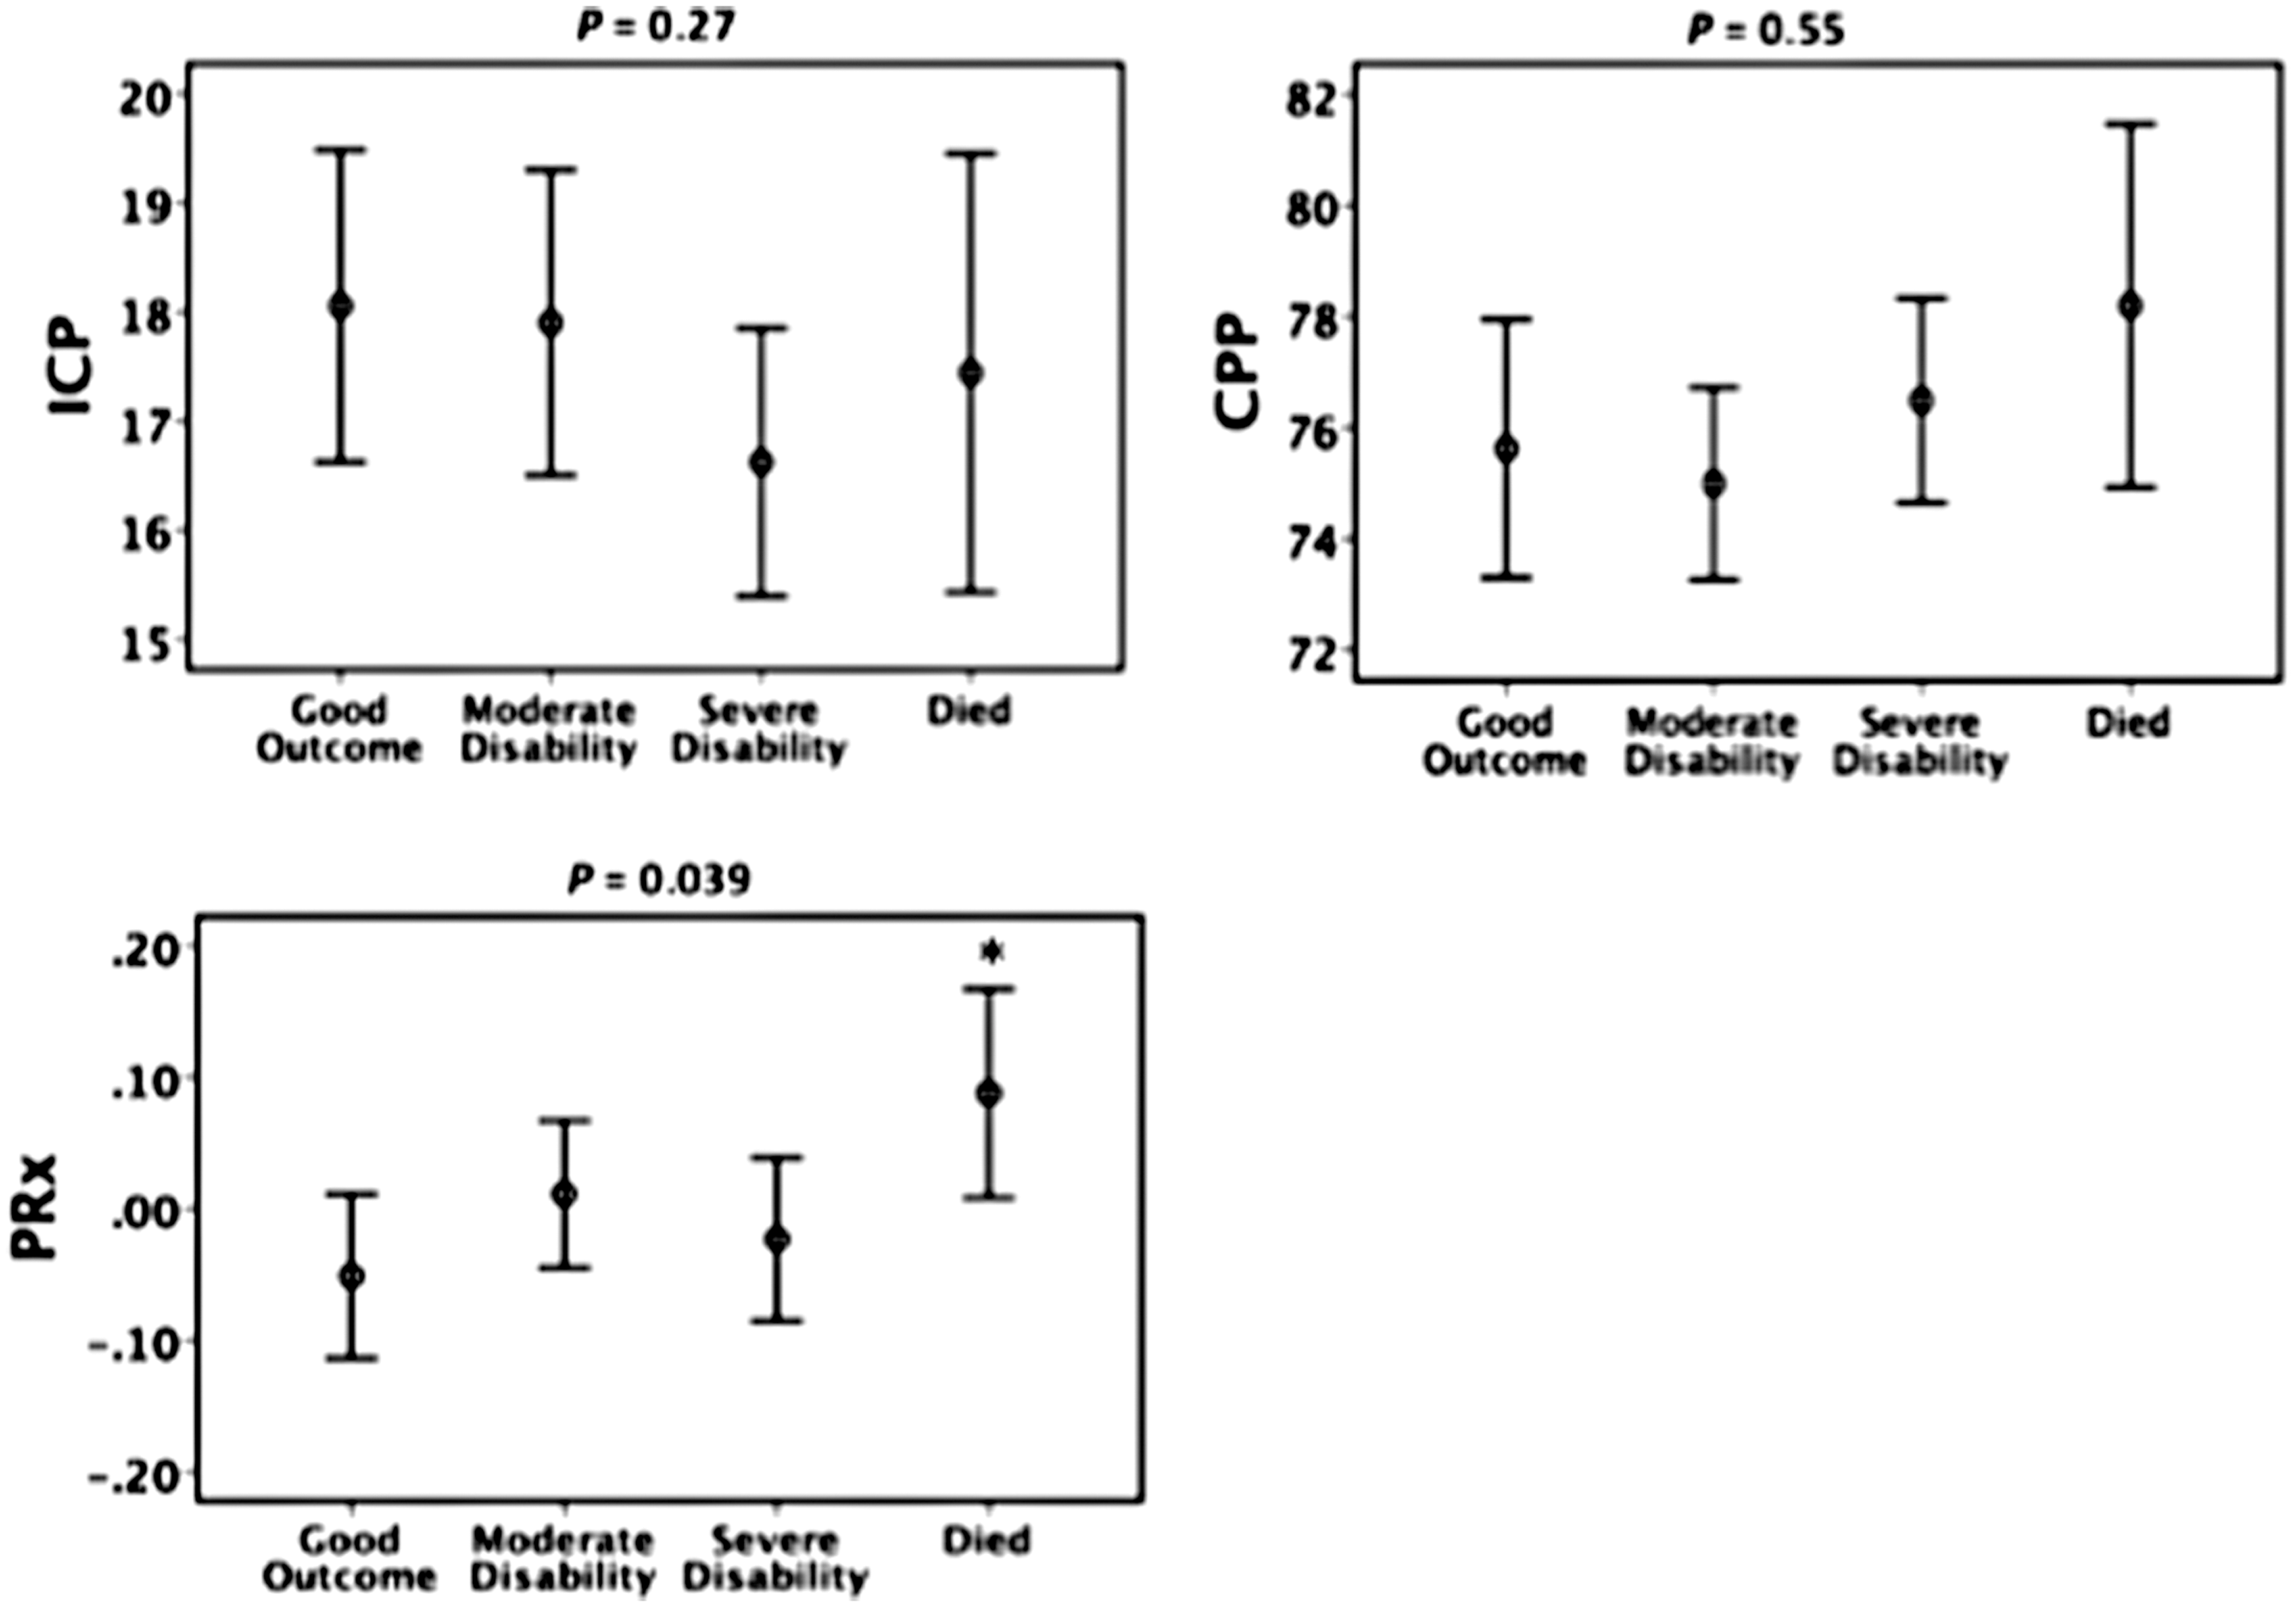
Traditional intracranial variables separated by Glasgow Outcome Score disability groups. 95% confidence interval error bars. p values on each graph are generated from the Kruskal-Wallis nonparametric test for differences across all four groups. Symbol (*) represents significant difference (p < 0.05) between survived and died groups using the Mann-Whitney U test. Adjusted for multiple comparisons. ICP, intracranial pressure; CPP, cerebral perfusion pressure; PRx, pressure reactivity index.
Figure 3 shows mean and 95% CIs for GC variables separated by GOS outcome groups. There were significant differences between groups for ICP-to-MAP (p = 0.008), MAP-to-ICP (p = 0.015), and HR-to-ICP (p = 0.039) using the independent-samples Kruskal-Wallis test with correction for multiple comparisons. Those who had poorer outcome appeared to have lower GC, suggesting a less connected network. Figure 4 shows GC for ICP-to-MAP (p = 0.006) and HR-to-ICP (p = 0.004) causation to also be significantly smaller in those that died compared to those who survived. Whereas patients with “good outcome” had significantly higher GC than all other groups for MAP-to-ICP (Fig. 3), this was not observed when outcome was dichotomized for mortality. ICP-to-HR was also lower in those that died, but was not significant (p = 0.06). There was no statistical significance found when we compared favorable and unfavorable outcome groups (dichotomization not shown).
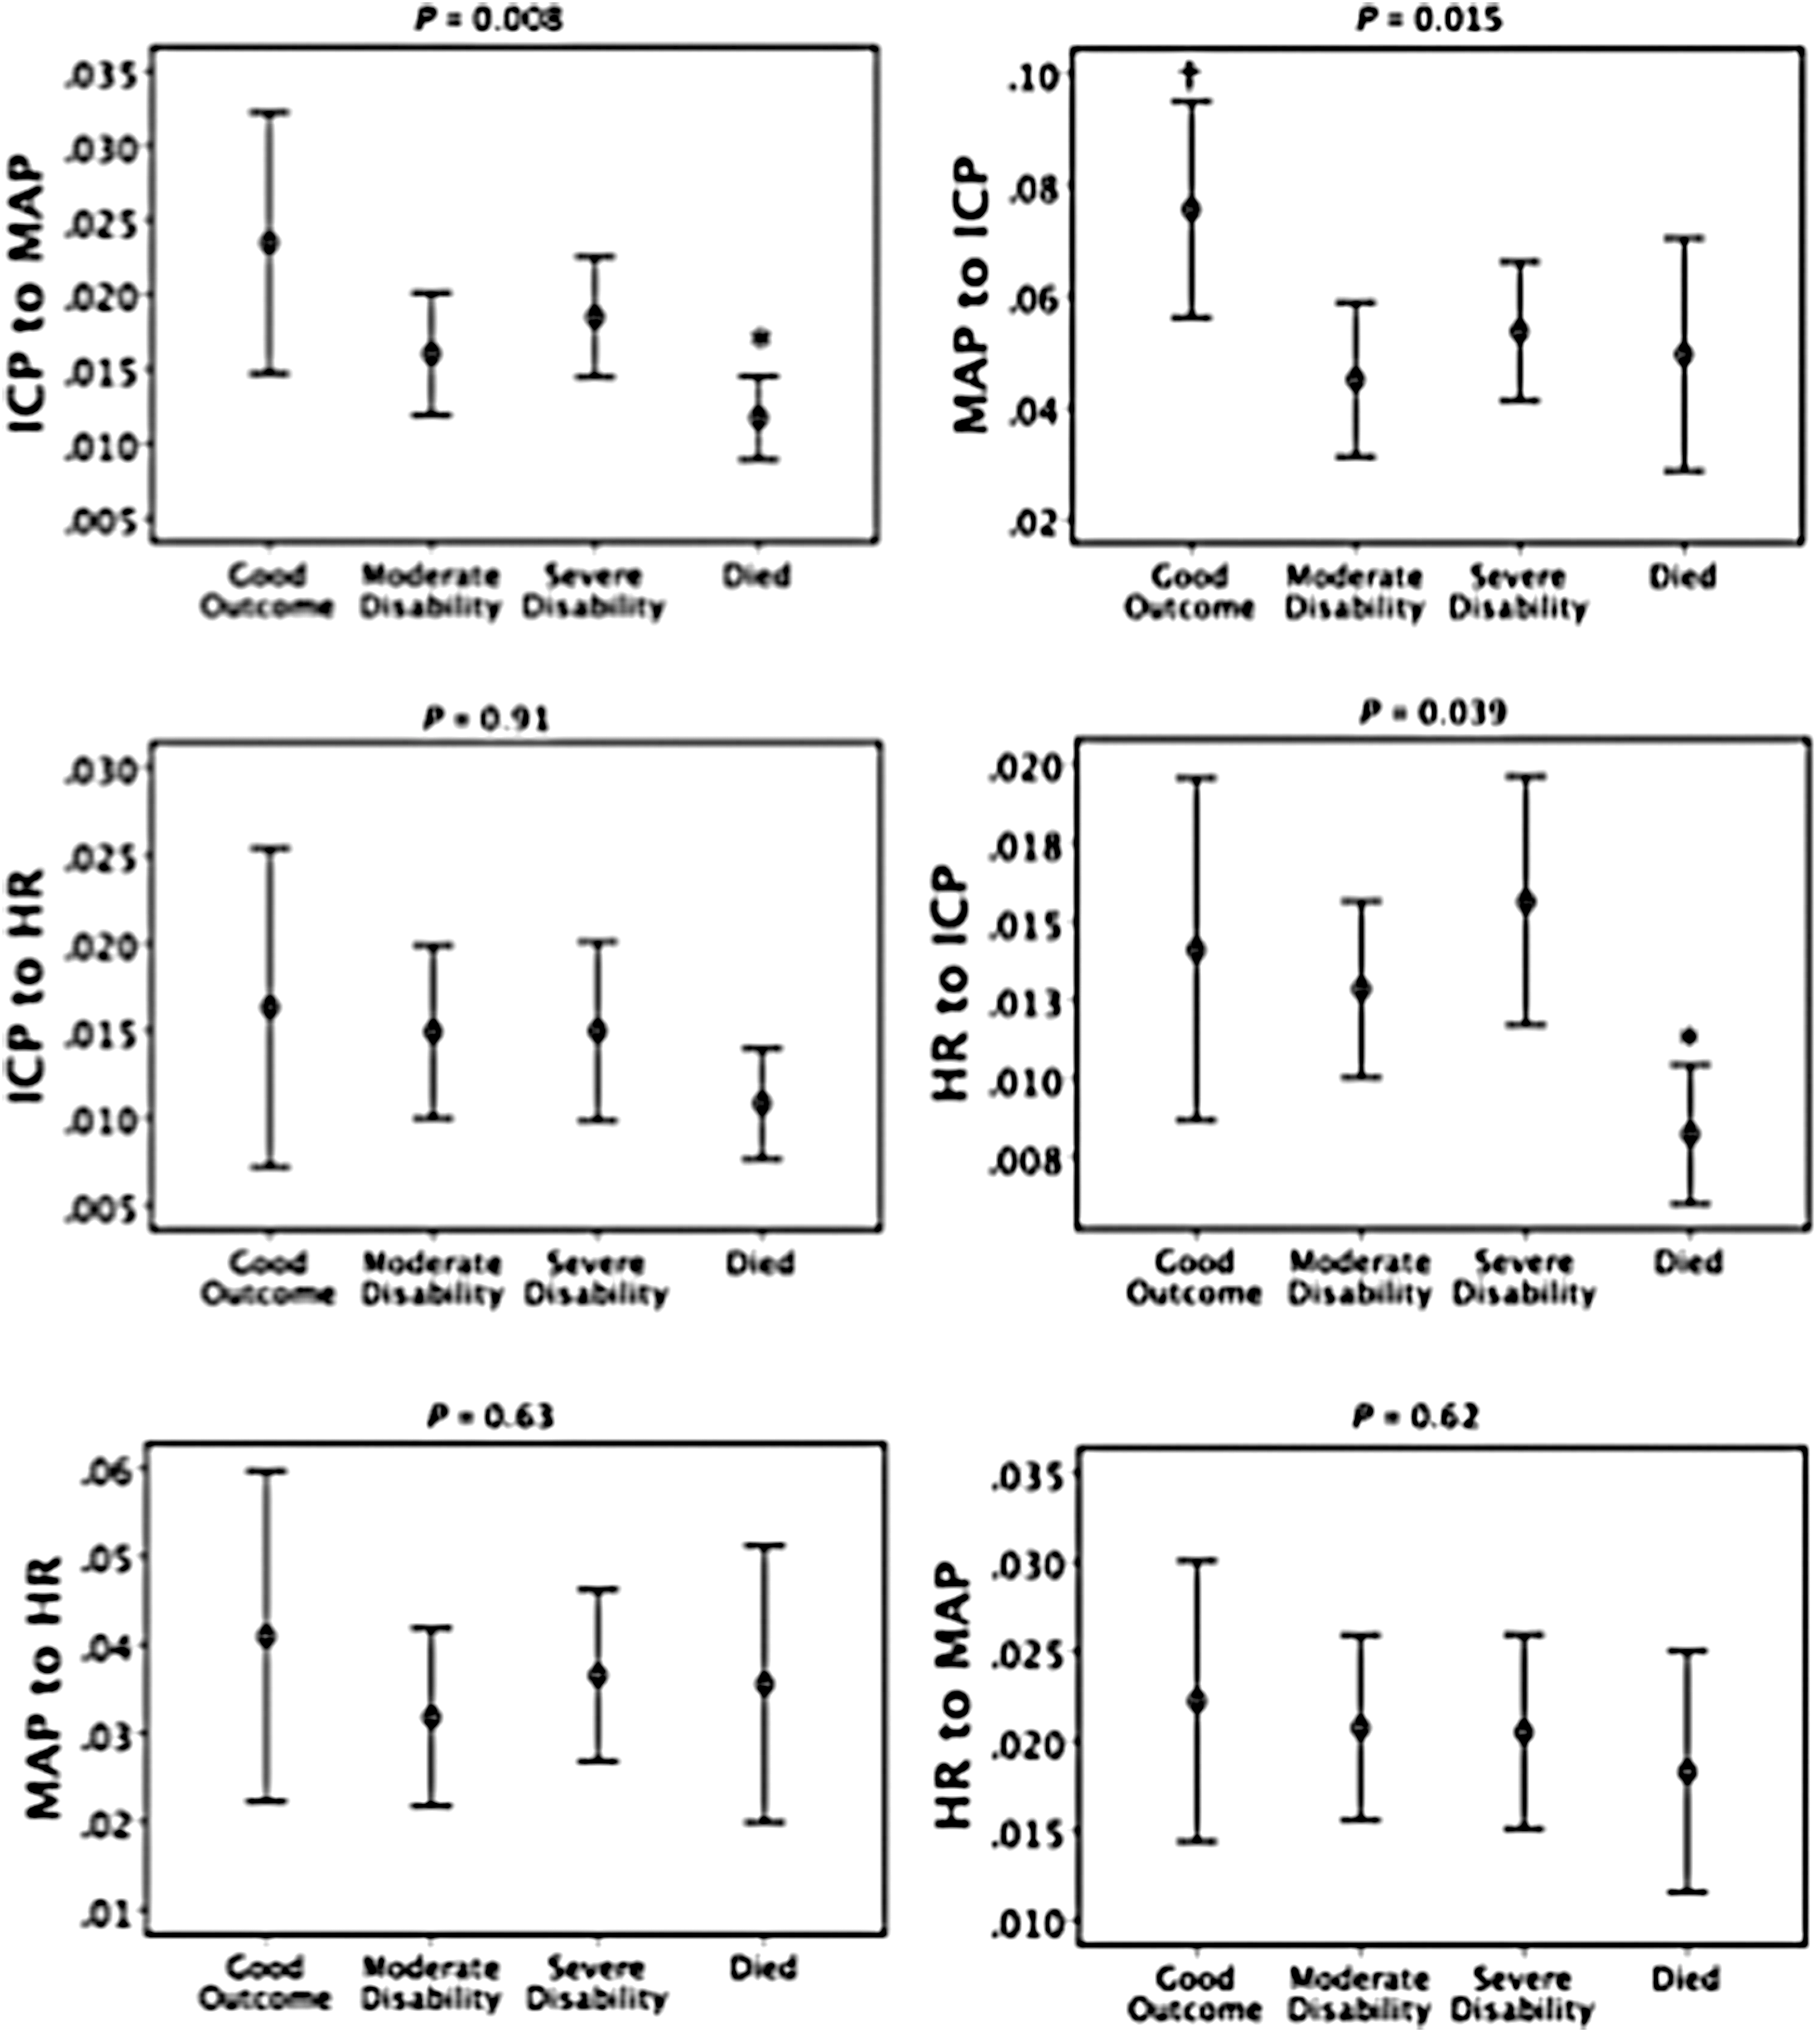
Granger causality variables separated by Glasgow Outcome Score disability groups. 95% confidence interval error bars. p values generated for differences across all four groups using the Kruskal-Wallis nonparametric test. *Significant difference (p < 0.05) between survived and died groups. †Significant difference (p < 0.05) compared to all other groups, both using the Mann-Whitney U test. Adjusted for multiple comparisons. ICP, intracranial pressure; MAP, mean arterial pressure; HR, heart rate.
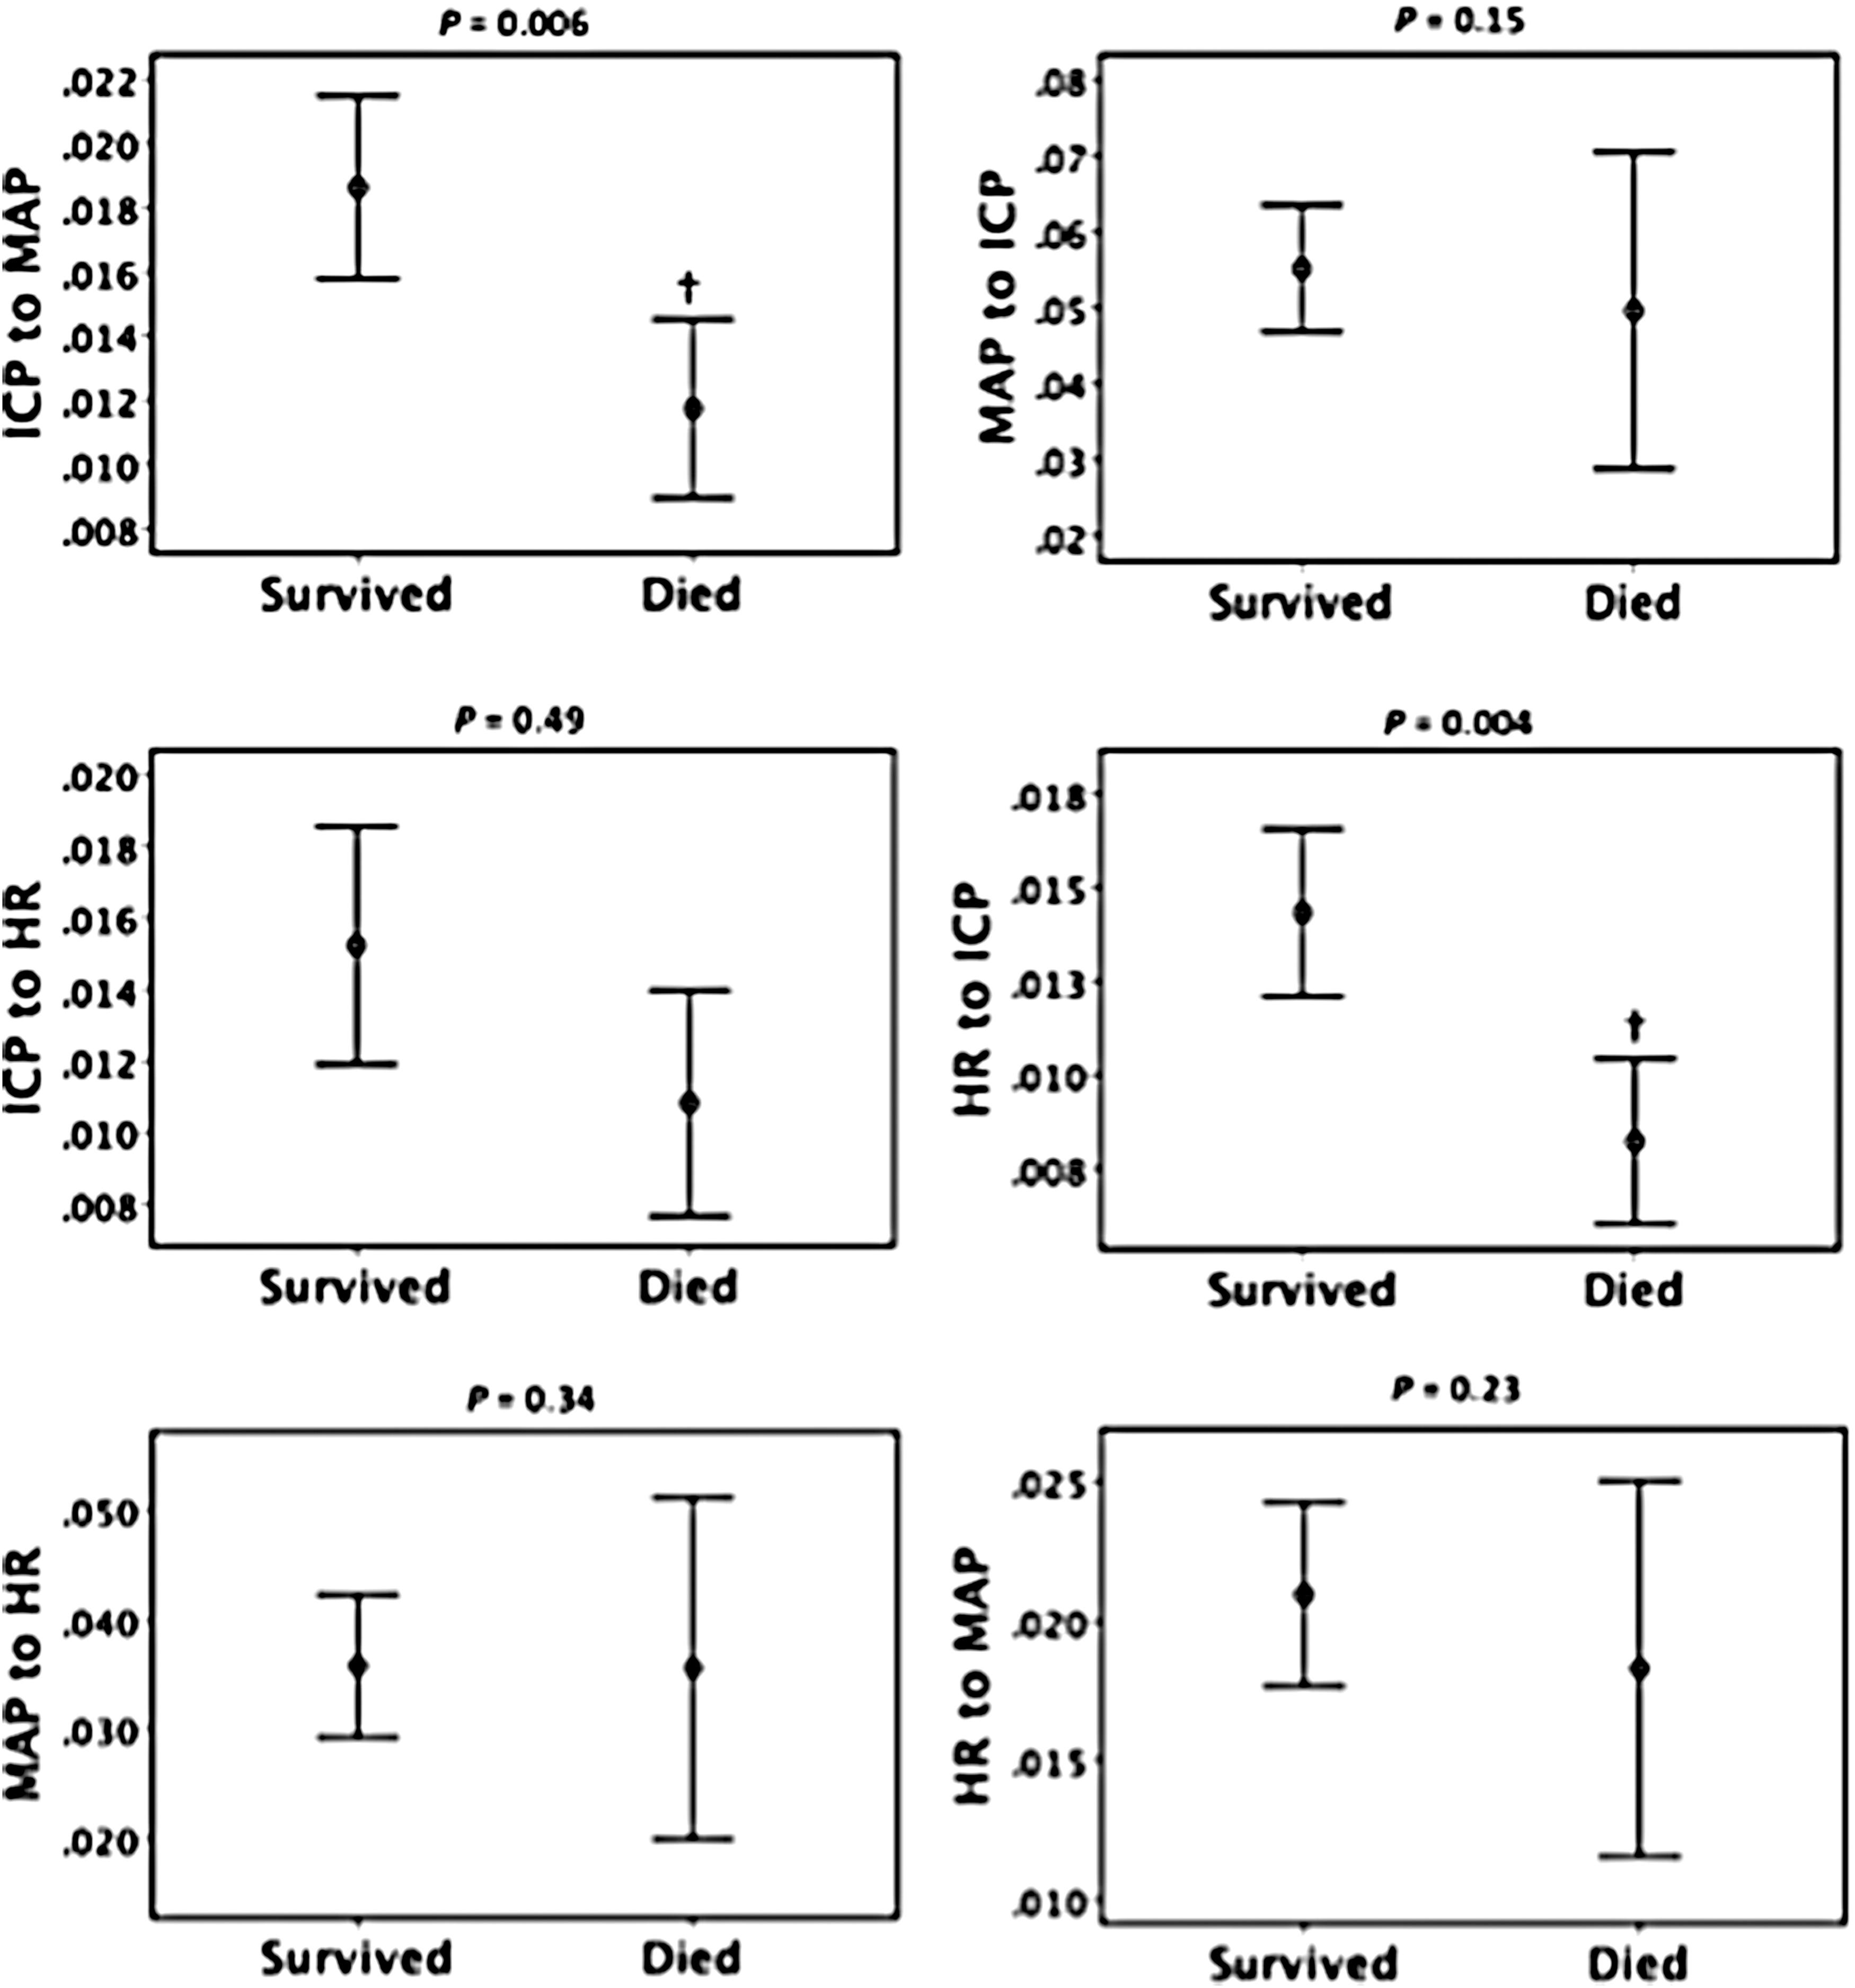
Granger causality variables separated by death versus survived. 95% confidence interval error bars. Symbols represent significant difference between survived and died groups using Mann-Whitney U test. † p < 0.01 (exact p value shown above each graph). Adjusted for multiple comparisons. ICP, intracranial pressure; MAP, mean arterial pressure; HR, heart rate.
Cardio-cerebral causality as an independent predictor of mortality
Using multivariable logistic regression we identified age and GCS ≤8 and PRx as significant predictors of mortality and favorable outcome when GC excluded from analysis (Table 3, left-hand column). Again in this monitoring period, ICP, CPP, MAP, and HR were not significant predictors. In a forward-conditional model, we confirmed ICP-to-MAP and HR-to-ICP as independent predictors of mortality (with specificity set at 80%, sensitivity was 60% with GC and 47% without,) suggesting that there is distinct information provided by GC data (Table 3, right-hand column). However, no GC variables were found to be significant predictors of favorable outcome (data not shown).
Granger causality variables.
GCS, Glasgow Coma Scale; PRx, pressure reactivity index; ICP, intracranial pressure; MAP, mean arterial pressure; HR, heart rate; NA, not applicable; OR, odds ratio; CI, confidence interval.
Correlation between causality and the pressure reactivity index
Only the GC for MAP-to-HR was strongly correlated with PRx (Fig. 5; r = −0.322; p = 0.0001), indicating lower connectivity during impaired cerebral autoregulation (high, positive PRx). No correlation was noted between ICP-to-MAP or HR-to-ICP and PRx.
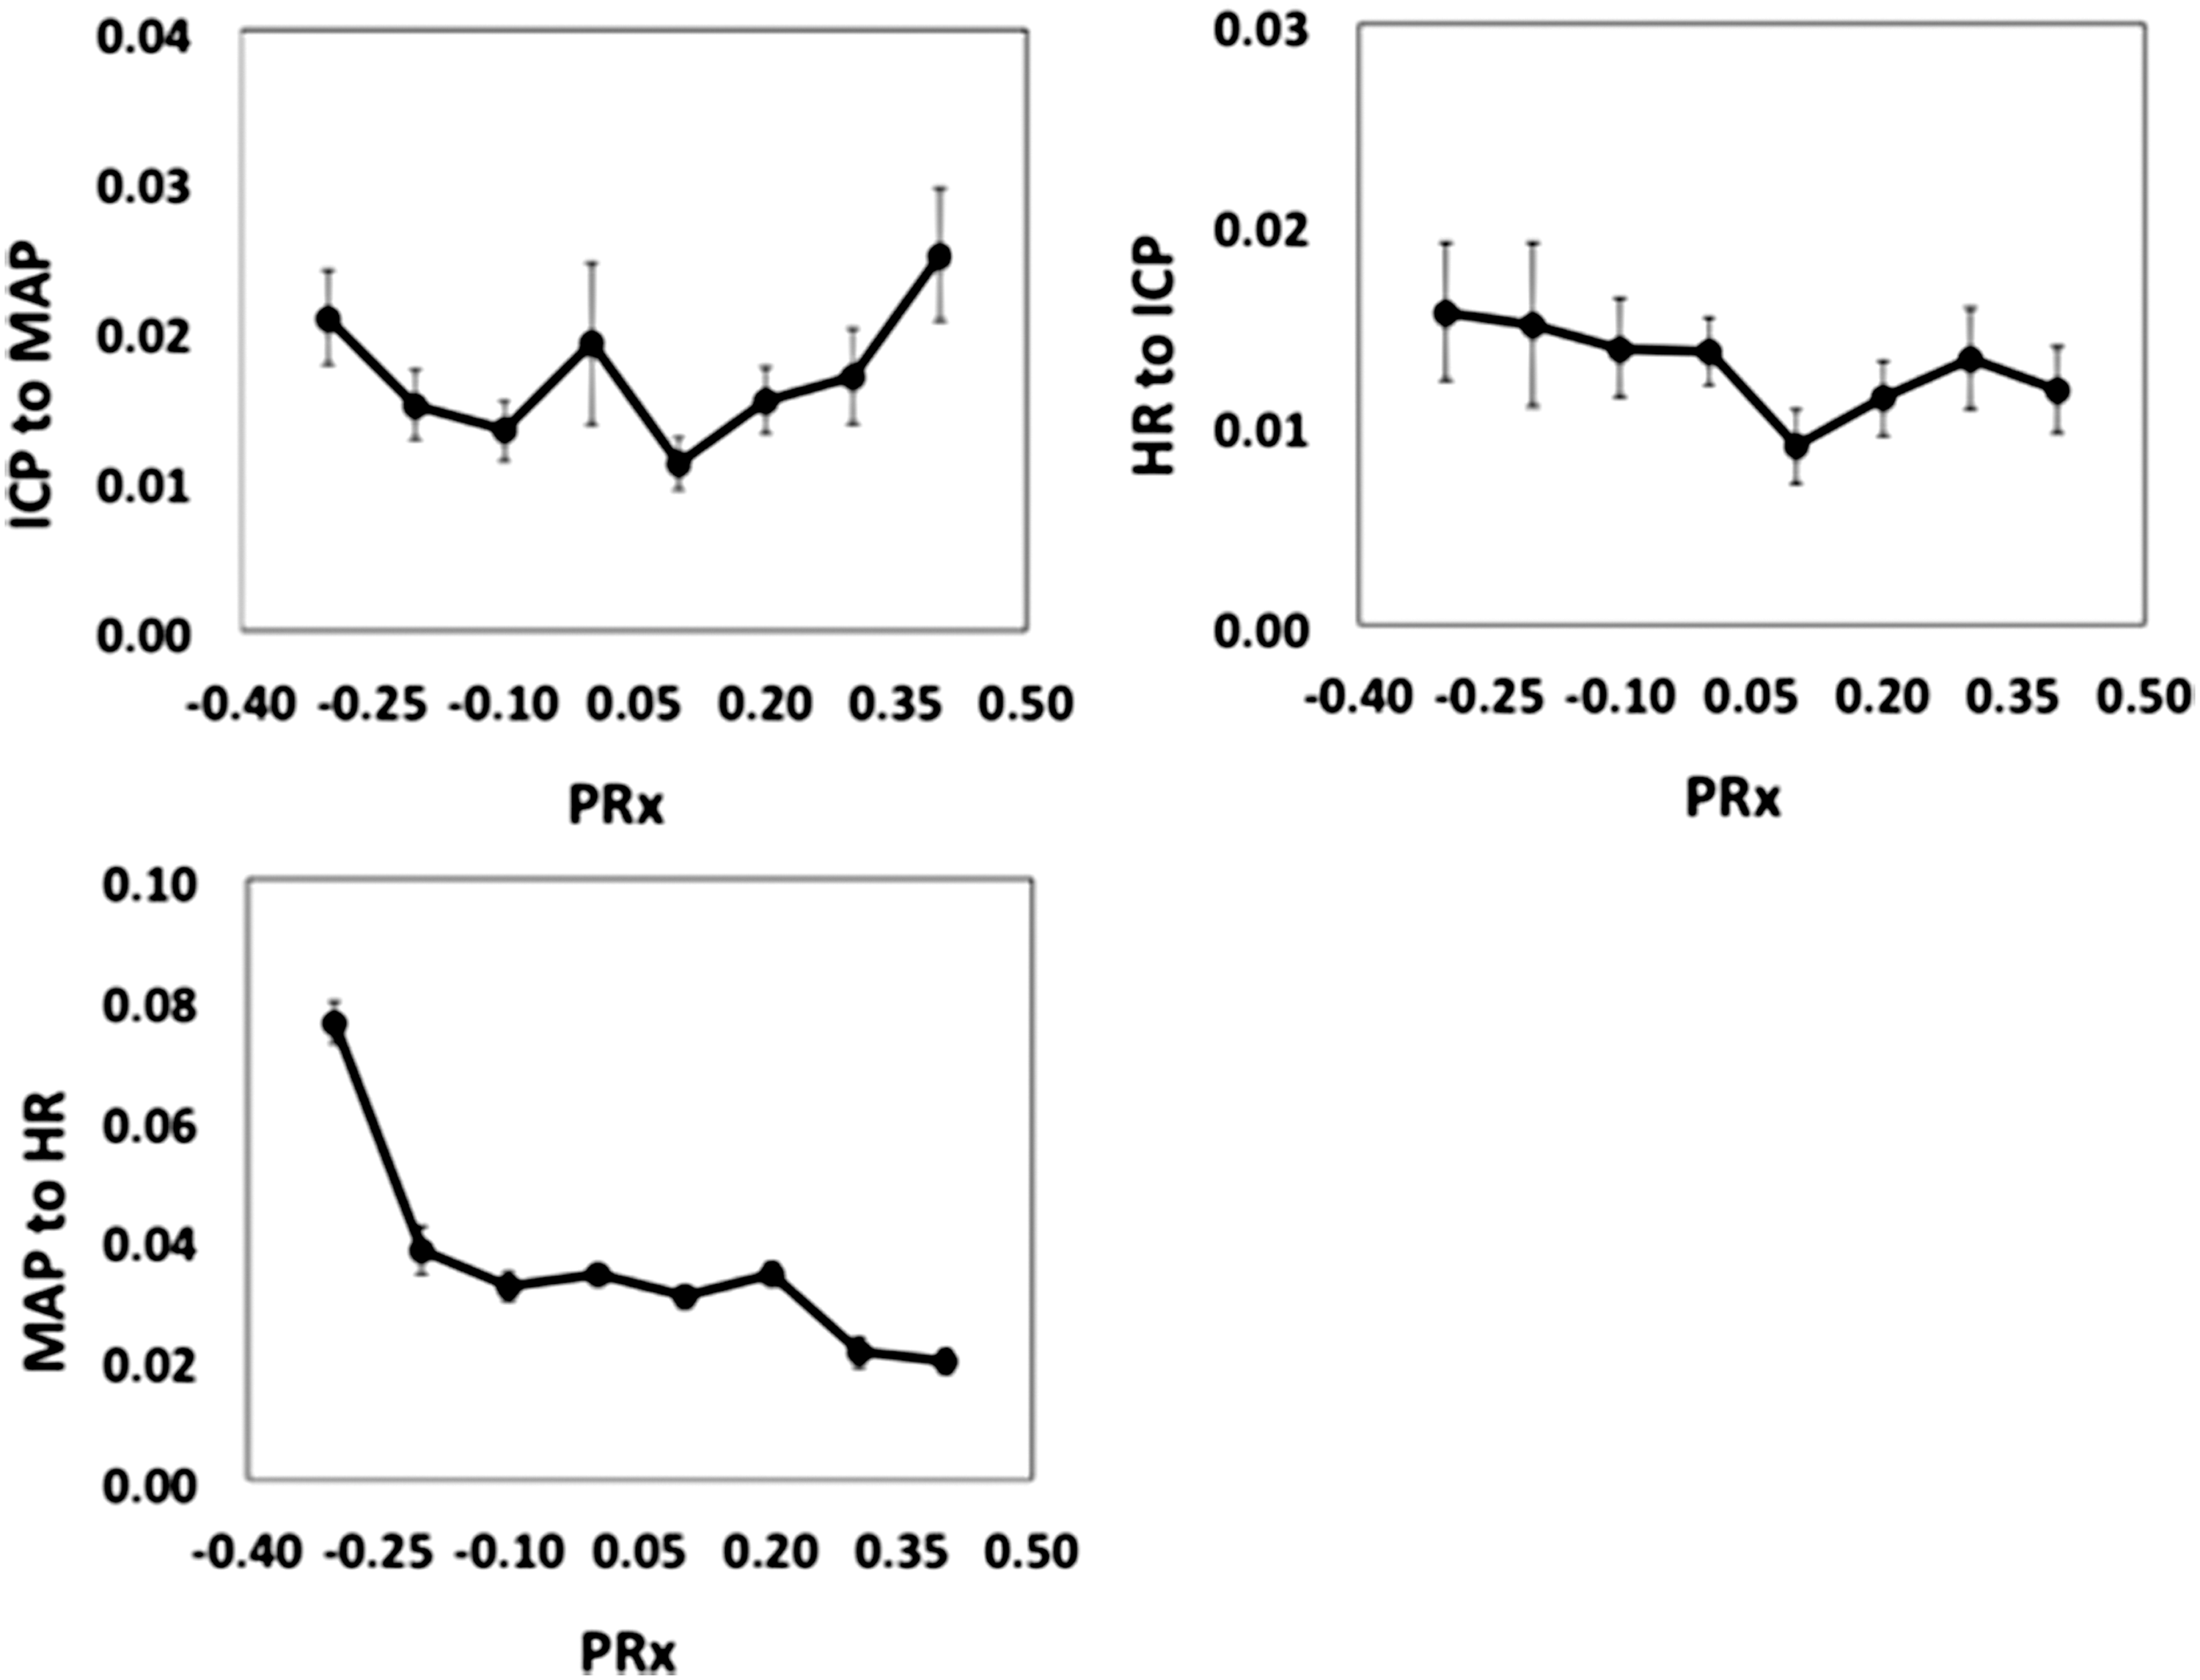
Empirical regression plots between Granger causality and pressure reactivity index (PRx). Results are mean ± standard error of the mean. ICP, intracranial pressure; MAP, mean arterial pressure; HR, heart rate.
Discussion
To our knowledge, this is the first study that examines how the cerebrovascular, cardiovascular, and autonomic nervous systems causally interact as a complex network and its implications to outcome in patients after severe TBI. The bidirectional or strong unidirectional interaction dominated by the MAP in the system, as captured by conditional GC analysis, may reflect mechanisms of causal information flow between the three systems. When compared with outcome, GC for ICP-to-MAP and HR-to-ICP were significantly lower in those who died and were independent predictors of mortality unique from age, GCS, and PRx, an example of the biological consequences of disruption in network information flow.
MAP dominates as the main causal driver to ICP and HR in keeping with recent evidence, 7 and may be a reflection of abnormal vasoreactivity and baroreceptor sensitivity following acute brain injury. When cerebral autoregulation is defective, ICP tends to correlate passively with MAP (positive PRx). 36 When patients were separated into those with intact (negative PRx) and those with disrupted cerebral autoregulation (positive PRx), MAP remained the dominant causal influence to ICP. The strong influence of MAP supports evidence that outcome is sensitive to individualized CPP, 37 the difference between MAP and ICP. Whereas we found significant differences between all GOS groups for ICP-to-MAP (p = 0.008) and MAP-to-ICP (p = 0.015), only ICP-to-MAP separated those who survived from those who died (p = 0.006). More severely injured patients may have had reduced capacity for cerebral influence of the cardiovascular system. Alternatively, the cardiovascular system was perhaps at the limit of its capacity in terms of trying to maintain homeostasis (either physiologically or because of need for critical care support) where no further influence was possible.
It is no surprise that MAP should influence HR, and vice versa, given the direct relationship between MAP and cardiac output (HR and stroke volume product). In response to changes in MAP, baroreceptor function provides the afferent signals in a negative-feedback circuit in the medulla that maintains MAP at normal levels. Interestingly, MAP is a significantly stronger causal inference to HR when cerebral autoregulation is intact (negative PRX), suggesting overlap in regulatory circuits in the brain for both the ANS and the cerebral vasculature. However, no correlation was found between magnitudes of causality (between MAP and HR) with outcome in either direction. Adequate cardiovascular resuscitation in the intensive care unit (ICU) or preserved peripheral baroreceptor function may have played a role; given that recent studies have been able to show reduced cardiovascular complexity (individually for MAP and HR) 8 and autonomic impairment 2 predicting poor outcome in TBI, this may not tell the entire story. Whereas the strong inverse correlation between MAP-to-HR and PRx merits further examination, we know, at least from these results, that simply examining cardiovascular connectivity alone, at least in an early 24-h period, is insufficient as a signal for outcome.
The significant bidirectional casual influence for HR and ICP, unlike for MAP and ICP, did not establish one direction as dominant in terms of causal influence (p = 0.85). Rather than peripheral, central baroreceptor function as a mediating mechanism may be involved. There is evidence that pathological ICP post-TBI alters baroreceptor function in rodents 38 and humans, 39 with pathologically hemispheric lesions post-stroke also impairing this important function. 40 Extreme ICP elevations cause severe bradycardia and systolic hypertension, by the well-known Cushing reflex. In the setting of normal pressure hydrocephalus, interdependence has been shown between ICP and the intervals between consecutive normal sinus heart beats (RR interval). 41 Certainly, ICP regulation has been linked to common areas, such as the brainstem 42 and hypothalamus, 43 areas thought to be important intracranial centers for ANS control. A recent study in healthy volunteers using fMRI, HR and respiratory variation demonstrated a causal role of the amygdala, hypothalamus, brainstem, and, among others, medial, middle and superior frontal gyri, superior temporal pole, paracentral lobule, and cerebellar regions in modulating the central autonomic network using GC analysis. 10
The observation of HR influencing ICP may seem nonintuitive at first, but we believe there may be direct and indirect mechanisms. One mechanism could be changes in HR, and therefore cardiac output may briefly alter blood CO2 levels in the cerebral vasculature, thereby influencing ICP with a time lag. Further, changes in HR alter time in diastole and hence subtlety changing compartmental blood or cerebrospinal fluid (CSF) volumes. Post-SAH, significant causal influence from HR to ICP was found in the first 96 h and bidirectional causality from days 4 to 7. 7 Autonomic impairment, as measured by HR variability and baroreflex sensitivity, was shown to be independently linked to mortality post-TBI. 2 In this study, the GC was significantly lower for HR-to-ICP (p = 0.039) in those that died and lower for ICP-to-HR, although not reaching significance (p = 0.06); this either reflects an underpowered study, or simply that severe TBI asymmetrically disrupts information flow such that the complex cerebrovascular system is exquisitely more sensitive to the influence of the ANSs than vice versa.
We confirmed in a multi-variate logistic regression that GC for ICP-to-MAP and HR-to-ICP were significantly lower in those who died and independent predictors of mortality unique from age, GCS, and PRx. Our findings suggest that GC is revealing additional clinically important information through exploring directional information flow in TBI. This could be interpreted as a breakdown of network behavior and therefore explains the impaired homeokinesis and reduced fluctuations in the most seriously injured patients. 8 Despite this, a certain degree of caution is necessary when interpreting these results. In reality, one cannot establish the exact underlying mechanisms and future work is being conducted to tease out why only certain disruptions to information flow matters more to others. Moreover, the inability of GC analysis, at least at this sample size, to separate favorable/unfavorable outcome suggests that the relationship to outcome may not be continuous. Both a strength and drawback to studies similar to this is the potential to provide insight into pathophysiology when there exists no ground truth regarding what is truly happening at a fundamental anatomic level to confirm one's observations, given that the damaged cardio-cerebral system evolves post-ictus.
Although technical in nature, the emergence of connectivity analysis in complex networks may be of central importance in a multisystem disease like TBI. Much like our everyday airport systems, there are both regional and hub “nodes,” where a degree of complexity and connectivity ensures efficient flight paths (i.e., information transfer). For example, poor weather at a regional node may inconvenience local travelers, but a snowstorm at a hub often leads to widespread and crippling consequences to the entire network. In the setting of these results, we see the ICP, MAP, and HR as perhaps surface-level hubs, emanating from multiple, hidden subnetworks, and only disruption to causal information flow involving the brain-specific ICP hub (ICP-to-MAP and HR-to-ICP) was significantly associated with TBI mortality. The pressure in the system (i.e., MAP) can perhaps be seen as a “dominant” hub. Though this makes physiological sense, it remains to be seen whether this is specific to TBI patients.
Clinical care of TBI patients in the ICU makes available large-volume, high-density, and routinely measured time-series variables. GC is a well-established methodology in the multivariable environment of quantitative neurosciences, 21,22 and this study shows that it is possible to harness such data in TBI patients. However, GC is also one of many connectivity methodologies; different models may perform better or worse, but a full comparison of performance is beyond the scope of this exploratory study. Connectivity in neurosciences has been split into “functional” and “effective.” Functional connectivity describes statistical dependencies between variables, whether directed (GC and transfer entropy) 20,44 or undirected (correlation or coherence), whereas effective connectivity aims to frame observed data in the simplest mechanistic models, as exemplified by dynamic casual modeling (DCM), which uses Bayesian networks assesses model performance. 45 Unlike DCM, one of the main strengths to GCCA is the minimal underlying physical assumptions required by existing as a statistical description only of the data presented; this lent itself well in our case to an initial exploration of a network of signal information flow. Certainly future work may involve DCM as a complimentary tool, with its different set of assumptions, to explore interpretations of these initial observations with GCCA. 45
These observations and clear link to mortality using conditional GC analysis compels us to look further at what is left unmeasured. Longitudinal calculations in real time of the GC, with careful recording of clinical interventions and attention to the timing post-ictus, are needed to correlate potential causal information flow changes with deterioration or treatment effects such as fluid resuscitation, vasoactive drugs, or surgical decompression. Whether this can be used to direct intervention and improve outcome is unknown; further principled, and multimodal approaches to examine complex physiological networks, may shed light on secondary injury post-TBI.
Limitations
Some of the strengths of this study include the large cohort, a uniform and early time period for analysis, selection of patients with known time from ictus, at least 72 h of monitoring, and removal of large data gaps and frequent interventions within the first 24 h. We believe this allows potential for early clinical interventions, adds temporal information, allows secondary injuries to manifest and potentially be reflected in our analysis, and removes those with very short data recordings (attributed to death/futility, withdrawal of care, recovery, de-escalation of care, or withdrawal of consent) with extreme values that can skew the group trends.
However, this is a retrospective, observational study where it was not feasible to control for the effects of clinical interventions (e.g., CSF drainage, medication administration, weaning from the ventilator, or the rate of disconnection based on baseline neurological status, etc.). There is an ongoing effort to align better clinical information in future databases, especially with the advent of electronic health care records. For example, a large part of the earlier data collection period was preceding an electronic record, so many patients were limited to initial presenting GCS as a marker of severity. Although all patients were monitored on a single neurocritical care unit where therapeutic interventions were standardized, variation inevitably occurs.
The lack of a control group is also a limitation to this study. Future studies should compare our results to patients with ICP monitoring without TBI. The feasibility is a challenge given that ICP monitoring is removed before the brain is fully “normal” and ICP is much less frequently measured in non-TBI cohorts. Reassuringly, both variables (ICP-to-MAP and HR-to-ICP) predicting TBI mortality involved ICP, whereas causality between MAP and HR (without ICP) had no relation to outcome. This is despite the fact that nontraditional methods examining information content (entropy) within HR and MAP time-series data have found significant correlation to poor outcome in TBI, 8,46 whereas other groups have also shown this in non-TBI patients. 48 . Given this pattern of findings, we retain some confidence that examining causal information flow, particularly involving ICP, is specific to TBI patients.
GC analysis is based on a statistical concept and is model free; it sheds light on potential underlying mechanisms of information flow between physiological systems, but requires caution when interpreting in the clinical setting. The physiological signals as measured by ICP, MAP, or HR most likely reflect an ensemble of regulatory systems; any attempts at causality measurement can only reflect an “averaging” of these individual subunits where direct and indirect paths contribute. For this reason, proof of causality from one system to another cannot be definitive. Moreover, GC can only describe data that are presented and cannot account for unmeasured variables (whether metabolic, e.g., CO2 or biochemical) that potentially affect our measured variables. These data were not available, certainly not at the same time resolution. Fortunately, Granger looks at causality over smaller time scales than our 24-h analysis period. Whereas it is unlikely to explain the link to mortality, it is hoped that future studies will be able to account CO2 changes over the same analysis period.
Finally, causal relationships may not be static in time. For example, had ICP “caused” MAP for the first 12 h and then this direction reversed for the next 12 h (assuming the same causal magnitude), no causal relationship would have been found. Reassuringly, this does mean that any significant causality found in one direction may have been an underestimation. Further studies are needed to identify any transitions in directionality relation to existing treatment protocols, exploring more granular, temporal relationships, and in combination with other nontraditional markers of poor outcome.
Conclusion
Early causal information flow disruption between the cerebrovascular, autonomic, and cardiovascular systems is selectively associated with increased mortality after severe TBI. This was found to be independent of age, presenting GCS, ICP, and autoregulation. Conditional GC analysis for routinely measured ICP, MAP, and HR signals may reflect unique unmeasured mechanisms in the setting of secondary brain injury.
Footnotes
Acknowledgments
A.E. acknowledges the financial support of the Academy of Medical Sciences in this work.
Author Disclosure Statement
ICM+ software (