
Abstract
The definition of cerebral perfusion pressure (CPP) secondary insults in severe traumatic brain injury remains unclear. The purpose of the present study is to visualize the association of intensity and duration of episodes below or above CPP thresholds and outcome. The analysis was based on prospectively collected minute-by-minute intracranial pressure (ICP) and blood pressure data and outcome from 259 adult patients. The relationship of episodes of CPP below or above a certain threshold for certain duration with the 6-month Glasgow Outcome Score was visualized separately for episodes of active or deficient autoregulation (AR). In adults ≤65 years, an almost exponential transition curve separates the episodes of CPP associated with better outcomes from the episodes of low CPP associated with worse outcomes, indicating that lower CPP could only be tolerated for a brief time. Analysis of episodes of high CPP again showed a time-intensity dependent association with outcome. When combining the two plots, a safe CPP zone between 60 and 70 mm Hg could be delineated—however, only for AR active insults. The AR status predominantly affected the transition curve for insults of low CPP. Episodes with ICP >25 mm Hg were associated with poor outcome regardless of CPP. In the present study, the CPP pressure-time burden associated with poor outcome was visualized. A safe zone between 60 and 70 mm Hg could be identified for adults ≤65 years, provided AR was active and ICP was ≤25 mm Hg. Deficient AR reduces the tolerability for low CPP.
Introduction
T
While the relation between ICP and outcome is still rather straightforward, however, guidelines on blood pressure management in severe TBI seem more difficult to produce. Cerebral perfusion pressure (CPP) is the driving force of cerebral blood flow, expressed as the difference between the mean arterial blood pressure (MAP) and ICP. Within a certain range of CPP, the cerebral vasculature has the ability to maintain constant cerebral blood flow, which is—among others—based on alterations in basal tone and subsequent diameter changes of pial arterioles. 8 This capacity for “pressure AR” can be deficient after TBI. 9 Moreover, with intact AR, low CPP can induce a vasodilatory cascade resulting in raised ICP.
The latter phenomenon led Rosner and associates 10 to formulate the recommendation that CPP in severe TBI situations should be kept above 70 mm Hg. This concept, however, could not be demonstrated to produce better outcomes in a randomized controlled trial. 11 At the same time the Lund concept, which emphasized avoidance of the use of vasopressors and accepted CPP down to 50 mm Hg for adults, did not result in poorer outcomes. 12 An explanation for this apparent paradox was sought mainly in the dynamic, and hence more complex, behavior of pressure AR capacity or deficiency after TBI. 13,14
Real-time monitoring of cerebrovascular pressure reactivity through parameters such as the Pressure Reactivity Index (PRx) 14 or Low frequency Autoregulation Index (LAx) 15 has enabled the identification of CPP ranges in which AR is more active, 15 –17 and in retrospective series, higher percentages of time of actual CPP contained within these zones were associated with better outcomes. 15,18 At present, pressure reactivity monitoring is predominantly performed in centers with a research interest in severe TBI.
In the latest version of the Brain Trauma Foundation guidelines, the chapter on CPP thresholds is limited to a level IIB recommendation that the CPP value to target lies within the range of 60 to 70 mm Hg. 6 For a parameter subject to variability such as CPP, however, it may be helpful to the clinician to have more insight into the burden on outcome of CPP insults in terms of severity and duration.
The aim of the present study is to assess the effect of CPP insults, according to varying definitions of intensity and duration, on functional outcome at six months based on prospective data from continuously monitored adult patients with severe TBI. In addition, the impact of ICP, cerebrovascular AR, age, and decompressive craniectomy (DC) on the capacity to tolerate the CPP insults is investigated.
Methods
Patients and data
The study population consisted of 259 patients with severe TBI aged 16 years and older: • There were 164 patients included from the Brain-IT database,
19
a multicenter data collection between March 2003 and July 2005 (Newcastle, Uppsala, Monza, Leuven, Heidelberg, Iasi, Barcelona, Leipzig, Kaunas, Turin, Novara, Vilnius, Milan, Glasgow, Mannheim, Edinburgh, Southampton, Cambridge, Zurich, London, Göteborg). The Multi-Centre Research Ethics Committee for Scotland MREC/02/0/9 granted the use of these data for scientific purposes on February 14, 2002. • The data of the remaining 95 adult patients were collected from four centers: 38 from the San Gerardo Hospital in Monza, Italy, between March 2010 and April 2013; 25 from the University Hospitals, Leuven, Belgium, between September 2010 and September 2013; 20 from the University Hospital, Antwerp, Belgium, between May 2010 and June 2013; and 12 from the University Hospital, Tübingen, Germany, between February and December 2009. Local Ethical Committee approval to use the anonymized data for this analysis was obtained in all centers.
Data collection included baseline risk factors (age, sex, admission Glasgow Coma Score (GCS), admission pupil reactivity), and minute-by-minute ICP and MAP monitoring data. Monitoring data were recorded in minute-by-minute resolution through specifically designed “BrainIT data collection software” for the BrainIT study. 19 For the later cohort, data were recorded through the centers' Patient Data Management System, in minute-by-minute resolution in Leuven, Tübingen, and Monza, and in second-by-second resolution in Antwerp. For the Antwerp patients, the median value per minute was used in this analysis. Minute-by-minute signals from all data sets were reviewed independently by two senior clinicians in Leuven (GM, BD), and obvious artifacts at visual inspection of data traces were removed.
Finally, a correction of the CPP values for arterial blood pressure transducer height was made based on the information that was obtained on the height of the arterial blood pressure transducer and of the head of the bed. For patients in whom the transducer was at cardiac atrium level and who received nursing care with the head of the bed elevated at 30 degrees, 10 mm Hg was subtracted from the registered CPP. This was the case in 101/259 patients (39.0%).
To investigate the effect of DC and old age on the capacity to tolerate CPP insults, the analyses were performed separately for three groups: patients ≤65 years who did not undergo DC (n = 179), patients >65 years who did not undergo DC (n = 35), and patients ≤65 years who underwent DC (n = 37). The details of the three groups are presented in Table 1. The group of patients ≤65 years who did not undergo DC was considered the standard group on which the analyses assessing the effect of AR and ICP were performed (see below).
Non-valid data were because of monitor disconnections, data loss during patient transport. or artefacts removed manually.
DC, decompressive craniectomy; LOS, length of stay; IQR, interquartile range; GCS, Glasgow Coma Scale; CPP, cerebral perfusion pressure; GOS, Glasgow Outcome Scale.
Outcome
Functional outcome was assessed at 6 months in all centers using the Glasgow Outcome Score (GOS). 20
Visualization method
The method developed in our group for visualizing the univariate association between insult and outcome and that was used for assessing the pressure and time burden of intracranial hypertension in Güiza and colleagues 7 was applied in the current analysis investigating the relationship between CPP and outcome. For CPP, two types of insults are defined: insults characterized by CPP dropping below a certain pressure value for a certain duration of time as well as insults characterized by CPP exceeding a certain pressure value for a certain duration of time. Hence, the visualization was performed separately for insults of low CPP and insults of high CPP. The Pearson correlation coefficient between the number of insults of a certain intensity and duration and GOS was expressed by a graded color code: negative correlations in red (−1 in dark red) and positive correlations in blue (+1 in dark blue). The contour for zero correlation was highlighted in black and defined as the “transition curve.” For more details about the visualization method, we refer to Güiza and coworkers. 7 Analytic routines were programmed in Matlab® (MathWorks Inc, Natick, MA).
Role of cerebrovascular pressure reactivity expressed by LAx
The LAx, expressing cerebrovascular pressure reactivity as an indicator of pressure AR, is calculated as the moving median of the correlation coefficients between ICP and MAP for the past time intervals of 3, 5, 10, 20, 30, 60, and 90 min, using minute-by-minute resolution data. 15 The LAx was calculated at every minute during the monitoring period and average LAx for every CPP insult period, which allowed for discriminating CPP insults associated with “active” AR (if average LAx <0) or “passive” AR (if average LAx ≥0). Hence, the relationship between CPP insults and outcome was visualized separately considering active or passive episodes exclusively.
Role of ICP
The relationship between CPP insults and outcome was visualized separately for CPP insults associated with average ICP ≤25 mm Hg and for CPP insults associated with average ICP >25 mm Hg to examine the relative effect of ICP and CPP insults on outcome. The value of 25 mm Hg was chosen as the discriminator because ICP above 25 mm Hg was associated with poor outcome independent of the insult duration in our ICP article. 7
Multivariate analysis
Multivariate logistic regression models for death were calculated to investigate the independent association of the cumulative dose of CPP insult burden with outcome. Therefore, the percentage of total monitoring time each patient had CPP insults associated with worse GOS (i.e., time spent in the red zone) was used as an independent variable, together with the IMPACT model core variables age, pupils, and admission Glasgow motor score. 21 The percentage of monitoring time spent in the red zone was based on a new calculation, in which for each patient, for every minute of monitoring it was checked whether this minute fulfilled criteria of belonging to one or more of the several episodes negatively associated with outcome (i.e., red zone). The time in the red zone was then divided by the total monitoring time of that patient.
Impact of CPP policy
The database contains patients treated before and after the publication of the third revision of the Brain Trauma Foundation guidelines in 2007, in which the recommendation to aim at CPP higher than 70 mm Hg was abandoned. 22 To assess whether CPP policy confounded the current analysis, the median of the patients' median CPP was calculated per center. For the two centers that contributed data to the cohort before and after 2007, the median was calculated separately for the patients of both periods. Next, the visualization method was applied separately for centers with a median CPP below and above 70 mm Hg to assess its validity independent of CPP policy.
Results
For adults ≤65 years who did not undergo DC (n = 179), the visualization of the association between GOS and the intensity and duration of CPP insults is shown in Figure 1. In both instances (Fig. 1a and Fig. 1b), a blue zone (representing episodes of CPP associated with higher GOS) and red zone (representing episodes of CPP associated with lower GOS) can be observed, separated by a sharply demarcated transition curve. Figure 1a shows that insults below a certain threshold were associated with worse outcomes and that the lower the CPP value, the shorter the duration they could be tolerated.
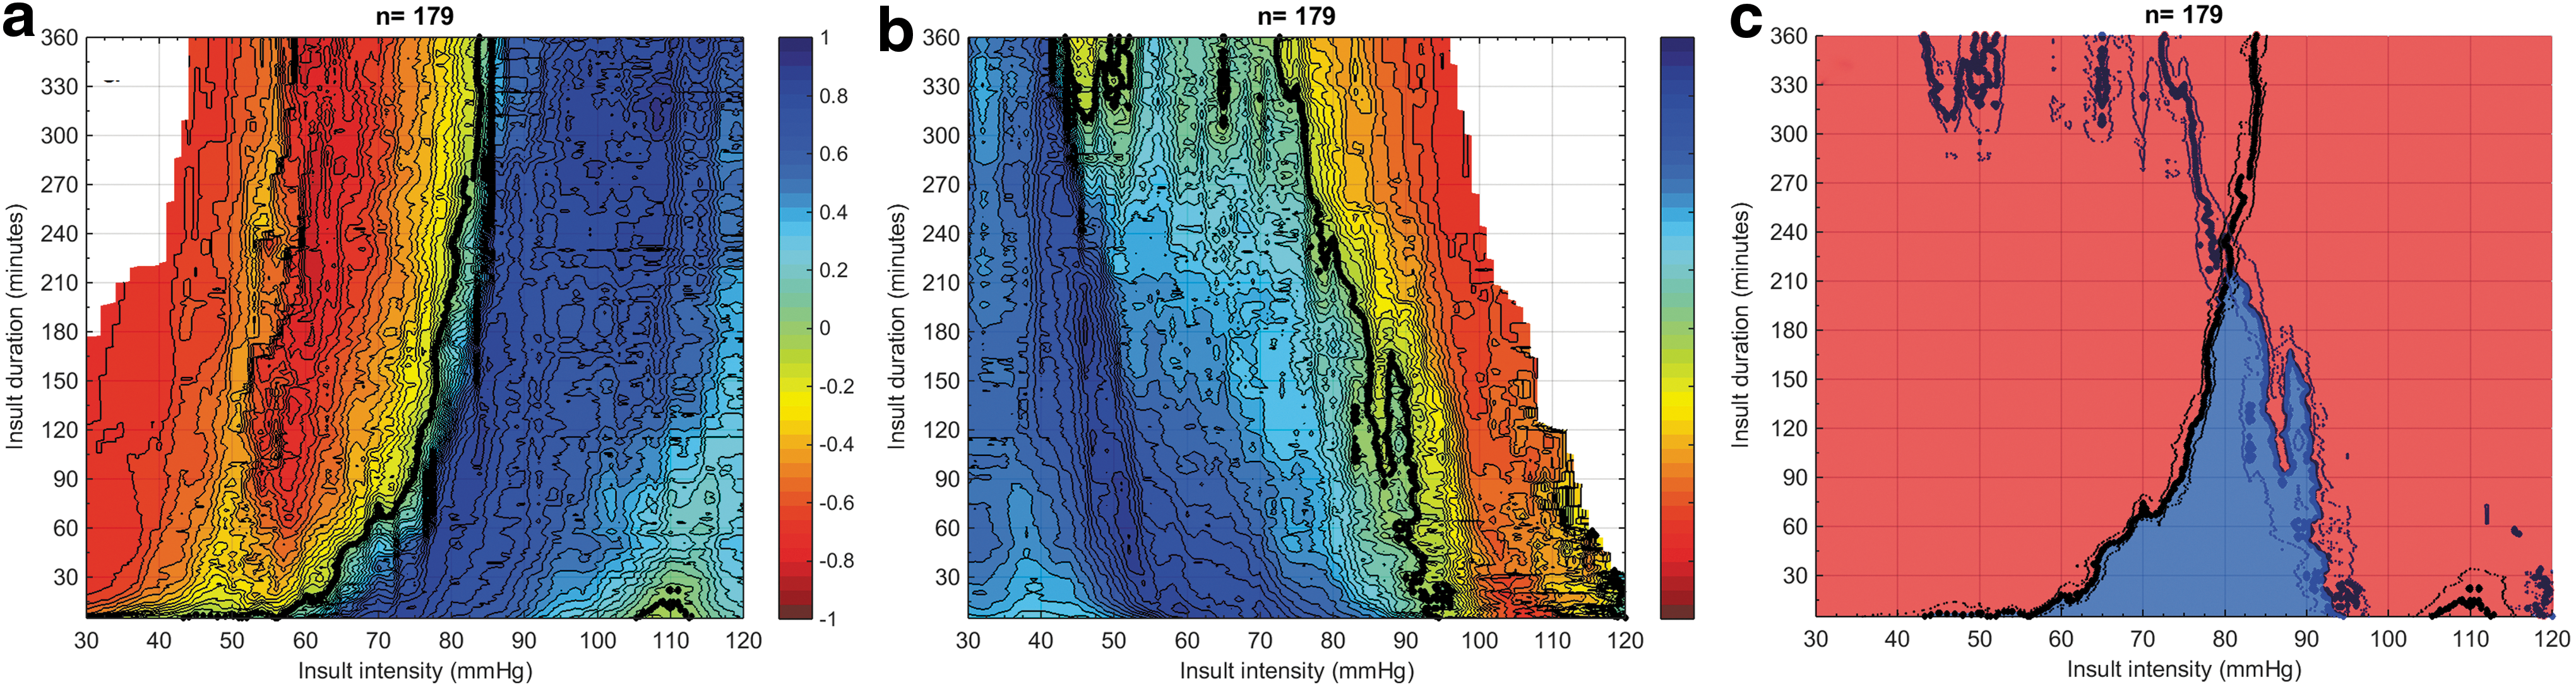
Visualization of correlation between the Glasgow Outcome Score (GOS) and average number of cerebral perfusion pressure (CPP) insults per GOS category for adults ≤65 years without decompressive craniectomy, n = 179. Each dot in the graph represents a CPP insult—i.e., an episode of CPP defined by an intensity threshold (X-axis) and a certain duration (Y-axis). The univariate correlation between the average number of a certain CPP insult defined by severity (X-axis) and duration (Y-axis) and each GOS category is color-coded with blue representing a positive correlation and red representing a negative correlation. The contour of zero correlation is highlighted in black. 1a: insults of low CPP (i.e., CPP on the X-axis expresses the threshold defining insults where CPP went below this threshold for a certain duration). 1b: insults of high CPP (i.e., CPP on the X-axis expresses the threshold defining insults where CPP went above this threshold for a certain duration). 1c: low CPP (black) and high CPP (blue) transition curves plotted together.
In the present analysis, for instance, transition to worse outcomes below CPP of 60 mm Hg occurred at a duration of 10 min, while CPP of 50 mm Hg could not be tolerated at all. Figure 1b shows a similar parabolic course of the association for insults above a certain CPP threshold with transition to worse outcomes occurring at shorter durations for the higher CPP values. When combining both plots (Fig. 1c), it becomes apparent that no universal CPP value is associated with good outcome for longer than 210 min. In other words, a common and static safe CPP zone could not be found. The graphs are cut off at 360 min; they became blurred at longer durations because of the numbers of insults of such long durations steeply falling down.
Figure 2 shows the transition curves for both insults of low CPP and insults of high CPP in adults ≤65 years without DC, separately for insults during which AR was active and insults during which AR was passive (the corresponding color-coded plots are available in Supplementary Fig. 1; see online supplementary material at
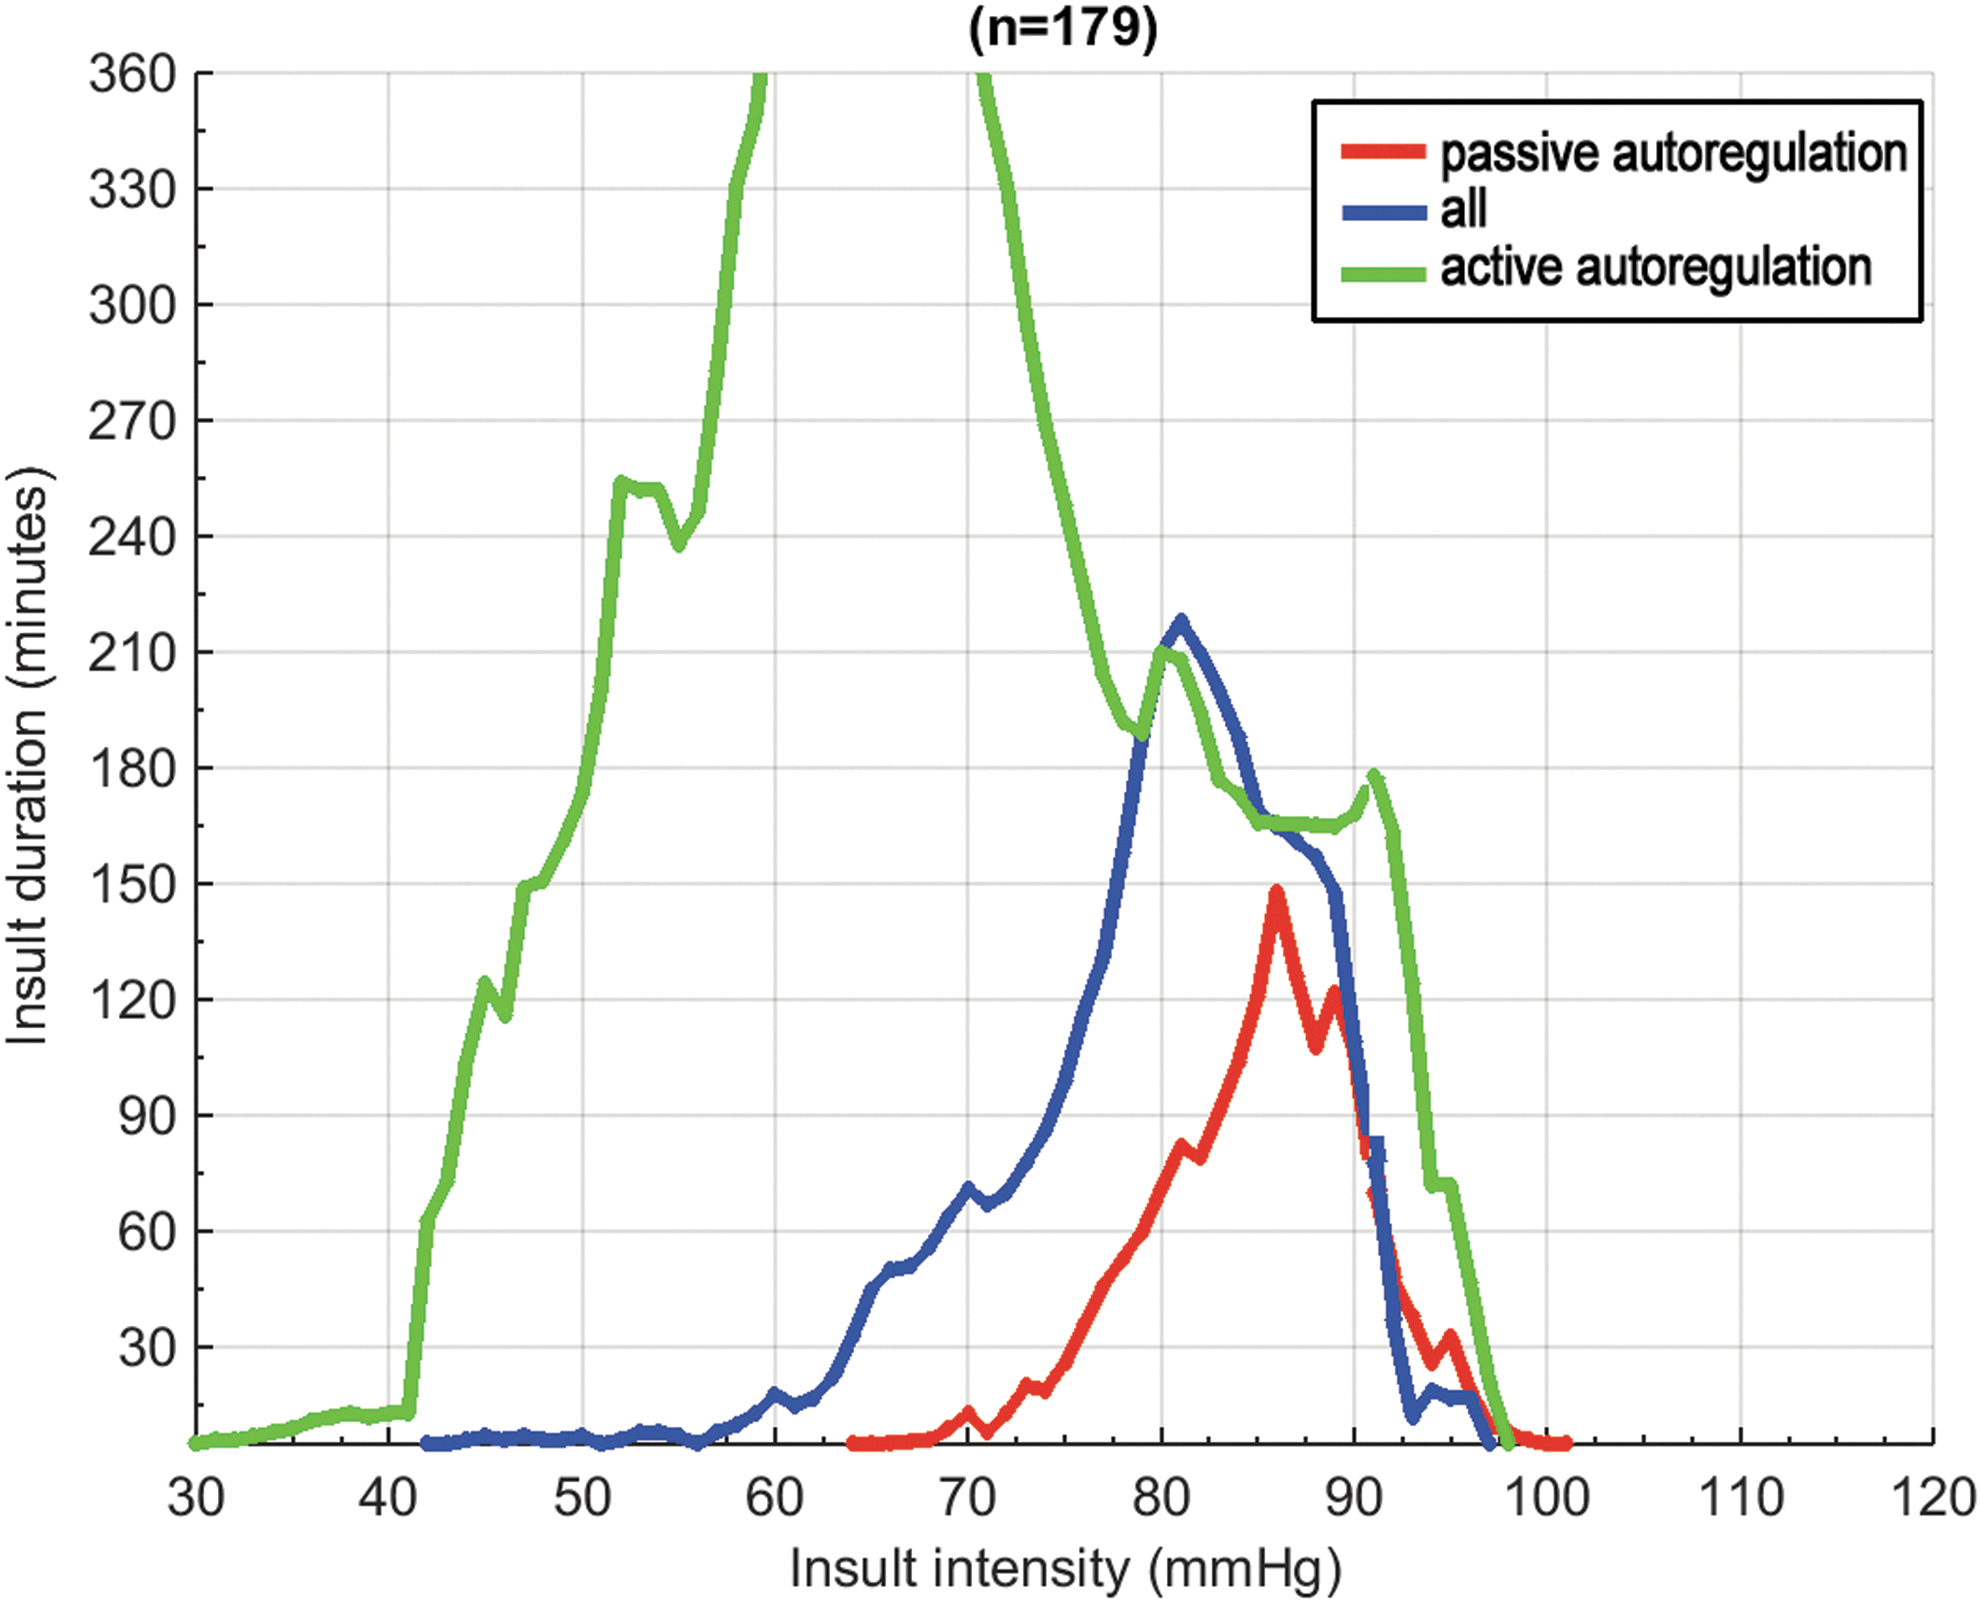
Comparison of cerebral perfusion pressure insult transition curves for episodes with active autoregulation (LAx <0; green) for episodes with passive autoregulation (LAx ≥0; red) and for all episodes (blue). Transition curves are the lines with 0 correlation between CPP insults and outcome. Analysis performed in adults ≤65 years without decompressive craniectomy, n = 179.
In Figure 3, the visualization of the relation between GOS and CPP insults for adults ≤65 years without DC is repeated, however, while only selecting episodes where ICP was ≤25 mm Hg (Fig. 3a and 3c) or only selecting episodes where ICP was >25 mm Hg (Fig. 3b and 3d). The graphs for ICP ≤25 mm Hg are almost identical to the graphs depicting all insults, while the graphs for ICP >25 mm Hg are overwhelmingly red: i.e., all insults are associated with poor outcomes.

Visualization of correlation between Glasgow Outcome Scale (GOS) and average number of cerebral perfusion pressure (CPP) insults according to an intracranial pressure (ICP) threshold of 25 mm Hg. Analysis performed in adults ≤65 years without decompressive craniectomy, n = 179. The univariate correlation between the average number of a certain CPP insult defined by severity (X-axis) and duration (Y-axis) and each GOS category is color-coded with blue representing a positive correlation and red representing a negative correlation. The contour of zero correlation is highlighted in black. 3a: insults of low CPP for ICP ≤25 mm Hg; 3b: insults of low CPP for ICP >25 mm Hg; 3c: insults of high CPP for ICP ≤25 mm Hg; 3d: insults of high CPP for ICP >25 mm Hg.
As for elderly persons >65 years without DC (n = 35), no transition curves could be discerned, outcomes being overall poor (see Supplementary Fig. 2; see online supplementary material at
Nine centers had a median of patients' median CPP below 70 mm Hg and 11 above 70 mm Hg (Fig. 4). When the color-coded plots visualizing the burden of CPP insults for adults ≤65 years without DC are depicted separately for both groups of centers, the transition curve patterns remain similar (see Supplementary Fig. 4; see online supplementary material at
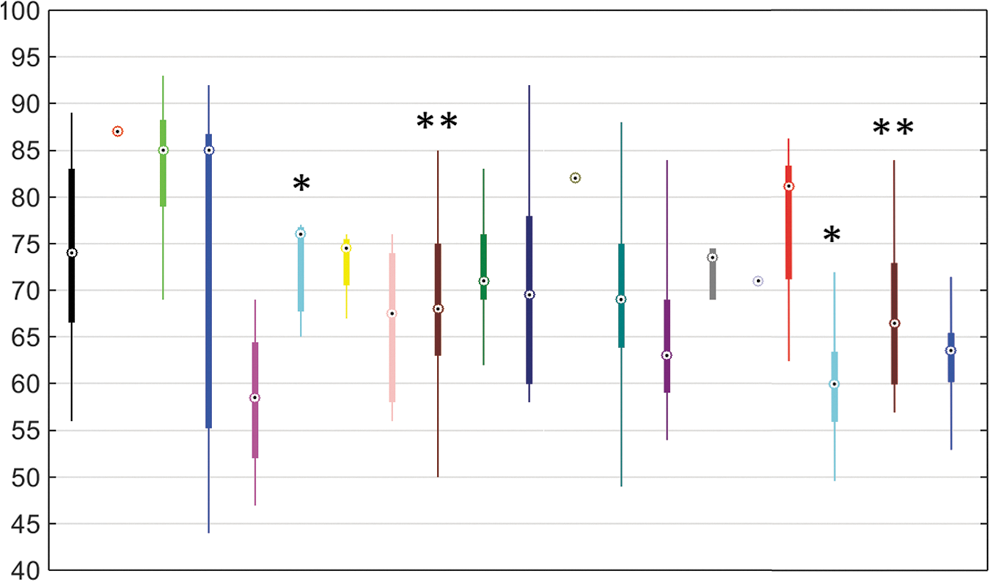
Per center distribution (median, interquartile range, and total range) of patients' median cerebral perfusion pressure throughout the intensive care unit stay. Each color represents a center. * and ** indicate centers that are depicted twice: once for the cohort 2003–2005 and once for the cohort 2009–2013.
In the multivariate analysis, the percentage of monitoring time each adult spent in the red zone (based on the transition curves of the active adults ≤65 years without DC) was an independent predictor of mortality (odds ratio [OR] 4.79 [1.02–22.46]; p = 0.04, Supplementary Table 1; see online supplementary material at
Discussion
We used the method for visualizing the burden of intracranial hypertension in patients with severe TBI developed by our group 7 to visualize the burden of CPP insults in terms of poor outcomes associated with episodes in which certain CPP thresholds are exceeded for certain durations. In the group of adults ≤65 years who did not undergo DC, we found that positive and negative associations between the occurrence of insults and outcome were separated by a well demarcated transition curve, which had an exponential course similar to that seen in the ICP study. 7 The lower the CPP, the shorter the time this could be tolerated, and the same was true for high CPP. Hence, both transition curves for CPP have to be considered together, which results in a safe zone in between the two curves. Only in active AR, however, the curves spread apart sufficiently to result in a CPP zone that was associated with good outcomes for a longer period. In deficient AR, the curves came closer, and no CPP value was safe for more than 90 min.
Although this finding may have been influenced by unknown confounders, the observation is congruent with the phenomenon of AR as a stable cerebral blood flow (CBF) plateau regardless of MAP in the Lassen representation. 8 Strikingly, AR status predominantly affected the transition curve for insults of low CPP. In the older age group and DC group, the sample size was probably too low to draw conclusions. Still, however, it was striking that the graph pattern observed in the younger adults without decompression did not emerge here. When analyzing the total patient cohort including elderly and DC patients, relatively similar graphs as in Figure 1 were produced, but with a wider area of transition between good and poor outcome instead of sharper transition curves.
The Lassen representation of the cerebrovascular AR as a CBF plateau for MAP between 60 and 150 mm Hg 8 has been criticized as an oversimplification and more importantly because it was based on a disputable methodology of grouping populations from different studies. 23,24 From physiological research, AR emerges as a complex feedback mechanism with overlapping and interacting pathways, including intrinsic vasomotor mechanisms, peripheral autonomic vasomotor regulations, and central intrinsic neural pathways. The actual intra-individual range of effective AR is thought to be as narrow as approximately 10 mm Hg. 25 Also, AR would seem to be better at buffering increases versus decreases of MAP, 26,27 which is inverse to our observation that AR had the most pronounced effect on the “tolerance curve” for low CPP. Noteworthy, the effect of AR on the transition curve for low CPP in the present analysis concerns a wider pressure range than the effect of AR on the ICP transition curve in Güiza and associates. 7
In several studies, it has been reported that the impairment of AR in TBI is a dynamic phenomenon. 14,28,29 In active AR, a safe CPP zone between 60 and 70 mm Hg for up to 6 h is depicted in the current study. How this safe zone looks like for longer periods cannot be concluded from the present study. Variability of blood pressure and ICP in real life, as in the present study, however, may question the relevance of this issue. The safe zone is congruent with the AR stable CBF plateau concept, but a dynamic component is added—i.e., the actual range of safe CPP is wider than 60 to 70 mm Hg, but outside the 60 to 70 mm Hg, it is time dependent.
This is not in conflict with the literature on optimal CPP. 16 –18 First, there is a different perspective. The optimal CPP method searches for CPP values associated with active AR (based on PRx or LAx) and then finds a relationship with outcome. The current study investigated the relationship between CPP and outcome and then looked at the influence of AR (using LAx). Second, associations with favorable outcome can be found far outside the 60 to 70 mm Hg range, but then they are time dependent. The optimal CPP method, within the scope of the CPP range the patient has been in, will pick up time-dependent CPP zones associated with active AR in this wider range. Future studies, both clinical studies as well as validation studies of clinical tools in animal AR models, will be required to refine our understanding of AR and optimal CPP. What can be concluded from the current article and our ICP article 7 is that active AR improves the tolerability for insults of high ICP and low CPP. Consequently, it is likely beneficial to bring the patient with TBI in a state of active AR.
Insults of CPP <50 mm Hg were hardly tolerated, and ICP >25 mm Hg was associated with poor outcome regardless of CPP. The latter two findings were also demonstrated in Güiza and coworkers. 7 That the impact of high ICP on outcome overrules the effect of CPP, however, should not be interpreted as if the management of CPP is unimportant during episodes of high ICP. It may well be that, more than the pressure level itself, high ICP reflects the global seriousness of the patient's condition, and hence is reflected in its profound relationship with poor outcome.
The current study inevitably has limitations. First, the sample size remains relatively small. Second, the data incorporate therapeutic influences, which cannot be removed. As we have shown, however, CPP policies did not affect the CPP/outcome transition curves. Third, although efforts were made to correct for the height at which arterial blood pressure was zeroed, some degree of uncertainty cannot be excluded. When we analyzed the data without correction, however, the influence on the graphs was minimal and the interpretation remained similar. Fourth, longer-staying patients have a proportionally higher representation in the total monitoring time. To rule out bias from this phenomenon, the visualization plots were recalculated using daily averages of the number of insults. The graphs remained unchanged (Supplementary Fig. 5; see online supplementary material at
The present study attempts to produce a better insight into insults of low and high CPP. The results support that there is an impact of AR on the relationship between CPP and outcome and demonstrate the important influence of the time factor. From this, it is impossible to produce fixed CPP thresholds. This emphasizes the need for improving our understanding of cerebrovascular pathophysiology in TBI and including this knowledge into smart(er) monitoring tools.
Footnotes
Acknowledgments
This study is funded through Fonds voor Wetenschappelijk Onderzoek Vlaanderen (Research Project G.0904.11). Geert Meyfroidt receives funding from Fonds voor Wetenschappelijk Onderzoek Vlaanderen as senior clinical investigator (1846113N), Greet Van den Berghe receives structural research funding via the Methusalem program funded by the Flemish Governement (METH/08/07). Brain-IT was funded by the European Framework Program (FP5-QRLI-2000-00454), QLGT-2002-00160 and FP7-IST-2007-217049). The NEMO project in the Universty Hospital Antwerp was funded by the Flemish Governement Agency for Innovation by Science and Technology (IWT). The authors wish to acknowledge the non-author steering group members of Brain-IT: Barbara Gregson, Tim Howells, Karl Kiening, Arminas Ragauskas, Juan Sahuquillo, and Jan Oliver Neumann.
Author Disclosure Statement
No competing financial interests exist.
References
Supplementary Material
Please find the following supplemental material available below.
For Open Access articles published under a Creative Commons License, all supplemental material carries the same license as the article it is associated with.
For non-Open Access articles published, all supplemental material carries a non-exclusive license, and permission requests for re-use of supplemental material or any part of supplemental material shall be sent directly to the copyright owner as specified in the copyright notice associated with the article.