
Abstract
Traumatic brain injury (TBI) can produce life-long disabilities, including anxiety, cognitive, balance, and motor deficits. The experimental model of closed head TBI (cTBI) induced by weight drop/impact acceleration is known to produce hallmark TBI injuries. However, comprehensive long-term characterization of comorbidities induced by graded mild-to- mild/moderate intensities using this experimental cTBI model has not been reported. The present study used two intensities of weight drop (1.0 m and 1.25 m/450 g) to produce cTBI in a rat model to investigate initial and long-term disability of four comorbidities: anxiety, cognitive, vestibulomotor, and spinal reflex that related to spasticity. TBI and sham injuries were produced under general anesthesia. Time for righting recoveries post-TBI recorded to estimate duration of unconsciousness, revealed that the TBI mild/moderate group required a mean of 1 min 27 sec longer than the values observed for noninjured sham animals. Screening magnetic resonance imaging images revealed no anatomical changes, mid-line shifts, or hemorrhagic volumes. However, compared to sham injuries, significant long-term anxiety, cognitive, balance, and physiological changes in motor reflex related to spasticity were observed post-TBI for both TBI intensities. The longitudinal trajectory of anxiety and balance disabilities tested at 2, 4, 8, and 18 weeks revealed progressively worsening disabilities. In general, disability magnitudes were proportional to injury intensity for three of the four measures. A natural hypothesis would pose that all disabilities would increase incrementally relative to injury severity. Surprisingly, anxiety disability progressed over time to be greater in the mildest injury. Collectively, translational implications of these observations suggest that patients with mild TBI should be evaluated longitudinally at multiple time points, and that anxiety disorder could potentially have a particularly low threshold for appearance and progressively worsen post-injury.
Introduction
T
Whereas specific TBI models have been shown to produce unique signature injuries, 7 experimental TBIs also typically produce three injuries common to human TBI, diffuse axonal injury (DAI), contusion, and subdural hemorrhage 6 –8 that are presumed to account for significant components of the long-term disabilities post-TBI. The experimental model of cTBI induced by weight drop (impact/acceleration) produces graded, controlled, and reproducible injuries and is widely used because it is known to produce hallmark TBI injuries (contusion, DAI, and microhemorrhages). 9 –14 Accordingly, it meets several of the criteria for a controlled, reproducible TBI model. 7,15,16 In addition, this cTBI injury is not further complicated by the cranial surgery required for models in which the cortex is exposed and injured by mechanical or liquid impact. 17 However, comprehensive characterization of comorbidities induced by graded milder form of injuries using this experimental cTBI model has not been reported. Because the comorbidities produced in the model mimic components of human TBI, detailed behavioral characterization of multiple morbidities produced by graded milder intensities could potentially provide important translational information. In addition, characterization of hallmark comorbidities could potentially contribute a broader understanding of TBI disability for investigations of the neurobiology, neuroprotection, and treatment of TBI. In the present study, two modalities of weight drop (1.0 m and 1.25 m/450 g) were used to produce cTBI to investigate cTBI-induced comorbidities (anxiety, cognitive, motor, and vestibulomotor disabilities). Two of these (anxiety and balance) lend well to multiple time-point assessment and were evaluated at multiple time points to evaluate disability progression over 18 weeks post-injury. Most of the reported publications in this field have used single-injury intensity and one or two behavioral observations to quantify TBI-induced disabilities encompassing post-injury time of a few weeks. Adding further to the clinical relevance, this report adheres to the newest recommendations for use of common data elements 18 throughout the methods and protocols to provide quantitative measures of progressive and enduring disabilities in anxiety-like, cognitive, and motor behaviors for two intensities of TBIs over 18 weeks post-injury. Moreover, this report provides input to the quantitative measures of progressive and enduring multiple disabilities that are hallmark features of mild and mild-to-moderate TBI-induced disabilities in humans. These data represent the first report of comprehensive multiple time-point assessments of multiple disability subsequent to graded TBI.
Methods
Animal subjects
A total of 34 female Sprague-Dawley specific pathogen-free rats (251–275 g; Charles River Laboratories, Wilmington, MA) were used in these studies. For all behavioral experiments, 16 cTBI (n = 8 for each injury severity group, 1.0 or 1.25 m) and 8 age- and sex-matched naïve animals were used as controls. A separate cohort of 10 animals was used for acquiring loss of conscious data only where 6 animals were received cTBI and 4 animals went through sham surgery. All procedures were performed in accord with the U.S. government Principle for the Utilization and Care of Vertebrate Animals specifically following the National Institutes of Health “Guide for the Care and Use of Laboratory Animals.” Experimental animal protocols were approved by the Institutional Animal Care & Use Committee at the North Florida/South Georgia Veterans Health System and the University of Florida (Gainesville, FL).
Surgical procedure for closed head traumatic brain injury
A standardized weight-drop method was used to produce controlled levels of TBI, as described previously 11,12 and reported by us recently. 9,10,13 Briefly, the surgical procedure was performed under aseptic conditions. The animal's body temperature was monitored and maintained at 37–39°C using a clean, sanitized, temperature-controlled blanket. The injury was performed under anesthesia (ketamine, intraperitoneally [i.p.], 100 mg/kg; xylazine, subcutaneous, 10 mg/kg; glycopyrrolate, i.p., 0.02 mg/kg). The dorsal surface of the head was shaved and cleaned using repeating cycles of betadine scrub (7.5%), followed by a 70% alcohol wipe and a final application of betadine solution (5.0%). A skin incision was made along the dorsal mid-line of the cranium and the incision site was infiltrated with 0.25% bupivacaine (3 mg/kg). Fascia and soft tissue were retracted to the exposed landmarks of the lambda and bregma on the cranium. A stainless disk (10 mm diameter × 2 mm height) was attached to the exposed skull with the dental acrylic. The animal was then placed on a foam pad and the cortical impact trauma device was maneuvered over the animal and aligned with the stainless disk. A 450-g impactor, with a 10-mm-diameter tip, was dropped through a thermoplastic (Delrin) tube from a 1.25-m height (n = 8) or 1.0 m (n = 8) to produce impact-acceleration injuries that are uniformly reported as a mild level of cTBI. 10 –12 The stainless disk served to diffuse the force of the impactor, thus decreasing the probability of a skull fracture. The head was positioned in the impactor device under the drop tube to maximize the probability for even distribution of impact energy. To minimize angular accelerations of the head in the coronal plane, just before weight drop, the helmeted head was aligned as perfectly as possible in a horizontal plane to permit a parallel contact with the impactor. 19 Further, the elastic properties of the foam pad (Type E; Foam to Size, Inc., Ashland, VA), on which the head was resting, produced a controlled acceleration/rotation during the closed head diffuse brain trauma injury. 11,13 Post-injury, the stainless disk was removed from the cranium and the skin was closed with sterile sutures. A separate cohort of animals (n = 10) were anesthetized by inhalation anesthesia (isoflurane, 4% induction, and 1.5% continuation), prepared for injury (n = 6; 1.25 m/450 g) or for sham (helmet applied to cranium after scalp incision; shams did not receive a weight drop, n = 4) using the procedure precisely as described above. The helmet was removed, and the scalp was immediately closed with sterile clips. The rat was then transferred to a 37°C incubator and was placed in a supine position. This description provides many of the common data element details suggested by the recent recommendations for standardization of pre-clinical impact/acceleration TBI. 18 For a more detailed description of injury protocol and procedures, see Thompson and colleagues. 9
Duration of unconsciousness
Subsequent to the sham or actual 1.25-m weight drop, the time for whole-body righting in seconds from the impact procedure was carefully recorded. A permanent record of the recording procedure and measurement was recorded by video camera for subsequent rereview. The time measurements for righting following 1.25-m TBIs were performed to estimate duration of unconsciousness. The direct measure of TBI-induced unconsciousness is prevented by the time for recovery from the short duration of inhalation anesthetic under which the procedure is performed. Therefore, the 1.25-m TBI-induced unconsciousness was determined by the difference in righting time between sham and TBI animals. Sham and TBI animals were anesthetized and prepared for TBI in an identical manner; except for the sham group, the impactor was not dropped. Subsequent to the sham or actual weight drop, the scalp incisions were closed with surgical clips and the animals were placed in lateral recumbence on a 37°C pad. Duration of unconsciousness was measured by recording the time for righting by two observers.
Elevated Plus Maze
Anxiety-like behavior was tested using a commercially available elevated plus maze. The maze is incorporated with a Noldus EthoVision hardware and software (Noldus Information Technology, Leesburg, VA) system to automatically track animals' behavior. The detailed protocol we have reported recently. 13 Briefly, the animal was put onto the center piece of the plus maze facing the closed arm and allowed to explore the maze for 5 min. The time spent (duration) in open arm, closed arm, and on the central platform, as well as the frequency of entries to the open arm, were recorded. The testing procedure remained the same each time. Animals were tested four times over the courses of the experiment at post-injury (PI) weeks (WKs) 2, 4, 8, and 18.
Morris Water Maze
Cognitive disability was tested using the Morris Water Maze (MWM), as described previously. 13,20 Briefly, the MWM was composed of a 180-cm-diameter and 60-cm-high black pool filled with water. The water was maintained at 26–28°C and to a depth of 28 cm. To remove any visual cues, water was made opaque by the addition of 300–500 mL of nontoxic washable white paint (Crayola 54-2128; Crayola LLC, Easton, PA). A clear Plexiglas platform 10 cm in diameter and 26 cm in height was used as the hidden goal platform. The maze was located in a 3.0 × 3.0 m room with numerous extra maze cues that remained constant throughout the experiment. The MWM protocol utilized four trials per day for 4 consecutive days, which began at post-injury day (PID) 11 and PIWK8. For each trial, the animal was placed in the pool by hand at one of four start locations. The start locations were separated by 90 degrees and systematically identified as east, south, west, and north. On each test day, each animal performed trials from each of the four possible start locations, where the order was randomized for each animal on each day. The goal platform was positioned in the southeast quadrant of the maze, 45 cm from the outside wall. Each animal was given a maximum of 120 sec to find the hidden platform. If the rat failed, it was placed on the platform for 30 sec by the experimenter. A computerized video tracking system (Noldus EthoVision XT 8.0; Noldus Information Technology) was used to record each animal's latency to reach the goal platform, total distance swum, cumulative swim distance (sum of all distances between the subject and the target platform in each second), and swimming speed (the distance traveled by an animal per second).
Vestibulomotor testing: rotorod
Vestibulomotor performance was tested using a rotorod (Columbus Instruments, Columbus, OH) at PIWK2, 4, 8, and 18. The animal was challenged to maintain its balance while walking on a rotating rod during the test. The standard 2-min protocol, as recently reported by us and which was originally developed by Hamm, was used. 20 Briefly, the animal was placed on the walking surface of the stationary rod. The rotational speed was then steadily increased (automatic preset) by 3 rpm in 10-sec intervals until the maximum rpm of 30 was reached for the final 20 sec of the 2-min test period. The length of time the animal was able to maintain itself on the rotating rod during the 2-min test was used to quantitate each animal's balance ability. Each animal was tested for three trials and the average was used.
H-reflex
Tibial/plantar H-reflex was elicited by stimulation of the tibial nerve using 200-μs pulses at 3-sec interstimulus intervals after a noninvasive procedure that we reported on previously. 21 Briefly, a series of stimulation frequencies (0.3, 0.5, 1, 2, 3, 4, 5, 10, and 0.3 Hz) were conducted and 20 stimulation pulses (at 0.3-Hz H-max intensity) were delivered in each frequency. The current intensity used for the H-reflex testing was standardized across preparations by using the minimum intensity required to evoke the H-max; typically, this is within the range of 1.5 to 2.0 mA. Usually, the reduced rate depression results in a greater amplitude response, and increased rate depression results in a decreased amplitude response, that is,the depression is the inverse of amplitude. 22 –24 The data set for each frequency was 32 consecutive waveforms that were signal averaged upon acquired using a digital signal acquisition system and LabView graphic programming (Version 5.0; National Instruments, Austin, TX). Rate depression at each test frequency was quantified by comparison of reflex amplitude to the 0.3-Hz control. 22 –25 The H-reflex was tested at the end of the study (PIWK18).
Magnetic resonance imaging
Post-fixed whole-brain T2-weighted (T2W) magnetic resonance imaging (MRIs) were performed on a 7.0 Tesla (T) MRI system (MR Solutions Ltd, Guildford, UK) equipped with a shielded gradient system (490-mT/m gradient strength and 100-mm diameter). The 4% paraformaldehyde fixed whole brains (TBI 1.0 m [n = 4]; TBI 1.25 m [n = 2]; intact normal [aged-matched; n = 2]) were randomly selected and soaked in phosphate-buffered solution (pH 7.4; 0.01 M) for 48 h and then each transferred to a separate sterile plastic tube filled with Fluorinert [FC-40; Sigma-Aldrich Co., St. Louis, MO) solution. The tube was then put inside a volumetric quadrature coil with a 42-mm internal diameter (MR Solutions Ltd), which was used for both transmission and reception. A three-dimensional 3D fast spin echo with an echo train of six echoes (echo spacing, 15 ms; echo time = 45 ms) was used with the following parameters: field of view, 24 × 18 × 12.8 mm2 and matrix 256 × 180 × 128 (readout, phase encoding, and slice phase encoding, respectively), yielding a resolution of 93.7 × 100 × 100 μm. Receiver acquisition bandwidth was 25 KHz. Repetition time was 3000 ms, and the number of averages was two.
Statistical analysis
A single-factor analysis of variance was used to analyze the different groups at the same time point. Two-sample t-tests were used to compare differences between two different time points of the same group. The Wilcoxon rank-sum test was used to analyze data that did not pass the normality test. In addition, rotorod data were further analyzed using trend line slopes of the testing timelines of the three groups. Linear regression lines were fitted for the timelines in each group. The p values less than 0.05 were considered significant in all occasions.
Results
Duration of unconsciousness
Time measurements for righting post-TBI recorded to estimate the duration of unconsciousness revealed that the sham group required a mean of 209 sec (3 min 29 sec) to right themselves after the fictive injury. The 1.25-m TBI group required a mean of 296 sec (4 min 56 sec) for righting after the weight drop. The difference in righting time between the sham and TBI groups was 1 min 27 sec. Accordingly, the period of unconsciousness observed after 1.25-m injury was less than 5 min (Fig. 1).
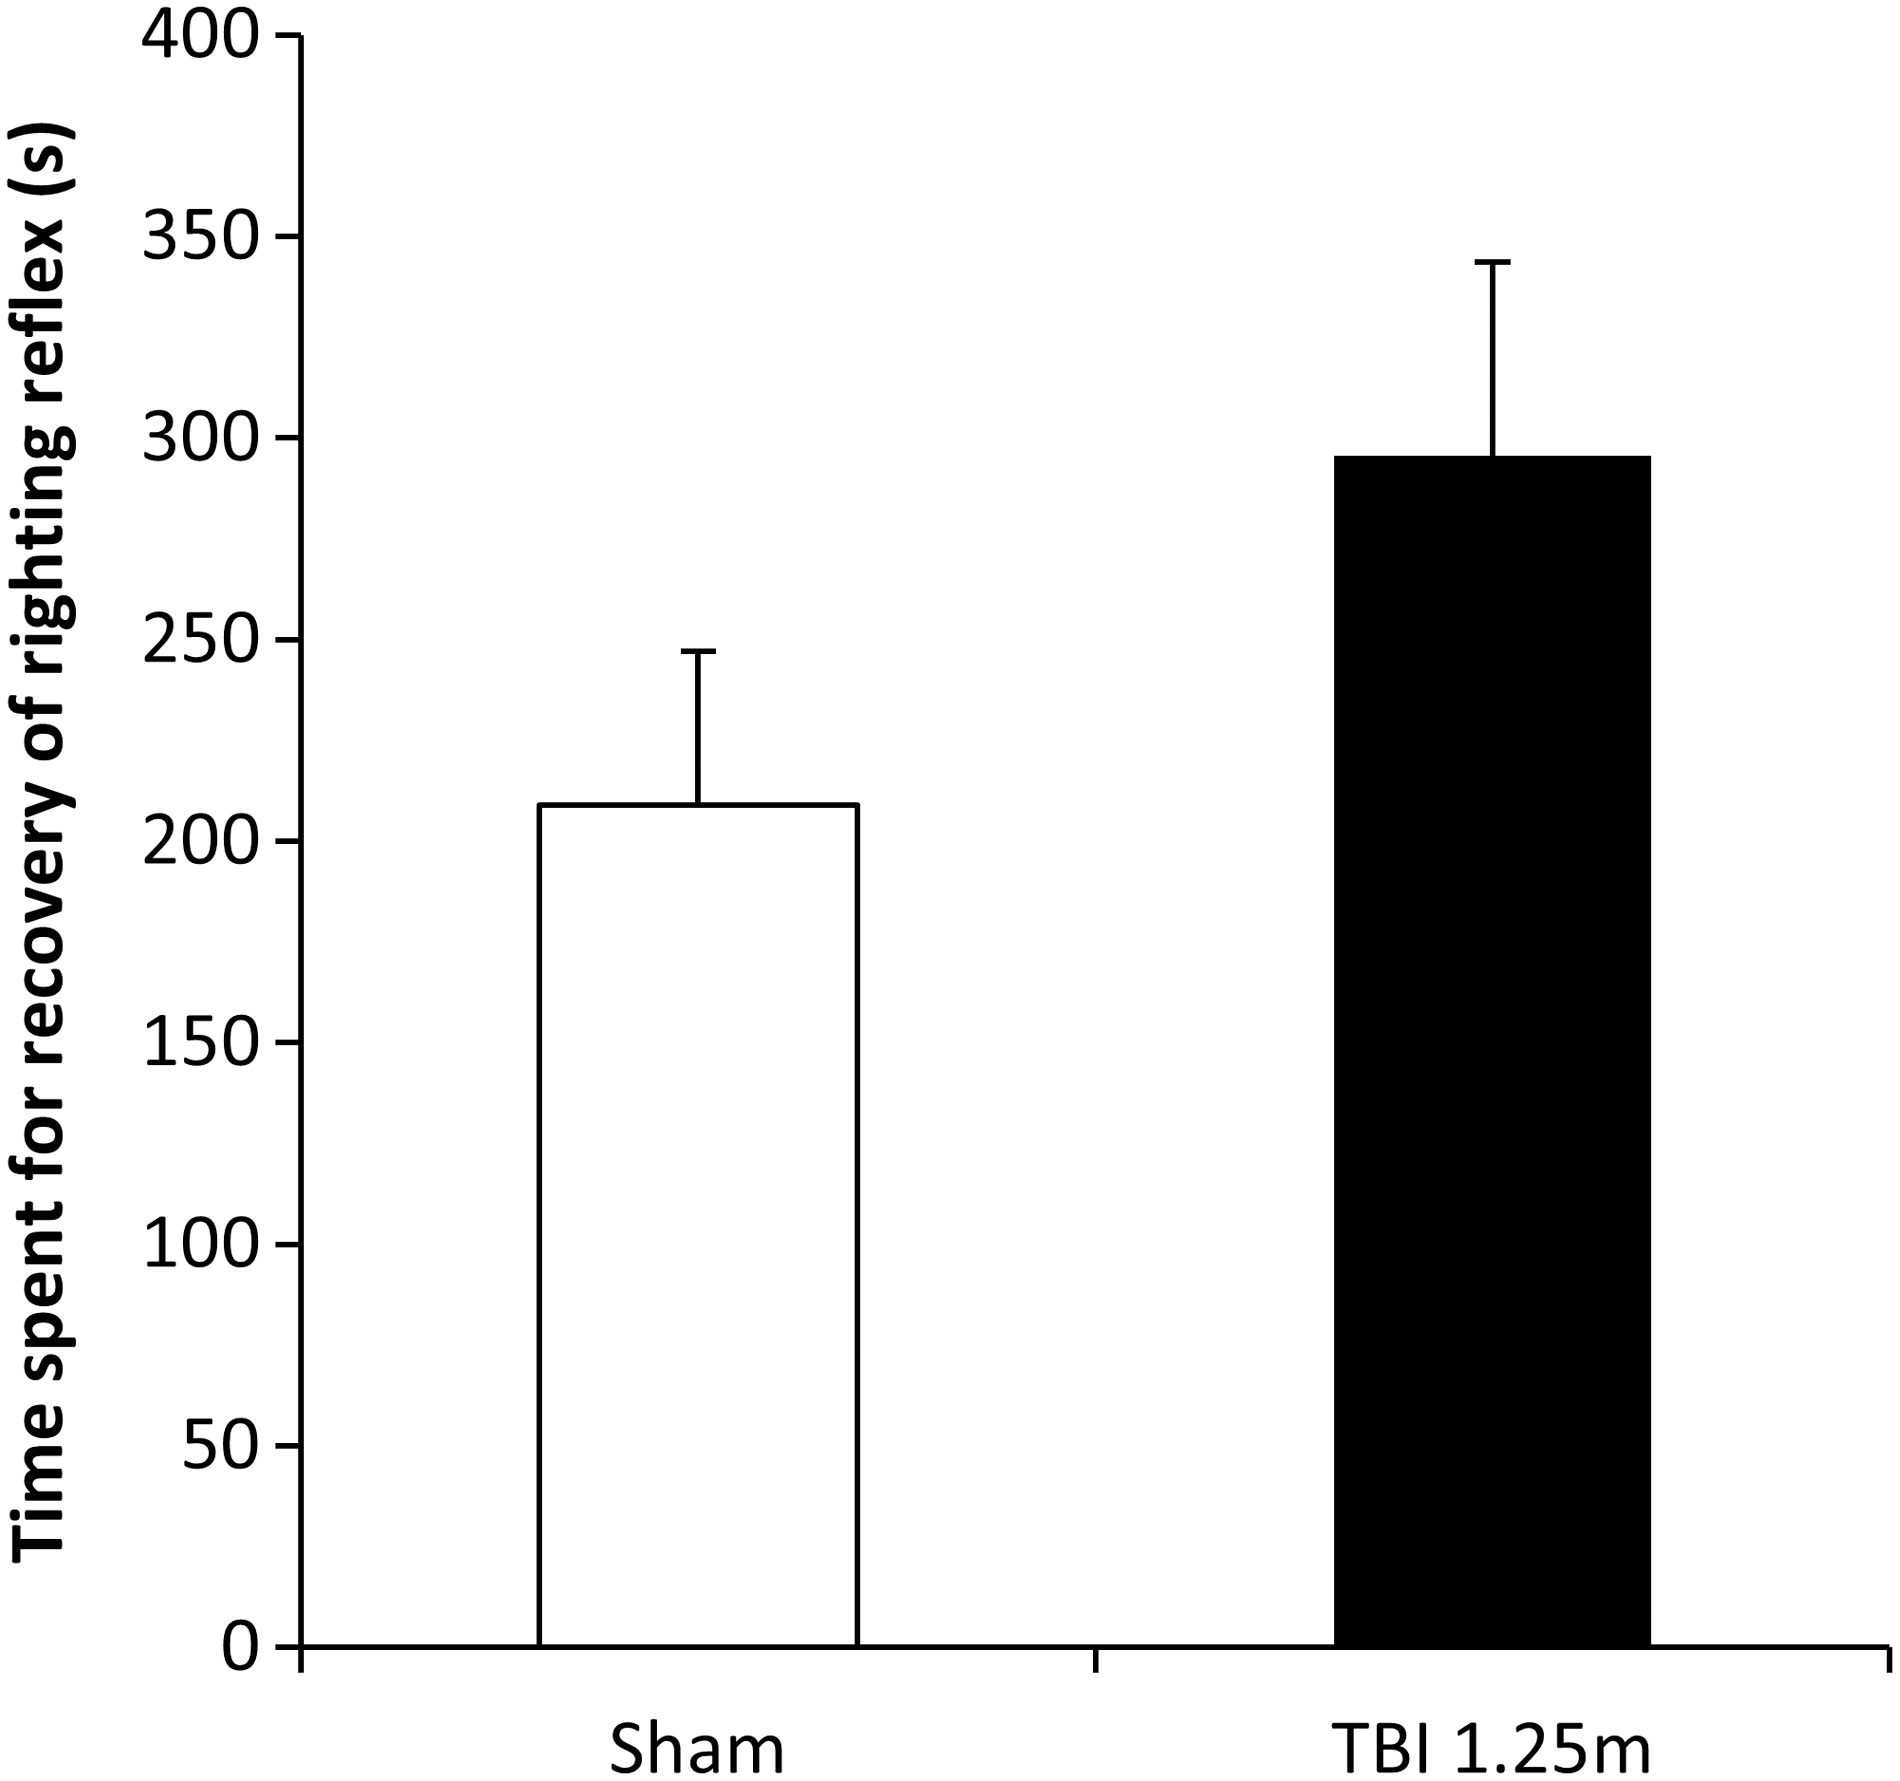
Time spent for whole-body righting since the weight drop was recorded (Sham, n = 4; TBI-1.25 m, n = 6). Mean righting recovery time for sham animals was 3 min 29 sec. In contrast, the mean righting recovery time for the TBI-1.25 m was 4 min 56 sec post-injury. The difference in righting recovery time between sham and injury was 1 min 27 sec. This difference was not statistically significant. TBI, traumatic brain injury.
Magnetic resonance imaging comparisons
Conventional T2W MRI screening (7.0T MRI) performed on normal, 1.0-m TBI, and 1.25-m TBI revealed no detectable anatomical injuries, mid-line shifts, or hemorrhagic masses (Fig. 2). Collectively, the measures performed on the 1.25-m TBI animals are consistent with the classification of mTBI.

Post-fixed whole-brain T2W MRI was performed on a 7.0T MRI system for normal (n = 2), TBI-1.0 m (n = 4), and TBI-1.25 m (n = 2) animals. No anatomical injuries, mid-line shift, or hemorrhagic masses were detected in any of the tested animals' MRI images. One representative T2W image from each group is shown. MRI, magnetic resonance imaging; T, Tesla; T2W, T2-weighted; TBI, traumatic brain injury.
Elevated Plus Maze
Anxiety-like behavior was tested with the Elevated Plus Maze (EPM) in TBI and age- and sex-matched normal animals at PIWK2, 4, 8, and 18. At PIWK2, both TBI-1 m and TBI-1.25 m animals were observed to spend less time (21% and 19%, respectively) in the open arms compared to normal animals (32%) of the 5-min testing period (Fig. 3). At successive time points (4, 8, and 18 weeks), the time spent in the open arms was observed to progressively decrease for both TBI groups. The difference from normal was significant beginning at PIWK4 for TBI-1.25 m and PIWK8 for TBI-1 m, respectively, compared to time-matched normal animals. At the 18th week, the time spent in the open arms was 2% and 3% for the 1.0- and 1.25-m TBI groups, respectively, compared to 29% observed for the normal group.
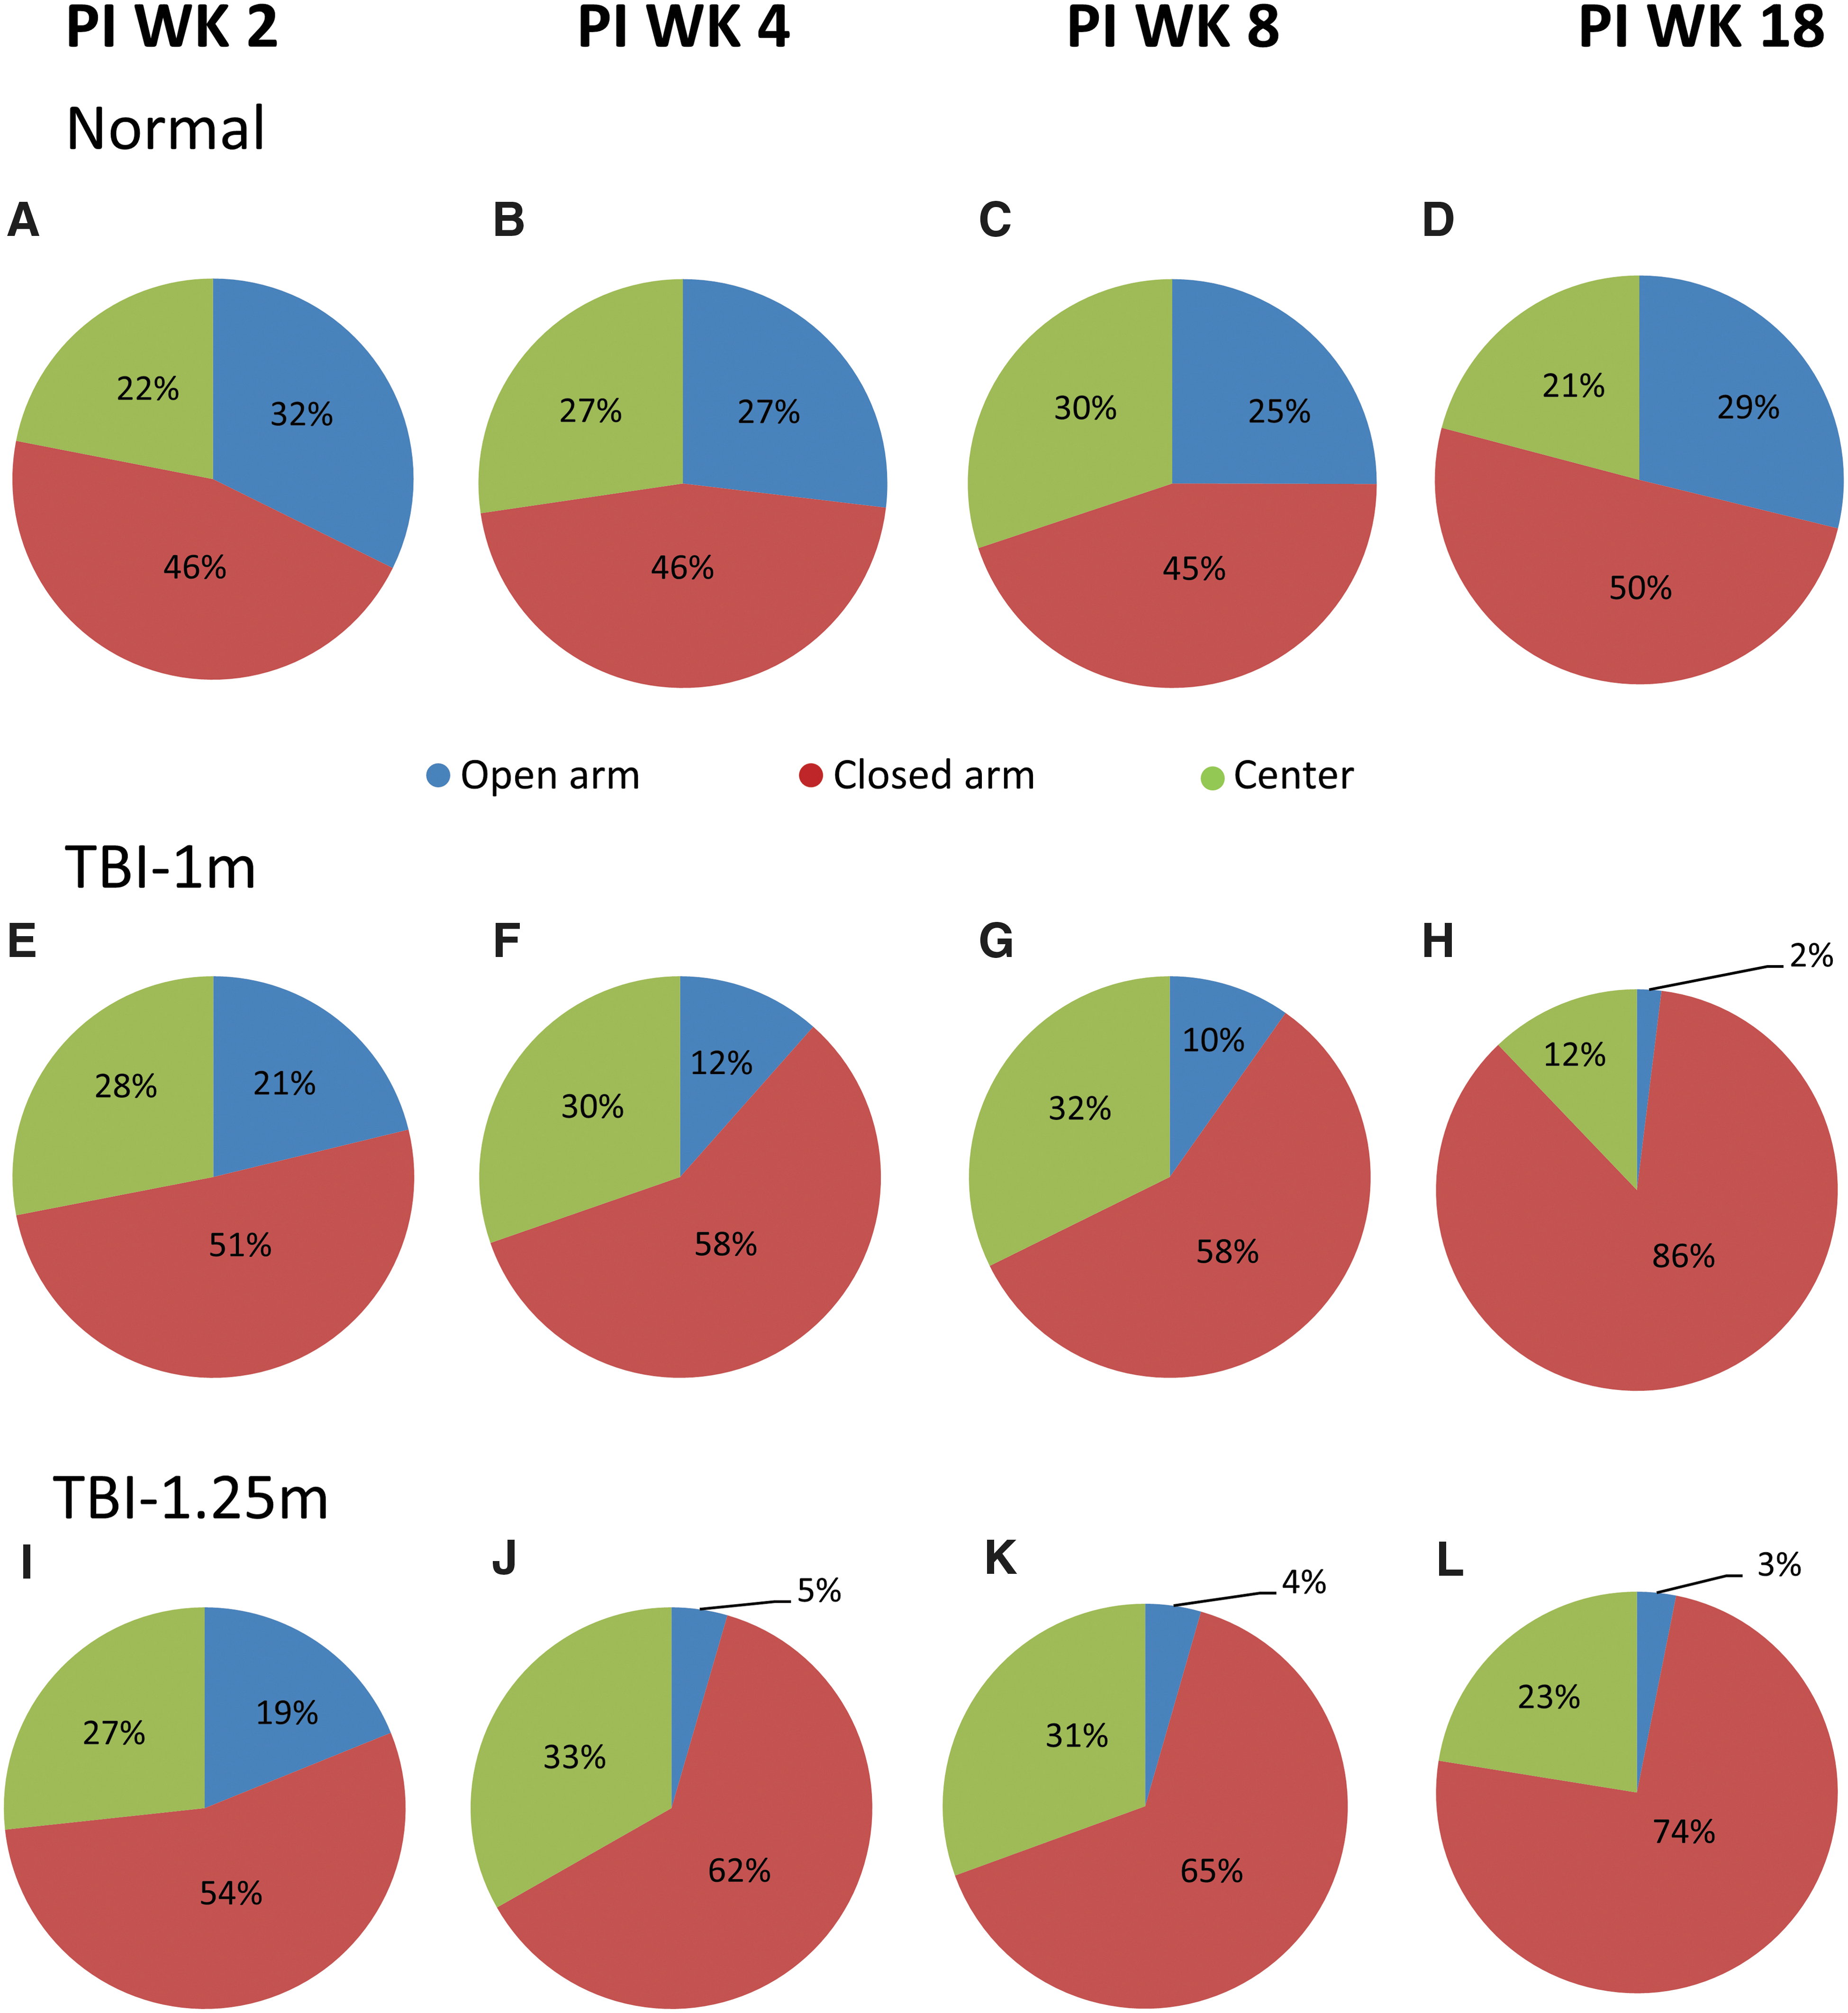
Elevated Plus Maze (EPM) performance was tested at post-injury (PI) weeks (WKs) 2, 4, 8, and 18 using normal (
The normal animals spent 25–32% of the time (32%, 27%, 25%, and 29%) in the open arm portions of the maze during test sessions conducted at PIWK2, 4, 8, and 18, respectively. TBI animals showed progressive reductions in percent time spent in the open arms during successive testing periods (21%, 12%, 10%, and 2% for TBI-1 m; 19%, 5%, 4%, and 3% for TBI-1.25 m at PIWK2, 4, 8, and 18, respectively). Compared to observations at PIWK2, the TBI-1.0 m spent significantly less time in the open arms at PIWK8 and PIWK18 (p = 0.011 and p < 0.001, respectively). In contrast, significant reductions were observed in time spent in the open arms for the TBI-1.25 m animals starting at PIWK4 and persisted through the PIWK8 and PIWK18 test sessions (p = 0.008, 0.009, and 0.006, respectively). Accordingly, both between groups (normal, TBI) and within-group differences were observed at successive times post-TBI. Further analyses of data representing the time spent in the closed arms of the maze revealed significant differences between normal and either of the two TBI groups. For example, both TBI groups at PIWK4 spent significantly greater time in the closed arms compared to values obtained in normal at this testing period (p < 0.001 and p = 0.006 for TBI-1.25 m and TBI-1 m, respectively). However, at PIWK8, only the TBI-1.25 m group, and at PIWK18, only the TBI-1.0 m group showed significant differences when compared to normal values obtained at corresponding the PIWK (p = 0.032 and p = 0.004, respectively). Within same group analysis using data from different testing time points, only the TBI-1 m group showed significantly greater time spent in the closed arm of the maze at PIWK18 when compared to corresponding values obtained at PIWK2 (p = 0.018). In contrast, a significantly less time spent in the central piece of the maze by the TBI-1.0 m group at PIWK18 when compared to data obtained from PIWK2, 4, and 8 from the same group (p = 0.045, 0.006, and 0.004, respectively).
In addition to the decreased time spent in the open arms, both TBI animal groups also showed significantly less frequent entries into the open arms compared to time-matched normal animals (Fig. 4). The pattern of change was progressive. For example, the number of entries observed at PIWK18 were significantly less than observed at PIWK2 for both the TBI-1.0 m and TBI-1.25 m group (p = 0.011 and 0.03, respectively). In addition, compared to PIWK2, the TBI-1.25 m showed significant less open arm entry at PIWK4 and PIWK8 (p = 0.028 and 0.007, respectively).
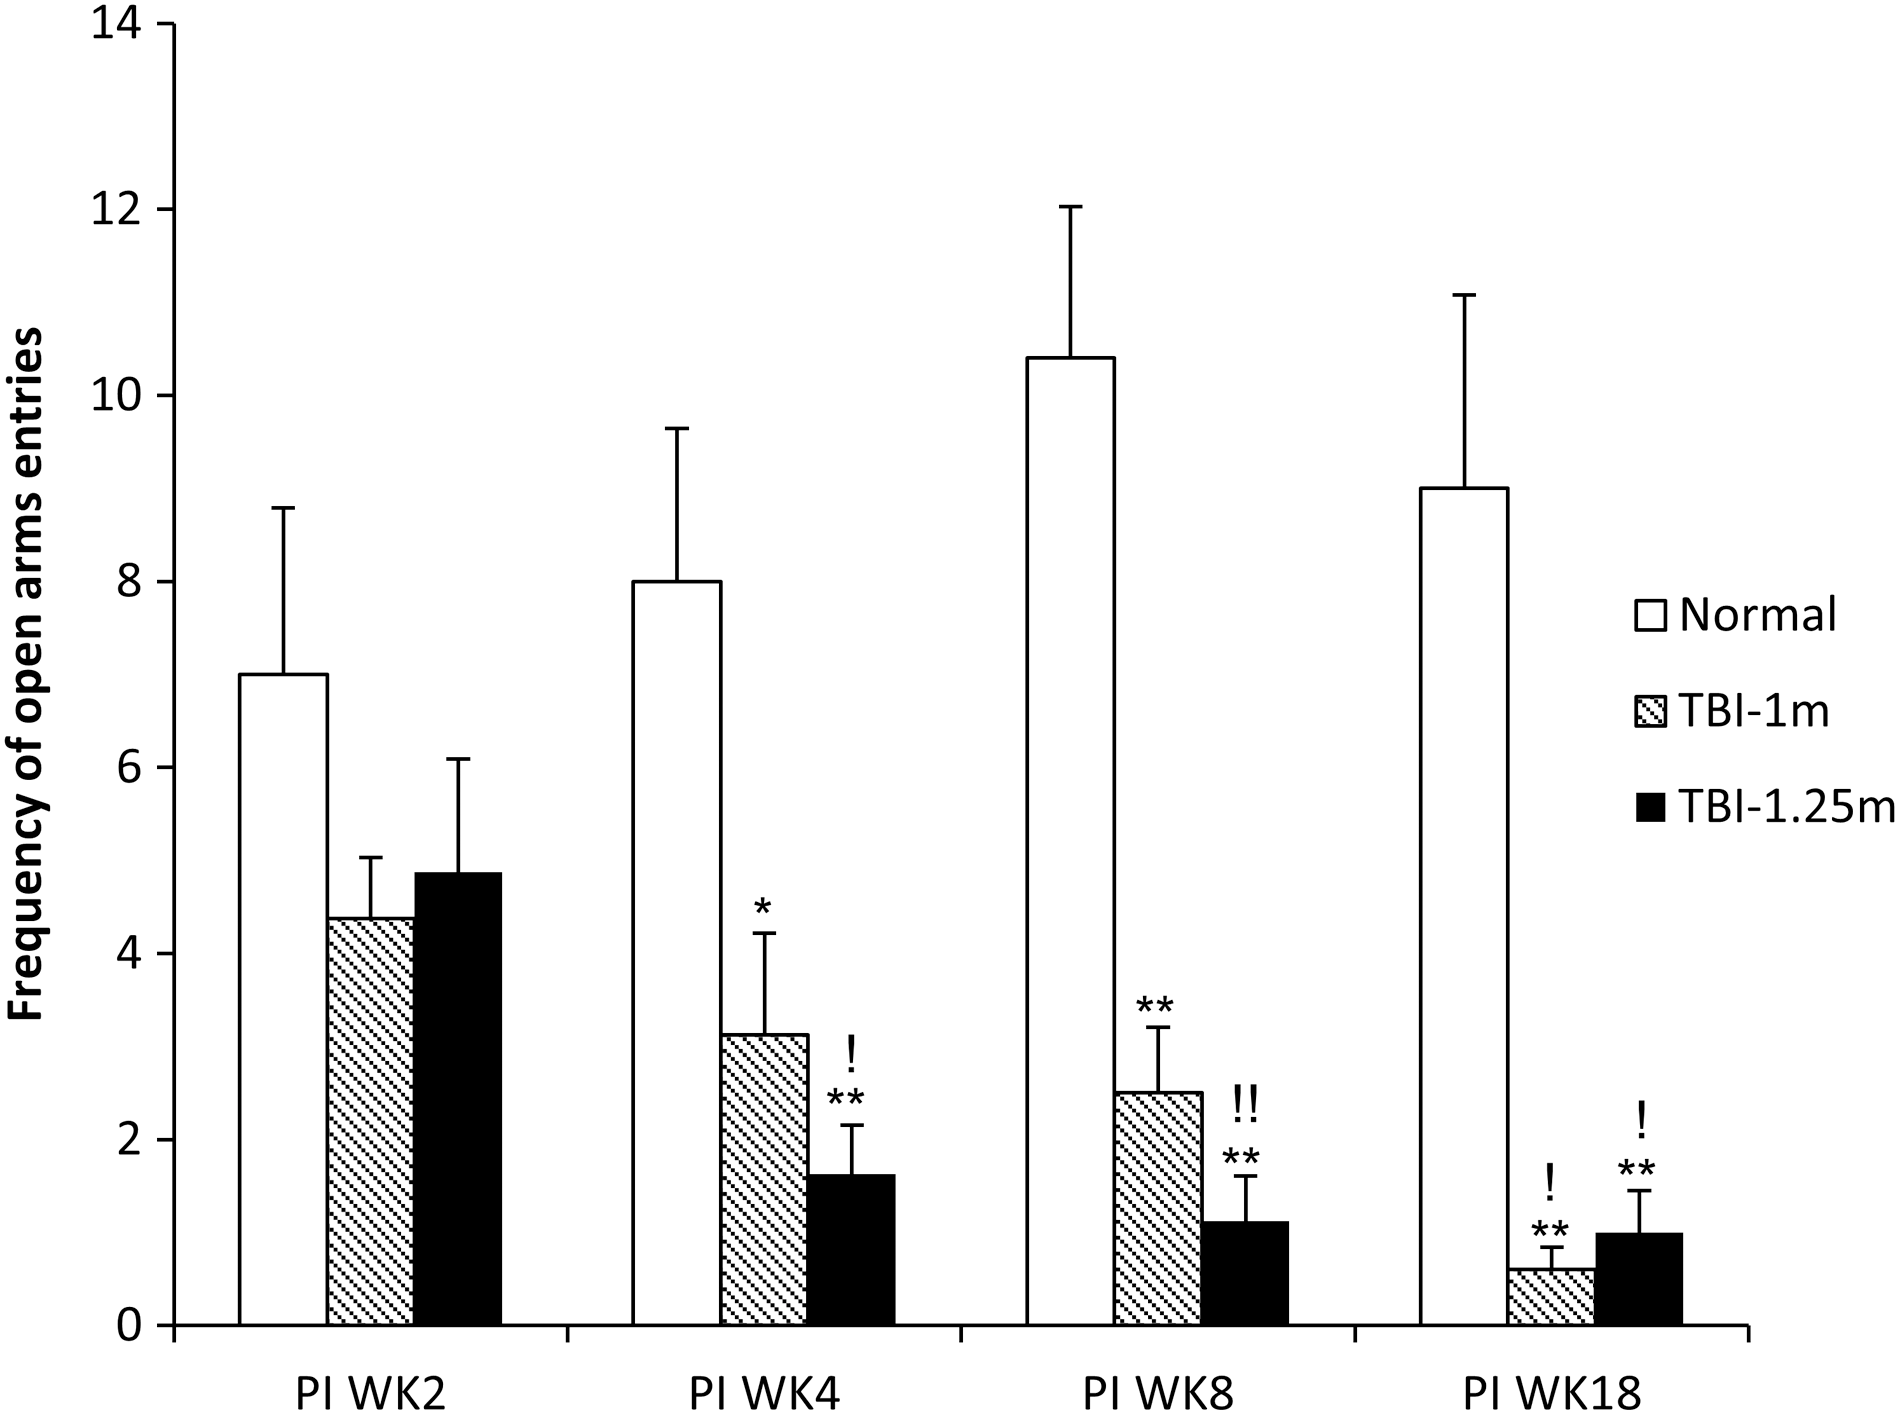
Frequency of open arms entries of Elevated Plus Maze tested at post-injury (PI) weeks (WKs) 2, 4, 8, and 18 in normal, TBI-1 m, and TBI-1.25 m groups. Both TBI groups showed significantly less open arms entries started at PIWK4 compared to normal. Both TBI groups showed significantly less open arms entries throughout the testing period, starting at PIWK4, when compared to values obtained from normal. ! p < 0.05; !! p < 0.01 compared to same group at PIWK2; *p < 0.05; **p < 0.01 compared to normal at the same time points. TBI, traumatic brain injury.
Morris Water Maze
Spatial serial learning performance was tested using a MWM at PID11 and PIWK 8 (Fig. 5). The animals were tested for 4 consecutive days at each time point and latency to platform, total distance, cumulative distance, and swimming speed were analyzed with EthoVision XT software (version 8.0; Noldus). Compound deficit scores were also calculated for further evaluation of this maze performance (see Methods section for details of this calculation).
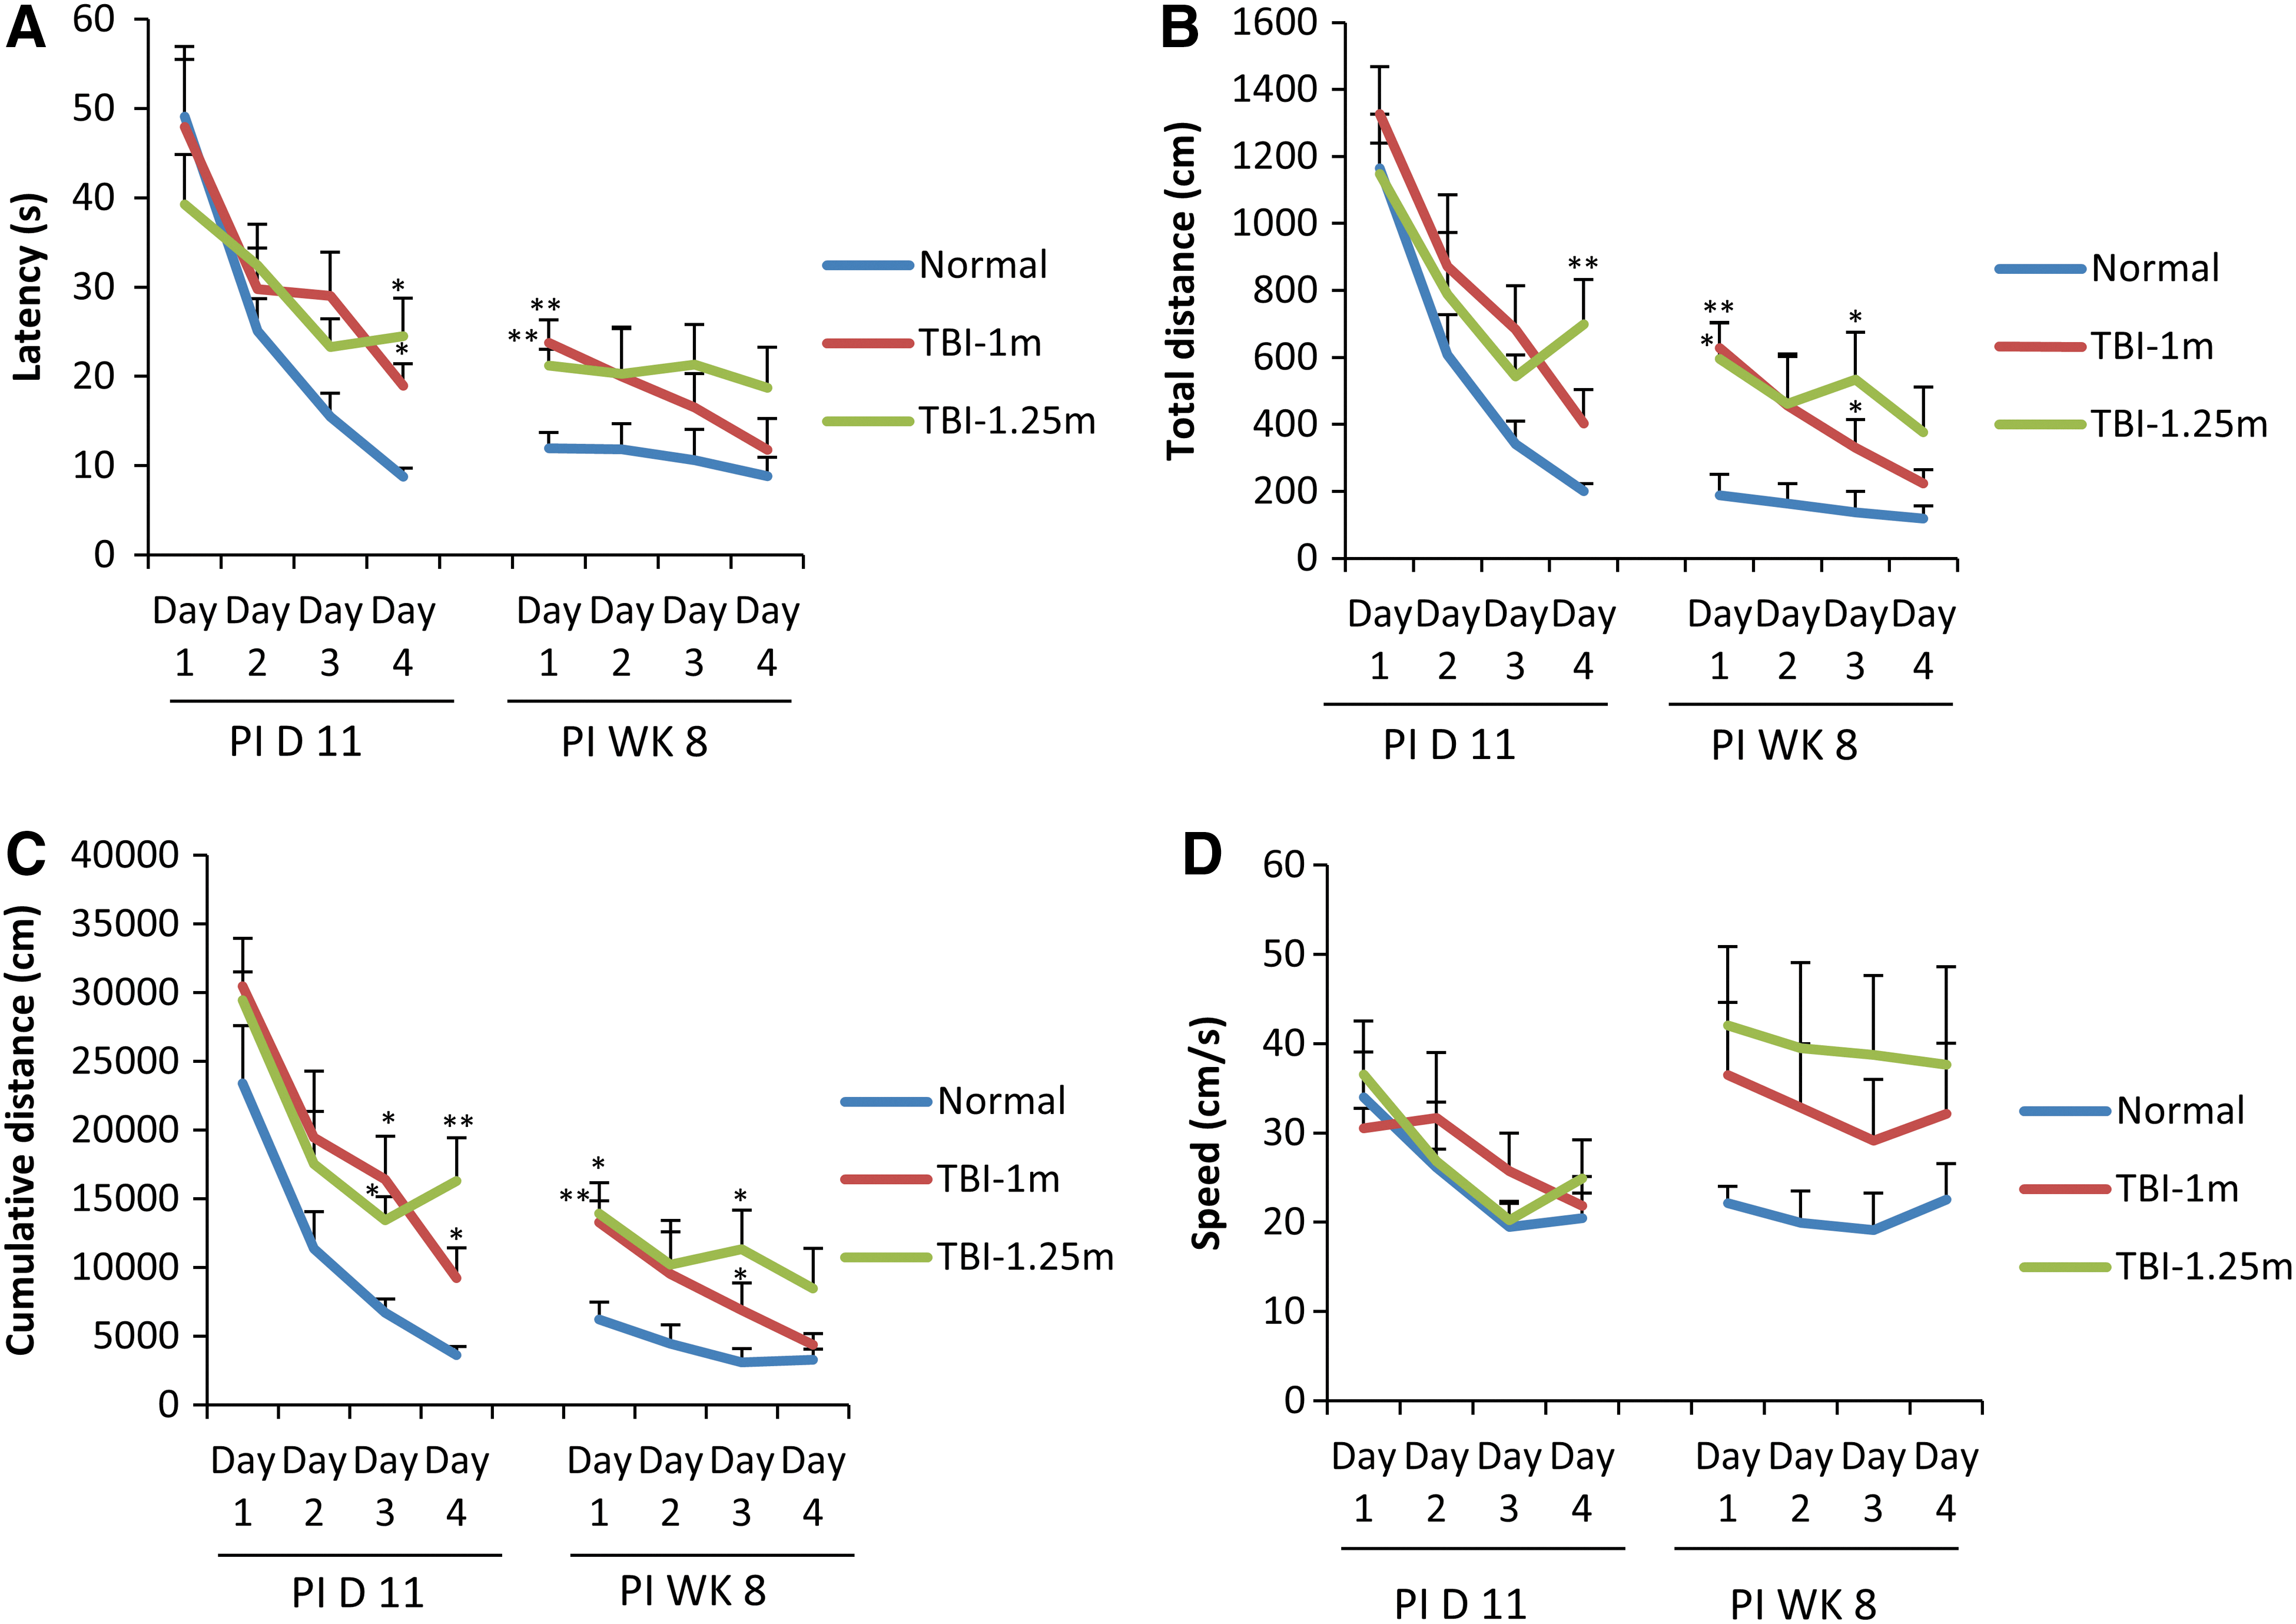
Animals were tested for 4 conjugative days in a Morris Water Maze for serial learning starting at post-injury day (PID) 11 and post-injury week (PIWK) 8. The latency to platform (
Latency to platform
Mean search latencies for both TBI groups were observed to be significantly longer than the mean latency observed for normal animals on test day 4 of the PID11 testing session and day 1 of the PIWK8 testing session (Fig. 5A).
Total distance
At day 4 of the PID11 testing session, the TBI-1.25 m group showed significantly longer total distance compared to the value obtained from age- and sex-matched normal animals (Fig. 5B). At days 1 and 3 of the PIWK8 testing session, both TBI groups showed significantly longer total distance compared to the values obtained from age- and sex-matched normal animals. There were no significant differences between these two TBI groups in any of the two corresponding values obtained from these two testing sessions.
Cumulative distance
At days 3 and 4 of PID11 testing session, both TBI groups showed significantly longer cumulative distances compared to the values obtained from normal controls, and these TBI animals maintained longer cumulative distances at both days 1 and 3 of the PIWK8 testing session (Fig. 5C).
Swimming speed
No significant differences in swimming speed were observed among these three groups of animals (Fig. 5D), although a trend for greater swim speed was observed at PIWK8 for both TBI groups compared to the values obtained from the age- and sex-matched normal controls.
Rotorod
Rotorod balance function was tested pre-injury and at PIWK2, 4, 8 and 18. TBI animals spent significantly less time on the rotorod at PIWK8 and 18 compared to scores observed pre-injury and with scores observed in the age- and sex-matched normal controls (Fig. 6). The decline in balance performance in the TBI animals appeared as a pattern of progressively increasing disability compared to normal. Significant balance deficits initially appeared in test sessions performed at PIWK4 in the TBI-1.25 m group and at PIWK8 in the TBI-1 m group. The balance deficits recorded in the TBI-1.25 m group were significantly greater than observed in the TBI-1 m group at PIWK8 (p = 0.02, Fig. 6). The appearance of disability was observed earlier and regression of rotorod scores observed versus time revealed that the decline progressed at a greater rate in the 1.25-m TBI group than observed in the 1.0-m TBI group (data not shown here). Accordingly, the appearance, severity, and progression in balance performance deficits were greater in the 1.25-m TBI group compared with the 1.0-m group.
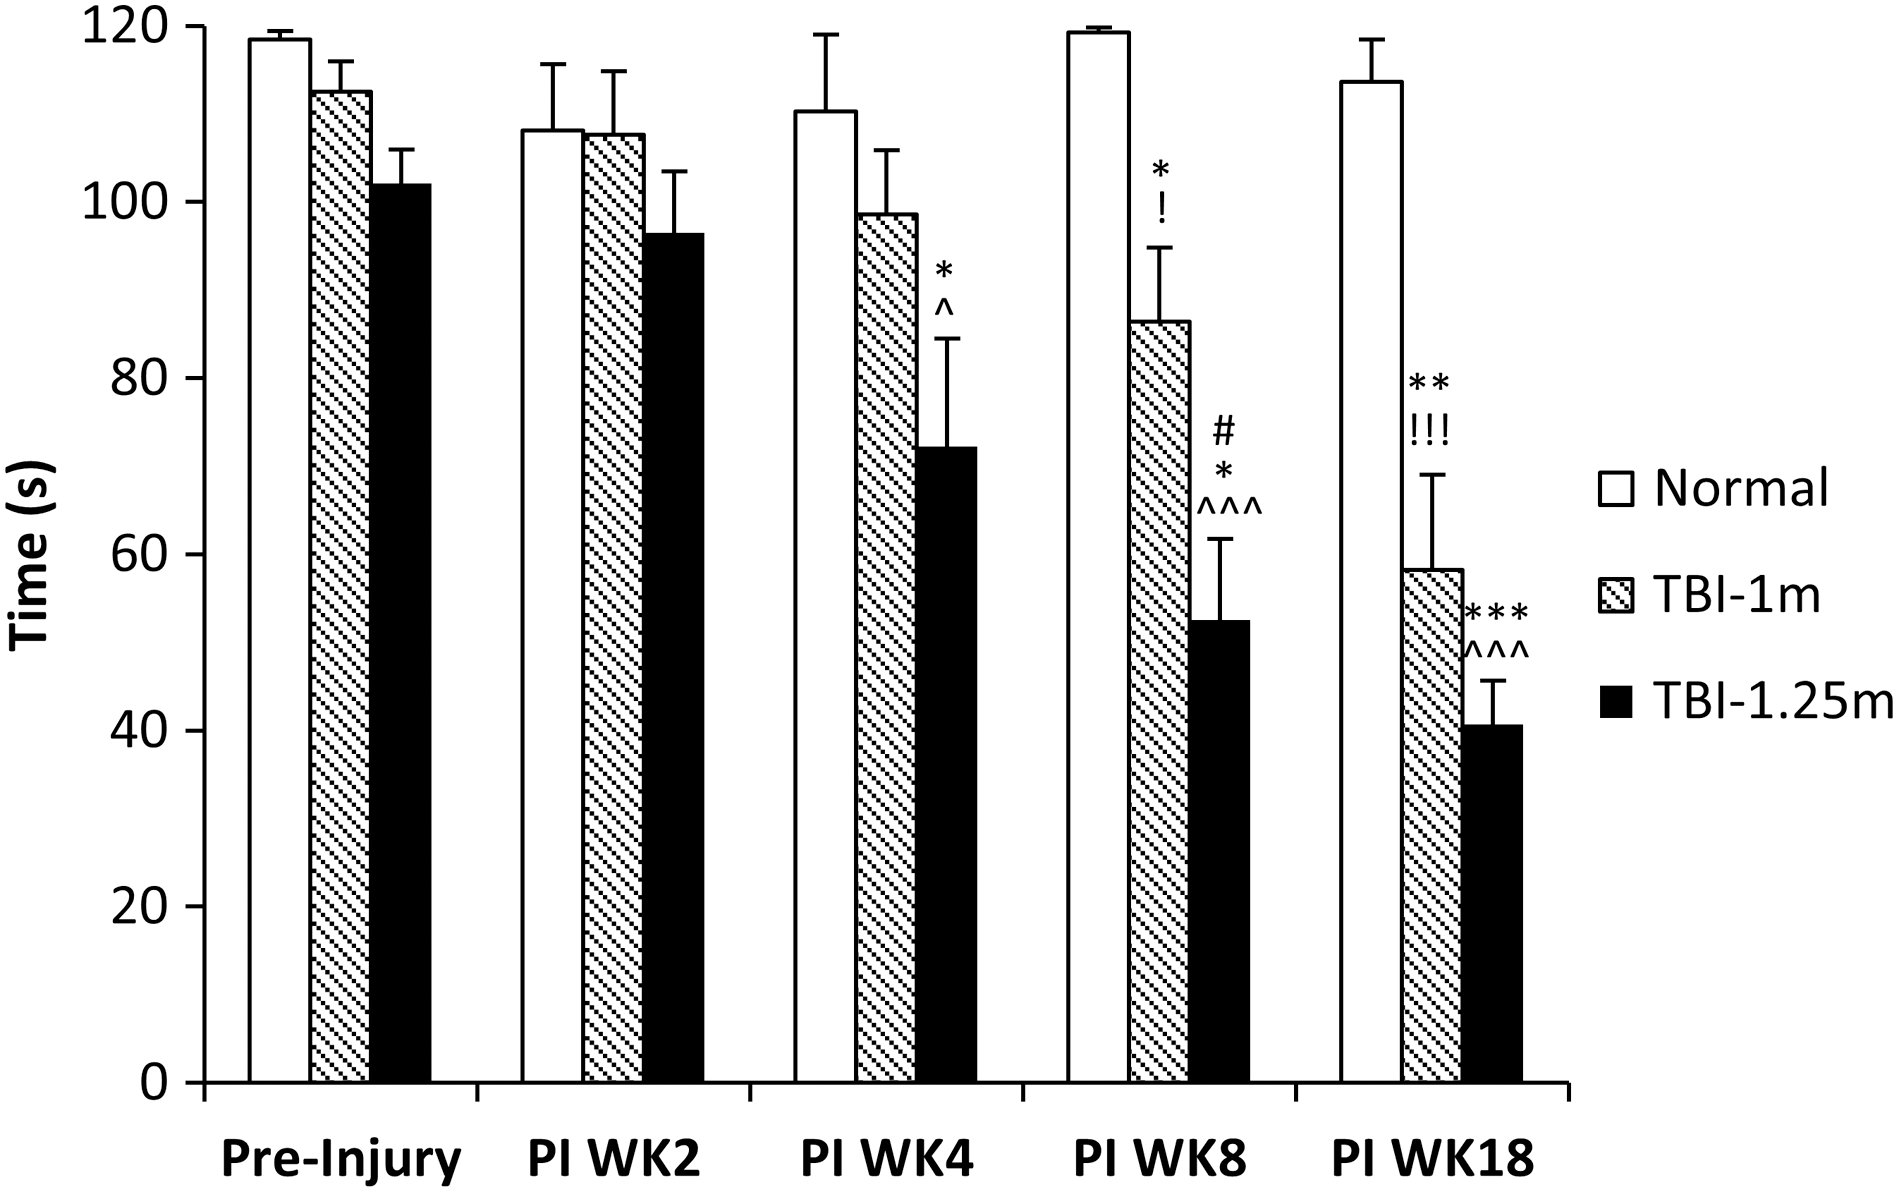
Balance function was tested with rotorod at pre-injury (PI) weeks (WKs) 2, 4, 8, and 18. Time spending on the rotorod of each group is shown. Both TBI groups showed progressive and significant deterioration of rotorod performance in chronic testing periods. This significant deterioration of rotorod performance was detected as early as PIWK4 in the TBI-1.25 m group and PIWK8 in the TBI-1.0 m group. ! p < 0.05; !!! p < 0.001 compared to TBI-1.0 m at pre-Injury; ^ p < 0.05; ^^^ p < 0.001 compared to TBI-1.25 m at pre-Injury; *p < 0.05; **p < 0.01; ***p < 0.001 compared to normal at the same time point; # p < 0.05 compared to TBI-1.0 m at PIWK8. TBI, traumatic brain injury.
Rate depression of tibial/plantar H-reflexes
Rate depression of the tibial/plantar H-reflexes was tested at the final time point, PIWK18. Compared to age- and sex-matched normal animals, the TBI-1.25 m group showed significantly reduced rate depression (i.e., larger amplitude waveform) at the three highest tested frequencies (these means of these amplitudes were 77.58%, 94.10%, and 114.92% larger than the amplitude means observed in the controls at these frequencies; p = 0.04, 0.04, and 0.03, respectively; Fig. 7). TBI-1.0 m animals also showed similar reduction pattern in rate depression (47.38%, 60.58%, and 90.20% reduction, respectively, at those three highest test frequencies; see Fig. 7). However, only at 10 Hz was this reduction significantly different when compared to the corresponding value in normal (p = 0.03).
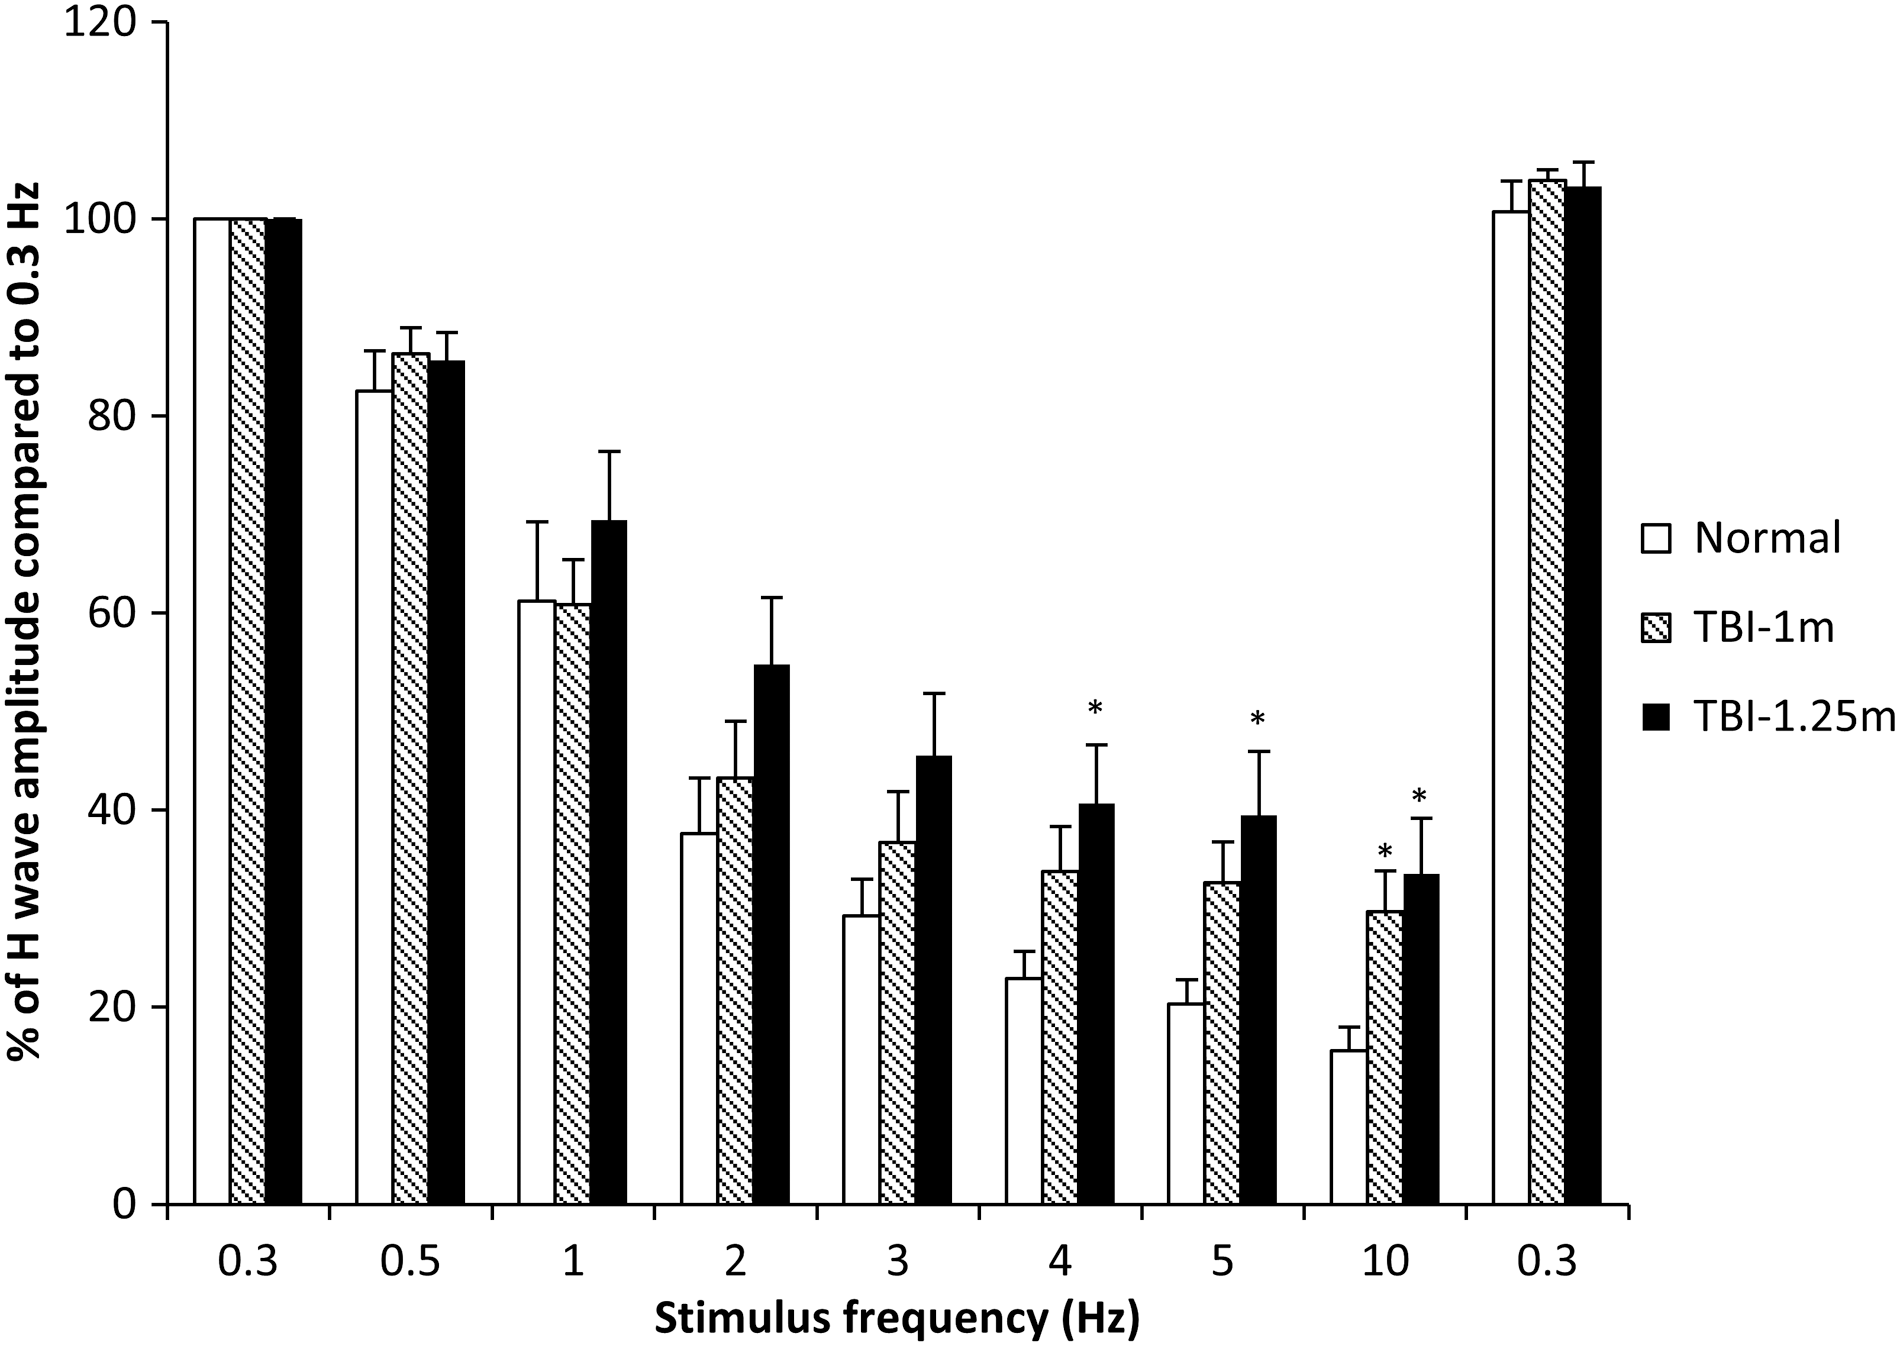
Rate depression of the tibial/plantar H-reflex was tested at pre-injury week 18. The percentage of H-wave amplitudes compared to the values obtained at 0.3 Hz is shown. Both TBI groups showed significantly less rate depression at the highest testing frequency (10 Hz) compared to the value obtained in normal animals. In addition, the TBI-1.25 m group showed significant differences in rate depression at 4- and 5-Hz testing frequencies compared to normal. *p < 0.05 compared to normal at the same testing frequency. TBI, traumatic brain injury.
Discussion
It is known that long-term disabilities are common post-mTBI in humans, with anxiety-, cognitive-, and balance-related issues being the most disruptive to the life quality of the reported disabilities. 5 Impact acceleration TBI in the rat replicates many of the features of the most frequent types of TBI in humans, for example, falls and vehicular injuries. However, most studies utilizing impact acceleration TBI in rats have reported that behavioral effects post-mTBI (e.g., 1-m weight drop) were transient. 26 –28 Our studies were conducted to evaluate long-term disabilities in a well-characterized cTBI rodent model where two intensities of TBI were chosen to produce a range of mTBIs. In this regard, it is worth noting that the original closed head Marmarou TBI model 11 1.0- and 1.5-m weight drop injuries were considered as mild and moderate injuries, respectively. Subsequent studies using the Marmarou impact/acceleration model have typically reported that 1.0 m × 450 g injuries produced histological and behavioral findings consistent with mTBI. 12,19,28 However, 1.25 m × 450 g weight drop was not an injury parameter in the original Marmarou report. The 1.25-m weight-drop height was included in our studies to produce an injury that would, potentially, induce more detectable and enduring multiple disabilities within the setting of a mild-to-moderate TBI. Accordingly, it was of interest to perform post-injury measures to further evaluate the long-term disability elicited by 1.0- and 1.25-m drop injuries, respectively.
Impact/acceleration concussion threshold estimations
It is not known exactly how these mTBI injuries in the rat relate to human mTBI; however, human concussion modeling 29,30 and cross-species comparison studies 31,32 provide important considerations. To put the 1.0 m and 1.25 m × 450 g injuries into a comparative perspective, we considered force/injury findings revealed using rat and human brain models of impact/acceleration. The animal studies utilized rate sensors and high-speed digital image tracking to measure head acceleration. 19 The human head modeling studies used 3D sensory arrays in anatomically accurate viscoelastic models of brain gray and white matter to determine probabilities for concussion induced by head impact/accelerations at graded G-forces. 30 These studies replicated TBI accelerations and vectors extracted from analysis of videos of specific TBIs recorded during the regular season American Football League carefully correlated with the degree of injury. These data of injury versus impact/acceleration parameters provided estimates of concussion probability relative to TBI/accelerations produced by varying levels of G-force. These studies revealed that head accelerations of 70–82g induced a 50% probability of concussion, and an 80% probability of concussion at 106g, similar to values reported for the Wayne State Concussion Tolerance Curve. 33
Although at least five hypothetical mechanisms have been proposed for concussion 34 ; all of these are dependent upon the inertial (or acceleration) loading of the brain. 30,34,35 Given that inertia is a product of mass and velocity, brain mass plays a critically important role in the biomechanical requirements for inertial loading. In experimental tests of concussion tolerance as a function of brain mass (utilizing animal brains of varying mass), empirical studies revealed that brains with smaller mass have higher concussion thresholds; these studies revealed that to equate inertial loading attributed to acceleration loading in brains of different mass, the ratio of equivalent accelerations was determined to be equal to the inverse of the brain mass ratio raised to the one-third power. 29,31 –33,36,37
Therefore, comparing the brain mass ratio, human/rat (1300 g/2 g) raised to the one-third power yields a multiplier of 8.66. Accordingly, to scale the 1.0 m × 450 g injury (which produces a peak acceleration of 630g) in the rat to humans, division of the 1.0 m × 450 g (630g) by 8.66 yields 72.7g; and dividing the 1.25 m × 450 g (which produces a peak acceleration of 697.5g) by 8.66 yields 80.54g. Although these are rough estimations attributed to the significant differences in the anatomical axes of the brains and the uncalculated differences in angular acceleration, this scaling still provides a useful comparison of the acceleration/biomechanical loading of the two injury settings.
Mild traumatic brain injury
The Centers for Disease Control and Prevention, the Defense Center of Excellence, and the American Congress of Rehabilitation Medicine agree on the classification of human cTBI as mild for those injuries sustaining a period of unconsciousness <30 min and no structural anatomical injuries observed with screening CT or MRI. In our studies, the mean period of unconsciousness following injury was observed to be 4 min 56 sec, but this was only 1 min 27 sec longer than the anesthesia-induced unconsciousness observed in sham-injured animals. Conventional MRI screening (7.0T MRI; T2W) did not reveal any detectable anatomical injuries, mid-line shift, or hemorrhagic masses in 1.0 m or 1.25 m/450 g weight-drop injuries. Therefore, based upon the brief period of unconsciousness, no detectable anatomical injuries in screening MRI, and scaled inertial loading of 70 – 80g, applying human screening criteria, these TBIs produced by 1.0 m and 1.25 m/450 g would be classified as mTBIs.
Closed head traumatic brain injury model for multiple morbidities (use of common data elements: standardized injury)
Successful therapy for TBI disabilities awaits a refinement in the measurement of injury-induced multiple disabilities and quantitative measures of treatment-induced incremental changes in recovery trajectories. Such quantitative studies of recovery are fundamental to the understanding of TBI neurobiology that is critical for effective translation of new knowledge to the treatment of human TBI disabilities. Several pre-clinical TBI models are currently used, and each offers opportunities for study of different aspects of primary and secondary TBI injuries. 15,16,38 –40 The closed head, impact-acceleration model of TBI designed by Marmarou and colleagues 11 used to produce controlled, graded TBI (depending on impactor drop height, impactor weight, foam resistance, and accuracy of impactor contact) produces DAI without significant additional focal injuries of the brain. 12,13,28,38 Accordingly, use of this pre-clinical model, adhering to essential common data elements, 18 provides a systematic injury platform capable of producing standardized injuries for quantitative assessment of TBI-induced disabilities that have been commonly observed in human TBI patients.
Anxiety-like behavior
Anxiety disorder is known to be an important comorbidity associated with mTBI. 41 –43 In the present studies anxiety-like behavior was assessed using an EPM with video-tracking hardware and software (a well-established automated behavioral tool and technique that eliminates the influence of investigator presence in the immediate vicinity of the maze). The EPM exploits the behavioral conflict between the tendency of rodents to explore a novel environment and the aversive properties of the open arms. 44 It was previously reported that subsequent to fluid percussion TBI, rats displayed increased anxiety-like behaviors throughout the study that included tests as long as 6 months post-injury. 45 In our current studies, there is a progressive deterioration in TBI animals' anxiety-like behavior evidenced by the progressively shorter time spent in the open arm (and longer time spent in the closed arm when tested in chronic time points). It is interesting that the TBI-1.0 m group exhibited a linear progressively worsening (R 2 = 0.96) anxiety-like behavior over post-injury 18 weeks.
Although anxiety is a complex behavior with many neuronal substrate centers and systems (input/output) involved in regulating this behavior, the influence of cellular activity of the locus coeruleus (LC) with the expression of fear or anxiety behavior has been reported for more than 30 years. Our recent studies using the cTBI rodent model (1.25 m) showed a 56% reduction in dopamine beta-hydroxylase (a surrogate marker for norepinephrine), expressing neurons in the LC and drastically reduced noradrenergic (NA) fibers expression in the central nucleus of amygdala, a known center for emotional reactions, memory, and decision making, after chronic cTBI. 13,46 Our recent results 46 suggested that prolonged anxiety-like behaviors observed in these animals may partly be related to the dysregulated NA system. Because the LC (in addition to A1 and A2 cell groups and the solitary nucleus) provides the NA support for many central nervous system (CNS) neural circuits, many disparate CNS disabilities, including anxiety, motor, cognitive, and balance functions, are coherently tied to TBI-induced dysregulation in this central norepinephrine system. 47
Cognitive disabilities
Serial learning performance was tested at acute and chronic time points (starting at PID11 and PIW8) using a 4-day serial repeated measure protocol in an MWM. The MWM navigation task is known to measure spatial memory, movement control, and cognitive mapping. TBI animals demonstrated longer seek latencies (Fig. 5A), search distance (Fig. 5B), and cumulative distances (Fig. 5C) than age- and sex-matched intact control animals. Because the TBI animals demonstrated significant increases in search distances (total and cumulative distances) without an alteration in search speed (Fig. 5D), it was concluded that their decreased ability to locate the platform was attributed to significantly impaired cognitive function rather than diminished ability to swim. Both TBI groups demonstrated a similar pattern of search distances (total distances) and search strategy (cumulative distances). These data may indicate the uniformity of impairment in neural substrates related to search strategy in cognitive function between these two injury groups. Both TBI groups exhibited depreciated learning capacity and relied on random and closing circle search strategies to locate the platform requiring search latencies that were multiples of those observed in the normal intact animals, especially at the end of first session (PID11) and the beginning of the second session (PIWK8). These data revealed that both cTBI groups utilized significant increases in the latency (and search path length) to acquire a hidden platform compared to intact controls. Interestingly, at the beginning day of the second testing session (PIWK8), both TBI groups maintained similar differences in their seek latencies, path lengths, and search strategy (cumulative distance) compared with the differences at the end of the first session. However, compared to the1.25-m TBI group, the TBI-1.0 m group overall exhibited a steeper serial learning curve during the chronic cognitive testing (Fig. 5 A–C; Table 1), exhibiting values, at the end of the testing session, that were similar to values from intact normal controls. This particular pattern is consistent with that reported by Maruichi and colleagues for cognitive testing at a subchronic point (2-week) after a mild impact TBI. 27 However, these investigators presumed that the normalized latencies observed during days 2–4 reflected a normalization of cognitive performance and concluded (perhaps incorrectly) that the cognitive deficit was transient. Because we observed this pattern at PIWK8, it is more likely that the mild TBI cognitive deficit is not transient, These observations suggested a different pattern of learning disability in the two TBI groups. Experimental and clinical reports suggest that mild or mild/moderate TBI-induced cognitive deficits may be caused by damage to the hippocampus and hippocampal-dependent function 48,49 from primary and secondary injuries. Our recent report showed cell loss and a large number of morphologically abnormal surviving neuronal cells in the hippocampal tissue of the 1.25-m cTBI group. 50 These data suggest that both cell loss and altered morphology of hippocampal cells contribute to cognitive deficits in cTBI. 50
Least-squares linear regression of latencies for platform discovery revealed that the regression slopes (rate of change for platform discovery over the 4 days) for normal, TBI-1 m and TBI-1.25 m were −13.07, −8.78, and −5.33 at POD8 testing and −1.06, −3.95, and −0.64 at POWK8 testing, respectively. These indicated the better learning curve of TBI-1 m compared to TBI-1.25 m. Note at POWK8 testing, the normal group did not show an obvious learning slope attributed to the ceiling effect.
MWM, Morris Water Maze; POD, post-operative day; POWK, post-operative week; TBI, traumatic brain injury.
It is also interesting that in this chronic period of recording, both TBI groups exhibited a trend for a greater swim speed compared to normal (Fig. 5D). Although the basis for this is not known, it could be related to a greater level of anxiety exhibited in these animals at this post-injury time (see Fig. 4).
Vestibulomotor and motor disabilities
Vestibulomotor disability
Balance disability is a frequent complaint post-TBI in humans. 5,51,52 Balance tested using the rotorod has been reported as a sensitive measure of disability in experimental rodent models of TBI. 20 Consistent with previous studies, 13,20 both 1.0- and 1.25-m TBI animals revealed significant and enduring decreased rotorod performance (Fig. 6). In the previous studies, 13 significant balance deficits were observed by 2 weeks after 1.5-m TBI. However, following the milder injuries of the present study, the appearances of significant balance deficits were delayed, PIWK4 (1.25 m) and PIWK8 (1.0 m), respectively.
The neurobiology of the TBI-induced balance disability is not known. However, given that DAI is the hallmark injury of this model, it is likely that the injury involved the vestibular system directly or connections that regulate the excitability of the vestibular system. One promising candidate would be TBI-induced dysregulation of central noradrenergic connections, given that previous studies have revealed significant involvement of the noradrenergic system in the regulation of vestibulospinal reflex gain through noradrenergic innervation of the vestibular system. 53 –56 This candidate is also consistent with our previous observations, which detected significant cell loss in the nucleus locus coeruleus, known to provide extensive regulatory noradrenergic projections to the vestibular nucleus. 13
Motor disability
Rate-dependent inhibition provides a protocol for evaluating inhibitory processes with different time courses. Rate-dependent inhibition at lower frequencies (e.g., 1–3 Hz) reveals the inhibitory contribution of long-acting presynaptic inhibition (inhibition with a time course of >300-msec duration) that regulates the excitability of the muscle stretch reflexes relative to the phase of stepping. Rate-dependent inhibition, particularly at low frequencies, has been closely associated with a presynaptic action of gamma-aminobutyric acid type B (GABAb) receptors. Rate-dependent inhibition at higher frequencies (e.g., 10 Hz), on the other hand, tests a combination of long- and short-acting inhibitory/facilitatory processes. The reduction of high-frequency rate-depression may relate to decreased GABAa pathway and potentially, alterations in plateau potentials induced by the persistent inward dendritic current in spinal cord after TBI-induced alteration in monoamine regulation of spinal reflex excitability.
TBI-induced decreases in rate depression of the soleus H-reflex at 1.25-m TBI produced significant differences in three test frequencies, whereas significant decrease in rate depression was observed in only one of the test frequencies in the 1.0-m TBI group, compared to rate-depression tested in normal animals. The significant differences were observed only at the higher test frequencies. It is known that rate depression is significantly impacted by pre-synaptic inhibitory and post-synaptic facilitatory processes that are intrinsically modulated by descending monoamine projections. Accordingly, TBI-induced alterations in descending monoamine projections may, in part, account for the observed changes in rate depression post-TBI. Accordingly, mTBI may induce enduring changes in fundamental processes that regulate motor reflex excitability.
Conclusions
Our studies have revealed long-term disabilities in four test behaviors after two intensities of mTBIs (1.0 m and 1.25 m/450 g). The methods and protocols that we used provided quantitative measures of progressive and enduring disabilities in anxiety-like, cognitive, vestibular, and motor behaviors up to 18 weeks post-TBI. These disabilities are consistent with many of the features/disabilities of mild and mild/moderate human TBIs. Although both TBI groups exhibited detectable deficits in each of these test behaviors, the magnitude and trajectory of these disabilities were different between these two TBI groups. Surprisingly, anxiety measures for the mildest injury actually progressed to reveal the greater disability. Interestingly, this finding is, potentially, an alert regarding the appearance of anxiety disorder post-mTBI. The disappointing lack of success in human clinical trials testing experimental agents to enhance recovery post-TBI has, in part, been attributed to the lack of use of sensitive quantitative measures to assess incremental changes in the outcome of TBI disability and recovery. 41,57 –59 Accordingly, there is an urgent need for translatable methods and protocols to refine the expansion of quantitative measures in the experimental clinical setting. 16 Our findings may provide quantitative measures of progressive and enduring multiple disabilities that are hallmark features of mild and mild-to-moderate TBI-induced disabilities in humans.
Footnotes
Acknowledgments
This work was supported by the Office of Research and Development, Rehabilitation Research and Development Service, Department of Veterans Affairs Merit Review grant nos. B6570R, B78071, and B1005-R. The authors thank Joel John and Johnathan Joseph for their assistance in EPM, MWM data acquisition, and processing.
Author Disclosure Statement
No competing financial interests exist.