
Abstract
Diffusion tensor imaging (DTI) is more sensitive than conventional magnetic resonance imaging (MRI) for the identification of axonal degeneration. However, no study to date has used DTI to evaluate the severity of axonal degeneration in canine spinal cord injury (SCI). Therefore, the aim of this study was to characterize multi-grade axonal degeneration (mild, moderate, and severe) in a canine model of spinal cord compression injury using DTI. MRI data were obtained from 6 normal dogs and 5 dogs with lumbar SCI 78 days after SCI (L1–L3) using a 3 Tesla MRI scanner. For DTI, transverse multi-shot echo planar imaging sequences (b-value = 0; 800 s/mm2; 12 directions) were used. Regions of interest on DTI maps were selected based on areas of normal white matter (NWM) and mild, moderate, and severe axonal degeneration (AxD) on histopathological images. Statistically significant differences were observed between NWM and AxD, and among different severities of AxD. The severity of AxD demonstrated a negative linear correlation with fractional anisotropy and positive linear correlations with spherical index and radial diffusivity; additionally, positive U-shaped correlations were identified between the severity of AxD and mean diffusivity and axial diffusity (AD). These results demonstrate a potential clinical application for DTI in the noninvasive monitoring of histological changes post-SCI. DTI could be utilized for the early diagnosis and assessment of SCI and, ultimately, used to optimize the treatment and rehabilitation of SCI patients.
Introduction
S
Several animal models have been developed to investigate methods with potential to improve the diagnosis, therapy, and monitoring of SCI. 6 –8 Canine models of SCI have frequently been used to monitor neurological responses and obtain imaging data, because dogs have a relatively large spinal cord and represent a higher-level organism relative to rodent models. 9 Percutaneous compression injury is a minimally invasive SCI modeling method. It causes a compression injury of the spinal cord by balloon catheter placed at the epidural space of the target location, using epidural needle, guide wire, dilator, and introducer, and is performed without laminectomy and muscle and skin incision. 8 Percutaneous compression injury is an inexpensive, technically simple method that replicates canine and human intervertebral disc disease. 6 Further, the use of percutaneous compression injury minimizes the impact of surgery-related complications, such as infection, inflammation, and vascular damage, on imaging findings. 6,8
Central nervous system lesions are predominantly diagnosed through the use of magnetic resonance imaging (MRI); however, conventional MRI has limitations with regard to the detection of early-stage lesions and the differentiation and localization of lesion types. 10,11 Diffusion tensor imaging (DTI) is an advanced diffusion-weighted imaging sequence that strongly correlates with histopathology and is more sensitive for detecting acute and chronic nerve injuries. 5,12 In addition, DTI analyses yield a variety of diffusion parameters that are useful for establishing quantitative lesion criteria. 13 Whereas DTI studies of SCI have been conducted in several mammalian species (e.g., rat 14 , cat 5 , and pig 12 ), few studies have investigated the application of DTI in dogs. In particular, no study to date has used multiple DTI parameters, including fractional anisotropy (FA), planar index (Cp), spherical index (Cs), radial diffusivity (RD), mean diffusivity (MD), and axial diffusity (AD), to characterize lesion severity in canine SCI (multi-grade axonal degeneration) with regard to histopathological hallmarks. Cp and Cs are indices demonstrating the planar and spherical magnitude of tensor shape, respectively. Because Cp and Cs are farther from 0 and closer to 1, the tensor shapes become more planar and spherical, respectively. A high Cp indicates many crossing and twisting fibers or tubular structures. A high Cs represents more similar diffusion in all direction to loss of normal structure. Cp denotes 2 × [the intermediate eigenvalue (λ2) – the smallest eigenvalue (λ3)]/[the largest eigenvalue (λ1) + λ2 + λ3]. Cs equal to 3 × λ3/(λ1 + λ2 + λ3). 15,18
Correlations between DTI parameters and grades of AxD have not been considered in previous studies. The ability to classify histopathological severity is critical for selecting an appropriate therapeutic intervention in SCI patients. Individual analyses of each DTI parameter will inform the relevance of parameters to different lesion characteristics and ultimately make it possible to select the most useful DTI parameters for evaluating AxD severity.
Therefore, the aim of this study was to characterize and differentiate severities of AxD in a canine model of SCI, and to identify correlations between the severity of AxD and different DTI parameters.
Methods
Animals
This study was approved by the Institutional Animal Care and Use Committee (IACUC) of Konkuk University (IACUC no. KU15015, approved on January 23, 2015). Six beagle dogs (5 intact males and 1 intact female) weighing between 6.5 and 9.2 kg and between 2 and 6 years of age were used. The inclusion criteria were satisfied based on normal findings after physical and neurological examinations, laboratory blood analysis, and spinal cord MRI examination.
Spinal cord injury modeling
Five dogs were subjected to SCI. Minimally invasive spinal cord compression injury was induced using a balloon catheter compression method as previously described, 8 with some modifications. Each dog received an initial injection of subcutaneous (s.c.) glycopyrrolate (0.01 mg/kg) and intravenous (i.v.) cephazolin (20 mg/kg) and tramadol (4 mg/kg). The glycopyrrolate was used to prevent excessive reduction of heart rate and systemic blood pressure during isoflurane anesthesia. The cephazolin and tramadol were injected to prevent possible infections, and to reduce pain during the percutaneous spinal cord compression injury procedure, respectively. Next, the dogs were anesthetized with i.v. propofol (Anepol®; 6 mg/kg; Hana Pharma, Hwasung, Korea), and anesthesia was maintained with inhaled 1.5% isoflurane (Foran® solution; Choongwae Pharma, Seoul, Korea). Isoflurane was increased to 2.5% during the spinal cord compression procedure. Rectal temperature, oxygen saturation, and pulse rate were continuously monitored using electrocardiography during anesthesia. A respiration rate of 15 breaths per minute was maintained using a ventilator.
Dogs were laid in sternal recumbency on a hard pad, and the caudal part of the body was elevated with a soft pad. An 18-gauge epidural needle was inserted into the epidural space by L7-S1 using fluoroscopic guidance (FPD mobile Mini C-arm PLADEN RD-400; Rouumtech Co., LTD, Goyang, Korea). Next, a guide wire was introduced through the needle (Fig. 1A,D). After the guide wire reached the epidural space, the epidural needle was removed, and a 6F dilator and introducer (Radifocus® introducer II standard kit; Terumo, Tokyo, Japan) were inserted along the guide wire. The dilator and guide wire were subsequently removed, and a 5Fr Fogarty balloon catheter (Arterial Embolectomy Catheters; Edwards Lifesciences LLC, Irvine, CA) was advanced toward the epidural space of L2 through the introducer under fluoroscopic guidance (Fig. 1B,E). Then, the dogs were moved using the hard pad (to prevent any changes in position), and computed tomography (CT; LightSpeed; GE Medical systems, Milwaukee, WI) scanning was conducted. Under CT guidance, the location of the balloon was reconfirmed, and the balloon was inflated with the contrast medium (Omnipaque; GE Healthcare, Cork, Ireland) diluted to 1:1 with saline until the desired compression rate for causing injury of all spinal cord layers was achieved (>75%; Fig. 1C,F). 8 In the procedure, volumes of the diluted contrast medium from 0.75 to 1 mL were used to consistently produce a compression rate >75% in different spinal canal sizes of Beagles attributed to variable physiques. The inflated balloon for the compression injury was maintained in place for 30 min. The directly injured spinal cord was a length of spinal cord of approximately 1.5 cm in L2.
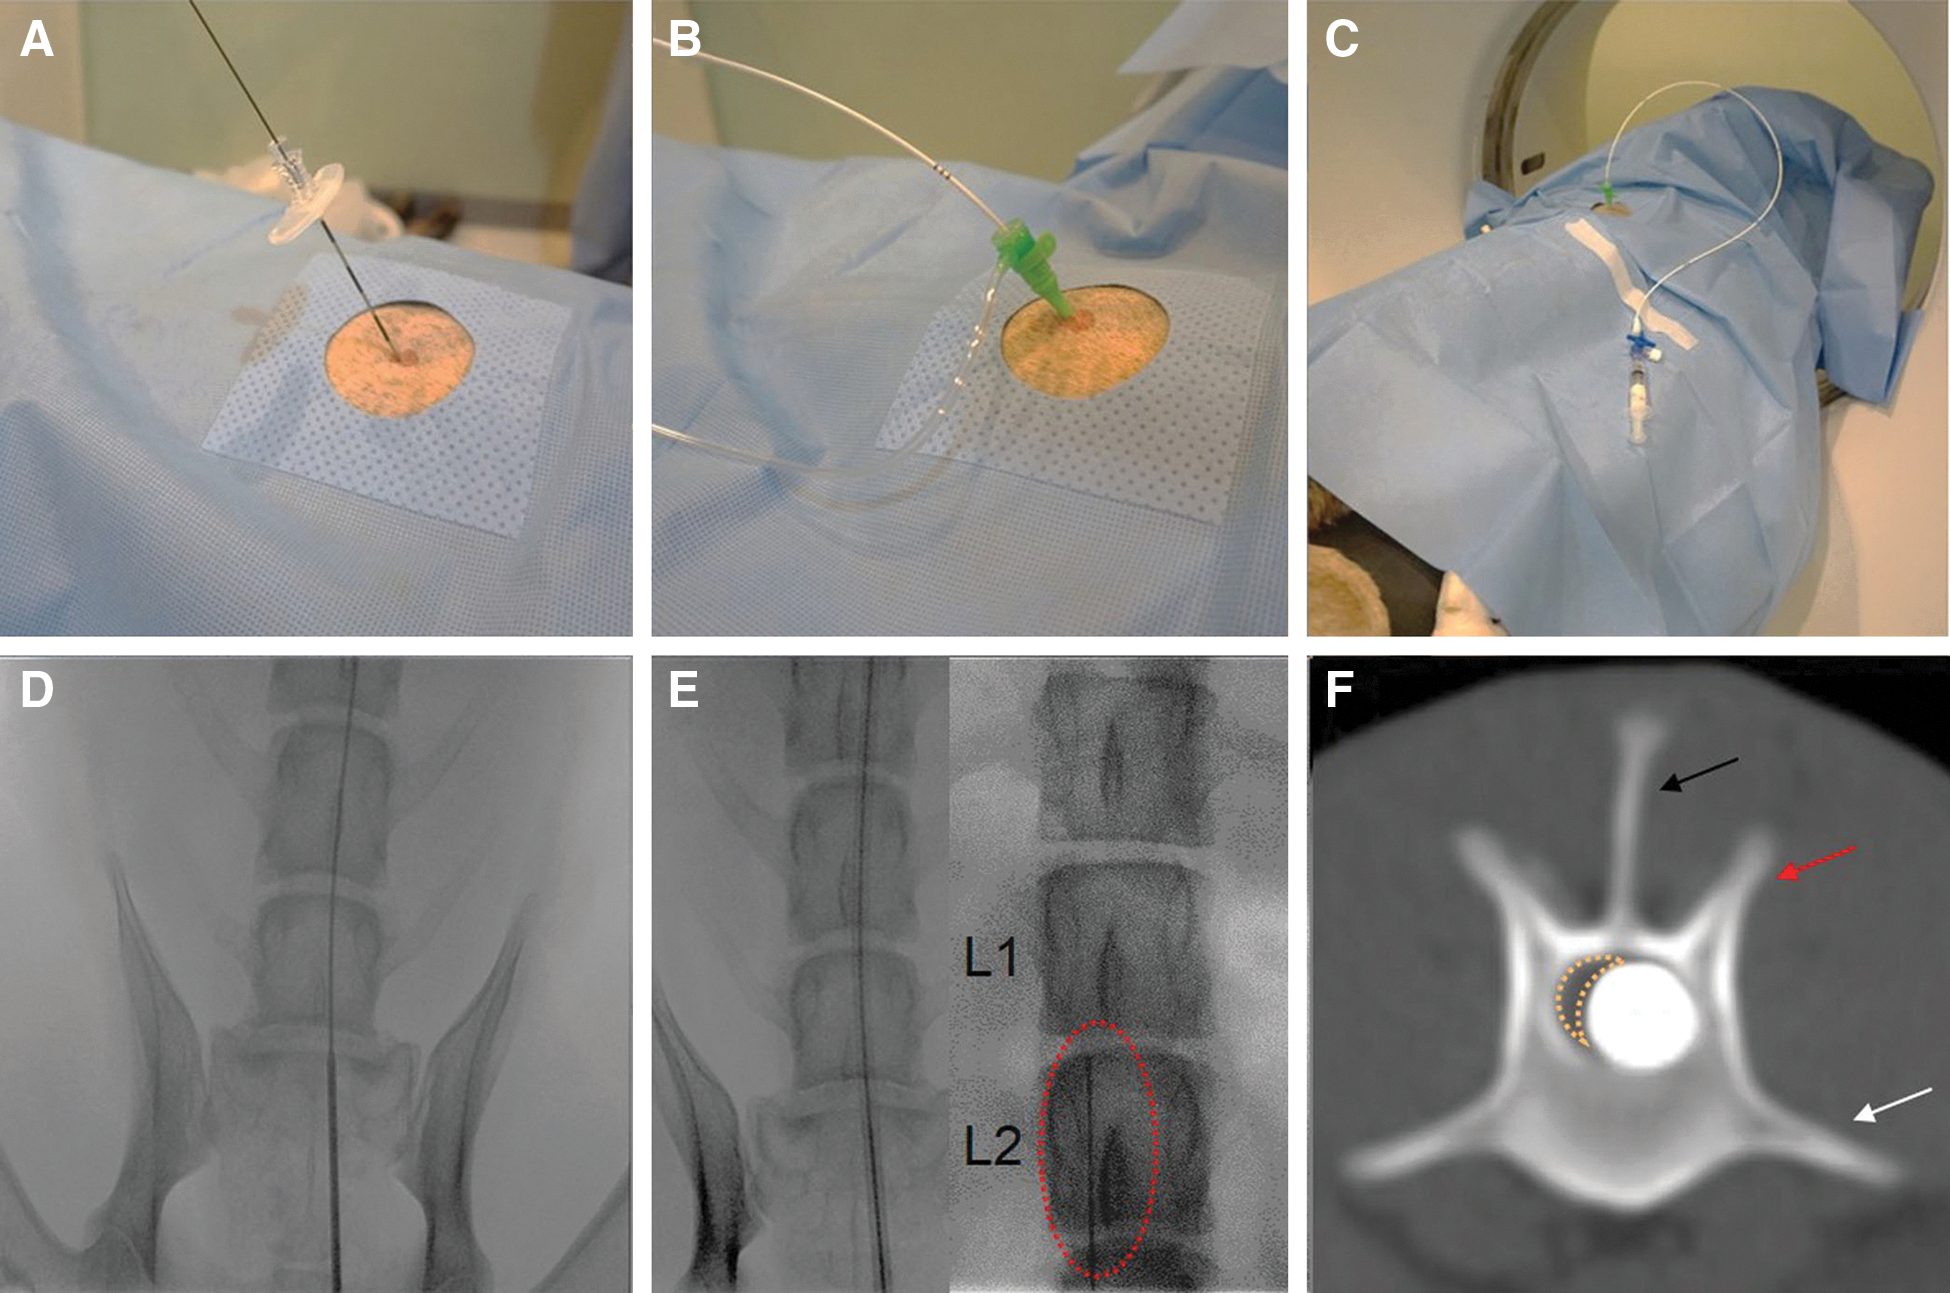
Spinal cord injury modeling. (
After the procedure, the balloon catheter was deflated and removed. Postoperatively, dogs received s.c. cefovecin (4 mg/kg) once and i.v. tramadol (2 mg/kg) three times daily. Manual bladder expression was performed daily as needed; if manual bladder expression was not available, a urethral catheter was used. Thick, soft pads and cotton bandages were applied to prevent pressure sores. Spinal cord–injured dogs were managed until 78 days after the injury procedure. After the final MRI acquisition, all dogs were sacrificed for histopathological examination.
Magnetic resonance imaging acquisition protocols
All 6 dogs underwent MRI 1 week pre-injury and were confirmed to have no specific spinal cord abnormalities. Five of these animals were subjected to SCI and underwent MRI for the evaluation of the prevalence of AxD 78 days after the injury. MRI and DTI data acquisition were performed as previously described. 15 An MRI scanner (MAGNETOM Skyra 3T; Siemens Medical Solutions, Erlangen, Germany) equipped with a knee coil with 15 channels was used. The dogs were laid in dorsal recumbency to reduce motion artifacts by respiration. 16 A restraining sponge and thick pad were used to keep the spinal cord straight. DTI data sets were obtained from the lumbar region (from L1 to L3) in all dogs.
Sagittal T2-weighted, axial T2-weighted, and axial T2*-weighted sequences were performed for anatomical scanning. The sagittal T2-weighted scans were acquired using the following parameters: turbo spin-echo (TSE) sequence with turbo factor 22; field of view (FOV) = 150 mm; slice thickness = 2 mm (no gap); repetition time (TR) = 3220 ms; echo time (TE) = 81 ms; flip angle = 160 degrees; matrix = 320 × 224; voxel size = 0.4 × 0.4 × 2 mm3; slices = 15; Nex/average = 2; phase-encoding direction = cranial-caudal direction (S-I in human); and acquisition time = 3 min 59 sec. The axial T2 scans were acquired using the following parameters: three-dimensional T2-weighted TSE referred to sampling perfection with application optimized contrasts using different flip-angle evolutions with acceleration factor 2; FOV = 150 mm; slice thickness = 2 mm (no gap); TR = 1500 ms; TE = 104 ms; flip angle = 150 degrees; matrix = 320 × 256; voxel size = 0.4 × 0.4 × 2 mm3; slices = 32; average number = 2; phase-encoding direction = right-left (R-L) direction; and acquisition time = 2 min 47 sec. Axial T2* scans were acquired using the following parameters: gradient recalled echo referred to multi-echo data image combination (MEDIC) with acceleration factor 2; FOV = 150 mm; slice thickness = 4 mm (no gap); TR = 612 ms; TE = 18 ms; flip angle = 30 degrees; matrix = 320 × 224; voxel size = 0.4 × 0.4 × 4 mm3; slices = 15; average number = 2; phase-encoding direction = R-L direction; and acquisition time 5 min 6 sec.
Multi-shot echo planar imaging (MSEPI) sequences (readout segmentation of long variable echo-trains) were used to obtain DTI data. To reduce susceptibility artifacts, parallel acquisition (generalized autocalibrating partially parallel acquisition) with an acceleration factor of 2 was used. The DTI data were acquired using the following parameters: axial orientation; FOV = 150 mm; slice thickness = 4 mm (no gap); TR = 3300 ms; TE = 96 ms; flip angle = 180 degrees; readout bandwidth (Hz/pixel) = 602; b-value = 0 and 800 s/mm2; matrix = 166 × 166; voxel size = 0.9 × 0.9 × 4 mm3; slices = 15; direction = 12; Nex/average of b-value 0 s/mm2 = 1; Nex/average of b-value 800 s/mm2 = 3; number of shots = 7; phase-encoding direction = ventro-dorsal (V-D) on the dorsal recumbency (anterior-posterior in humans); and acquisition time 17 min 18 sec. Respiration rate was continuously checked by a monitoring camera in the MRI room. Rectal temperatures and dogs' pulse rates were monitored between MRI sequences.
Tissue preparation and histopathological examination
For histopathological examination, 1 normal dog after initial scanning and 5 dogs with spinal cord compression injury after terminal scanning were anesthetized with propofol (6 mg/kg) and inhaled 2% isoflurane and then undergone dorsal laminectomy from T12 to L5. Dogs were sacrificed by pentobarbital sodium overdose. Spinal cords were harvested and fixed in 4% paraformaldehyde for 4 days and subsequently in 10% neutral-buffered formalin overnight. Spinal cord lengths from L1 to L3 (approximately 6 cm) were then transected into 15 segments of 4 mm and subjected to paraffin-embedding protocol. Embedded cord segments were sectioned (6 μm) using a microtome (Leica Biosystems, Wetzlar, Germany).
Sections were subjected to routine hematoxylin and eosin (H&E) and Luxol Fast Blue (LFB) staining. To identify normal spinal cord and lesion types, above all histological examination of normal spinal cord was performed for 15 spinal cord sections of L1–L3 from a dog. Histopathological status of lesions was evaluated for 15 sections per dog, and a total 75 sections of spinal cord from 5 SCI dogs. Histopathological characteristics were evaluated in each section using a microscope (Olympus, Tokyo, Japan) and then were categorized based on the severity of vacuolation and demyelination as follows (Figs. 2 and 3): normal white matter (NWM); mild axonal degeneration (MiAxD); moderate axonal degeneration (MoAxD); or severe axonal degeneration (SeAxD). Directly injured spinal cord segments were excluded from AxD grade evaluation, because the cavitary and scar lesions were more common than AxD on histopathological examination. Therefore, regions cranial and caudal to the injured area were used for evaluating AxD. Locations of MiAxD, MoAxD, and SeAxD identified by high-power magnification (200 × ) of a microscope on histopathological images were then marked in low-power magnification (12.5 × ). They were recorded for following DTI analysis as regions of interest (ROIs).
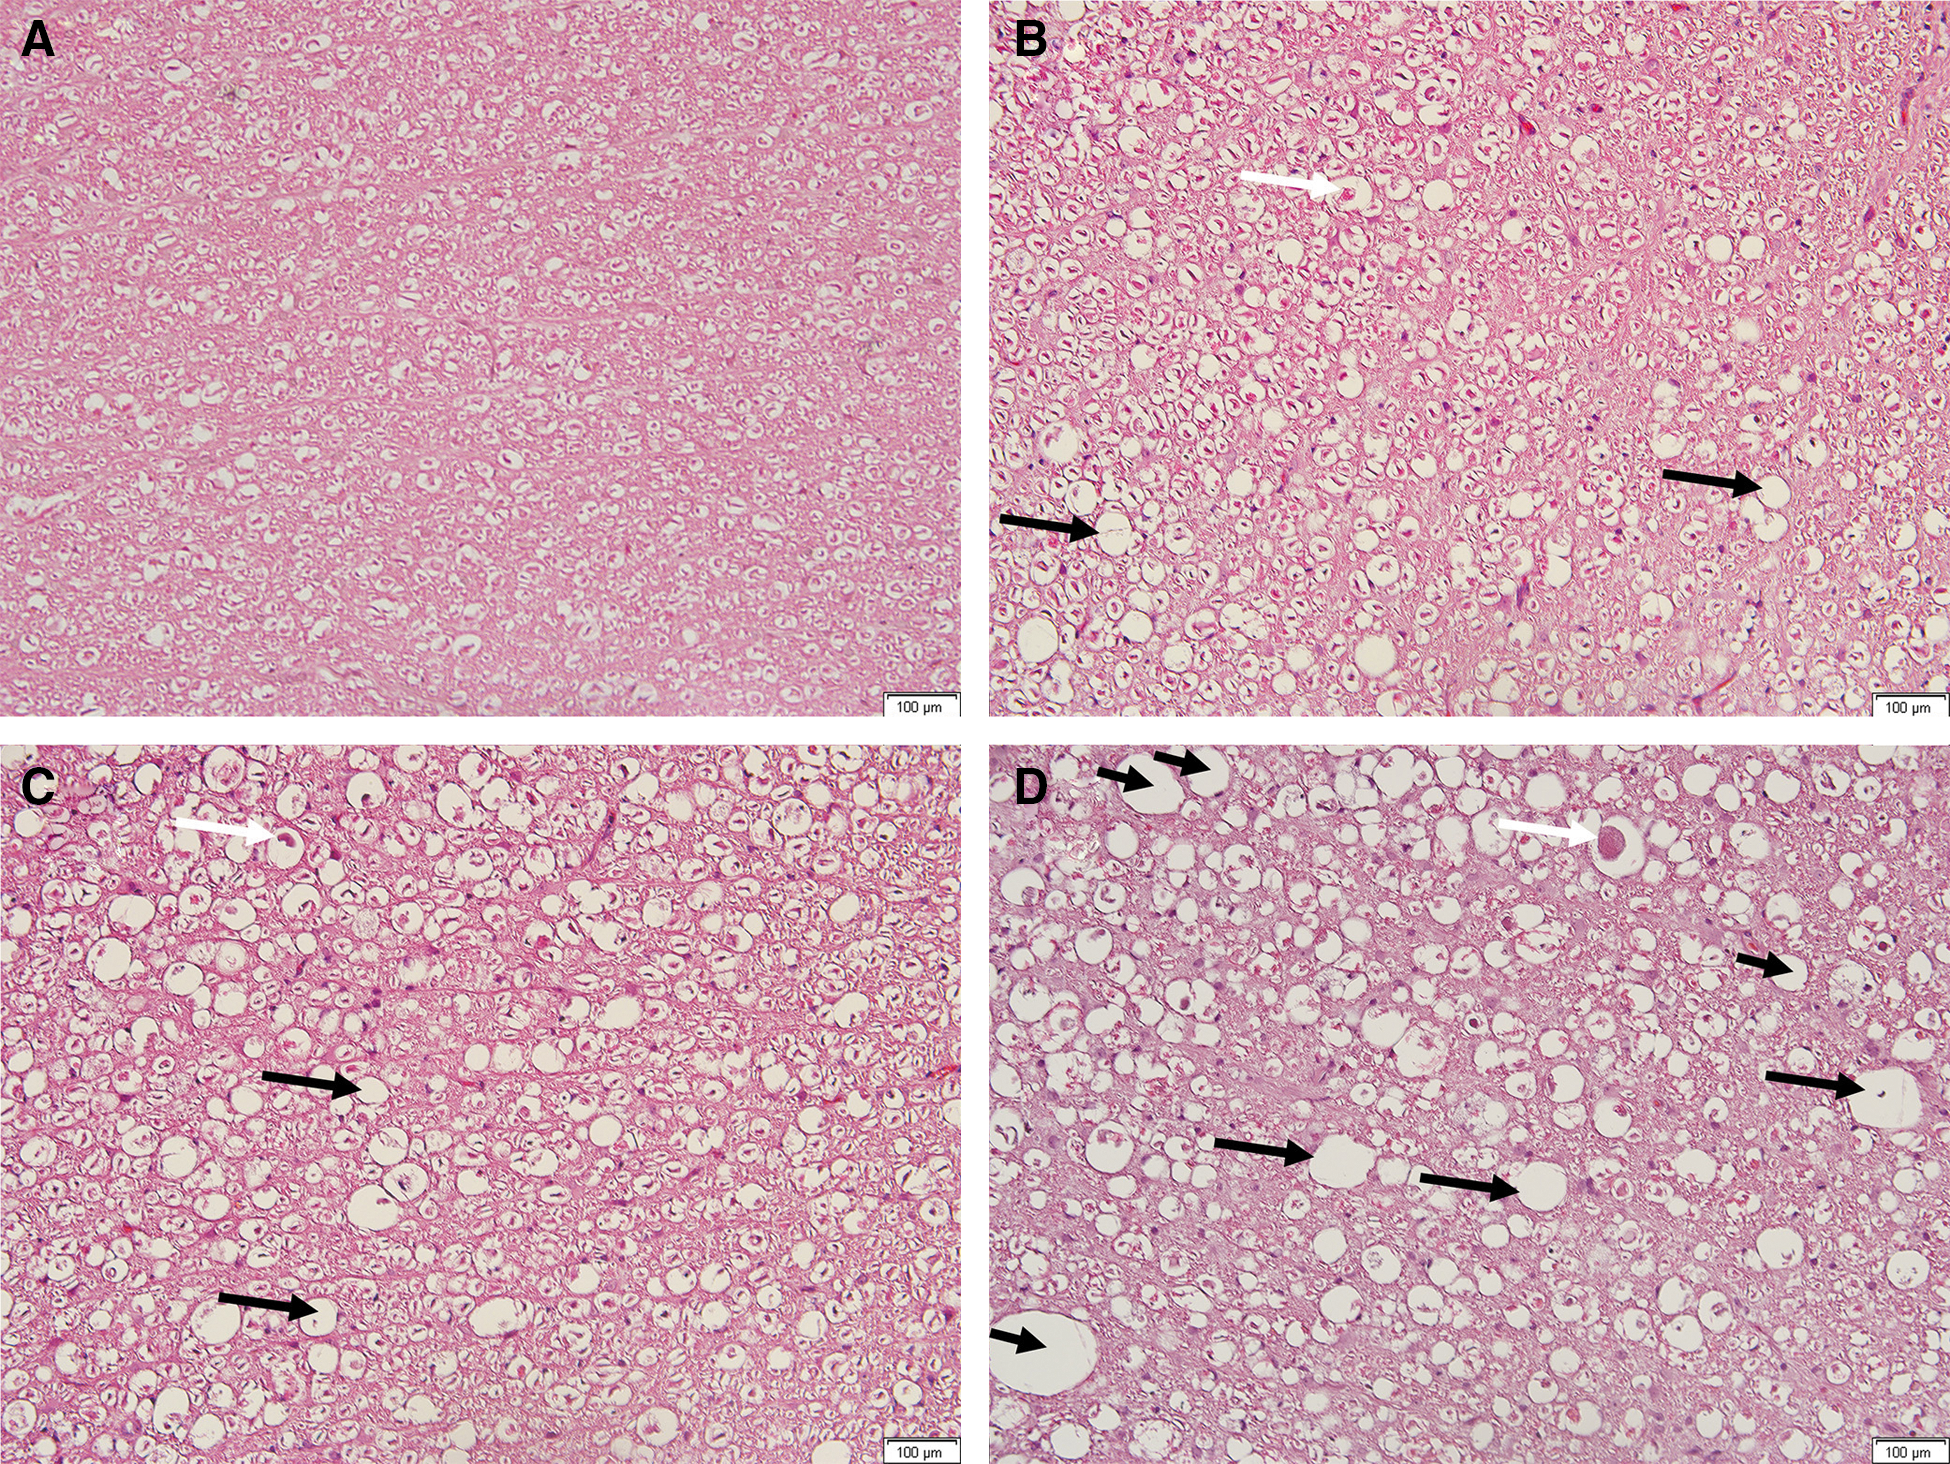
Hematoxylin and eosin–stained histopathological images. Microscopic views under 200 × magnification show normal white matter (

Luxol Fast Blue–stained images. Microscopic views under 200 × magnification show normal white matter (
To perform a quantitative analysis of AxD, a blue signal was used as a surrogate for myelination in LFB-stained slide images of the three AxD grades (Fig. 3). Areas without the blue signal were used as a scale of relatively demyelinated and vacuolated tissue. The color threshold function of ImageJ software (version 1.48; National Institutes of Health, Bethesda, MD) * was used to estimate the percent area of optical density (OD) for each analysis. The percent area of OD was defined as OD area of the target signal/total image area × 100. One hundred percent minus the percent area of OD was used as a quantitative value of the relative demyelination and vacuolation.
Magnetic resonance imaging and histopathology data processing
All raw data were acquired from the Siemens Work Station and converted to 4D NIfTI files using the DCM2NII program. † An eddy current distortion correction was applied to diffusion data using the FMRIB Diffusion Toolbox. ‡ FA, eigenvalue, and eigenvector maps were produced using DTIstudio software (version 3.0.3; Johns Hopkins University, Baltimore, MD). § Maps were interpolated to the same resolution as T2*-weighted images using Diffeomap software (version 1.9; Johns Hopkins University). ¶ DTI maps, T2*-weighted images, and histopathology images were then imported into Matlab (R2010a; The MathWorks, Inc., Natick, MA). Histopathology images were also interpolated to the same resolution as T2*-weighted images in Matlab. Finally, the DTI maps and histopathology images were rigidly aligned to T2*-weighted images, owing to spinal cord sample shrinkage in paraffin section and differences of size, orientation, and tilting degree between the histopathology and MRI images.
Magnetic resonance imaging and histopathology data analyses
The largest, intermediate, and smallest eigenvalues were identified in Matlab as lambda 1, lambda 2, and lambda 3, respectively. 17 Cp, Cs, RD, MD, and AD maps were produced in Matlab using previously described formulae. 14,18
For NWM, 440 ROIs were selected in regions of the dorsal, ventral, and bilateral funiculi of the spinal cord on T2*-weighted images from all 6 dogs before spinal cord compression injury (Fig. 4A). These ROIs were copied to DTI images.
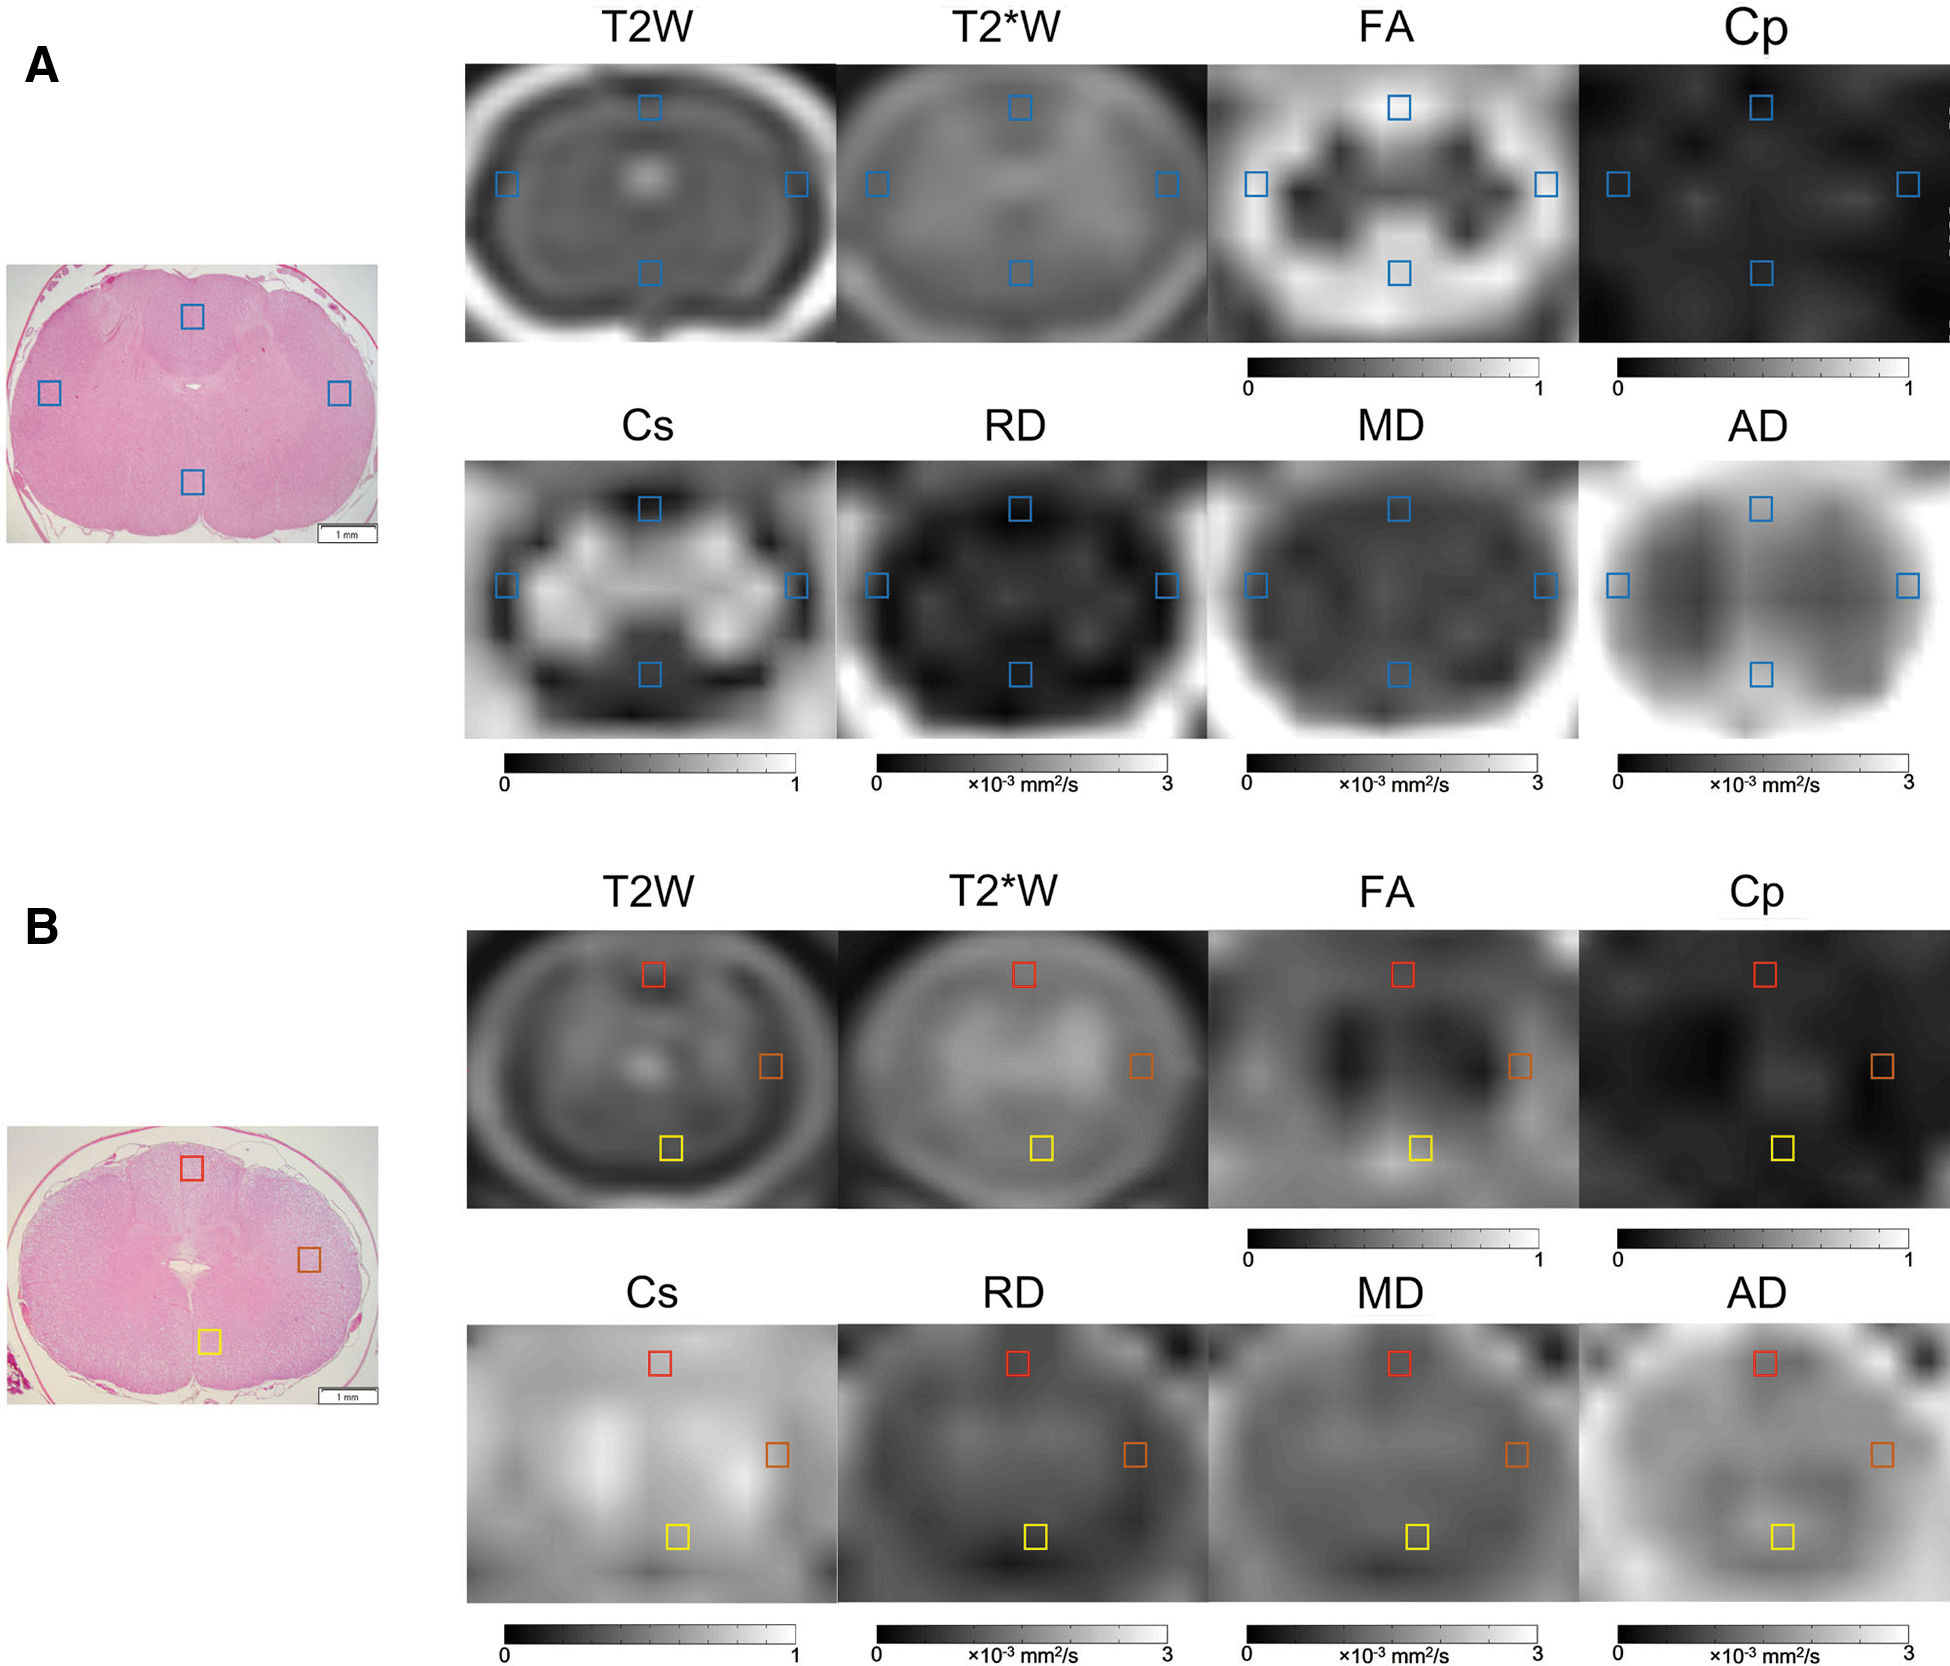
Regions of interest (ROIs) for quantitative diffusion tensor imaging analyses of normal white matter and axonal degeneration. ROI boxes indicate (
MRI images were selected that reflected the spinal cord level of the slide showing axonal degeneration on histopathological examination. ROIs were then selected at the locations of AxD in histopathological images. The size of the ROIs was 0.8 × 0.8 mm. Ten ROIs of MiAxD from 10 histopathological section images, 17 ROIs of MoAxD from 17 section images, and 22 ROIs of SeAxD from 22 section images (Fig. 4B) were included in the analysis. Certain section images included multiple types of lesions and were used repeatedly for ROI selection. ROIs were copied to T2*-weighted and DTI images, and DTI parameter values were produced for each ROI.
Statistical analysis
Descriptive statistics of DTI parameters for each ROI were produced by SPSS 22.0 statistical software (SPSS 22.0 for Windows; IBM Corporation; Armonk, NY). The distributions of DTI parameters were evaluated using boxplots. Nonparametric one-way analyses of variance (Kruskal-Wallis) and Mann-Whitney U tests were performed to identify significant differences in DTI parameters and [100% – (the OD percent area of blue signal on LFB stain)] among NWM, MiAxD, MoAxD, and SeAxD areas of the spinal cord. Simple and polynomial regression models were used to identify linear and U-shaped correlations between DTI parameters and histopathological severity. Beta estimates were calculated from the regression models to represent both the size and direction of correlations. Significance level was set p < 0.05 or 0.001 depending on the analysis.
Results
Histopathological examination of lesion types after spinal cord compression injury
Regions that had undergone spinal cord compression injury were identified as epicenters on MRI. All dogs showed severe damage to all neuronal tracts at injury epicenters on histopathological examination 78 days post-SCI. All 5 animals had hindlimb paralysis and upper motor neuron (UMN) lesions of the urinary bladder immediately after the injury procedure and did not improve in the 78 days after compression injury. Spinal cord degeneration was identified more definitively in regions of the dorsal funiculus cranial to the epicenter and in regions of the ventral funiculus caudal to the epicenter. The bilateral funiculi displayed intermediate degeneration. AxD was evidenced by vacuolation, axonal swelling, and demyelination (Fig. 2B–D).
Diffusion tensor imaging profiles of axonal degeneration after spinal cord compression injury
Box plots of these data display the distributions of DTI parameters for AxD (Fig. 5). FA demonstrated a declining trend with the progression of AxD, whereas Cs and RD displayed rising trends. AD tended to decrease from NWM to MiAxD and increase from MiAxD to SeAxD. MD only appeared to increase from MiAxD to SeAxD. Cp did not appear to vary according to histopathological severity.
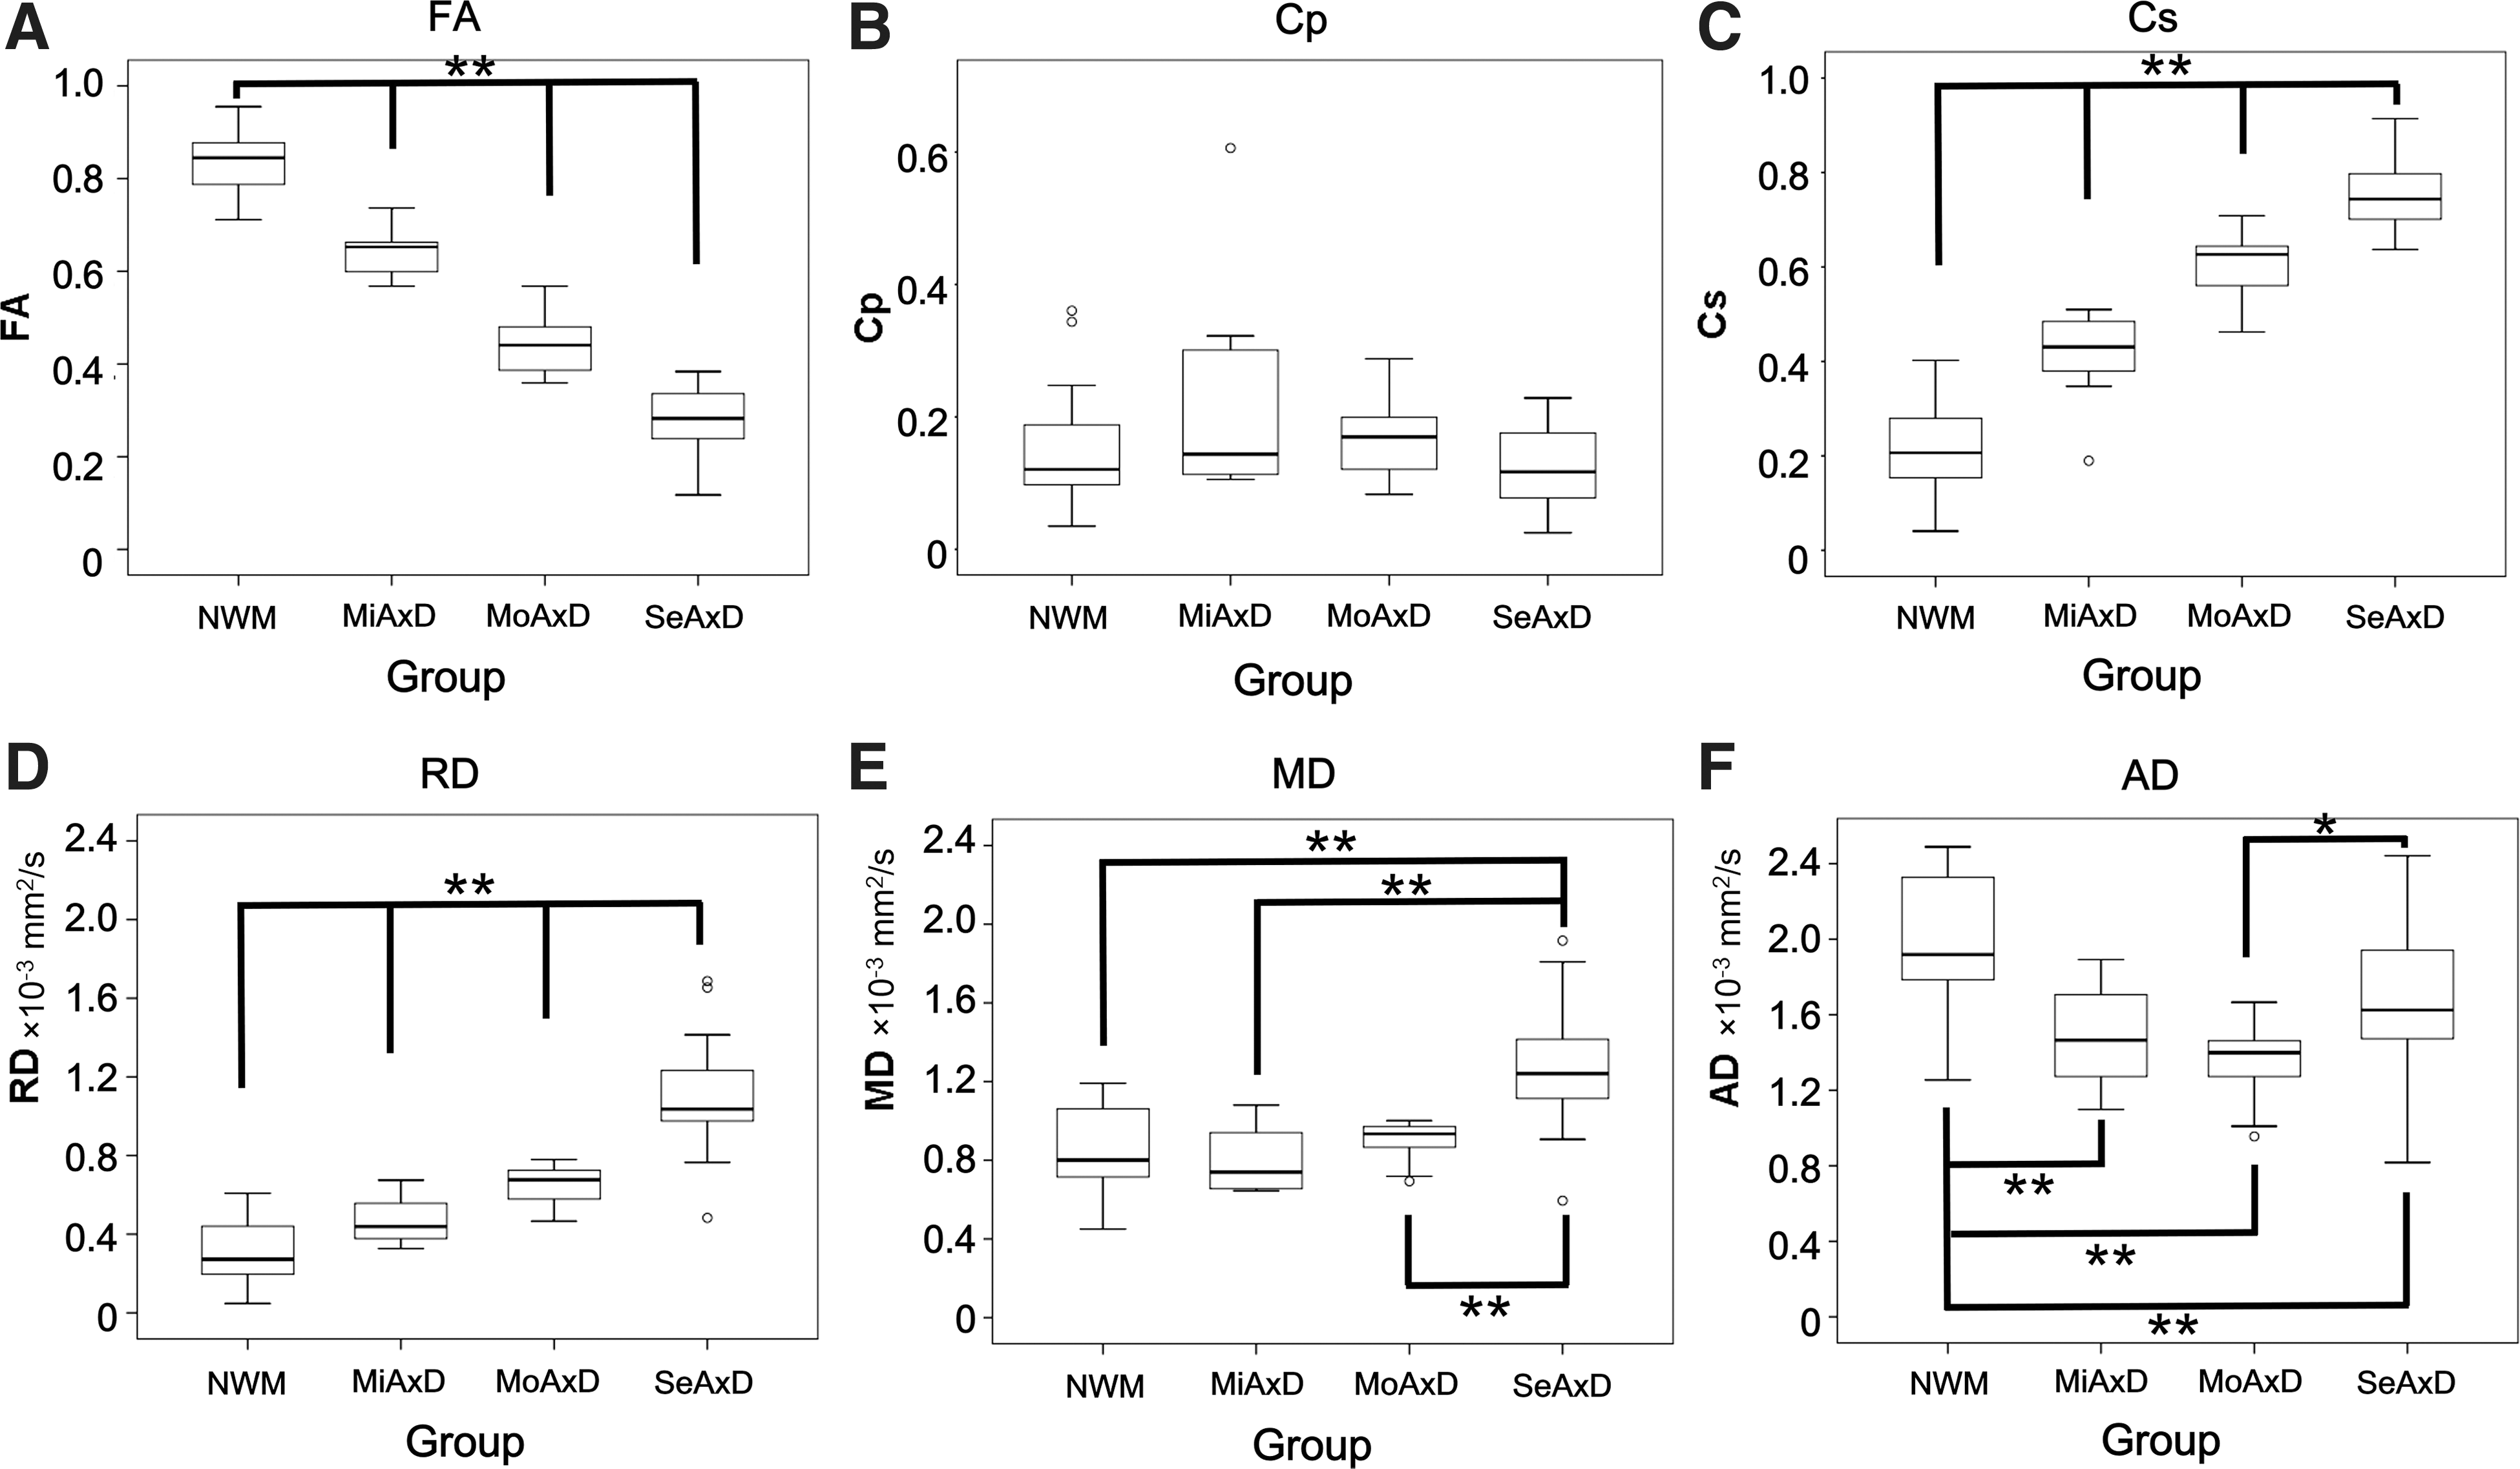
Box and whisker plots of DTI parameters for normal white matter and axonal degeneration. Each panel shows the median, interquartile range (IQR), minimum, maximum, and outliers for normal white matter (NWM), mild axonal degeneration (MiAxD), moderate axonal degeneration (MoAxD), and severe axonal degeneration (SeAxD). Double and single asterisks indicate statistically significant differences of p < 0.001 and p < 0.05 among normal white matter and mild, moderate, and severe axonal degeneration. AD, axial diffusivity; Cp, planar index; Cs, spherical index; FA, fractional anisotropy; MD, mean diffusivity; RD, radial diffusivity.
Profiles and significant differences in quantitative histopathological examination of axonal degeneration after spinal cord compression injury
The box plot displays the distributions of quantitative AxD (Fig. 6A).
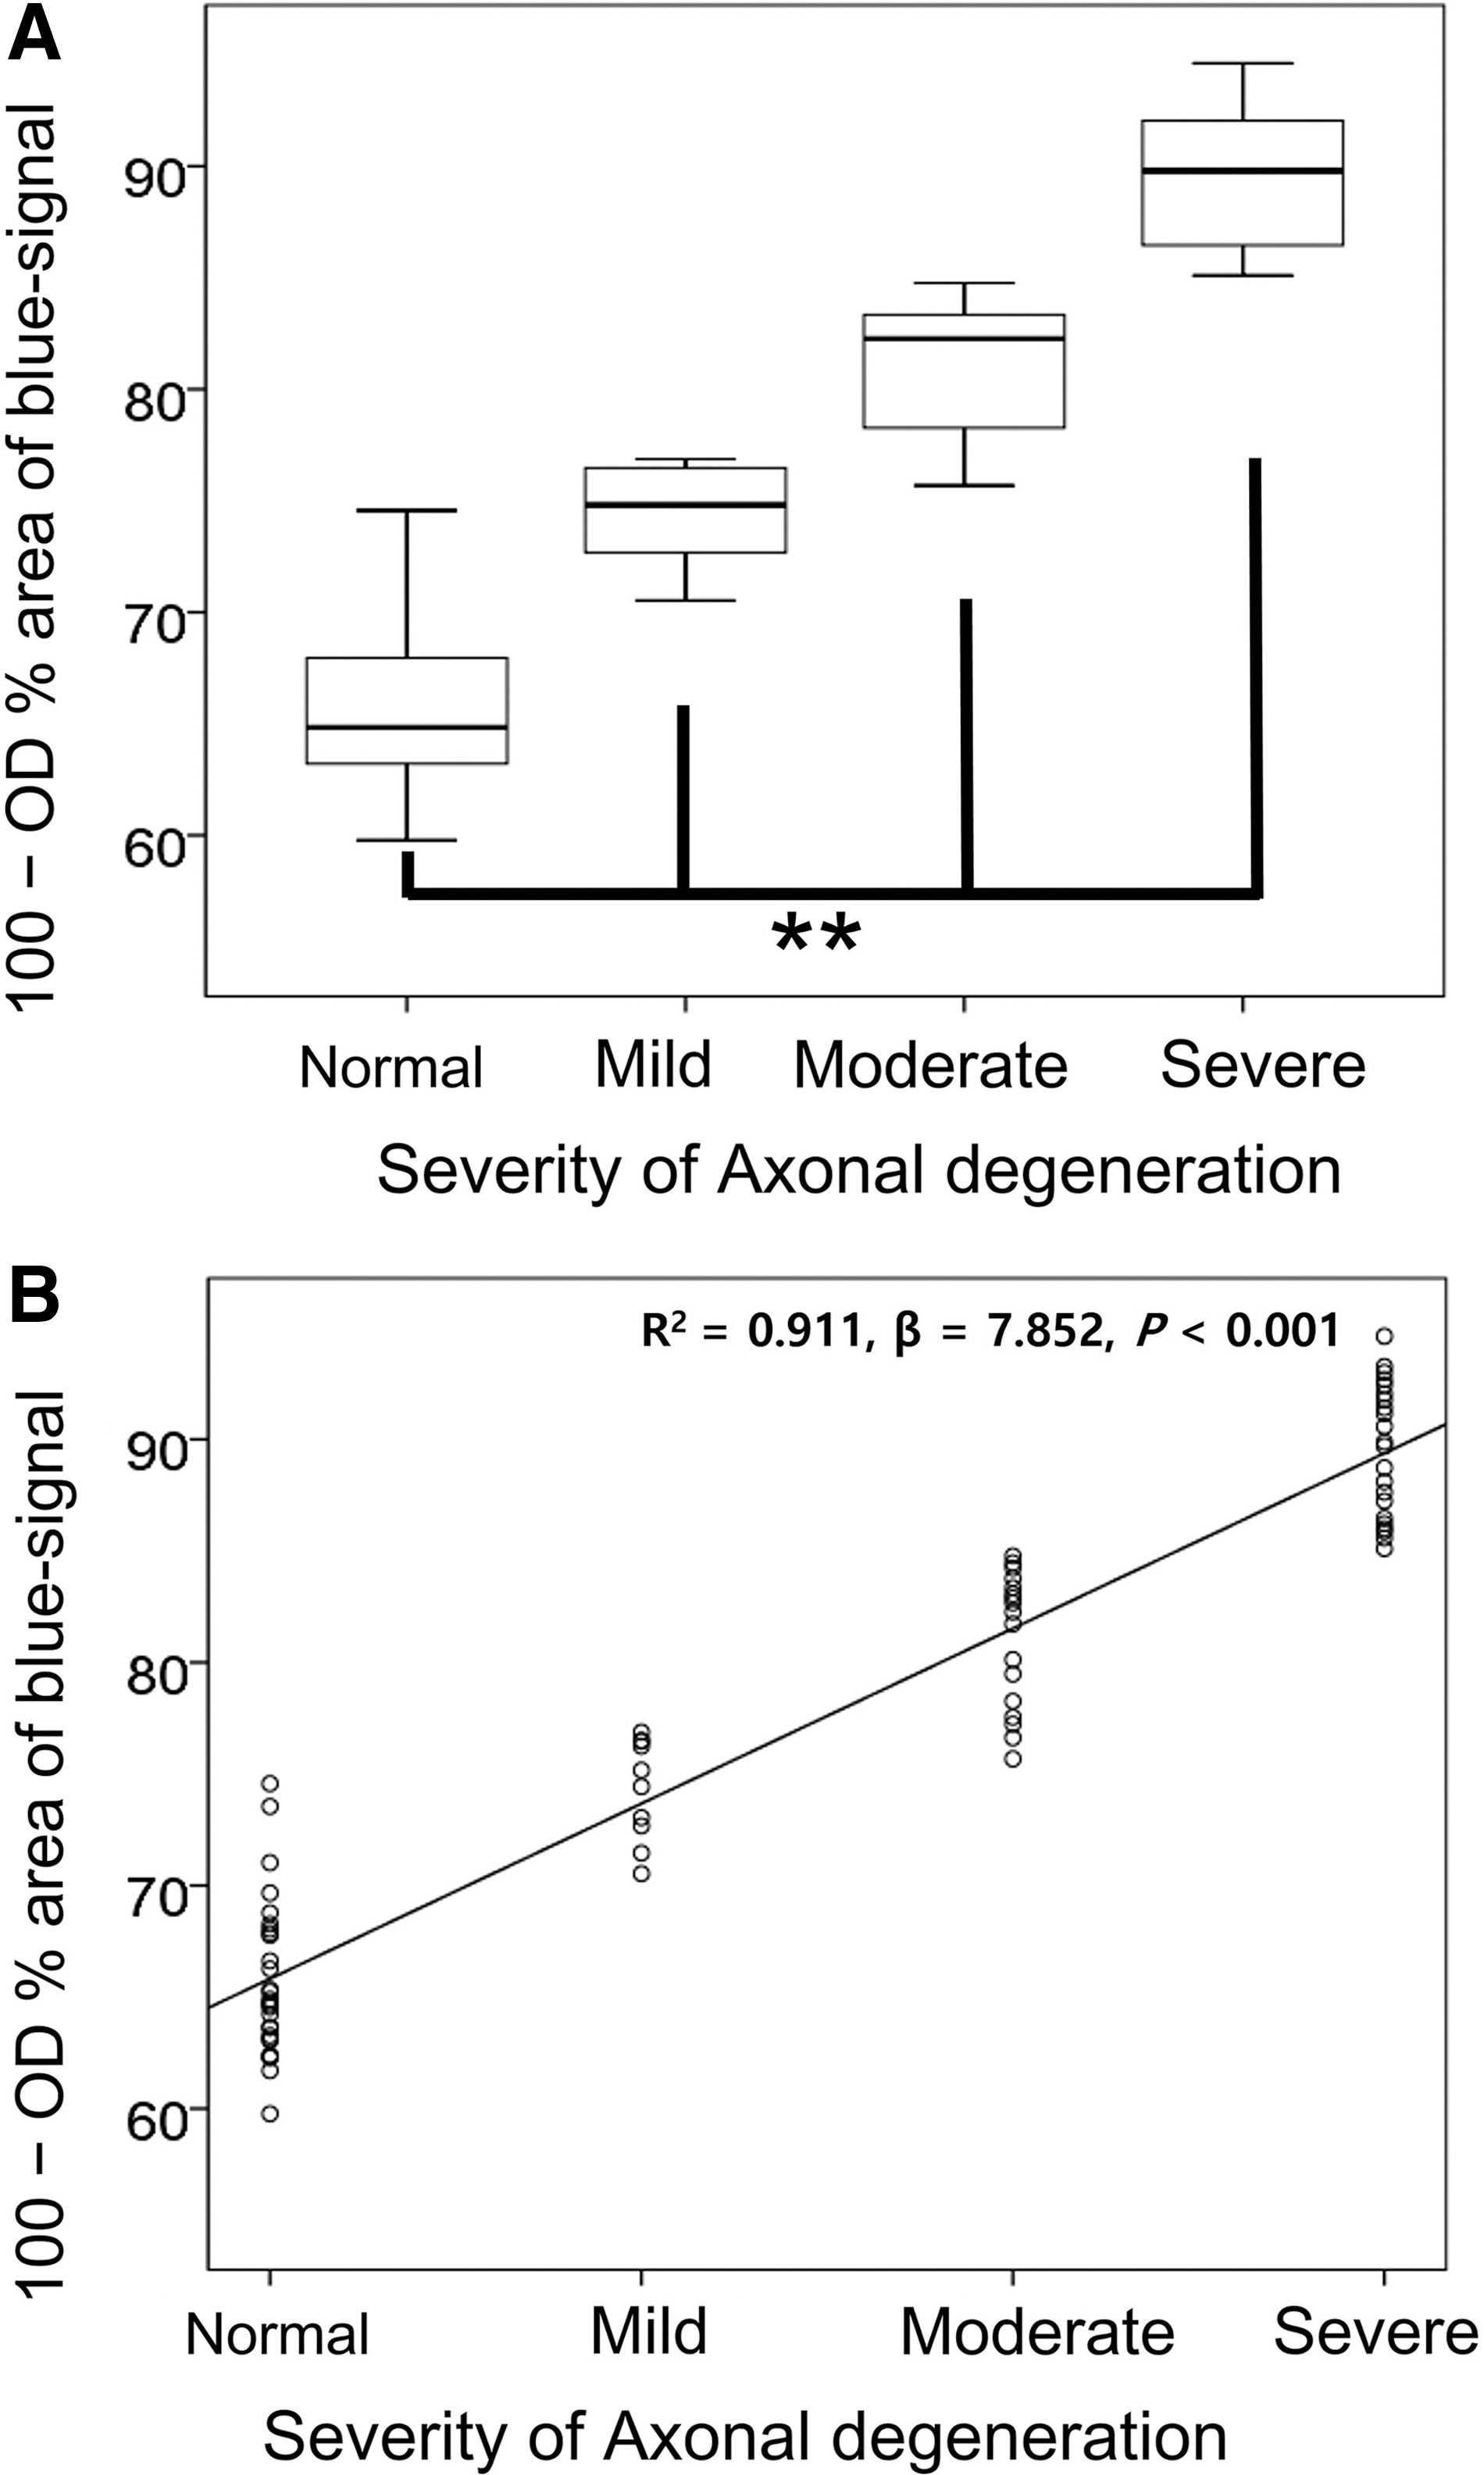
Box and whisker plot of quantitative histopathology for axonal degeneration and simple regression analysis the quantitative histopathology and the lesion characteristics. (
[100% – (the OD percent area of blue signal on LFB stain)] tended to increase from NWM to SeAxD. There were significant differences between NWM and all AxD groups for [100% – (the OD percent area of blue signal on LFB stain)] (p < 0.001).
Significant differences in diffusion tensor imaging parameters between normal white matter and axonal degeneration
There were significant differences between NWM and all AxD groups for FA, Cs, RD, and AD (p < 0.001), as well as between NWM and SeAxD for MD (p < 0.001; Table 1).
× 10–3 mm2/s.
Significant intergroup differences on Kruskal-Wallis' analysis (p < 0.001).
Significant differences between groups on post-hoc Mann-Whitney U test (p < 0.001).
Significant differences between groups on post-hoc Mann-Whitney U test (p < 0.05).
SE, standard error; DTI, diffusion tensor imaging; FA, fractional anisotropy; Cp, planar index; Cs, spherical index; RD, radial diffusivity; MD, mean diffusivity; AD, axial diffusivity; NWM, normal white matter; MiAxD, mild axonal degeneration; MoAxD, moderate axonal degeneration; SeAxD, severe axonal degeneration; NS, not significant.
Significant differences among MiAxD, MoAxD, and SeAxD were identified for FA, Cs, and RD (p < 0.001). MD could distinguish between MiAxD and SeAxD and between MoAxD and SeAxD (p < 0.001). AD could differentiate between MoAxD and SeAxD (p < 0.05; Table 1).
Correlations between the severity of axonal degeneration and diffusion tensor imaging parameters
A simple regression analysis uncovered a strong positive linear correlation between the severity of AxD and [100 – (the OD percent area of the blue signal)] (R 2 = 0.911; β = 7.852; p < 0.001; Fig. 6B). Positive or negative linear and U-shaped correlations between the OD percent area of blue signal on LFB-stained images (the quantitative severity of AxD) and DTI parameters were assessed. Both linear and quadratic (polynomial) regression models demonstrated good fit for FA (linear model, R 2 = 0.837; β = −0.022; p < 0.001; quadratic model, R 2 = 0.839; β = −0.017 [χ] and −0.00004 [χ2]; p = 0.799), Cs (linear model, R 2 = 0.797; β = 0.021; p < 0.001; quadratic model, R 2 = 0.797; β = 0.017 [χ] and 0.00003 [χ2]; p = 0.856), RD (linear model, R 2 = 0.646; β = 0.029; p < 0.001; quadratic model, R 2 = 0.666; β = −0.063 [χ] and 0.0006 [χ2]; p = 0.041), MD (linear model, R 2 = 0.268; β = 0.014; p < 0.001; quadratic model, R 2 = 0.340; β = −0.122 [χ] and 0.0009 [χ2]; p = 0.006), and AD (linear model, R 2 = 0.152; β = −0.015; p < 0.001; quadratic model, R 2 = 0.257; β = −0.240 [χ] and 0.001 [χ2]; p = 0.002), but did not demonstrate good fit for Cp (linear model, R 2 = 0.012; β = −0.001; p = 0.335; quadratic model, R 2 = 0.097; β = 0.044 [χ] and −0.0003 [χ2]; p = 0.01; Fig. 7).
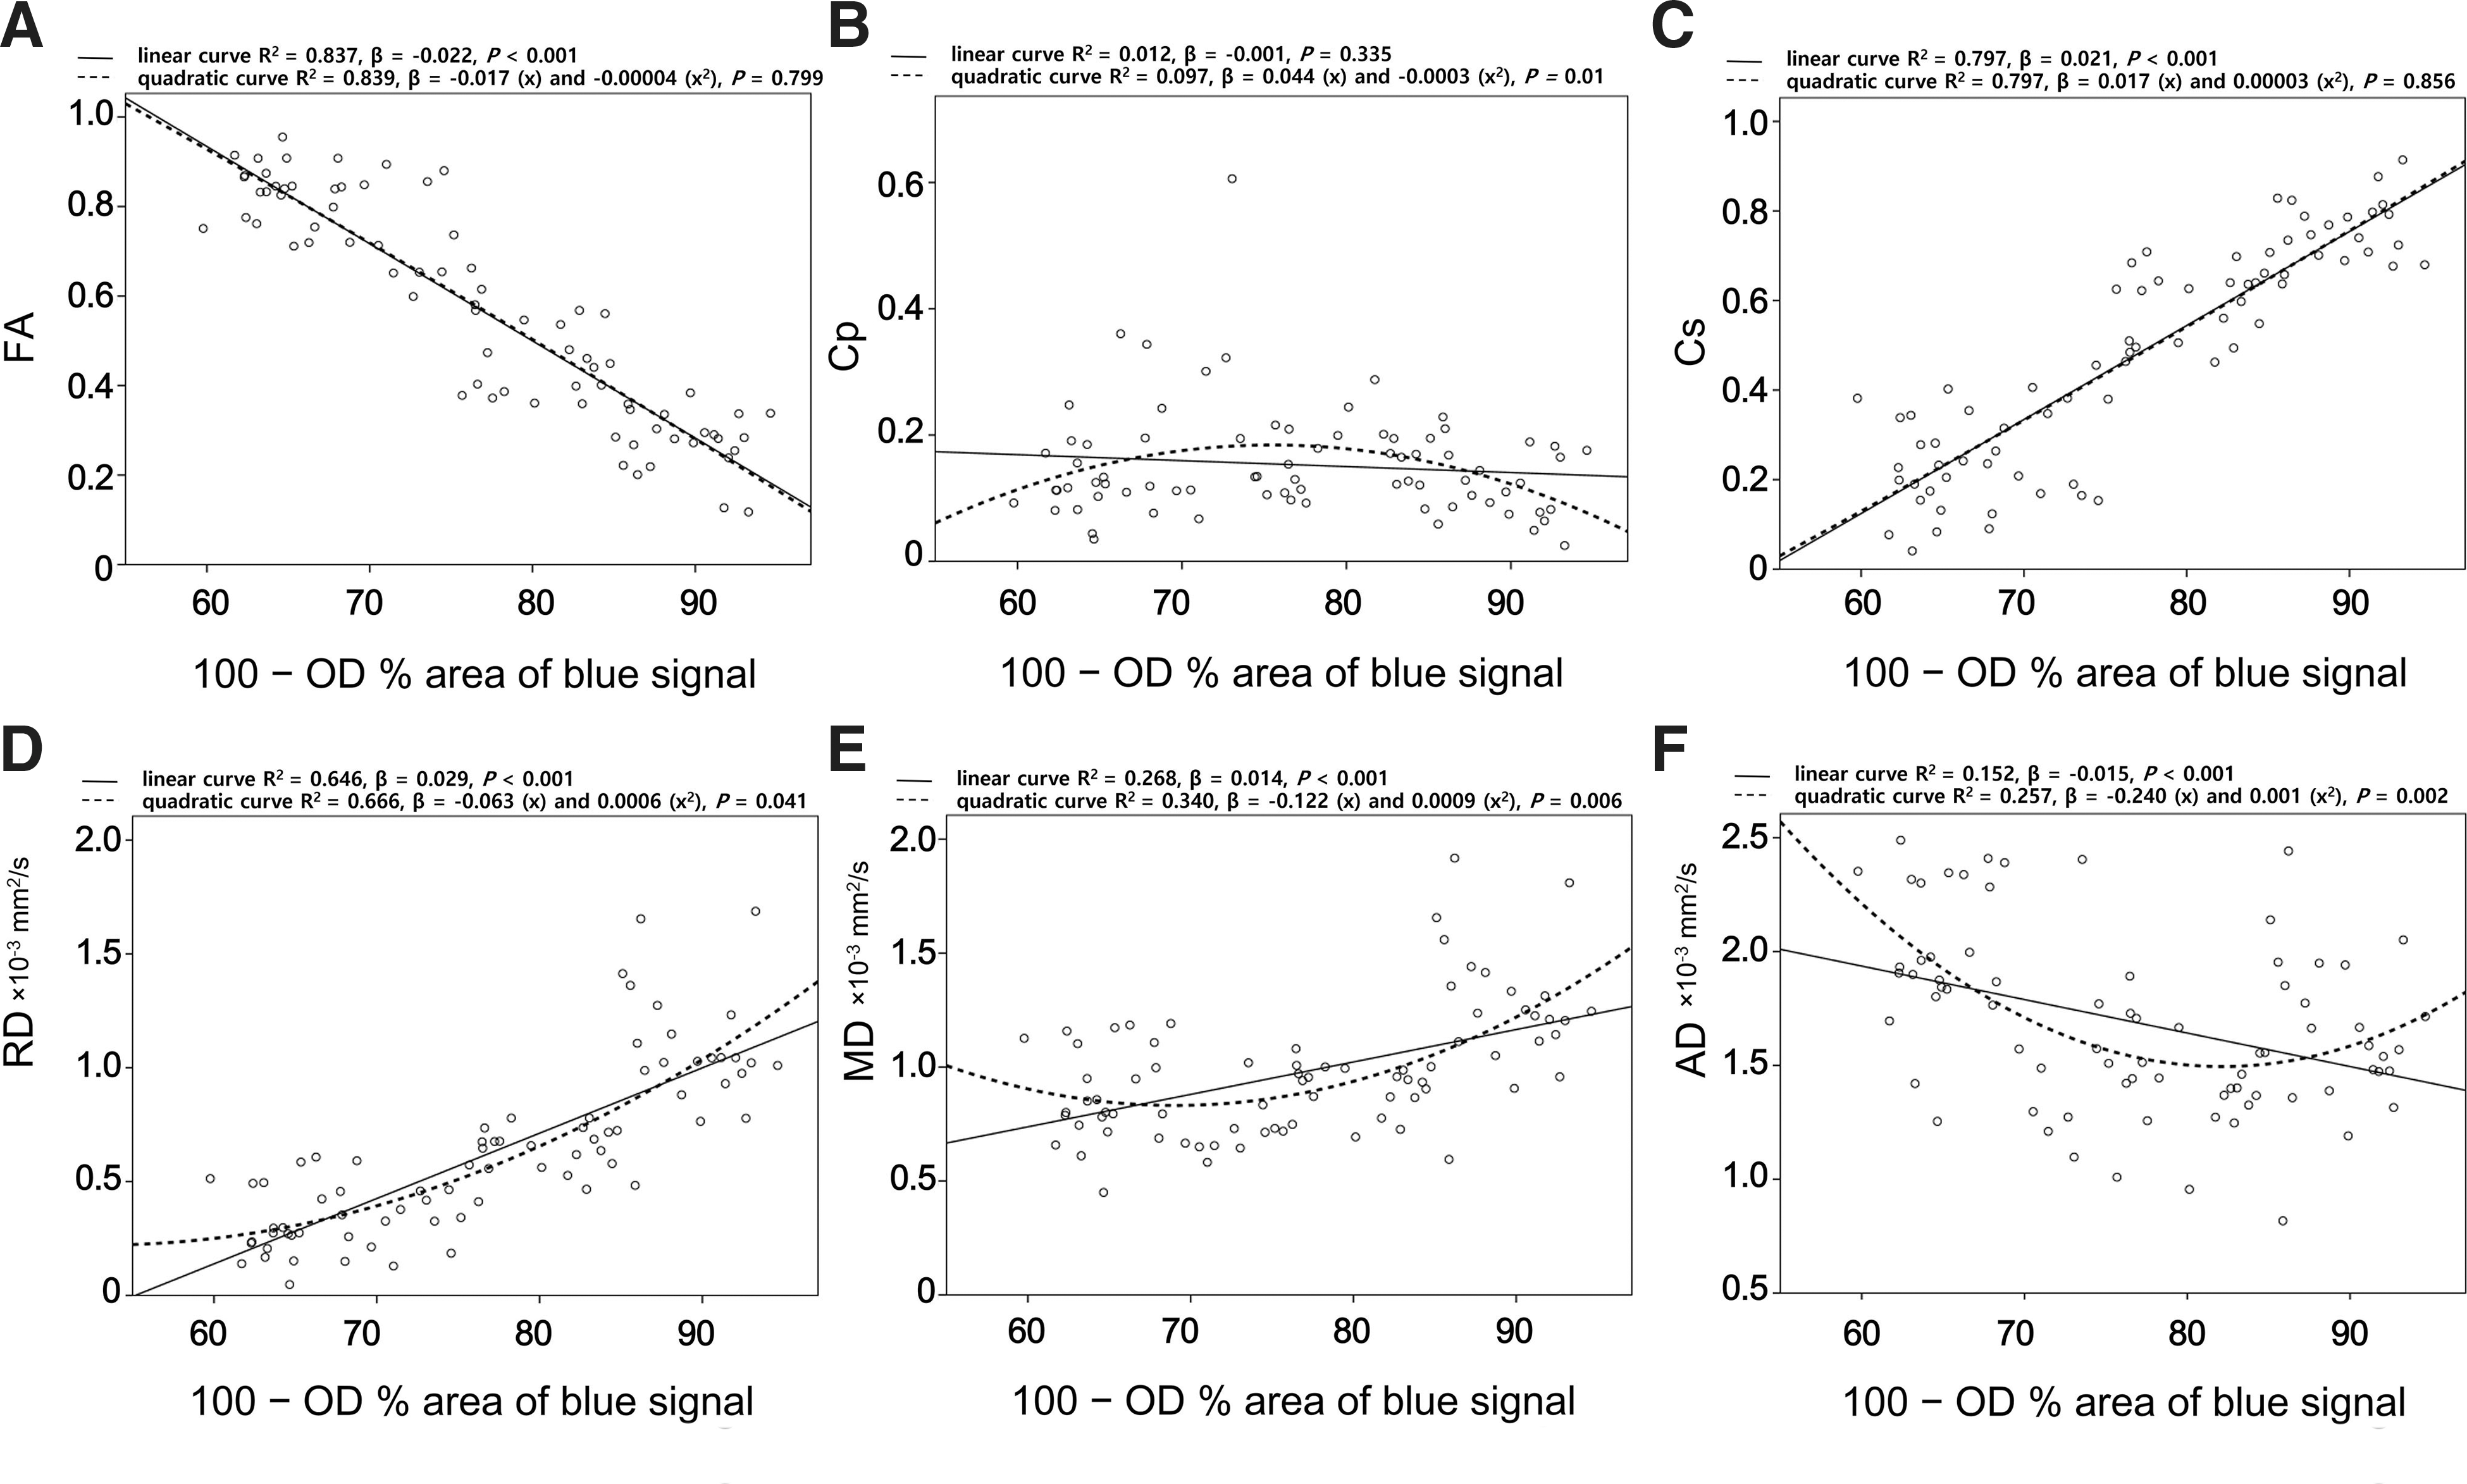
Correlations between DTI parameters and [100% – (the OD percent area of blue signal on Luxol Fast Blue [LFB] stain)]. Linear or U-shaped correlations between [100% – (the OD percent area of blue signal on LFB stain)] and DTI parameters as follows: FA (
Discussion
The present study focused on the use of DTI parameters to determine AxD severity differences in canines with controlled SCI. To date, a majority of DTI studies have focused on the characterization of specific spinal cord lesion types rather than the comparison of different lesion characteristics. Further, previous studies have utilized a variety of different experimental conditions (e.g., type of MRI equipment, protocols, species, and ROIs) that prohibit between-study comparisons. 5,19 –24 The translational nature of many previous studies is limited by the use of small animals (e.g., rats and mice), high-Tesla equipment, and complex technical analyses of high-quality DTI scans that are irrelevant to clinical DTI. 19,21,24,25 Therefore, the present study sought to evaluate the DTI characteristics of various spinal cord lesions in a more clinically translatable context.
After the induction of spinal cord compression injury, histopathological examination demonstrated the presence of multiple-grade AxD in all experimental subjects. These lesions are typical of Wallerian degeneration secondary to pre-SCI. 5,26 The distribution of lesions according to distance from the epicenter resembled the progression of a single lesion over time, wherein lesion severity was inversely related to distance from the epicenter.
AxD was identified most definitively in regions of the dorsal funiculus cranial to the epicenter and regions of the ventral funiculus caudal to the epicenter. Intermediate degeneration was observed in regions of the bilateral funiculi both cranial and caudal to the epicenter. These features may have resulted from Wallerian degeneration of the dominant ascending tract of the dorsal funiculus, the dominant descending tract of the ventral funiculus, and the mixed nervous tracts of the lateral funiculi, respectively. 5
Lesion groups were designated according to histopathological characteristics such as axon loss, demyelination, and vacuolation. 27 Significant differences were identified for DTI parameters among all histopathological groups. In agreement with these findings, previous studies have reported reduced FA in spinal cord lesions. 21 Further, reduced AD has been observed in lesions of axonal edema, 19 whereas increased AD has been observed in axonal loss. 22 Increased RD has been reported in demyelinating lesions, 20 and sequential rising trends of AD and RD were evident in severe lesions featuring hallmarks such as severe AxD.
Positive and negative correlations were identified between DTI parameters and quantified AxD (vacuolation and demyelination). The negative correlation observed for FA and positive correlation for Cs may have been related to increased λ2 and λ3 attributed to decreased structural integrity. 22 AD demonstrated a U-shaped correlation with AxD. Unlike AD, RD demonstrated a positive linear correlation with the severity of AxD. Similar to AD, MD (the average of three eigenvalues) demonstrated a U-shaped correlation with AxD; however, the beta estimate was smaller than that of AD in a quadratic model and that of RD in a linear model.
Mild AxD in the chronic axonal injury could be caused by Wallerian degeneration 5 and/or secondary injury attributed to inflammatory cytokines 24 ; therefore, the mild degeneration might be identified mostly in the region more distal from the epicenter of axons than for moderate-to-severe AxD. 5 In this study, λ1 of mild AxD might be lower than that of NWM, a result of restricted diffusion attributed to granular disintegration of the cytoskeleton, rather than severe demyelination and vacuolation. 24 The λ2 and λ3 might be increased by the fragmentation of axons. 24 Therefore, they might have led to an increase in RD and decrease in MD and AD. However, severe AxD in chronic axonal injury is likely to occur in the region adjacent to the epicenter. The λ1, as well as λ2 and λ3, might be higher as a result of increasing the clearance of cellular debris, demyelination, and vacuolation according to progression of the lesion. 24 Therefore, AD and MD would decrease in the mild AxD and gradually increase again in moderate-to-severe AxD, and a similar value point would have occurred between the mild and the moderate-to-severe AxD, respectively.
The U-shaped correlation of AD and MD, which is not a linear relationship, can be one cause of reduced sensitivity in grading of AxD. The lower sensitivity for MD and AD might also be caused by the low b-value (800 s/mm2) used in this study. High b-values increase the signal contrast between lesions and normal condition in DTI diffusivity, and therefore a higher b-value could increase the sensitivity of MD and AD. 28 However, this experiment had to overcome the low signal-to-noise ratio (SNR) attributed to the small spinal cord size, the inhomogeneous magnetic field caused by vertebrae, and breathing-related motion artifacts. 21 In addition, a high b-value can yield low SNR data. 28 Thus, the opportunity cost should be considered.
Taken together, our results indicate that FA, Cs, and RD are the most useful DTI parameters for differentiating between NWM and different severities of AxD in SCI. However, different correlation patterns of RD, MD, and AD can be helpful for understanding AxD changes in detail. Thus, a combination of DTI parameters should be utilized for the differentiation and characterization of SCI lesions.
Our study had several limitations. First, we were unable to use cardiac and respiratory gating to reduce motion artifacts 29 attributed to equipment unavailability. Instead, a parallel imaging technique, 5 a dorsal recumbent imaging position, and a V-D phase-encoding direction 30 were used to reduce motion artifacts. In addition, several limitations of echo planar imaging were mitigated by the implementation of eddy current distortion correction and MSEPI sequences. 31,32 MSEPI in this study uses the diffusion principle as a single-shot echo planar imaging (EPI). However, the k-space trajectory is separated into several segments in the readout direction, resulting in improvement of image quality with a decrease in encoding time and TE. 33 MSEPI offers advantages including decreased voxel size, 31 reduced susceptibility to magnetic field and chemical shift artifacts, and an improved SNR compared to single-shot EPI. 31,32 However, MSEPI has a longer scanning time and is more sensitive to bulk motion artifacts than single-shot EPI. 32 The present study minimized bulk motion, as mentioned above, through the use of anesthesia, dorsal recumbency, and body fixation with a spacer. Last, this study featured a small sample size and could not correlate DTI parameters with sensory and motor functional evaluations because all spinal cord–injured dogs consistently exhibited bilateral hindlimb paralysis and UMN bladder signs in the post-injury period. Thus, larger future studies incorporating functional assessments and time-course analyses are required to validate and extend the present findings.
In conclusion, this study demonstrates that axonal lesions resultant from SCI can be identified and differentiated according to severity using DTI parameters. Specifically, the FA, Cs, and RD parameters showed significant differences for AxD severity. In addition, we definitively demonstrated that DTI parameters can be correlated with histopathological findings. These results highlight the potential clinical utility of DTI for classifying the grade and severity for AxD in patients with SCI.
Footnotes
Acknowledgments
This research was supported by the Basic Science Research Program through the National Research Foundation of Korea (NRF) funded by the Ministry of Education (NRF-2013R1A1A2065777).
Author Disclosure Statement
No competing financial interests exist.