
Abstract
While the duration and severity of post-traumatic confusional state (PTCS) after traumatic brain injury have well-established implications for long-term outcomes, little is known about the underlying pathophysiology and their role in functional outcomes. Here, we analyzed the delta-to-alpha frequency band power ratios (DAR) from localized scalp areas derived from standard resting electroencephalographic (EEG) data recorded during eyes closed state in 49 patients diagnosed with PTCS. Higher global, occipital, parietal, and temporal DARs were significantly associated with the severity of PTCS, as assessed by the Confusion Assessment Protocol (CAP) observed on the same day, after controlling for injury severity. Also, occipital DARs were positively associated with both the CAP disorientation score 2, and the CAP symptom fluctuation score 4, after controlling for injury severity (n = 35). Posterior DARs were significantly associated with Functional Independence Measure-cognitive subscale average score at 1 (n = 45), 2 (n = 42), and 5 (n = 34) year(s) post-injury. The associations at 1 (temporal left) and 2 (parietal left) years survive after controlling for an injury severity index. Our finding that posterior DAR is a marker of PTCS and functional recovery post-injury, likely reflects functional de-afferentation of the posterior medial complex (PMC) in PTCS. Altered function of the PMC is proposed as a unifying physiological mechanism underlying both acute and chronic confusional states. We discuss the relationship of these findings to electrophysiological markers associated with disorders of consciousness.
Introduction
I
Although impaired attention is a cardinal feature, 1 PTCS also presents with protean symptoms, such as disorientation and amnesia, fluctuation of presentation, restlessness, nighttime sleep disturbance, daytime decreased arousal, and psychotic-type symptoms. 2,8 This collection of symptoms and their prognostic significance have been quantified using the Confusion Assessment Protocol (CAP). 2 Whereas the duration 3 and severity 2 of PTCS symptoms have well-established implications for long-term outcomes, little is known about the underlying pathophysiology specific to the associated symptoms. To the best of our knowledge, no previous study has examined electrophysiological correlates of PTCS symptoms and their impact on functional outcomes.
Electroencephalography (EEG) is a sensitive and reliable indicator of cerebral function and has long been used to characterize clinical changes post-TBI. 9,10 Although EEG has been used in the acute phase of recovery 11 to detect seizures 12 and prognosticate survival, 13,14 little is known about the physiology underlying the specific and quantifiable symptoms of acute confusion. EEG has also been utilized to characterize medical delirium and provide an objective measure of its severity. 15,16 The overlap of delirium and PTCS symptoms further suggests the potential value of EEG as an electrophysiological marker of PTCS.
The aim of this study was to determine whether changes in spectral power of EEG are associated with the severity and symptoms of PTCS 2 and evaluate the utility of EEG spectral markers for predicting long-term outcome post-TBI. The participants for this retrospective study were selected from a larger sample with well-characterized injury and outcome measures.
Methods
Study population
The study population was comprised from TBI Model Systems participants admitted to the brain injury unit of a freestanding rehabilitation hospital from 1999 through 2008. Participants met the criteria for the National Institute on Disability and Rehabilitation Research TBI Model Systems program, which include: 1) medically documented TBI; 2) treatment at an affiliated level 1 trauma center within 24 h of injury; 3) receipt of inpatient rehabilitation within the Model System; 4) admission to inpatient rehabilitation within 72 h of discharge from acute care; 5) age of at least 16 years at the time of injury; and 6) provision of informed consent. 2 Because behavioral data came from a substudy examining acute confusion phenomenology and the EEG records were the primary focus of this current study, the exclusion criteria focused on EEG quality (artifacts) and type (resting eyes closed). To ensure that the subject had emerged from a minimally conscious state, we only included subjects who had a documented CAP 14 days or less preceding the EEG recording. Further, because of the rapidly fluctuating and transitory nature of confusional symptoms, we assessed the relationship of EEG to CAP symptoms only for participants who had both studies completed on the same day. For the assessment of EEG to long-term outcome, we included participants who had a CAP assessment within 14 days preceding the EEG record. The study received approval by the local institutional review board. As noted in the inclusion criteria, written informed consent was obtained.
Behavioral measures
Confusion Assessment Protocol. 2
The CAP provides a structured and repeatable method for measuring seven key symptoms of post-traumatic confusion: 1) cognitive impairment; 2) disorientation; 3) agitation; 4) symptom fluctuation; 5) nighttime sleep disturbance; 6) decreased daytime arousal; and 7) psychotic symptoms. Symptoms are rated dichotomously (i.e., absent or present). Items are summed to obtain a total CAP score ranging from 0 to 7, with higher scores indicating greater confusion severity. The CAP is well validated with construct and criterion validity. 3 CAP classification (i.e., confused/not confused) was consistent with Diagnostic and Statistical Manual of Mental Disorders, Fourth Edition–based delirium diagnosis with 84% overall accuracy. 2,17
Functional Independence Measure. 18
The Functional Independence Measure (FIM) total score (range, 18–26) is comprised of the Cognition and Motor subscales. For each of the items described below, a score of 1 reflects complete dependence or inability and a score of 7 reflects complete independence and normal ability.
Cognition Subscale (range, 5–35)
The cognition subscale is composed of five items designed to measure functional status in cognition (language comprehension, language expression, social interaction, problem solving, and memory).
Motor Subscale (range, 13–91)
The motor subscale is composed of 13 items designed to measure functional motor status (eating, grooming, bathing, dressing-upper body, dressing-lower body, toileting, bladder management, bowel management, transfers-bed/chair/wheelchair, transfers-toilet, transfers-bath/shower, walk/wheelchair, and stairs).
Data collection procedures
Research assistants collected information from hospital and emergency medical service records and from interviews with participants and their family members. The data collected include demographic characteristics, injury severity (Emergency Department Glasgow Coma Scale, Time to Follow Commands [TFC], duration of post-traumatic amnesia [PTA], and length of stay). TFC was defined as the interval from injury to the occurrence of 2 consecutive days of command following. Emergence from PTA was assessed prospectively by repeated administration of the Galveston Orientation Amnesia Test (GOAT), 19 24–72 h apart until two consecutive scores were achieved at or above the threshold for clearing PTA. 20,21 Upon admission and serially during hospitalization, a neuropsychologist rated each participant on the CAP using semistructured neurobehavioral examinations, medical record review, and staff consultation. 2 Rehabilitation clinicians or research assistants rated functional independence at the time of rehabilitation discharge and by patient or caregiver interview (generally by telephone) at 1, 2, and 5 years post-injury. Raw EEG data were retrieved from medical records. These records were reviewed for study inclusion as described above. The demographics of the subjects (excluded and included) are shown in Table 1. Clinicians obtaining CAP data were masked to EEG findings.
N = 101; **N = 76; ***N = 39; ****N = 36; *****N = 56;
ER, emergency room; EEG, electroencaphalography; SD, standard deviation.
Electroencephalography data
EEG data were recorded from 19 scalp electrodes placed individually according to the International 10-20 system using the Nicolet vEEG device (
Electroencephalography data processing
EEG records were visually reviewed per study inclusion/exclusion criteria as described below. EEG analysis required at least 2 min of eyes closed resting state. Spectral analysis of EEG was performed with in-house software written in Matlab (The MathWorks, Inc., Natick, MA). For each subject, the eyes closed period was first segmented into 3-sec epochs. Epochs with significant artifacts from line noise, eye blink, or muscle activity were removed after visual inspection. If multiple eyes closed periods were available within the same recording, they were combined after ascertaining similar spectral content. EEG signals were next converted to the Hjorth Laplacian montage to improve source localization.
22
Power spectral density for each channel was then calculated using Thomson's multitaper method,
23,24
as implemented by mtspectrumc in the Chronux Matlab toolbox (Mitra and Bokil 2007;
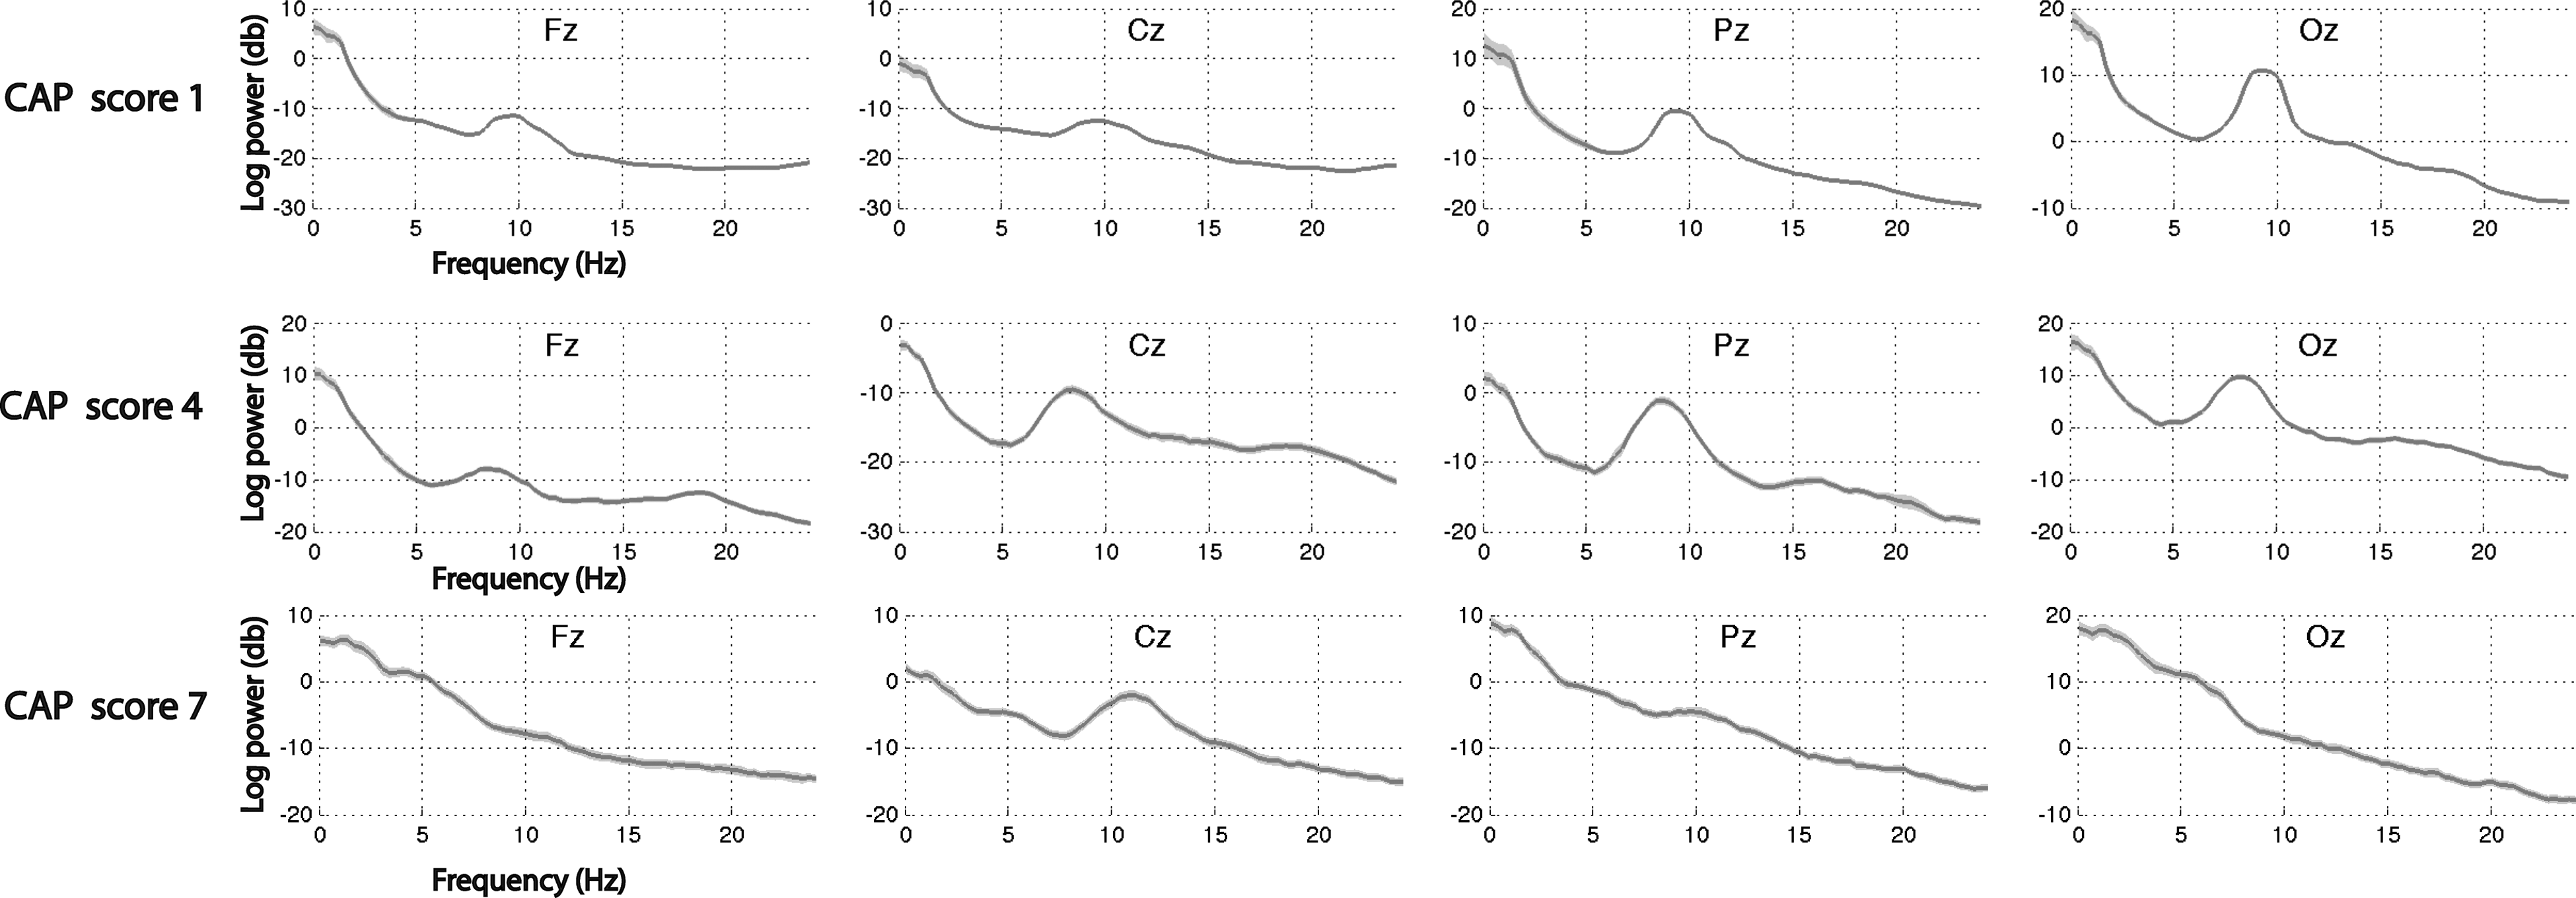
Three example individual spectra of the central channels. CAP, Confusion Assessment Protocol.
Deriving delta and alpha ratios
To derive the delta and alpha ratio (DAR), the average difference of log spectral power within the frequencies of 1–4 Hz (delta) and 8–12 Hz (alpha) was obtained for each scalp channel (Fig. 3). We chose a set alpha band to allow for standardization across the subjects. The averages of specific channels were then grouped as follows: global: F3, Fz, F4, C3, Cz, C4, P3, Pz, P4, O1, Oz, O2; global left: F3, C3, P3, O1; global right: F4, C4, P4, O2; occipital = O1, Oz, O2; occipital left: O1; occipital right: O2; parietal: P3, Pz, P4; parietal left: P3; parietal right: P4; temporal: T3, T4, T5, T6; temporal left: T3, T5; temporal right: T4, T6; frontal = F3, Fz, F4; frontal left: F3; and frontal right: F4. We focused on the delta-alpha band power ratio to facilitate comparisons with existing literature. 15,26,27
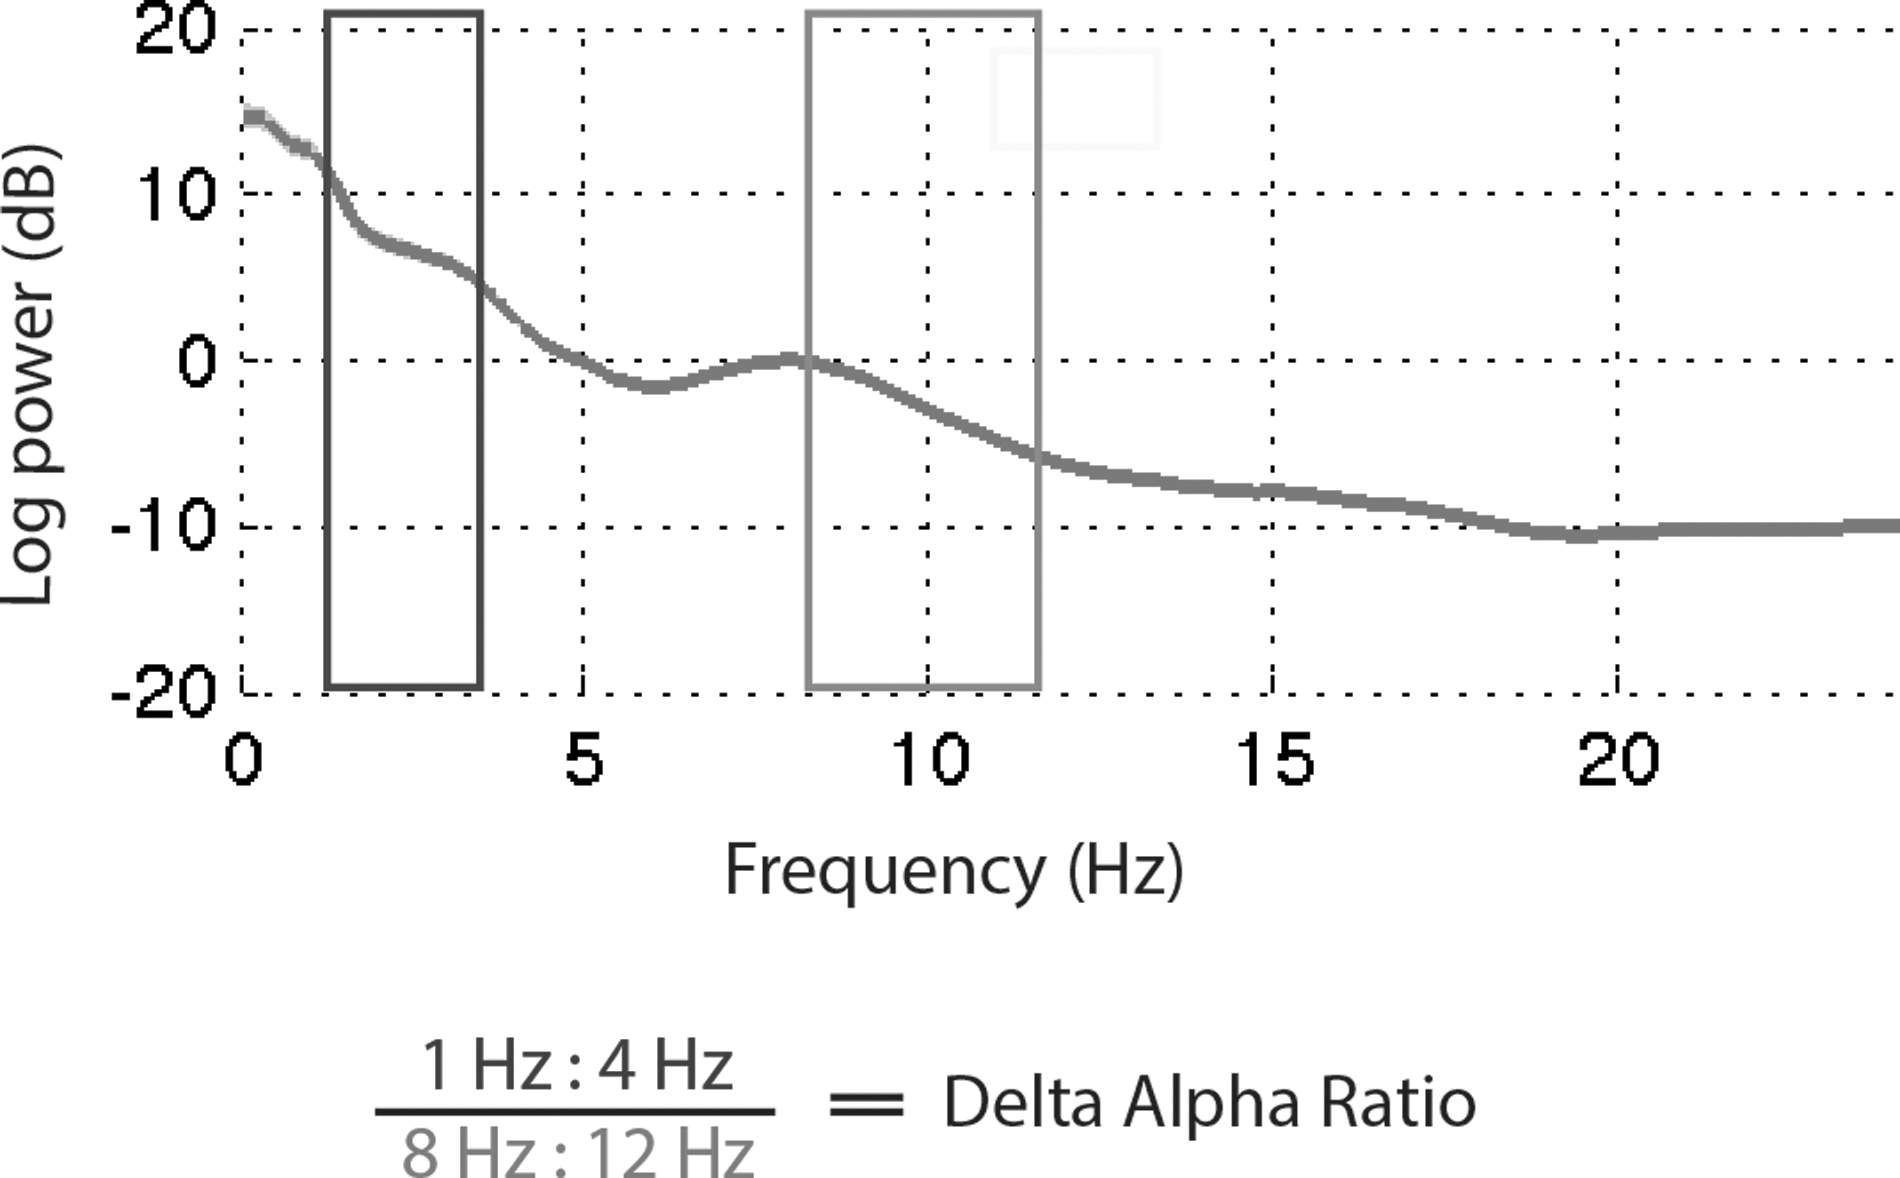
Delta alpha ratio.
Statistical analysis
Univariable linear regression model
A simple regression analysis was performed to assess the relationship between DAR and CAP severity for data sets where EEG and CAP were obtained on the same day (n = 35). The DAR values for global, occipital, parietal, and frontal (all, left, right) were analyzed separately.
Multivariable linear regression model
Candidate predictors for the multi-variable model were age, acute length of stay, TFC, and interval in days from injury to EEG recording. Variables showing univariable significant association with CAP severity (p ≤ 0.05) were included in the multi-variable model. Only TFC met this criterion and was entered as a covariate in a multivariable model.
Logistic regression model
Logistic regression analyses were used to determine the relationships between DAR values and each of the seven CAP subscores for participants where EEG and CAP were obtained on the same day (n = 35). The presence of each CAP symptom was noted with a binary scale (1 = yes; 2 = no). Both simple and multi-variable models with TFC as a covariate were examined.
Similarly, the association between DARs and FIM Cognitive scores at 1 (n = 45), 2 (n = 42), and 5 (n = 34) years post-injury was assessed for data sets where CAP data were available within 14 days or less before the EEG. To create a dichotomous outcome, the average cognitive FIM score was derived for each patient and those with a 6 or above were coded as independent = 1 and the others as not independent = 0.
Nonparametric analyses
To compare the results of the regression analyses, bootstrapping and permutation of differences between all possible pairs was conducted. For the linear regression, differences between each of the β values (down the column and across the rows of Table 2) were assessed for significance by 1) bootstrapping (1000 times) to obtain confidence limits and 2) permutation (1000 times) to obtain a p value (Supplementary Table 1) (see online supplementary material at
p < 0.05; ** p < 0.01.
CI, confidence interval; Uni, univariable; Multi, multivariable; β, beta coefficient.
Receiver operating characteristic analysis
Receiver operating characteristic (ROC) analysis was used to determine the area under the curve (AUC) using DAR to classify patients into 1) PTA (resolution as determined by GOAT 19 before/on date of EEG (n = 35) and 2) PTCS (grouped as confused if showing either four or more symptoms or three or more symptoms providing one is disorientation) on date of EEG (n = 35). Threshold values on DAR variables that optimally discriminated patients on each classification were identified using Youden's j statistic (J = maxc {Se(c) + Sp(c) – 1}). Sensitivity and specificity were calculated at the optimal thresholds selected for each DAR variable of interest.
All p values are two-sided and statistical significance was evaluated at alpha = 0.05. Statistical analysis was performed using SAS (version 9.4; SAS Institute Inc., Cary, NC) and/or Matlab software (The MathWorks, Inc., Natick, MA).
Results
Study sample
During the study period, 178 participants with 253 EEG records met study inclusion and exclusion criteria. CAP data were available for only 160 participants. For participants with multiple EEG records, we used the record for which there was a CAP assessment within 14 days preceding the EEG. If there was more than one CAP assessment in this interval, we used the one most proximal to the EEG record. This resulted in exclusion of 93 EEG records. Additional exclusion criteria included lack of at least 2 min of eye closure during EEG (n = 55) and presence of suspected sleep (to allow for uniform comparisons across all subjects on the same state) or excessive muscle artifact on EEG (n = 23). Further, those without CAP data within 2 weeks preceding EEG (n = 33) were excluded, resulting in a total of 111 exclusions. This resulted in a study sample of 49 eligible participants as illustrated in the Figure 1 Consolidated Standards Of Reporting Trials (CONSORT) diagram. From these 49 subjects, subanalyses were conducted on those with 1) concurrent CAP and EEG on the same day (n = 35) and 2) outcome analyses at 1 (n = 45), 2 (n = 42), and 5 (n = 34) years post-injury including those with CAP data within the 14 days preceding the EEG. Table 1 provides summary demographics and injury severity for those excluded (n = 111) and those retained (n = 49) for analyses. Comparisons of the sample included (n = 49) and sample excluded (n = 111) revealed significant differences in certain clinical parameters summarized in Table 1. Individuals excluded from analyses had greater injury severity. As such, the sample excluded also had a longer interval from injury until EEG recording.
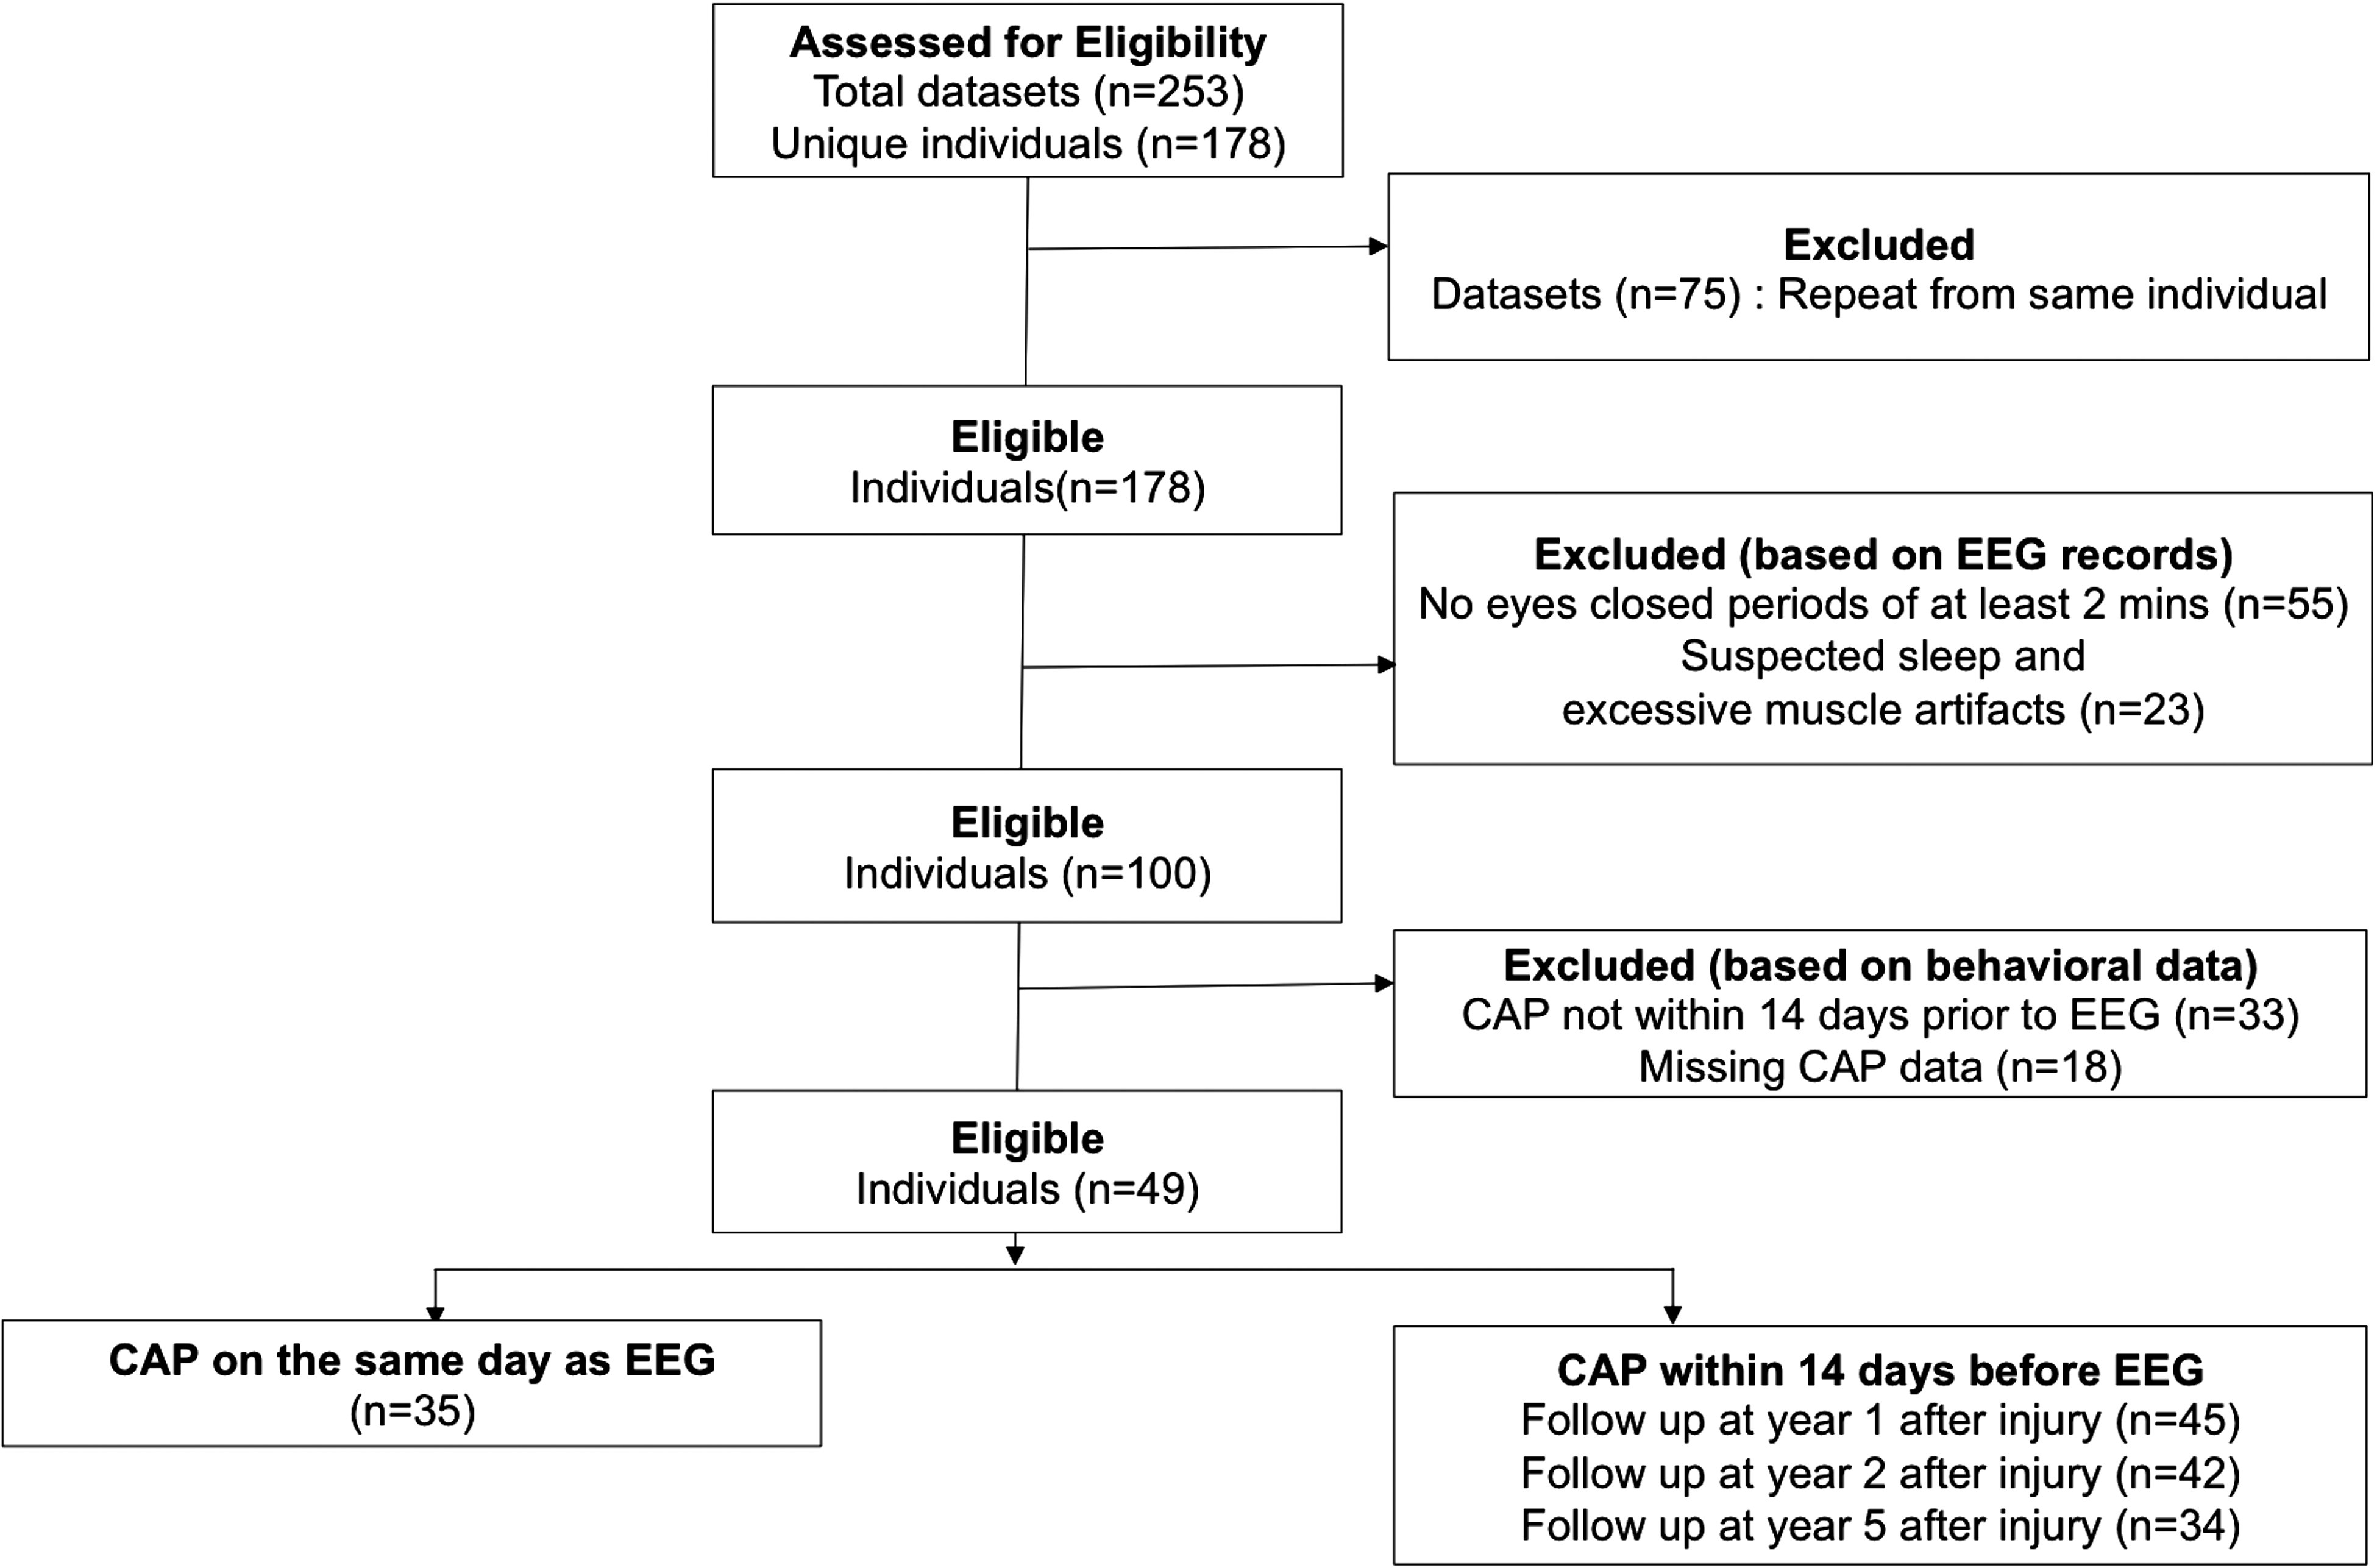
CONSORT flow diagram of study design. CAP, Confusion Assessment Protocol; CONSORT, Consolidated Standards Of Reporting Trials; EEG, electroencephalographic.
Delta alpha ratio and confusion severity
For the subset with concurrent EEG and CAP administration, 63% of participants met criteria for confusional state with most evidencing severe confusion (86%). Univariable linear regression models (Table 2) were used to evaluate DAR from localized brain areas as predictors of total CAP score (severity) obtained on the same day. After adjusting for injury severity (TFC), we found significant positive association (i.e., increased DAR associated with increased severity) between total CAP score (confusion severity) and DARs from global (all, left), occipital (all, left, right), parietal (left), and temporal (all, left) regions. Comparisons of the β values (Supplementary Table 1) show that global DAR has significantly higher association with total CAP score when compared to occipital and parietal but not temporal.
Delta alpha ratio and confusion phenomenology
The association between DAR and the seven aspects of confusion phenomenology measured by the CAP were modeled using logistic regression (Table 3). After controlling for TFC, DARs from the occipital areas were significantly associated (i.e., increased DAR associated with symptom presence) with CAP subscore 2 (disorientation
28,29
; all, right), as well as CAP subscore 4 (symptom fluctuation; all, left, right). Parietal, global, and frontal DAR did not have significant unique relationships with CAP subscores (results not shown). Comparisons of the odds ratios (ORs; Supplementary Table 2) (see online supplementary material at
p < 0.05.
CAP, Confusion Assessment Protocol; OR, odds ratio; CI, confidence interval.
Delta alpha ratio and long-term outcome
Regression analyses showed that several DARs were significantly associated with cognitive functional outcomes at 1, 2, and 5 years post-injury (Table 4). After controlling for injury severity (TFC), only temporal left (1 year) and parietal left (2 years) passed significance criteria. Comparisons of the ORs (Supplementary Tables 3–5) (see online supplementary material at
p < 0.05.
Uni, univeriable; Multi, multivariable; OR, odds ratio; CI, confidence interval.
Similar analyses were conducted to predict other outcome measures: FIM Motor score; FIM Total score; Disability Rating Scale (DRS); and Glasgow Outcome Scale (GOS). No significant relationship was found between DAR and FIM Motor outcomes at 1, 2, and 5 years. Significant univariable relationships between the FIM Total score and occipital (1 and 2 years) and occipital and parietal left (1, 2, and 5 years) did not survive multi-variable regression. No significant relationship was found for DRS. Significant relationships between DAR (global, global left, occipital, occipital left, occipital right, and parietal left) and GOS (at only 2 years) was found. The relationship between DAR (occipital, occipital left, and parietal left only) and GOS survived multi-variable regression.
Delta alpha ratio and diagnostic utility
Based on the criteria described in methods, n = 17 remained in PTA and PTCS at time of EEG. The continuous variable for overall occipital had the highest AUC among the DAR variables for the PTCS outcome (AUC = 0.66) and the PTA outcome (AUC = 0.77; see Supplementary Table 6) (see online supplementary material at
Discussion
Here, we identify EEG correlates of individual symptoms of PTCS and functional outcomes over time. Specifically, we find that increased delta and decreased alpha in the occipital, parietal, and temporal brain areas is associated with a significant increase in the severity of confusion, as indicated by the CAP symptom count. Additionally, increased occipital DAR is positively associated with both disorientation and fluctuation of symptoms. Occipital DAR also proved the best discriminator of those who were still in PTA and PTCS versus those who had resolved these conditions by GOAT or CAP criteria at the time of EEG. Finally, increased DAR in the posterior regions is significantly associated with cognitive outcomes at 1, 2, and 5 years with the associations at 1 and 2 years surviving after inclusion of the injury severity regressor. The evidence of strong relationships between posterior DAR and CAP total score (and two of the CAP subscores), and their enduring association with functional outcomes at 1, 2, and 5 years post-injury, has mechanistic implications.
Our findings of increased delta and reduced alpha activity (increased DAR) in the posterior cortices can reflect either structural and/or functional de-afferentation across corticocortical and thalamocortical connections as a result of TBI. Increased delta activity has been correlated with alterations in deeper brain structures, such as the thalamus or mesencephalic reticular formation, 30 damage to cholinergic basal forebrain 31,32 or cholinergic white matter tracts, 33 and more global white matter deafferentation. 30,34,35 Similarly, functional downregulation of neocortical neurons may produce increases in delta, as observed in the intact brain during microsleep intrusion within wakefulness 36 or during general anesthesia. 37 More specific to our results, studies in both animals 38,39 and humans 40 –44 have shown the contribution of the parietal, temporal, and occipital cortices, along with the thalamus, to posterior alpha rhythm generation. Reduced alpha activity has been generally correlated with gray matter lesions 34 and interpreted as evidence of reduced cortical excitability. 45 The specificity of the posterior cortices in our results can be compared with lesion studies of post-stroke confusion and delirium, which share an overlap of symptoms with PTCS, 8 and implicate posterior parietal, temporal, occipital, 46,47 and thalamic 48 sites.
We hypothesize that the association of acute delirium and lesions within parietal, temporal, and occipital cortices, and our findings of an association of DAR in these same regions to severity of confusion and long-term functional outcomes, may originate in the known role of the posterior medial complex (PMC) in recovery after severe brain injury. 49 Previous studies have shown that the metabolic level of PMC activity indices levels of recovery after coma, ranging from vegetative state to normal cognition. 4 In addition, both the structural integrity of the PMC 5,6 and its functional relationship with the thalamus 7 have been shown to correlate with functional levels in patients with disorders of consciousness. 5
The PMC has the highest resting metabolic rate in the healthy adult brain
50
and represents a key node in the default mode network
51
that has been proposed to reflect the baseline state of the human brain. Functional imaging studies have linked PMC to internally directed cognition, recall of autobiographical memory, and attention regulation.
52
The structural and functional disconnection of the PMC has been correlated with impaired attention post-TBI.
31
Structural lesions within the PMC, specifically the posterior cingulate region, are associated with retrosplenial amnesia, a symptom complex dominated by loss of episodic memory formation and memory retrieval deficits that can impair orientation and lead to marked amnesia.
54
Recently, functional and structural disconnection between the posterior cingulate cortex and hippocampus in the medial temporal lobe was shown to correlate with episodic memory impairment and processing speed in patients with PTA,
55
a similar population to those in our study. That study also reported on disconnections within the posterior default mode network in TBI subjects. More specific to our results of a stronger relationship between left DAR and cognitive outcomes (Supplementary Tables 3–5) (see online supplementary material at
Comparison with previous literature
To the best of our knowledge, this is the first study examining the link between quantitative behavioral assessments and electrophysiological activity in PTCS. Increased delta activity and decreased posterior alpha rhythm (visual assessment) have been previously reported in the acute period of recovery post-TBI, 9 in patients subsequent to concussions, 56 and have been found to differentiate between mild TBI subjects and controls during eyes closed rest. 57 Importantly, an increase in global DAR was reportedly the best predictor of functional outcome after acute neurorehabilitation of TBI patients, 26 but confusional symptoms were not assessed in this investigation. Global DAR measures have also been shown to be predictive of outcome after multi-focal ischemic injury subsequent to subarachnoid hemorrhage. 27
Our findings also demonstrate strong overlap between EEG changes in PTCS and those reported in medical delirium. 8 In the context of medical delirium, the relationship of occipital DAR to symptoms has been quantified in elderly subjects, 58 showing that increases in delta percentage correlate with longer duration of delirium and hospitalization, and an overall increase in slow-wave power and decrease in alpha power correlate with worsening delirium. Taken together with our present results, these occipital DAR findings in medical delirium suggest a unifying mechanism of dysfunction within PMC underlying confusional symptoms. In the context of medical deliria arising within a fully connected, structurally uninjured brain, the selective disturbance of PMC is likely attributed to the high metabolic demand of these neurons remaining unmet in the setting of limited availability of metabolic substrates caused by acute illness (infection, inflammation, and altered cellular function, among others).
Study strengths and limitations
Attributed to the rapidly fluctuating nature of PTCS and the specific symptomology (e.g., agitation), obtaining EEG in this population is challenging. Further limitations of this study include retrospective analyses of a prospectively collected data set. When originally recorded, maintenance of a resting state (e.g., eyes closed) for a period of time sufficient for quantitative analyses was not required. Additionally, because the EEGs were obtained for clinical purposes (e.g., seizure detection), CAP was not always administered on the same day. As such, only a subset of patients from the larger data set met inclusion criteria for analyses (see Fig. 1, Table 1, and Methods). The included and excluded samples were different on certain clinical parameters. A limited number of events in the logistic regression resulted in wide confidence intervals (CIs) and borderline significance.
Because of the small sample size, we did not conduct an exhaustive analysis of the dominant rhythm (alpha). Across the cohort, there is variability within the alpha band with absence, reduction, and shifting of the peak (see Fig. 2). A larger sample size would allow for a more in-depth exploration of these patterns.
Although EEGs were routinely read by a clinical epileptologist for clinical purposes, because of the retrospective nature of this study and inclusion of the subset of EEGs from a much larger database, it was not possible within the scope of this study to collate our results with those of the clinical EEG readings.
Strengths of this study include prospective evaluation of a large sample. These secondary analyses are the first to relate spectral parameters of the EEG against standardized measures of behavioral and rehabilitation outcome. These findings further extend the current literature by examining longitudinal outcomes post-TBI up to 5 years post-injury. Despite the wide CIs for some variables, large effect estimates support the presence of real association.
Future work
The emerging association of dysfunction in the parieto-occipito-temporal regions with clinical symptoms of PTCS and long-term outcome post-TBI invite future work exploring their close mechanistic link in terms of symptoms of fluctuation and orientation. Similarly, further studies of the link between physiological substrate underlying EEG changes, neurochemical assays, and the tiered resolution of symptoms 1 during the post-traumatic confusional period will improve understanding of pathophysiology and direct efforts at developing interventions.
Footnotes
Acknowledgments
Portions of this work were sponsored by VHA Central Office VA TBI Model System Program of Research, Subcontract from General Dynamics Health Solutions (W91YTZ-13-C-0015) from the Defense and Veterans Brain Injury Center, US Army Medical Research and Material Command (USAMRMC), Administration for Community Living / National Institute on Disability, Independent Living, and Rehabilitation Research grants 90DP0028-02-01 and H133A020514, Wilson Research Foundation, Jackson, MS and the Jerold B.Katz Foundation. The authors also thank Nicholas David W. Smith for assistance with manuscript preparation. The views, opinions, and/or findings contained in this article are those of the authors and should not be construed as an official Department of Defense position or any other federal agency, policy or decision unless so designated by other official documentation.
Author Disclosure Statement
No competing financial interests exist.
References
Supplementary Material
Please find the following supplemental material available below.
For Open Access articles published under a Creative Commons License, all supplemental material carries the same license as the article it is associated with.
For non-Open Access articles published, all supplemental material carries a non-exclusive license, and permission requests for re-use of supplemental material or any part of supplemental material shall be sent directly to the copyright owner as specified in the copyright notice associated with the article.