




Abstract
The optimum spinal cord perfusion pressure (SCPP) after traumatic spinal cord injury (TSCI) is unknown. Here, we describe techniques to compute and display the optimum SCPP in real time. We recruited adults within 72 h of severe TSCI (American Spinal Injuries Association [ASIA] grades A-C). A pressure probe and a microdialysis catheter were placed on the injured cord. SCPP was computed as mean arterial pressure (MAP) minus intraspinal pressure (ISP), spinal pressure reactivity index (sPRx) as the running ISP/MAP correlation coefficient, and continuous optimum SCPP (cSCPPopt) as the SCPP that minimizes sPRx in a moving 4-h window. In 45 patients, we monitored ISP and blood pressure. In 14 patients, we also monitored injury site metabolism. cSCPPopt could be computed 45% of the time. Mean cSCPPopt varied by up to 60 mm Hg between patients. Each patient's cSCPPopt varied with time (standard deviation 10-20 mm Hg). Color-coded maps showing the sPRx/SCPP curve evolution enhanced visualization of cSCPPopt. Periods when SCPP ≈ cSCPPopt were associated with low injury site glucose, high pyruvate, and high lactate. Mean SCPP deviation from cSCPPopt correlated with worse neurological outcome at 9–12 months: ASIA grade improved in 30% of patients with <5 mm Hg deviation, 10% of patients with 5–15 mm Hg deviation, and no one with >15 mm Hg deviation. We conclude that real-time computation and visualization of cSCPPopt after TSCI are feasible. cSCPPopt appears to enhance glucose utilization at the injury site and varies widely between and within patients. Our data suggest that targeting cSCPPopt after TSCI might improve neurological outcome.
Introduction
A
In our original analysis, SCPPopt was computed by pooling data from 18 patients. 4,5 Our initial concept of a pooled SCPPopt requires revision for several reasons. First, there is now evidence that SCPPopt varies between patients 8 and that the injury site metabolic response is individualistic 9 ; thus, targeting 90 mm Hg may not benefit everyone. Second, the SCPPopt of each patient may change with time. Third, the SCPPopt can only be computed after the monitoring has been completed and therefore is not clinically useful. Here, we show how to compute a continuous SCPPopt (cSCPPopt) in real time and provide evidence that achieving this cSCPPopt may be beneficial after TSCI.
Methods
Patient recruitment
Approval for the Injured Spinal Cord Pressure Evaluation study, including the patient information sheet and consent form, was obtained from the St. George's Joint Research Office and the National Research Ethics Service London-St Giles Committee (No. 10/H0807/23). The study is registered with
Probe placement
Following bony realignment and posterior fixation, a pressure probe (Codman Microsensor Transducer; Depuy Synthes, Leeds, U.K.) and a microdialysis (MD) catheter (CMA microdialysis AB, Sweden) were tunneled through skin into the wound cavity. Under the operating microscope, the dura was opened one level below the injury. The pressure probe and MD catheter were inserted through the durotomy and placed on the spinal cord surface. We previously showed that the surface MD catheter samples from the injured spinal cord, not the cerebrospinal fluid (CSF). 6 The dural opening was sutured and supplemented with fibrin glue (Tisseel; Baxter, U.K.). The ISP probe and MD catheter were secured to the skin with silk sutures. A wound drain was set at gravity drainage for a week. Patients were given 5000 units dalteparin daily starting on the day after the surgery. Dalteparin was discontinued 24 h before removing the probes and wound drain.
Patient assessments
Neurological examinations were done on admission and at 2 weeks post-operatively (i.e., before discharge to the rehabilitation facility). Computed tomography (CT) and magnetic resonance imaging (MRI) of the whole–spine were done on admission. Another CT was done within 48 h of surgery to check screw and probe positions. MRI of the injured spinal cord was done at approximately 2 weeks and at 6–12 months after surgery.
Intraspinal pressure and spinal cord perfusion pressure
The pressure probe was connected to a Codman Intracranial Pressure box linked via a ML221 amplifier to a PowerLab running LabChart v.7.3.5 (AD Instruments, Oxford, U.K.). Blood pressure was recorded from a radial artery catheter, kept at the same level as the ISP probe, connected to the Philips Intellivue MX800 bedside monitoring system (Philips, Guildford, U.K.), which in turn connected to the PowerLab system. The ISP and arterial blood pressure signals were sampled at 1 kHz for up to one week. LabChart was used to compute SCPP, defined as MAP minus ISP.
Spinal pressure reactivity
The spinal pressure reactivity index sPRx, a measure of spinal cord vascular reactivity, is the running correlation coefficient between ISP and MAP calculated over a 5-min period as described. 4,5 If the spinal cord vasculature reacts normally, sPRx ≤0. If autoregulation is impaired, sPRx >0.
Microdialysis
MD monitoring was started post-operatively in the neurointensive care unit. Central nervous system perfusion fluid (CMA Microdialysis AB, Sweden) was perfused at a rate of 0.3 μL/min using the CMA106 infusion pump (CMA Microdialysis AB). MD vials were changed hourly, stored at 4°C, and batched analyzed up to 24 h later using ISCUS Flex (CMA Microdialysis AB). The first two samples from each patient were discarded to allow priming of the MD catheter and stabilization of the metabolite concentrations. All samples were analyzed for glucose, lactate, pyruvate, glycerol, and glutamate. One hundred–fold changes in metabolite concentration, compared with the preceding hour, were excluded from analysis. For details, see our earlier papers. 6,10
Optimum spinal cord perfusion pressure
We used the software ICM+ (
Enhanced visualization
sPRx versus SCPP curves were produced each minute, using a sliding 4-h window. The horizontal axis is time and the vertical axis is SCPP. At each time-point, sPRx values are color-coded green (intact reactivity), yellow (borderline reactivity), or red (impaired reactivity). Time-points, for which no cSCPPopt could be determined, are represented by vertical bands filled with monotonic green. A non-causal, exponentially weighted moving average filter was the applied to the image along the time axis. This filter has a smoothing effect in time and fills in some of the gaps with appropriately weighted average of the preceding and following data values. The measured cSCPPopt values were smoothed with the same filter and added to the image. Details are given elsewhere. 11 The images shown here were generated in ICM+ with the current implementation of the MATLAB tool (Ercole et al. in press).
Statistical analysis
Two-tailed t-test was used to compare metabolite level within 5 mm Hg versus more than 5 mm Hg from the cSCPPopt with significance at p < 0.05# and 0.005[[sharp]]. We used the Spearman coefficient to quantify the correlation between neurological outcome versus deviation from cSCPPopt or MAP guideline.
Results
Demographics
Table 1 summarizes details of the 45 patients. Most are young, with 84% <60 years old. Males outnumber females by 3.5:1.0. Cervical TSCIs are more common than thoracic at 56 versus 44%. Most had neurologically complete TSCI on admission; two-thirds were ASIA grade A. Overall, 13% (6/45) patients improved by one grade and 16% (7/45) by at least two grades at 9–12 months. Of those who were grade A, 17% improved versus 44% of grade B and 67% of grade C.
Pooled SCPPopt
Using data from all 45 patients, we plotted sPRx versus ISP and sPRx versus SCPP. Figure 1A shows that as ISP increases, sPRx increases. This suggests that higher ISP correlates with more marked loss of injury site autoregulation. Figure 1B shows a U-shaped relationship between sPRx and SCPP, which suggests that the optimum SCPP is around 80–90 mm Hg. As SCPP falls below 80 mm Hg or rises above 90 mm Hg, injury site autoregulation progressively worsens. Since the optimum SCPP of 80-90 mm Hg was computed by pooling data from all patients, we term this pooled SCPPopt (pSCPPopt). A major drawback of pSCPPopt is that it does not provide information about the variability of SCPPopt between patients.
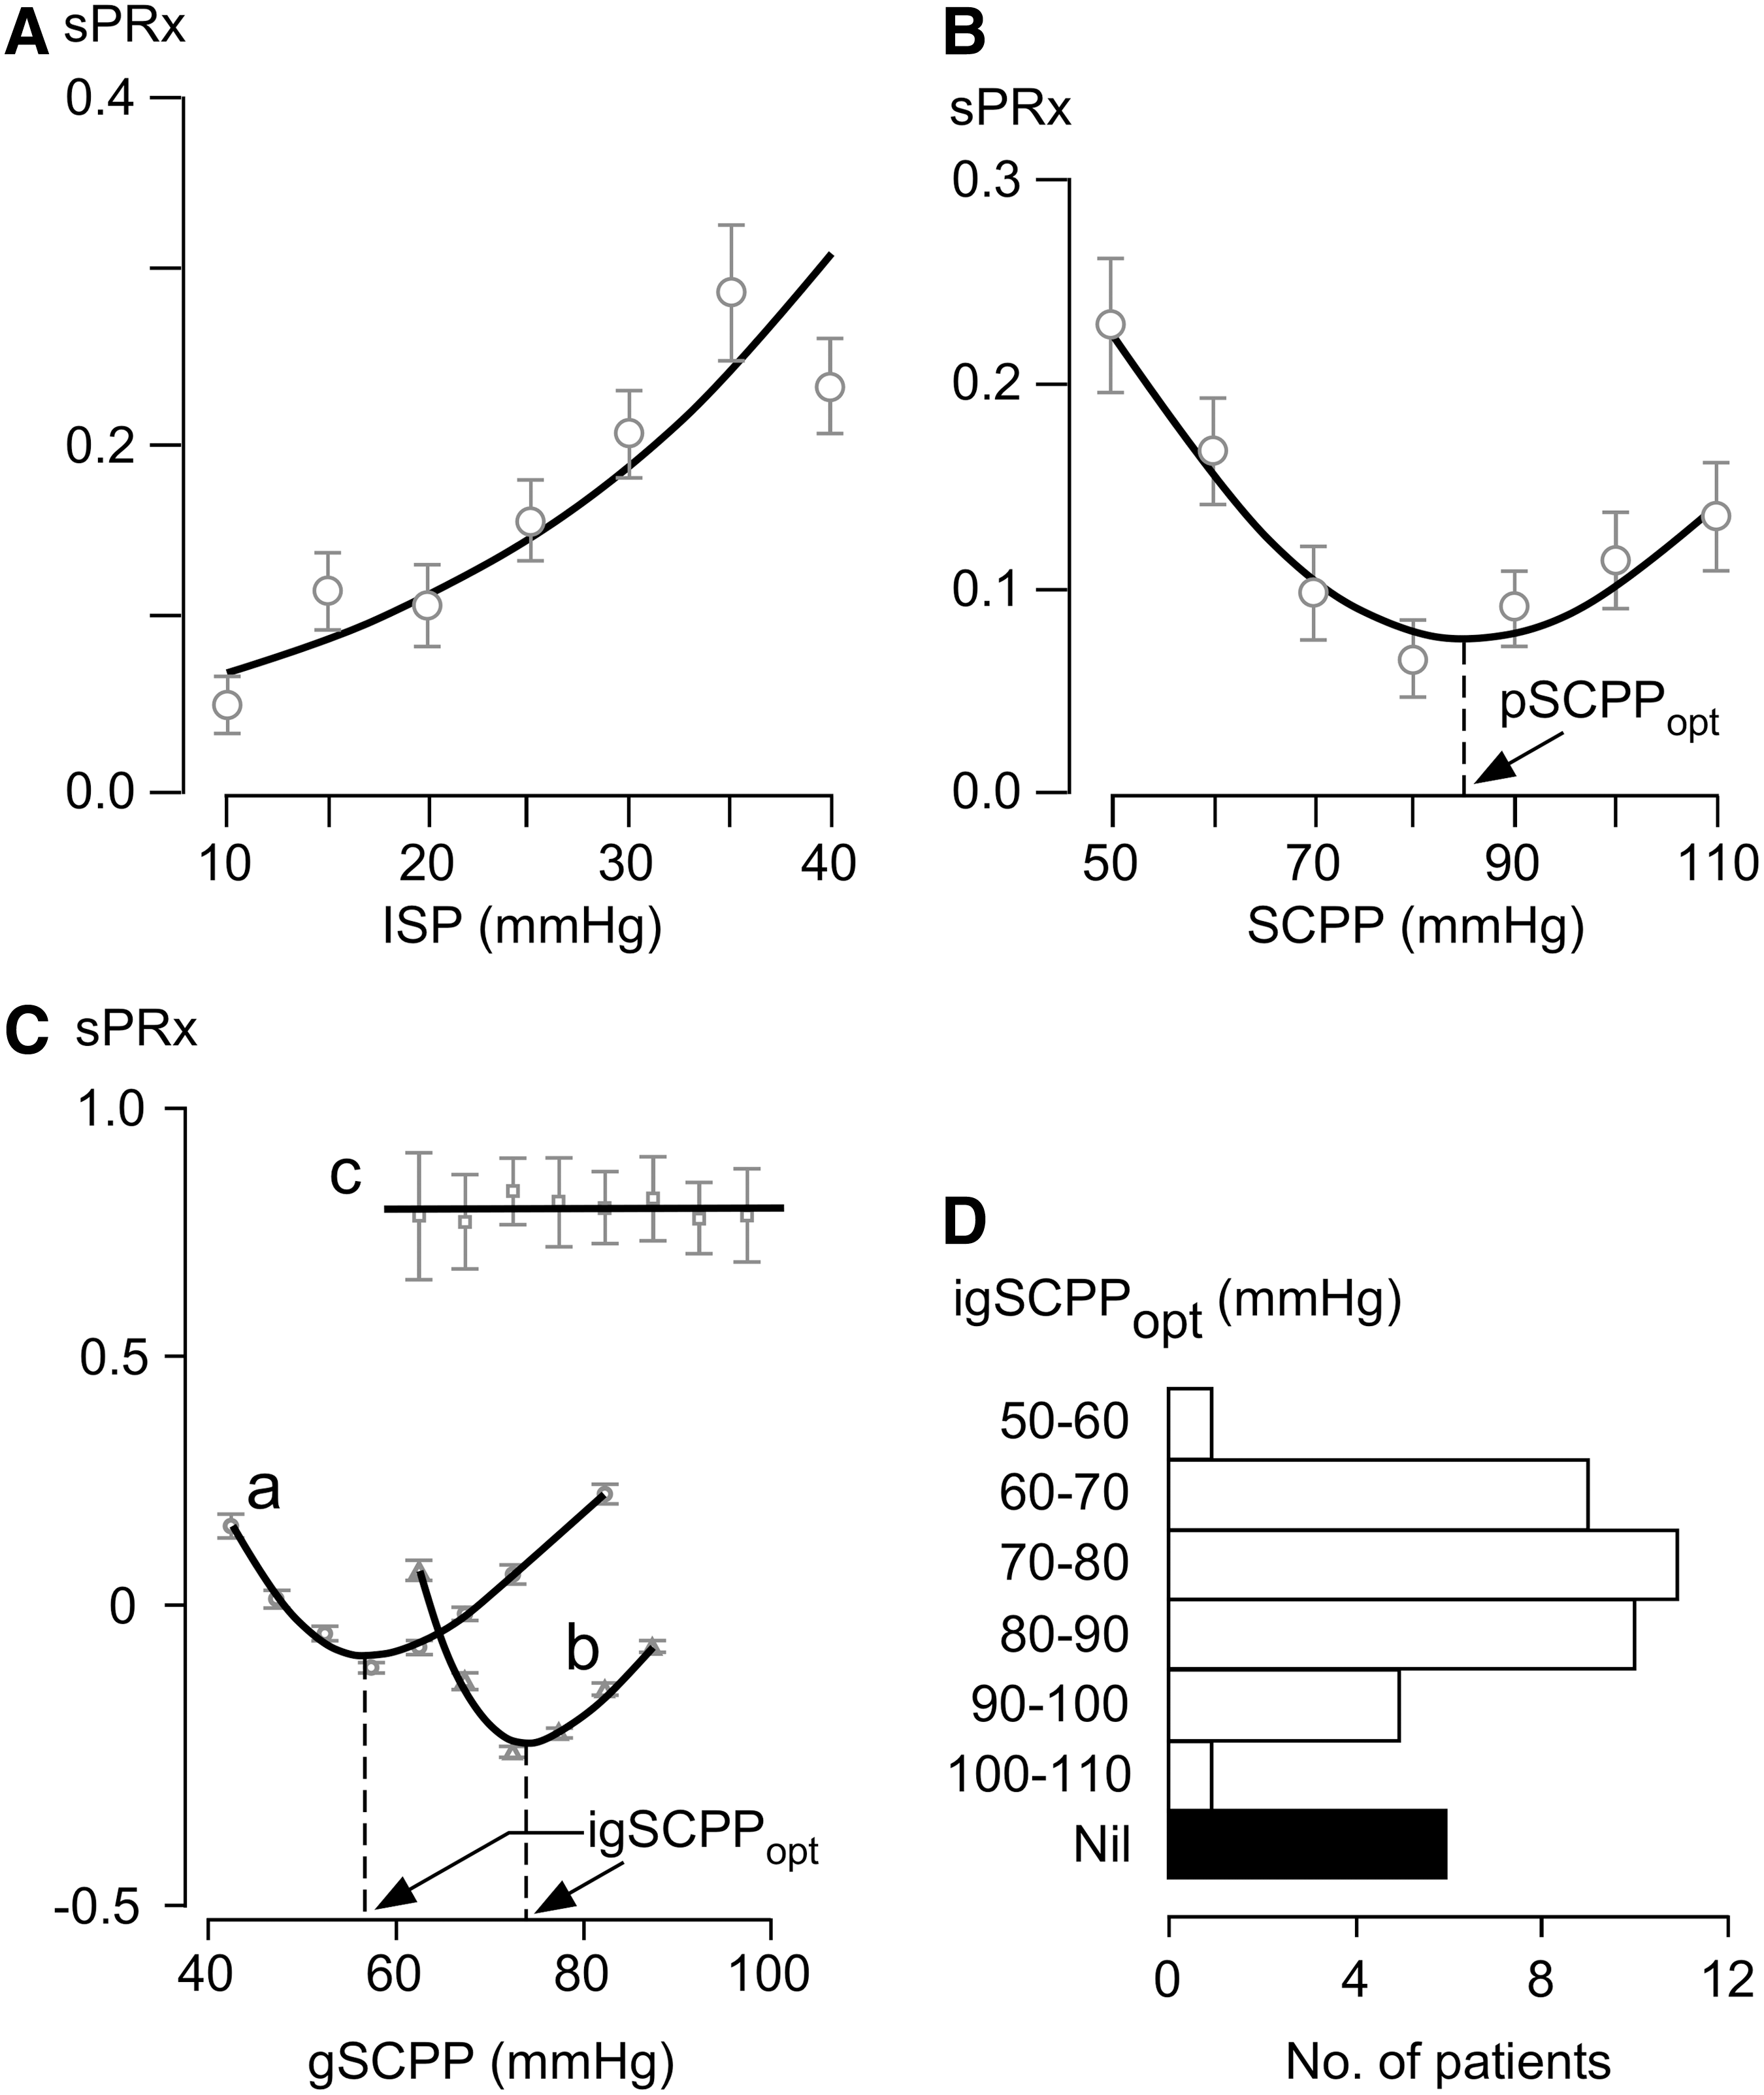
Concepts of pooled optimum spinal cord perfusion pressure (pSCPPopt) and individual global optimum spinal cord perfusion pressure (igSCPPopt).
Individual global SCPPopt
To test the hypothesis that SCPPopt varies between patients, we computed SCPPopt for individual patients by plotting the sPRx versus SCPP for each individual patient. We termed this the individual global (igSCPPopt) because it only applies to an individual patient and the entire monitoring period is used. Figure 1C shows sPRx versus SCPP curve for three patients; two had a U-shaped relationship with approximately 20 mm Hg difference in their igSCPPopt, whereas in one there was no correlation between sPRx and SCPP. igSCPPopt values ranged from 50-60 mm Hg in some patients up to 100-110 mm Hg in others (Fig. 1D). In 13% of patients (6/45), igSCPPopt could not be computed because the relation between sPRx versus SCPP is not U-shaped. Unlike pSCPPopt, which is averaged over many patients, igSCPPopt provides individual patient information. Because igSCPPopt requires the entire ISP and MAP signals, igSCPPopt does not indicate how a patient's SCPPopt changes with time and can only be computed after the monitoring has ended. Thus, igSCPPopt cannot be used to guide patient management in real time in the neurointensive care unit.
Individual continuous SCPPopt
To overcome the problems with igSCPPopt, we computed a running SCPPopt for each patient, which we term the individual continuous SCPPopt, (cSCPPopt) by analogy to the continuous optimum cerebral perfusion pressure (cCPPopt) for brain injury. 11,12 cSCPPopt was calculated using a 4-h window updated every minute. Figure 2 shows sPRx versus SCPP plots obtained using 4-h windows. Some plots (plot a) were U-shaped, thus allowing cSCPPopt to be computed. In other cases, cSCPPopt could not be calculated because the injured cord was underperfused (descending curve, plot b) or overperfused (ascending curve, plot c) or there was no correlation between sPRx and SCPP (plot d). We then varied the time window from 2–10 h to compute the cSCPPopt. For each time window the SCPPopt is calculated, the window is moved forward 60 sec and the SCPPopt result is updated. The process continues for the entire SCPP signal. Therefore, when the process is finished, there is a SCPPopt vector every 60 sec. Each vector has four components (a, b, c, d) and can be (1, 0, 0, 0), (0, 1, 0, 0), (0, 0, 1, 0) or (0, 0, 0, 1) as follows: a - optimum value found, b - hypoperfused, c - hyperperfused, d - no relation between sPRx and SCPP. We then computed the frequencies with which a, b, c, and d occur in the entire SCPP signal. The process was repeated for each patient. Figure 2B shows that time windows greater or equal to 4 h maximize the chance of obtaining the cSCPPopt. With a 4-h window, cSCPPopt could be computed 45% of the time. Figure 3 shows many signals (ISP, MAP, SCPP, sPRx, and cSCPPopt) simultaneously displayed for a single patient. SCPP–cSCPPopt also is displayed to allow doctors to see in real time how their treatment deviates from the optimum.
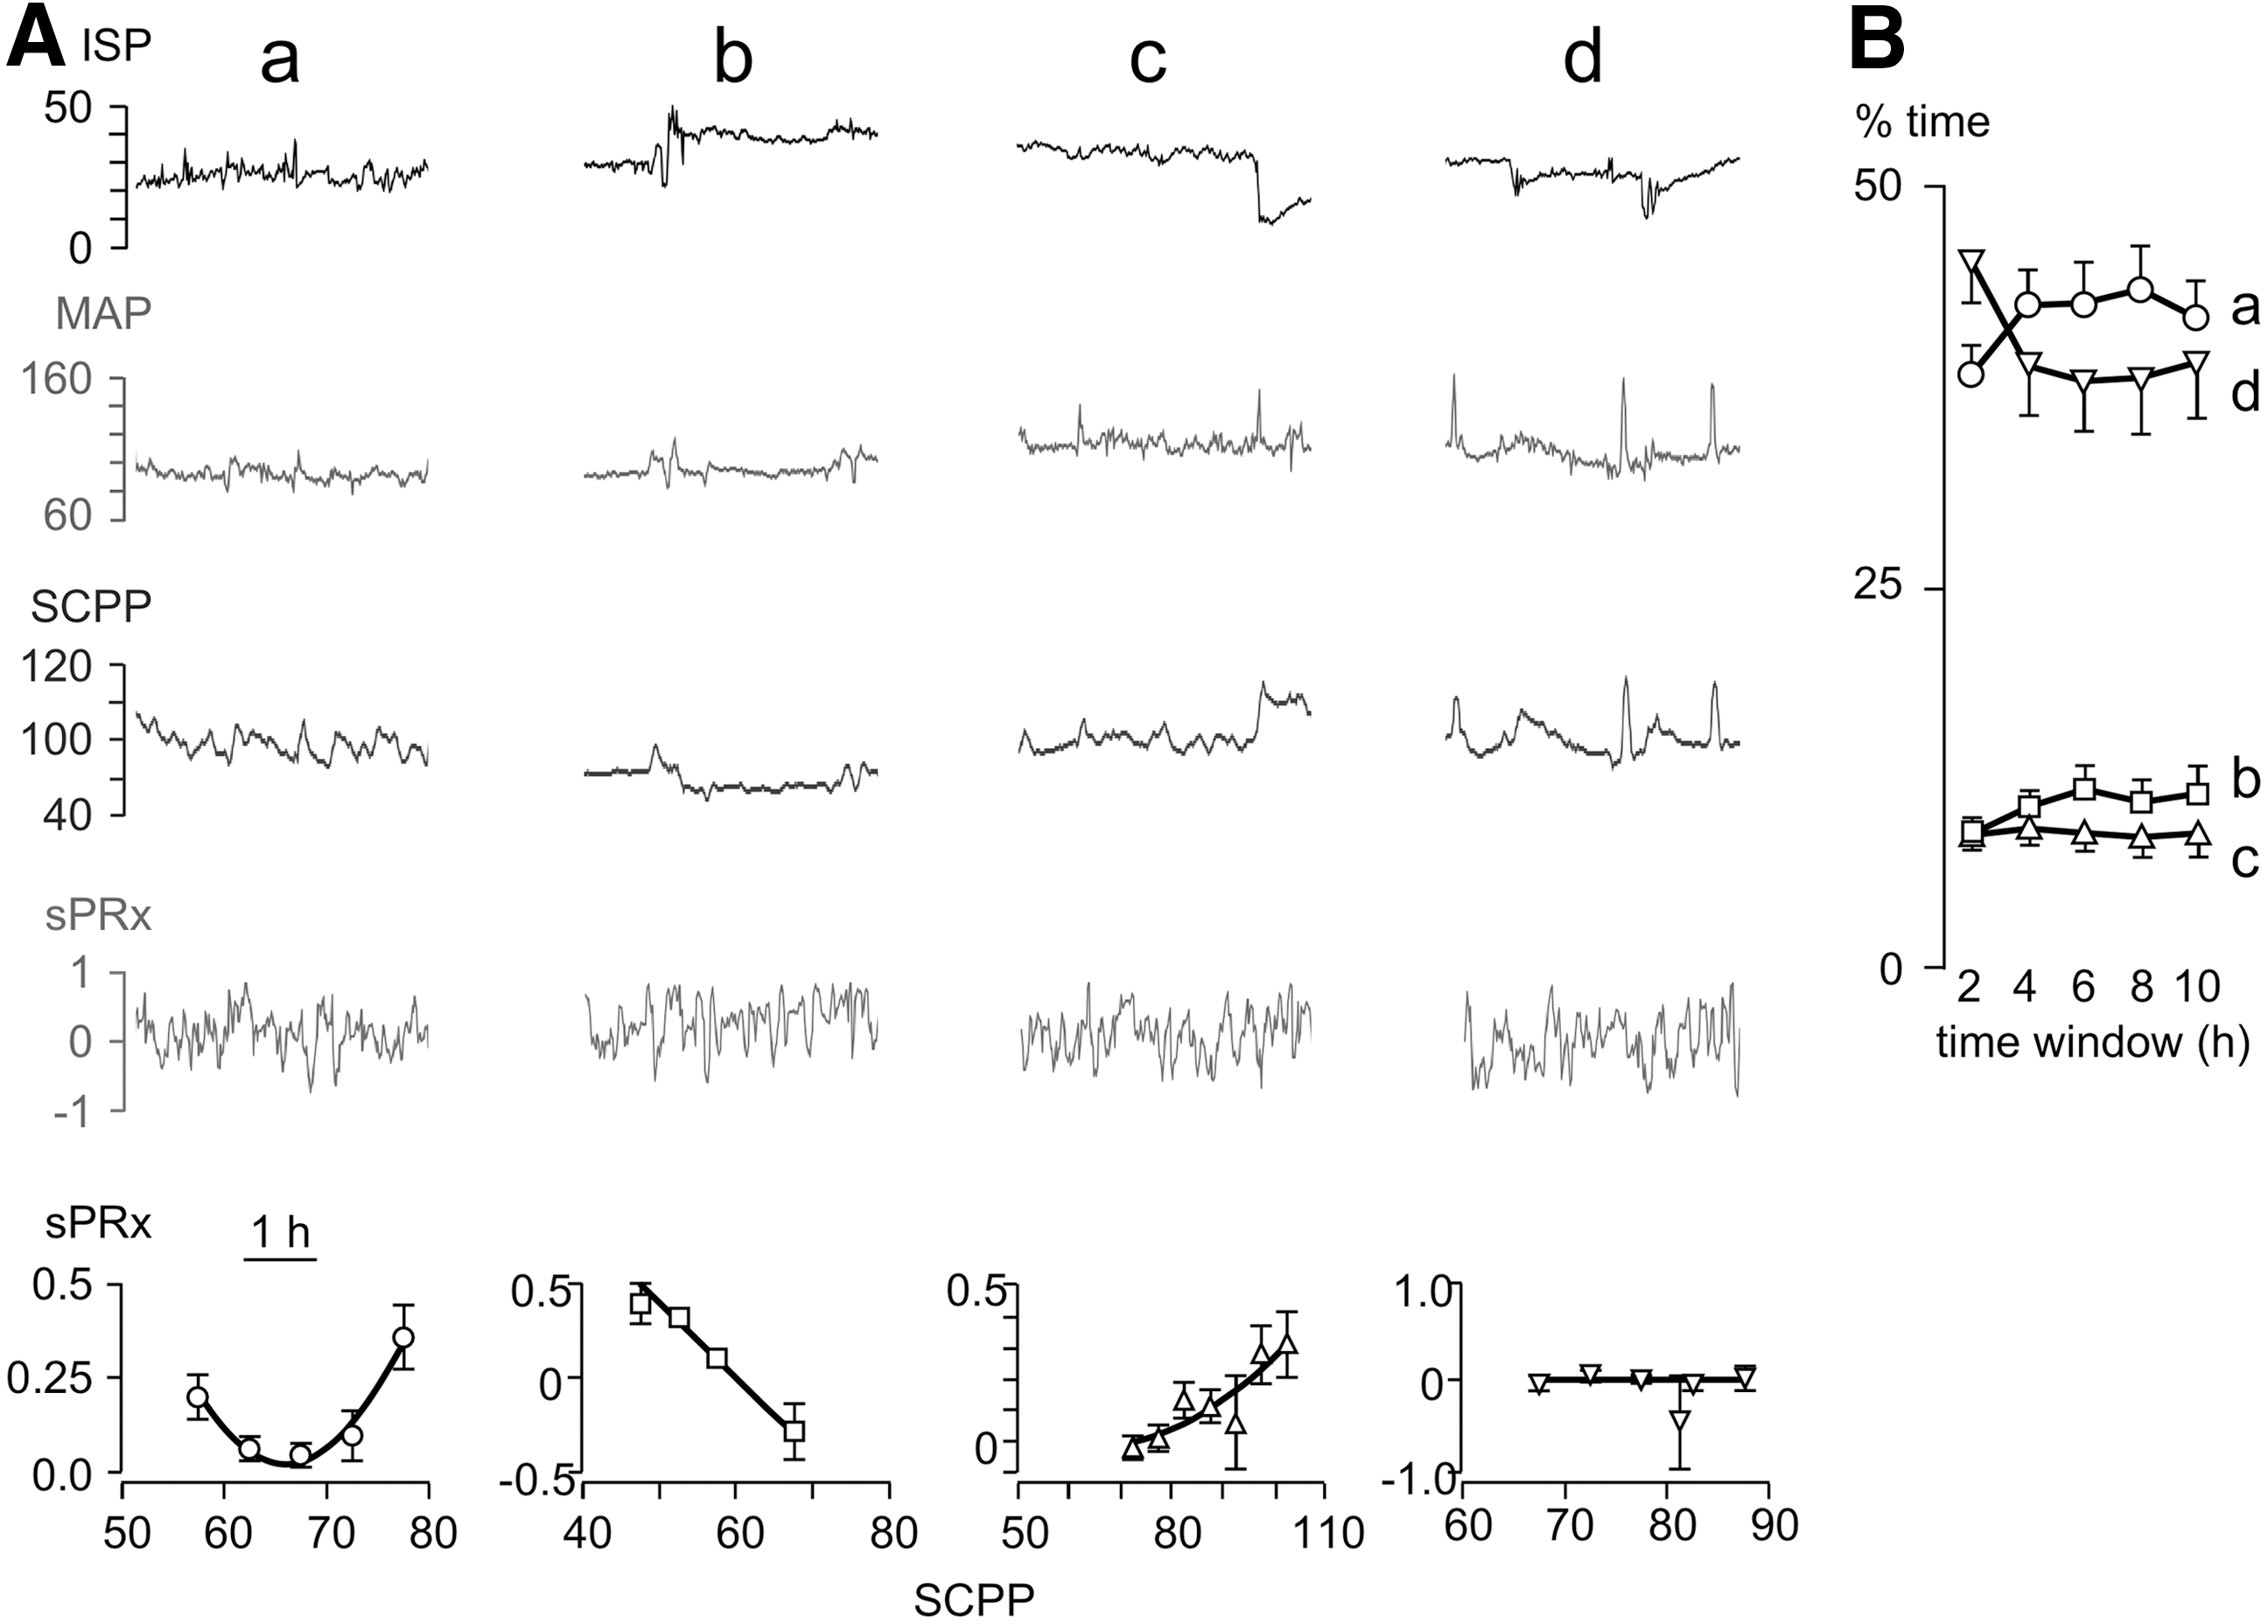
Concept of continuous optimum spinal cord perfusion pressure (cSCPPopt).
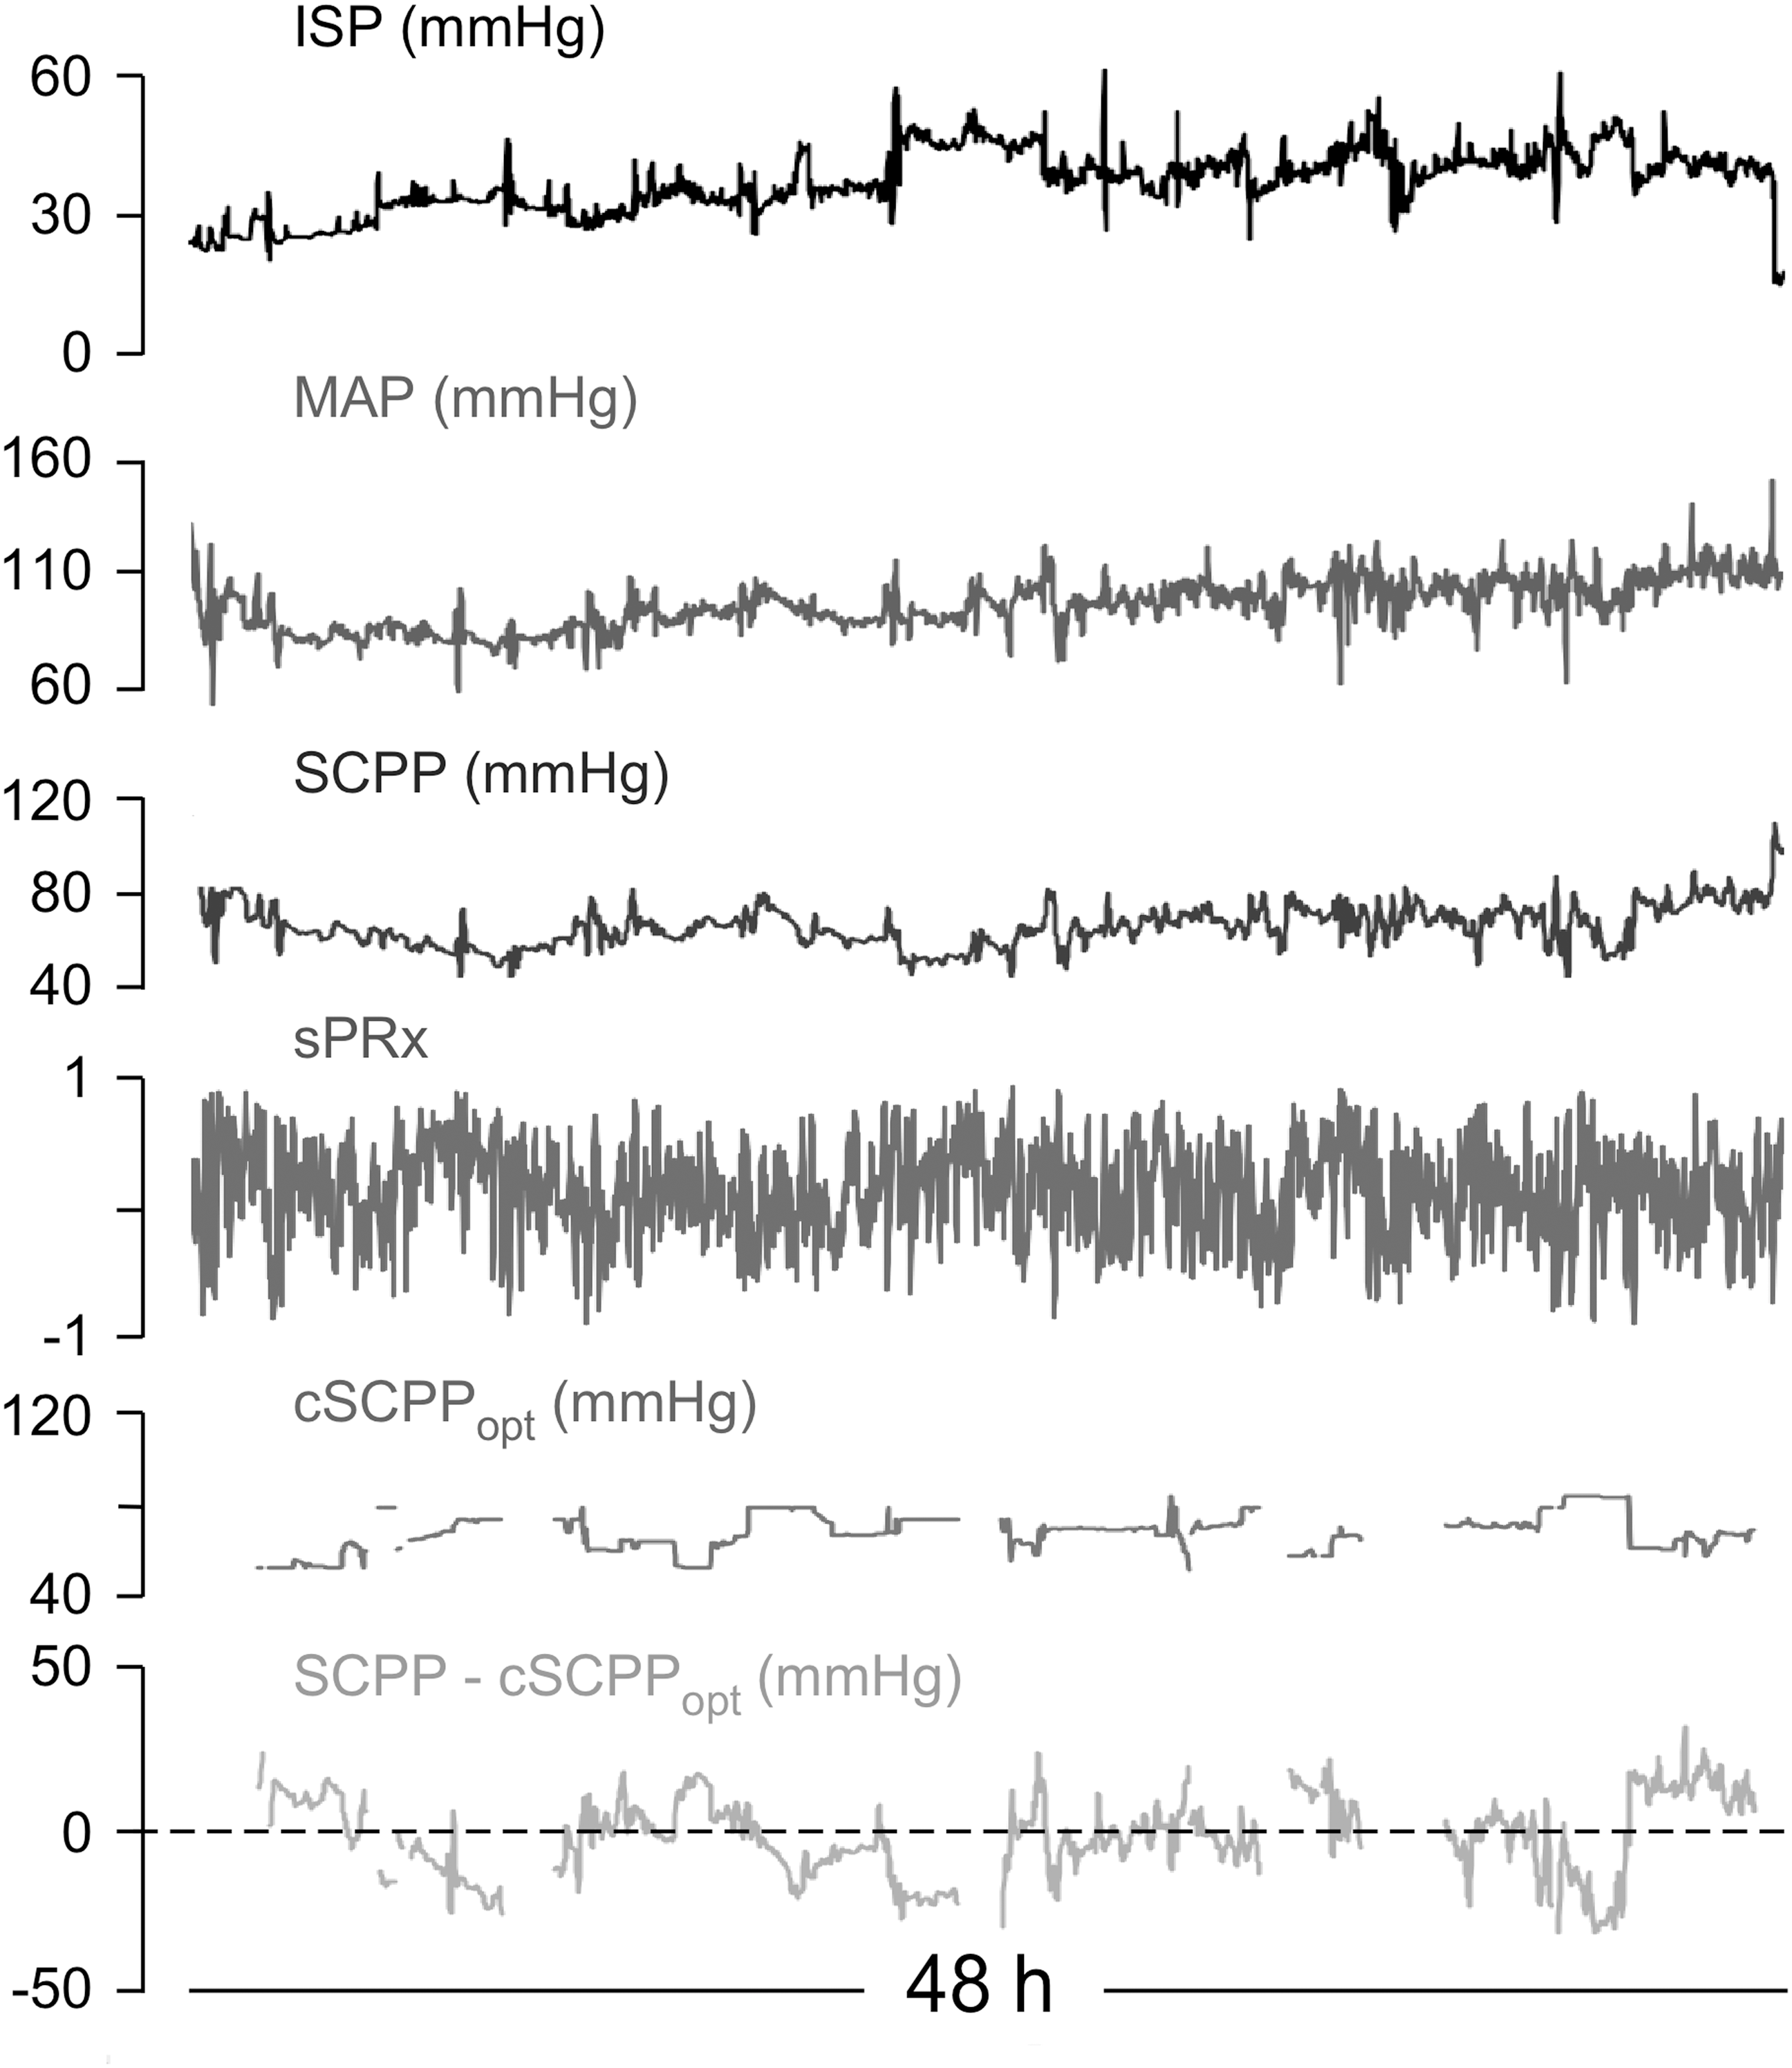
Simultaneous display of multiple signals. Simultaneously displayed intraspinal pressure (ISP), mean arterial pressure (MAP), spinal cord perfusion pressure (SCPP) and spinal vascular pressure reactivity index (sPRx), continuous optimum spinal cord perfusion pressure (cSCPPopt) and SCPP–cSCPPopt signals from one patient.
Histograms of continuous SCPPopt
We plotted each patient's cSCPPopt histogram (Fig. 4A). Distributions varied widely; some were unimodal-symmetrical with a predominant cSCPPopt peak (patient i) or a wide range of cSCPPopt values (patient ii) or bi-modal (patient iii). Left- and right-skewed unimodal distributions also were found (not shown). Figure 4B shows the standard deviations of these distributions; in most patients, the standard deviation was high at 10-15 mm Hg and in some as high as 15-20 mm Hg. The high variability in cSCPPopt suggests that a patient's SCPPopt is dynamic and therefore targeting the same SCPP is inadequate. Figure 4C shows significant positive correlation between igSCPPopt and mean cSCPPopt.
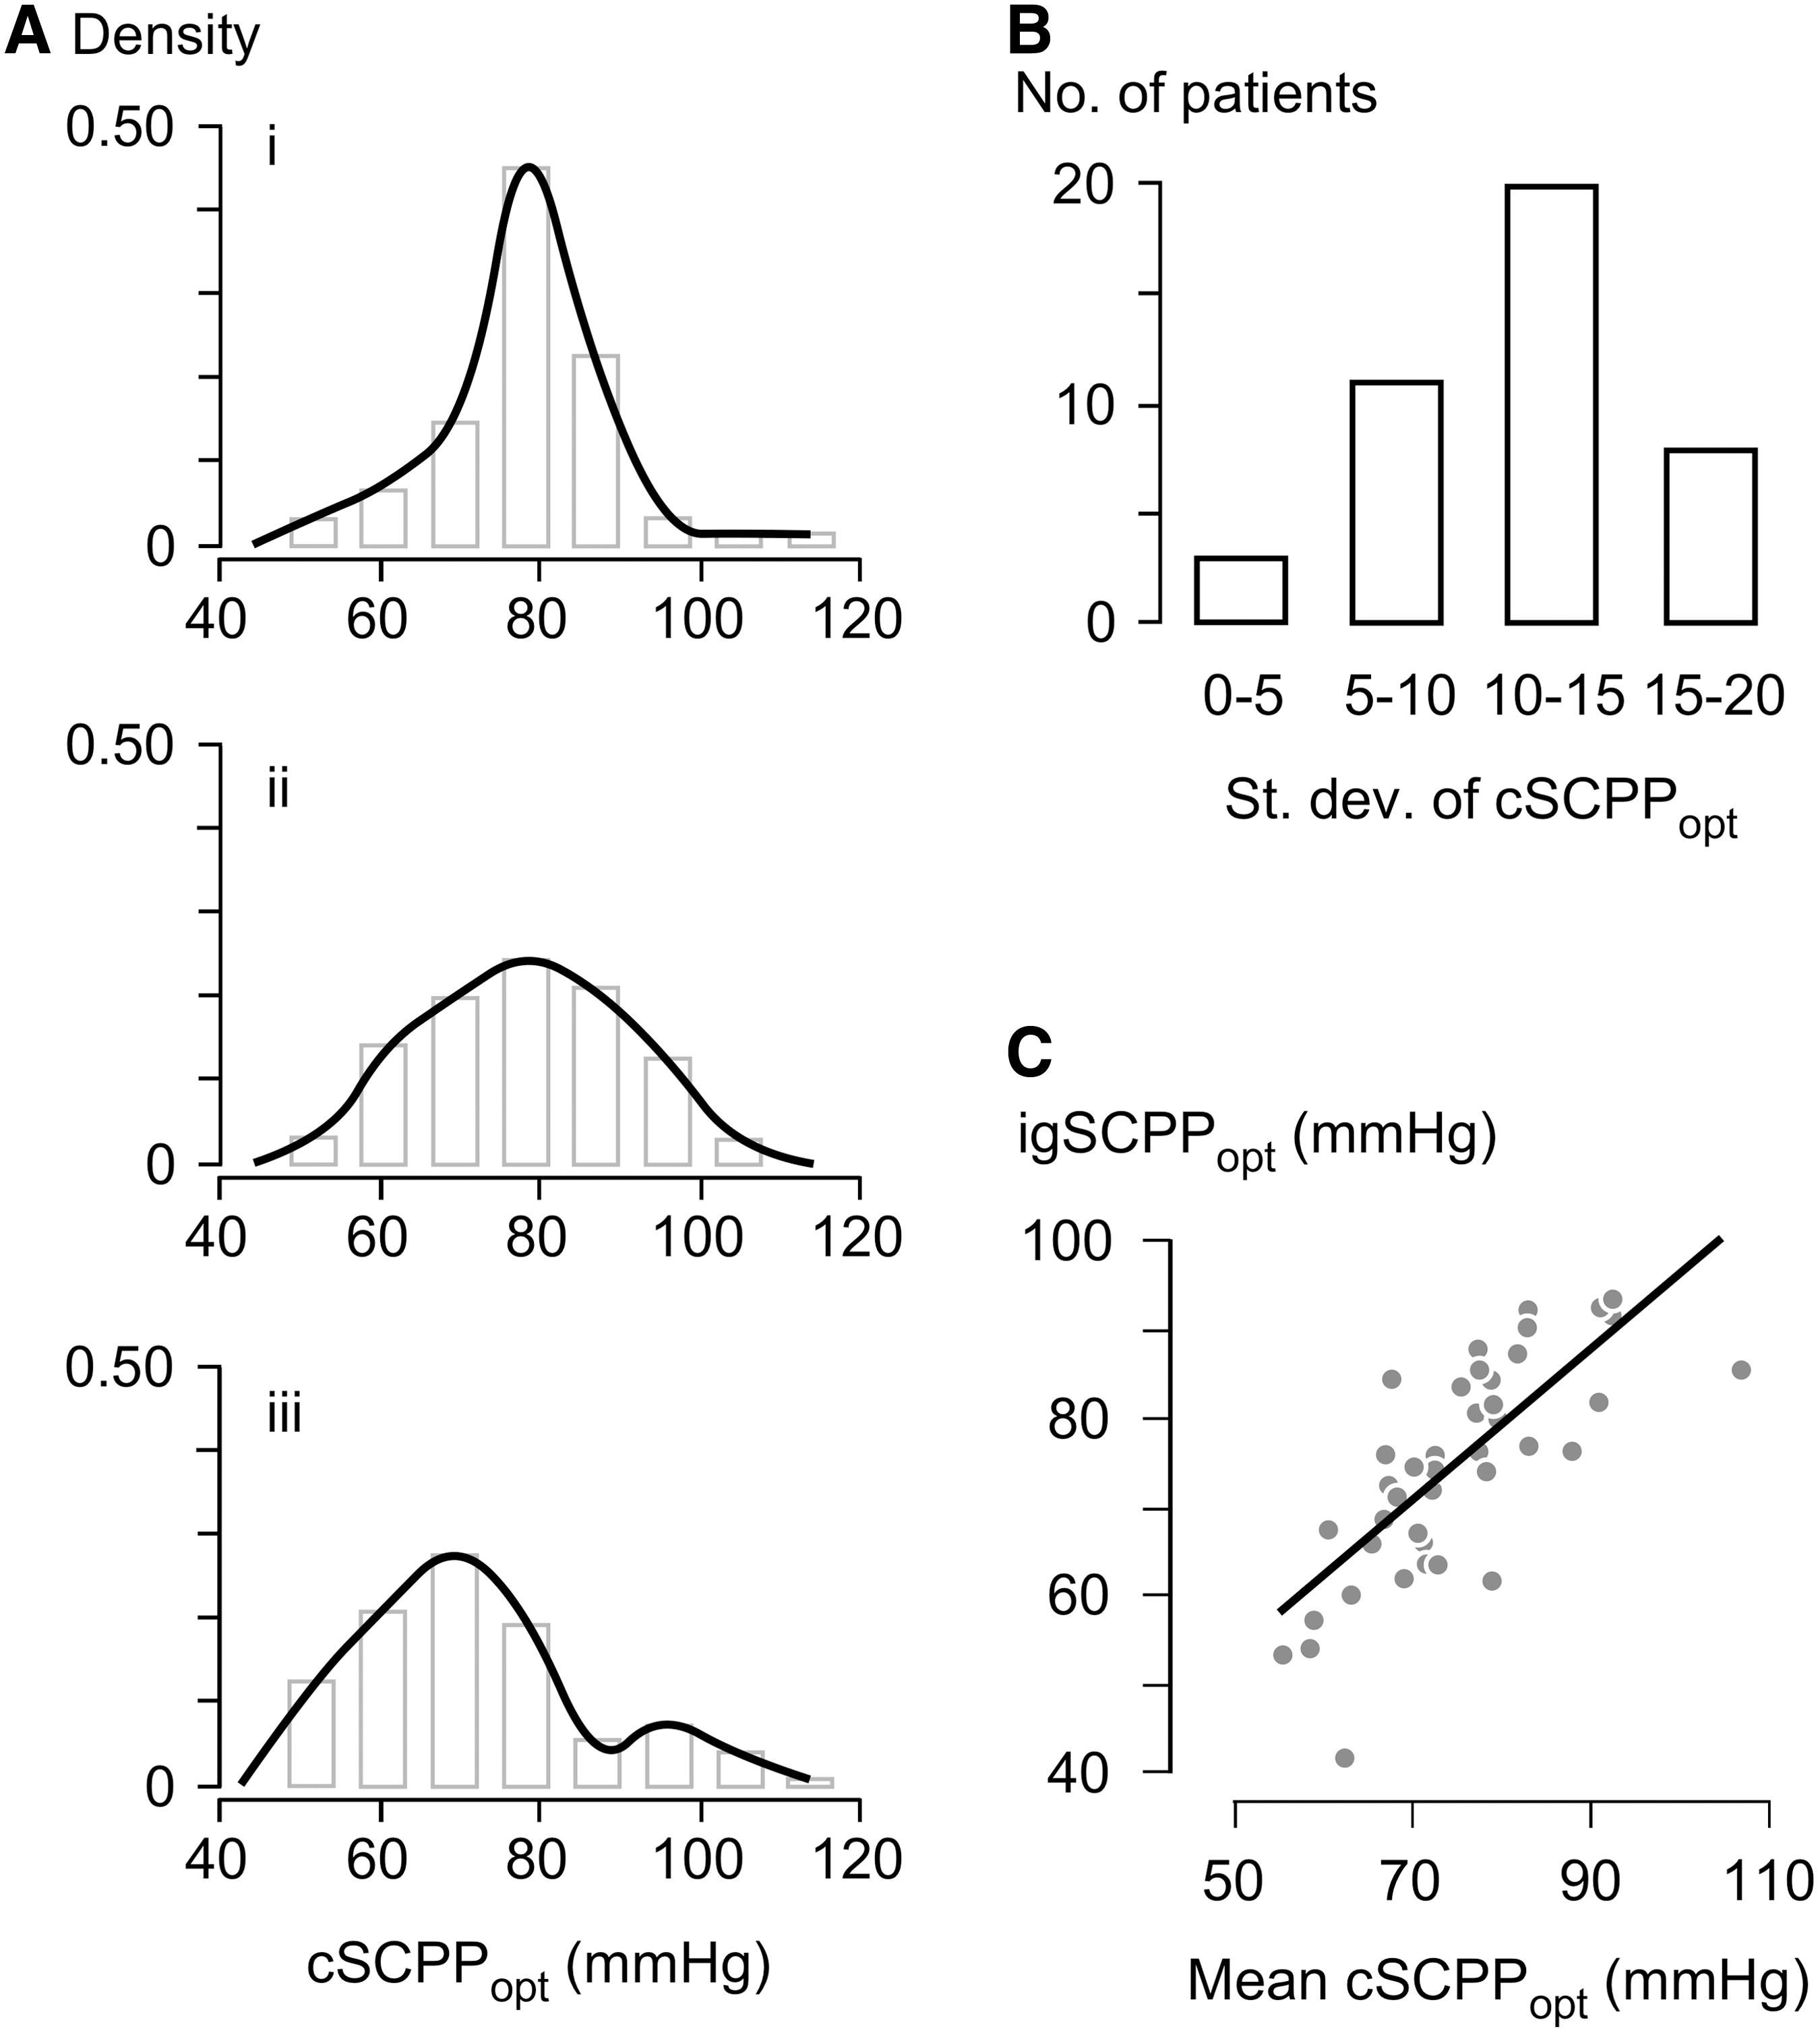
Distribution of continuous optimum spinal cord perfusion pressure (cSCPPopt) values.
Neurological outcome
We hypothesized that larger deviation of SCPP from cSCPPopt correlates with worse neurological outcome at 9–12 months. The data show that as the difference between SCPP and the cSCPPopt (averaged over each patient's entire monitoring period) decreases, the chance of ASIA grade improvement increases (Fig. 5A) and the chance of having a complete neurological deficit at follow-up (ASIA A) decreases (Fig. 5B). There are only two patients with positive mean deviation of SCPP from cSCPPopt; thus, we do not know if hyperperfusion correlates with worse neurological outcome. There was no correlation between the American Association of Neurological Surgeons' guideline of 85-95 mm Hg MAP and the chance of ASIA grade improvement (Fig. 5C) or the chance of having complete deficit (Fig. 5D) at 9–12 months.
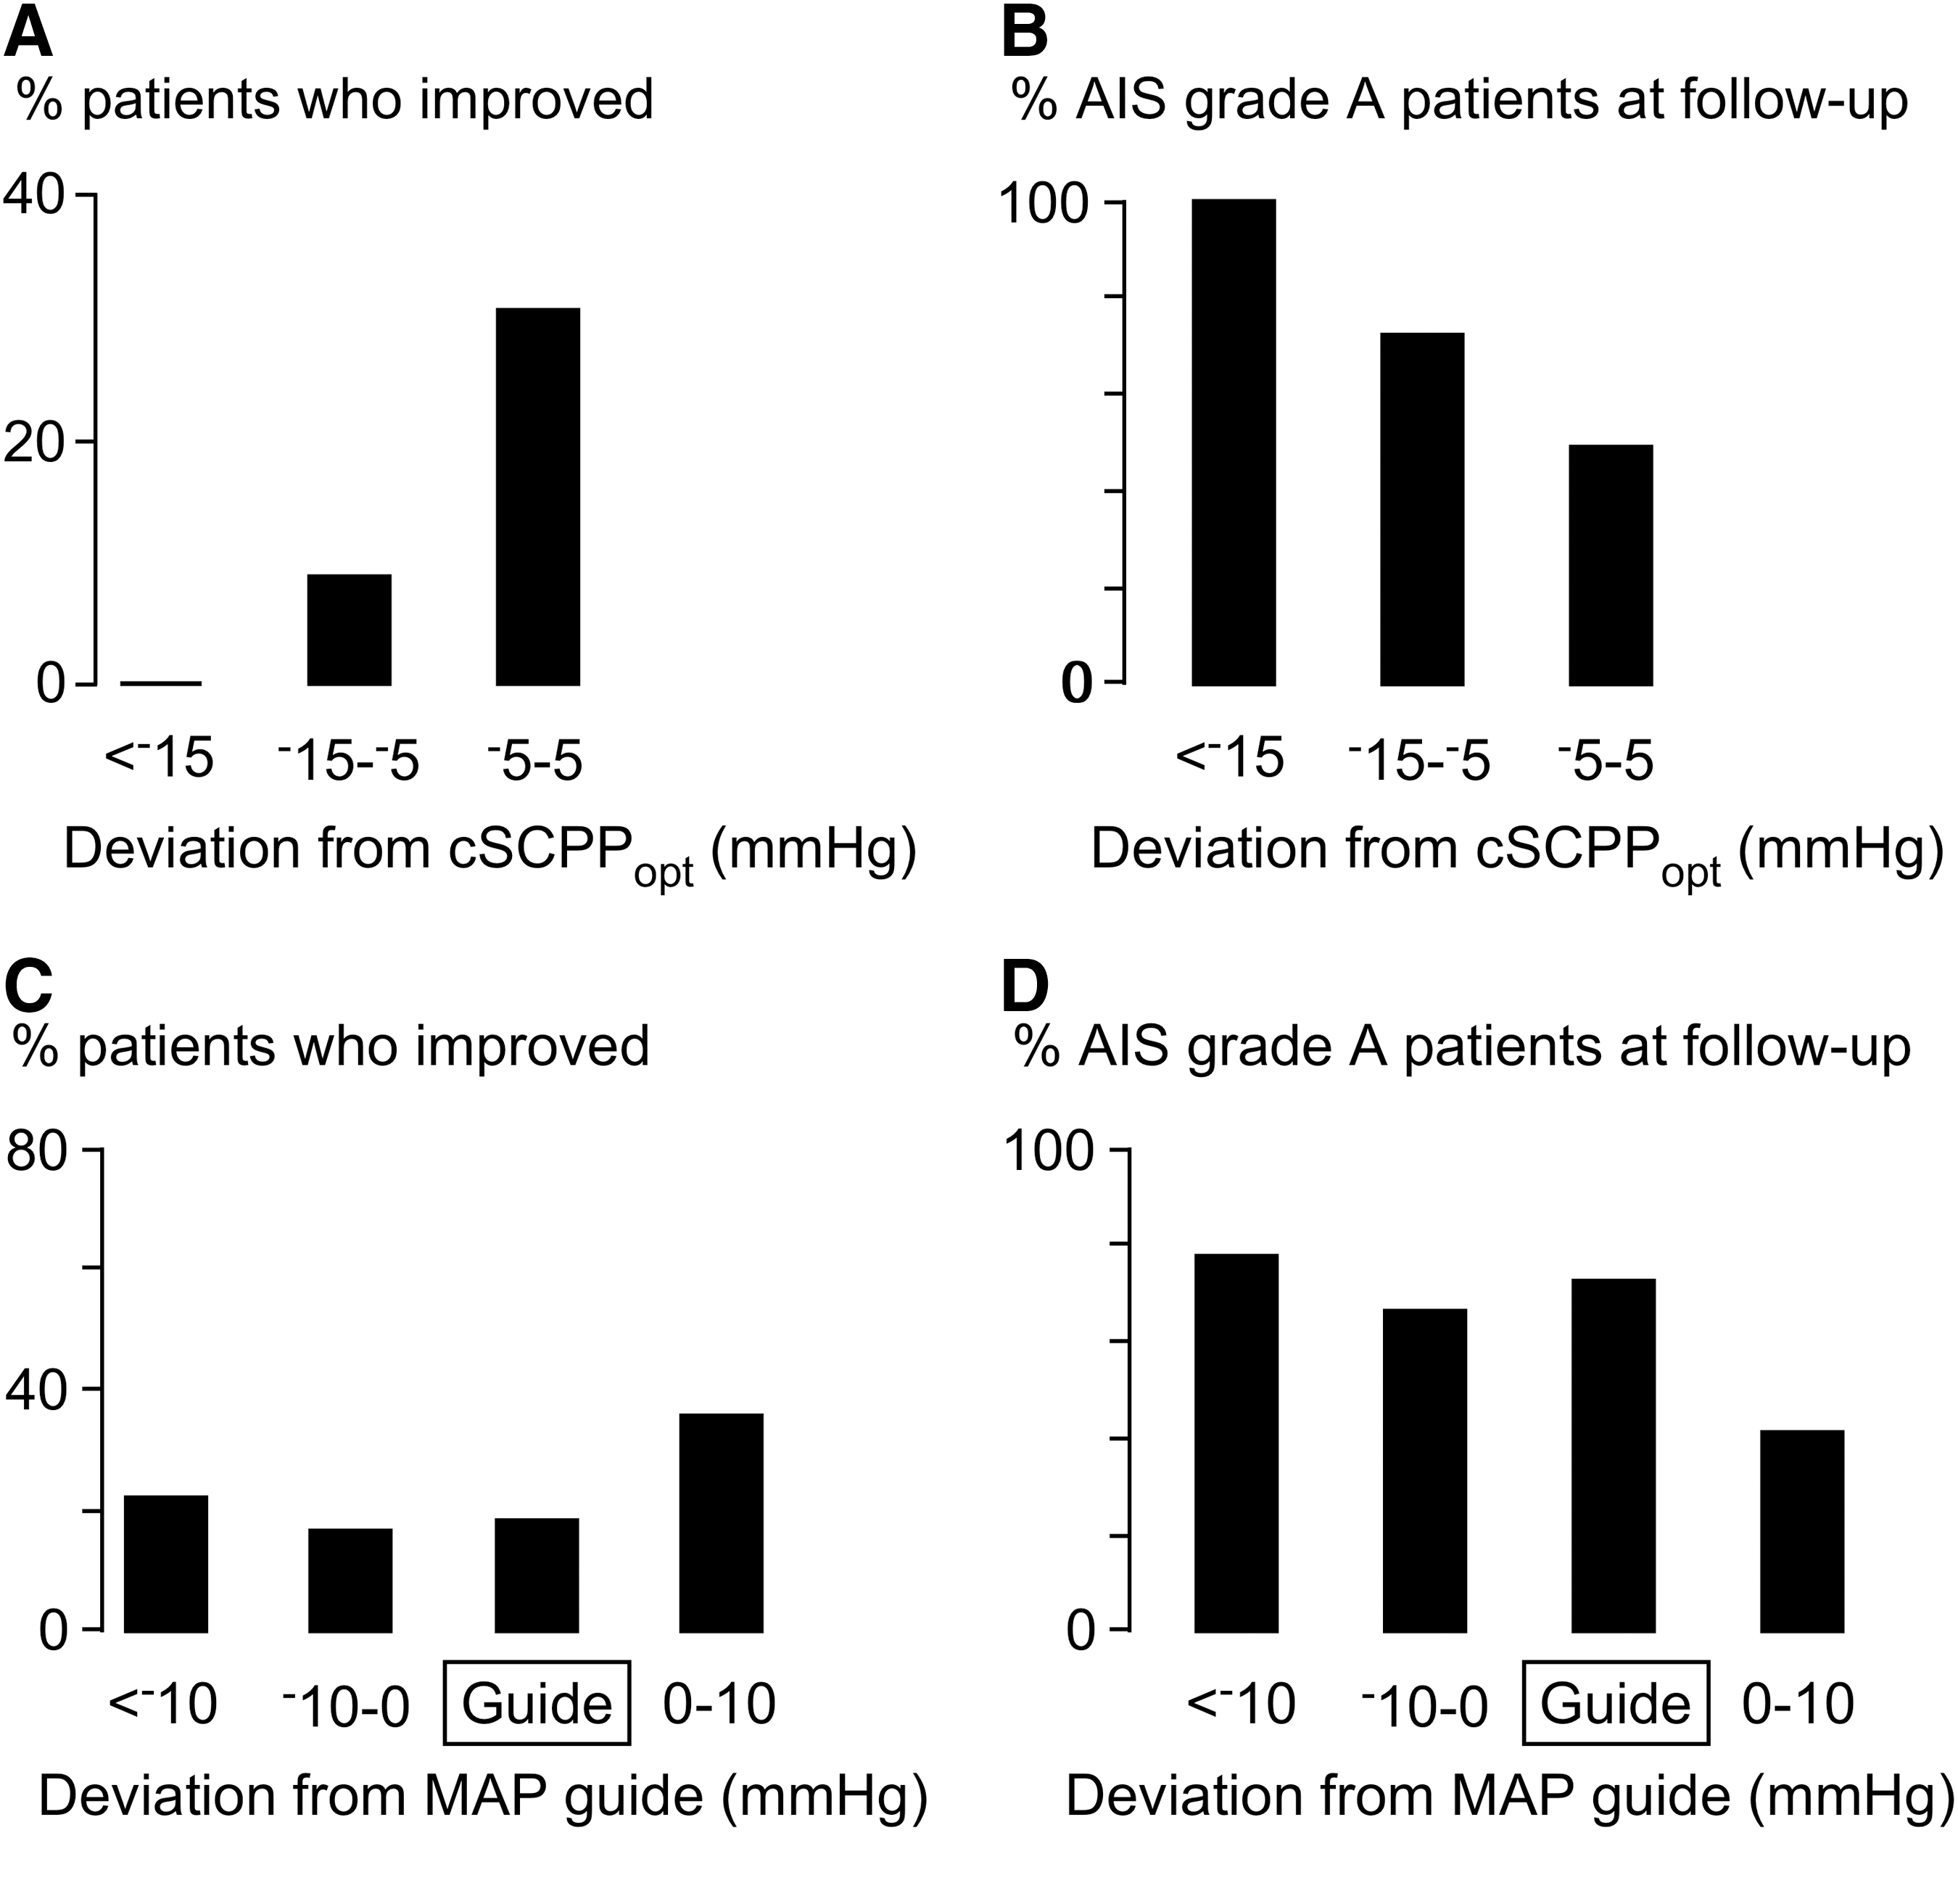
Deviation of spinal cord perfusion pressure (SCPP) from continuous optimum spinal cord perfusion pressure (cSCPPopt) vs. neurological outcome.
Enhanced visualization
Displaying cSCPPopt as a line (Fig. 3) is clinically helpful, but has drawbacks. First, it fails to show the range of cSCPPopt at any one time that is associated with intact autoregulation (i.e., sPRx ≤0); a cSCPPopt line simplistically implies that cSCPPopt at any one time is a single value rather than a range. Second, the cSCPPopt line has gaps whenever the optimum cannot be calculated. We therefore used an enhanced visualization technique recently developed to overcome these issues when monitoring in severe traumatic brain injury. 11,12 Figure 6 shows two monitoring periods from the same TSCI patient. The top trace shows a wide range (60–90 mm Hg) of cSCPPopt. Initially, the actual SCPP was within this range, but between 00:30 and 01:45 hours the injured cord was hypoperfused. After 2 days (bottom trace) the range of cSCPPopt narrowed substantially. Between 13:00 and 14:00 hours, the cSCPPopt range was narrow at around 78 mm Hg, between 14:00 and 16:00 h it was 65-85 mm Hg and, after 18:30, it narrowed again at around 85 mm Hg. The enhanced visualization technique not only displays the range of cSCPPopt values at any one time, but also fills some of the gaps in the signal.
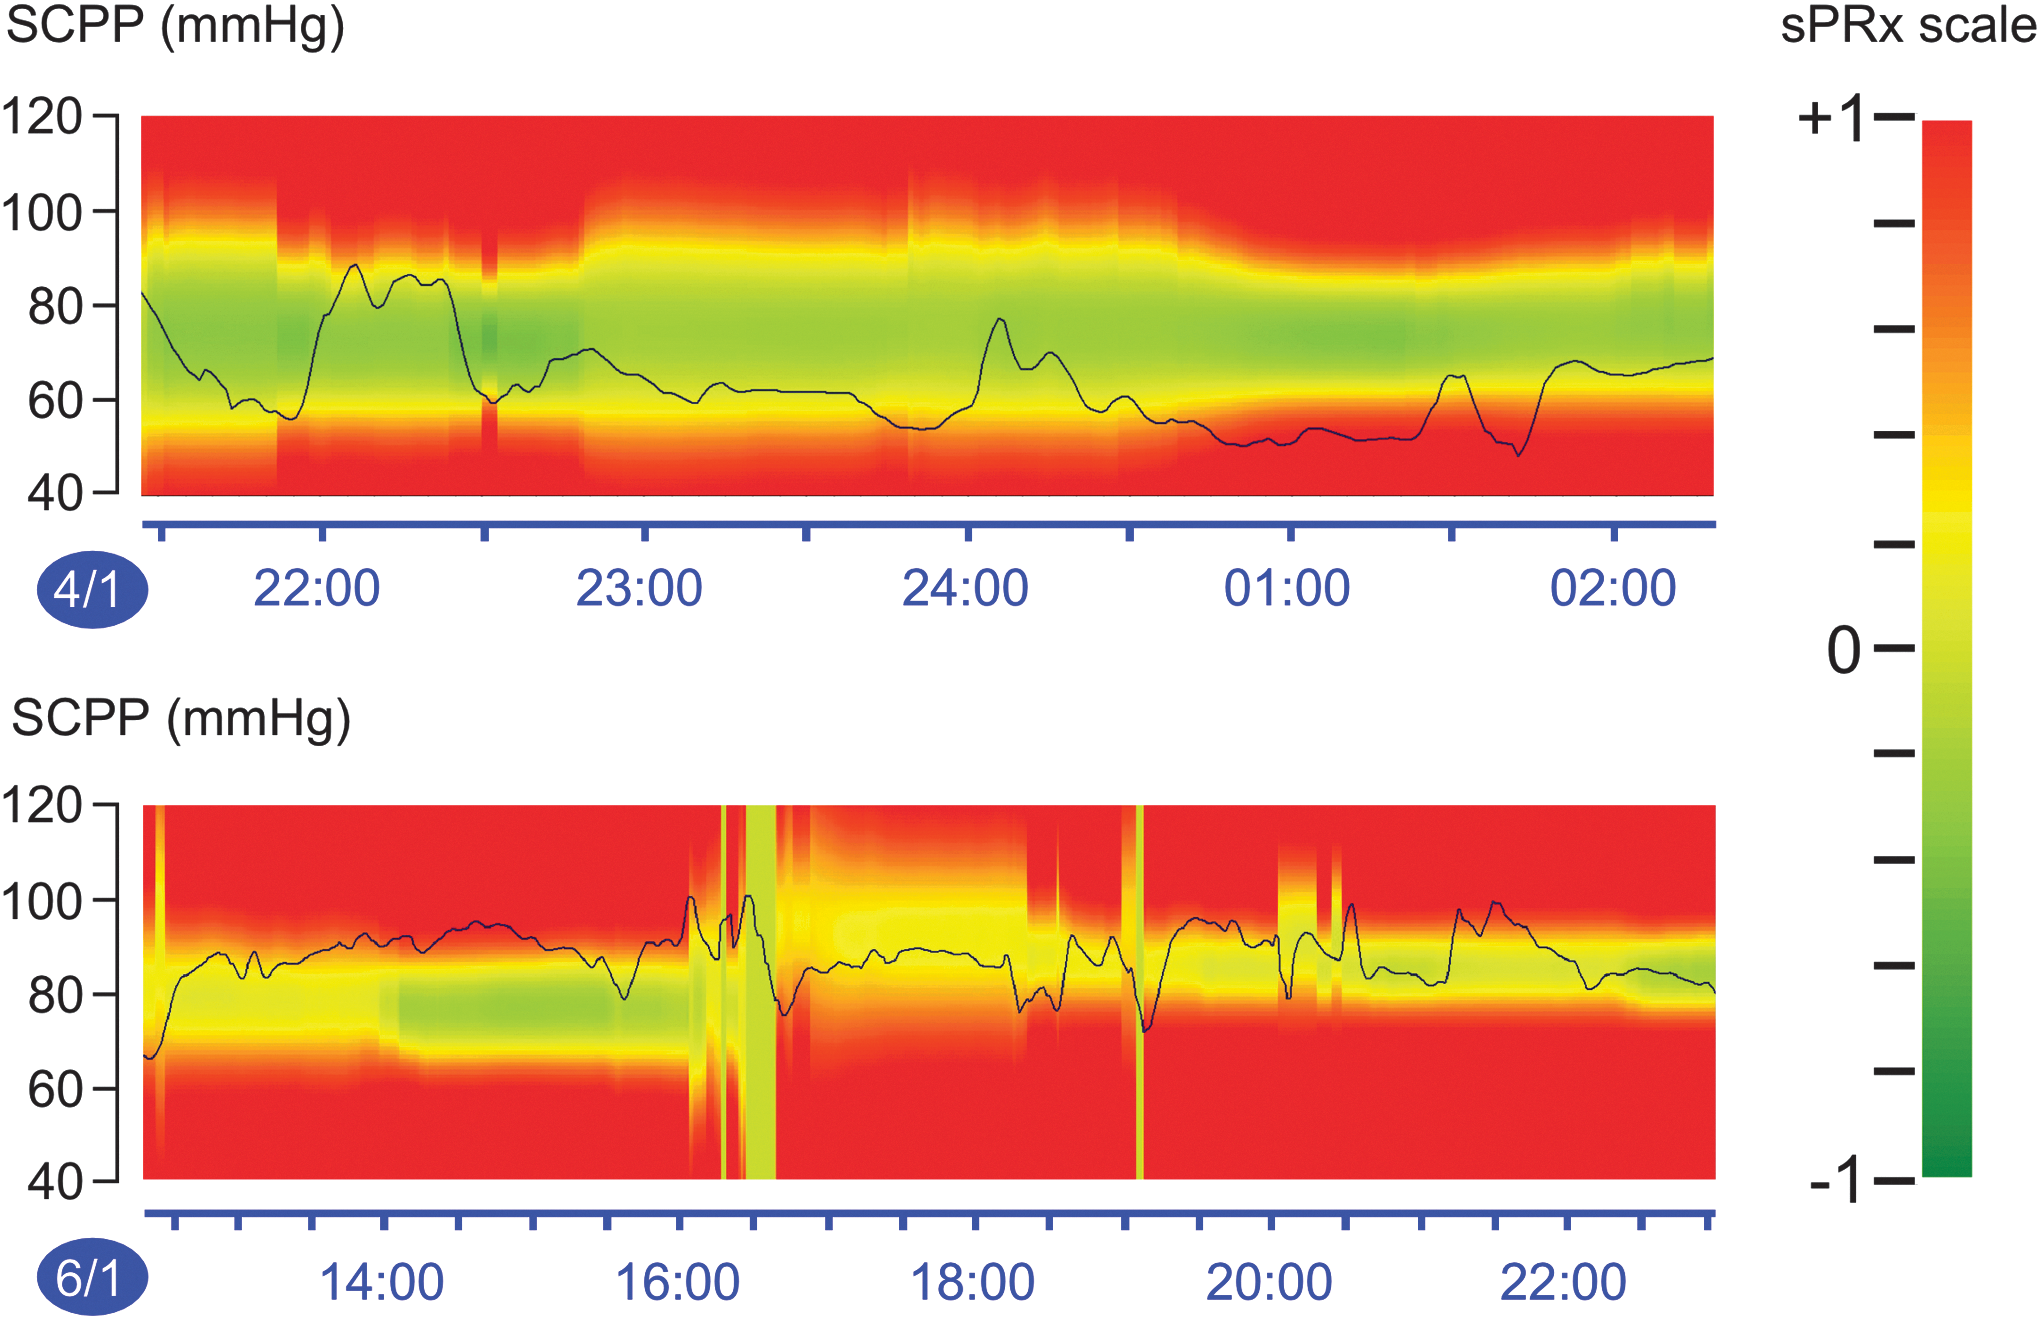
Enhanced visualization of continuous optimum spinal cord perfusion pressure. Plots of spinal cord perfusion pressure (SCPP) vs. time for two periods (Jan 4, Jan 6). Spinal vascular pressure reactivity index (sPRx) zones: red (loss of autoregulation), green (preserved autoregulation), and yellow (transition from preserved to impaired autoregulation) as per color scale. Line shows actual SCPP.
Injury site metabolism
After TSCI, injury site metabolism can be monitored using surface MD.
6
We hypothesized that small deviation of SCPP from cSCPPopt correlates with less injury site metabolic derangement. To test this, we quantified the hourly injury site metabolic state in 14 spinal cord injury patients. Figure 7 shows that hourly SCPP close to cSCPPopt is associated with low injury site glucose, high lactate, and high pyruvate. As SCPP deviates from cSCPPopt by more than 5 mm Hg, injury site glucose rises, whereas lactate and pyruvate fall. Therefore, cSCPPopt does not minimize injury site metabolic derangement, but appears to maximize glucose utilization at the injury site. There was no correlation between deviation from cSCPPopt and glutamate, glycerol, or lactate-to-pyruvate ratio (not shown). cSCPPopt was not associated with a unique metabolic profile (Supplementary Data; see online supplementary material at
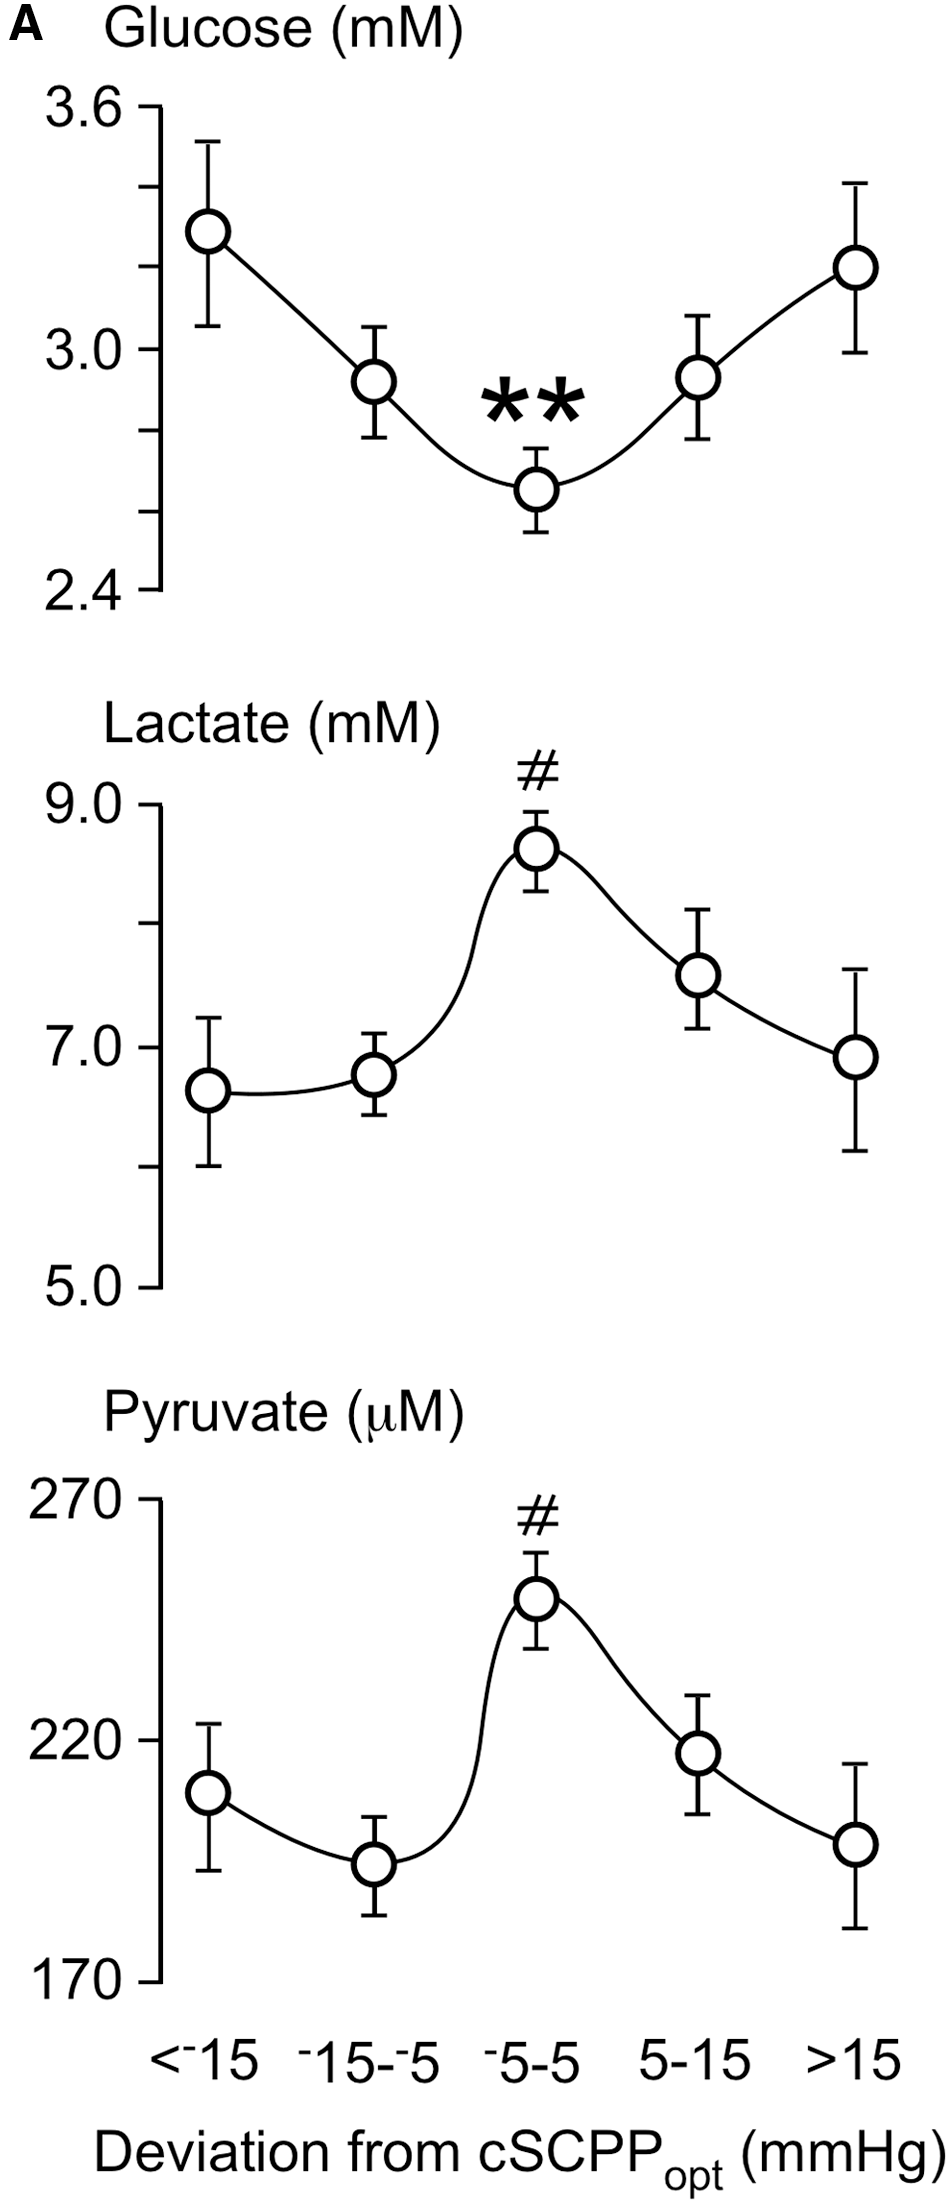
Deviation of spinal cord perfusion pressure (SCPP) from continuous optimum spinal cord perfusion pressure (cSCPPopt) vs. injury site metabolism. Glucose, lactate, and pyruvate concentration vs. mean hourly SCPP–cSCPPopt. Mean ± standard error. p < 0.05#, <0.005[[sharp]] for metabolite level at −5 to 5 mm Hg, compared with all others together.
Discussion
In this study, we introduced the novel concept of cSCPPopt, which is a range rather than an individual number. To guide the management of TSCI patients, we showed how cSCPPopt could be displayed in real time using an enhanced visualization method.
Our data show that cSCPPopt varies widely between and within patients. Various reasons may explain such wide inter-patient variability: patients with more extensive microvascular damage, pre-existing hypertension, or greater leukocyte infiltration at the injury site will likely require higher SCPP. The large intra-patient variability in cSCPPopt may be due to the dynamic nature of the pathological processes at the injury site, such as changes in the numbers of infiltrating leukocytes 13 and reactive glia, 14 as well as changes in injury site edema 15 –17 and fever. 18 Most cSCPPopt distributions are unimodal, but some are bimodal. A bimodal distribution may arise by sudden events that reset the cSCPPopt (e.g., spinal cord hemorrhage). Further studies are required to clarify the significance of the different cSCPPopt distributions. Based on our data, we suggest that targeting the same SCPP continuously in all patients is inadequate.
cSCPPopt could only be computed 45% of the time. It would be clinically useful for cSCPPopt to be computable more often. One way to achieve this may be by using a Dynamic Adaptive Target of Cerebral Autoregulation algorithm to combine different sPRx values and time windows in a weighted manner to issue a cSCPPopt recommendation. When applied to cerebral perfusion pressure obtained from TBI patients, such an algorithm produced a CPPopt recommendation 97% of the entire monitoring period. 19,20
Is actively targeting cSCPPopt safe? Our audit of 42 patients concluded that insertion of the pressure probe and ISP monitoring for up to a week are safe. 7 However, actively increasing SCPP requires vasopressors, which may produce complications such as cardiac dysrhythmias, especially in older patients. 21,22 We previously showed that after TSCI, the spinal cord swells and is compressed by the dura. 23 Thus, one way to reduce vasopressor requirements is expansion duroplasty, a simple and safe surgical procedure that lowers ISP and sPRx, as well as increasing SCPP. 8 Based on our experience thus far, SCPP monitoring is safe and helpful to guide management of TSCI patients. 24
Is targeting cSCPPopt beneficial? Our MD data suggest that cSCPPopt maximizes glucose utilization by the injured cells. The Kohonen self-organizing maps 9 show that each patient's injury site metabolic response is unique. Therefore, each patient's optimal injury site metabolic profile must also be unique, which explains why cSCPPopt is not associated with a single metabolic signature (Supplementary Data). How about neurological outcome? We found that larger deviation from cSCPPopt (hypoperfusion) is associated with worse neurological outcome at 9–12 months, though the effect of hyperperfusion on neurological outcome could not be determined. Aries and colleagues 12 showed that increased deviation from cCPPopt is associated with worse neurological outcome after brain injury. These observations suggest that targeting the continuous optimum perfusion pressure may be beneficial after central nervous system injury.
Are there ways of managing spinal cord perfusion without targeting cSCPPopt? One may follow the 85-95 mm Hg MAP guideline 3 or drain CSF with a lumbar catheter. 25 MAP-oriented management may be inadequate, evident by the lack of a strong correlation between achieving the guideline and neurological outcome as shown in Figure 6 and by others. 22,26,27 A major drawback of the MAP guideline is that it does not consider ISP; thus, the same MAP may hypoperfuse the injury site in one patient and hyperperfuse it in another. Also, the MAP guideline does not consider inter- and intra-patient variability in SCPPopt. Draining lumbar CSF is also likely inadequate because, at the injury site, the cord is not surrounded by CSF, but is compressed against dura. 5,8,23,28,29 Thus, CSF drainage is unlikely to reduce injury site ISP. Ultimately, a randomized controlled trial is required to definitively determine whether interventions to achieve cSCPPopt improve neurological outcome after TSCI.
Footnotes
Acknowledgments
This research was supported by grants awarded to MCP and SS from Wings for Life Spinal Cord Research Foundation and to MCP from the Neurosciences Research Foundation (Fletcher Fund). We thank the neurosurgeons at St. George's Hospital, King's College Hospital, and Hurstwood Park Neurological Centre as well as the spinal orthopaedic surgeons at St. George's Hospital who helped recruit patients. The neuroanaesthetic, neurointensive care, and operating theatre staff at St. George's Hospital helped with data collection.
Author Disclosure Statement
PS and MC receive royalties for ICM+ from the software licensing fee.
References
Supplementary Material
Please find the following supplemental material available below.
For Open Access articles published under a Creative Commons License, all supplemental material carries the same license as the article it is associated with.
For non-Open Access articles published, all supplemental material carries a non-exclusive license, and permission requests for re-use of supplemental material or any part of supplemental material shall be sent directly to the copyright owner as specified in the copyright notice associated with the article.
