
Abstract
We assess the relationships between various continuous measures of autoregulatory capacity in a cohort of adults with traumatic brain injury (TBI). We assessed relationships between autoregulatory indices derived from intracranial pressure (ICP: PRx, PAx, RAC), transcranial Doppler (TCD: Mx, Sx, Dx), brain tissue-oxygenation (ORx), and spatially resolved near infrared spectroscopy (NIRS resolved: TOx, THx). Relationships between indices were assessed using Pearson correlation coefficient, Friedman test, principal component analysis (PCA), agglomerative hierarchal clustering (AHC) and k-means cluster analysis (KMCA). All analytic techniques were repeated for a range of temporal resolutions of data, including minute-by-minute averages, moving means of 30 samples, and grand mean for each patient. Thirty-seven patients were studied. The PRx displayed strong association with PAx/RAC across all the analytical techniques: Pearson correlation (r = 0.682/r = 0.677, p < 0.0001), PCA, AHC, and KMCA in the grand mean data sheet. Most TCD-based indices (Mx, Dx) were correlated and co-clustered on PCA, AHC, and KMCA. The Sx was found to be more closely associated with ICP-derived indices on Pearson correlation, PCA, AHC, and KMCA. The NIRS indices displayed variable correlation with each other and with indices derived from ICP and TCD signals. Of interest, TOx and THx co-cluster with ICP-based indices on PCA and AHC. The ORx failed to display any meaningful correlations with other indices in neither of the analytical method used. Thirty-minute moving average and minute-by-minute data set displayed similar results across all the methods. The RAC, Mx, and Sx were the strongest predictors of outcome at six months. Continuously updating autoregulatory indices are not all correlated with one another. Caution must be advised when utilizing less commonly described autoregulation indices (i.e., ORx) for the clinical assessment of autoregulatory capacity, because they appear to not be related to commonly measured/establish indices, such as PRx. Further prospective validation is required.
Introduction
T
Pressure reactivity index (PRx, which measures the strength of correlation between ICP and MAP) and transcranial Doppler (TCD), derived mean velocity index (Mx) (which measures the strength of correlation between mean CBFV and CPP), are two of the more commonly quoted indices of continuous autoregulatory assessment in critically ill patients with TBI treated on intensive care units (ICU). 2 –4 These two indices are moderately correlated with each other 5,6 and in several publications have shown replicable associations with patient morbidity and mortality. 5 –14 Further, the identification of critical thresholds for these variables that are associated with worse outcome 15,16 provide potential targets for ICU therapies that could improve autoregulatory capacity or (more practically) target patient-specific CPP ranges based on optimal values of these variables in individuals. 17
Numerous other indices have been described, however, including those derived from near infrared spectroscopy (NIRS) 18 –20 and brain tissue oxygen monitors (PbtO2). 21 –23 The literature on these “other” continuous indices is limited, and their association with patient outcome is unclear. Further, their correlation with better established autoregulatory indices, such as PRx, is poorly understood outside of animal models. Studies that assess such correlations between autoregulatory indices are difficult: they are labor intensive and require concurrent placement of several invasive and non-invasive monitors to capture signals for data processing. Consequently, such studies are rare—most published examples compare a single index to outcome, or examine the correlation between two indices. This limited literature does not allow the treating ICU clinician to choose indices for monitoring, cross-calibrate indices against each other, and/or have an integrated view of the strength of their association with clinical outcome.
The goal of our study was to use an existing patient dataset, where multiple monitoring devices (ICP, arterial blood pressure [ABP], TCD, NIRS, and PbtiO2) had been applied, to assess the relationship between a range of indices of autoregulatory function. We also wished to examine which of these indices were best correlated with clinical outcome.
Methods
Patient population
The patients included in this study represent a sub-population of a cohort that provide the substrate for previous studies 18,24,25 that assessed specific NIRS-based autoregulatory indices and their association with PRx. A review of this dataset revealed that it contained raw monitoring signals that permitted the measurement of additional indices of autoregulatory capacity. The majority of patients in this cohort had the following monitoring: ICP, CPP, MAP, NIRS, bilateral TCD of the middle cerebral artery (MCA), and PbtO2. Thus, this population provided us the largest number of monitoring devices, and hence allowed assessment of relationships between the largest range of autoregulatory indices.
This study was conducted as a retrospective analysis of a prospectively maintained database cohort in which two separate sets of recordings were analyzed. Long recordings spanned several hours in each case but did not include TCD monitoring; and short recordings (∼1–2 h in duration) were made in which TCD was available.
All patients had mild to severe TBI and were admitted to the Neurosciences Critical Care Unit (NCCU) at Addenbrooke's Hospital, Cambridge. Those with mild and moderate TBI displayed progressive deterioration in clinical status, necessitating MMM via a combination of invasive and noninvasive techniques. Treatment received during the recording periods included standard ICP-directed therapy, with an ICP goal of less than 20 mm Hg and CPP goal of greater than 60 mm Hg.
The study was approved by the research ethics committee (29 REC 97/291). Monitoring of above brain modalities was conducted as a part of standard NCCU patient care using an anonymized database of physiological monitoring variables in neurocritical care. Data on age, injury severity, and clinical status at hospital discharge were recorded at the time of monitoring on this database, and no attempt was made to re-access clinical records for additional information. Because all data were extracted from the hospital records and fully anonymized, no data on patient identifiers were available, and formal patient or proxy consent was not sought.
Signal acquisition
Various signals were obtained through a combination of invasive and noninvasive methods. The ABP was obtained through either radial or femoral arterial lines connected to pressure transducers (Baxter Healthcare Corp. CardioVascular Group, Irvine, CA). The ICP was acquired via an intraparenchymal strain gauge probe (Codman ICP MicroSensor; Codman & Shurtleff Inc., Raynham, MA). The NIRS signals were recorded bilaterally over the frontal lobes using the NIRO 200 monitoring. The following NIRS signals were recorded: oxygenated hemoglobin (HbO), deoxygenated hemoglobin (HHb), total oxygenation index (TOI), total hemoglobin index (THI) and total hemoglobin concentration (Hb).
The PbtO2 monitoring occurred via invasive parenchymal monitoring (Licox probe; Integra, Licox Brain Oxygen Monitoring System, Plainboro, NJ), typically placed in the right frontal lobe, a triple lumen bolt (Technicam Ltd).
Finally, TCD assessment of MCA CBFV was conducted via Doppler Box (DWL Compumedics, Singen, Germany) or Neuroguard (Medasonic, Fremont, CA). Two separate recording sessions were obtained for each patient with TCD, lasting ∼60 min each. Bilateral MCA recordings were obtained in every patient during these sessions. As mentioned above, TCD recordings were only present in the short recording data set.
Signal processing
All recorded signals were recorded using digital data transfer or digitized via A/D converters (DT9801; Data Translation, Marlboro, MA), where appropriate, sampled at frequency of 50 Hertz (Hz) or higher, using intensive care monitoring (ICM+) software (Cambridge Enterprise Ltd, Cambridge, UK,
Post-acquisition processing of the above signals was conducted using ICM+ software. The CPP was determined using the formula: CPP = MAP – ICP. Of note, the data recorded from the left TCD had a large amount of artifact, impeding our ability to include it in the majority of patients. Consequently, we excluded the left TCD signals for the short recordings analysis. Given that left-sided TCD recordings were discarded, we therefore only report the right-sided NIRS-based indices as well.
Systolic ABP (ABPs) was determined by calculating the maximum ABP over a 1.5 sec window, updated every second. Similarly, diastolic ABP (ABPd) was determined by calculating the minimum ABP over a 1.5 sec window, updated every second. Systolic flow velocity (FVs) was determined by calculating the maximum flow velocity (FV) over a 1.5 sec window, updated every second. Diastolic flow velocity (FVd) was calculated using the minimum FV over a 1.5 sec window, updated every second. Mean flow velocity (FVm) was calculated using average FV over a 10 sec window, updated every 10 sec (i.e., without data overlap). Pulse amplitude of ICP (AMP) was determined by calculating the fundamental Fourier amplitude of the ICP pulse waveforms over a 10 sec window, updated every 10 sec.
Ten second moving averages (updated every 10 sec to avoid data overlap) were calculated for all recorded signals: ICP, ABP (which produced MAP), ABPs, ABPd, CPP, FVm, FVs, FVd, TOI, and THI. For the PbtO2 signal, 30 sec means were calculated, as described previously by Jaeger and associates. 21
Autoregulation indices were derived in a similar fashion across modalities; an example is provided for PRx: a moving Pearson correlation coefficient was calculated between ICP and MAP using 30 consecutive 10 sec windows (i.e., 5 min of data), updated every minute. Details on each index calculation can be found in Table 1.
sec, seconds; min, minute; ICP, intracranial pressure; MAP, mean arterial pressure; AMP, pulse amplitude; CPP, cerebral perfusion pressure; FVm, mean flow velocity; FVs, systolic flow velocity; TOI, total oxygenation index; THI, total hemoglobin index; PbtO2, brain tissue oxygenation.
Data for this analysis were provided in the form of minute-by-minute time trends of the parameters of interest for each patient. This was extracted from ICM+ into comma separated values (CSV) datasets, which were collated into one continuous data sheet (compiled from all patients). We then determined 30 min moving averages (nonoverlapping) for every index, and individual patient grand means for each index. The statistical analysis was performed on all three data sheets for each data sheet: minute-by-minute, 30 min moving averaged, and grand means.
Three separate data sheets were employed given the currently unknown autocorrelative structure within each of these physiological indices. Further, given that PbtO2-based indices are typically calculated over varying window lengths (such as 30 min or longer), which are longer than all other ICP/TCD/NIRS-based indices, we wanted to make sure that there was no difference in the results of our analysis based on the calculation windows and averaging process of the data.
Statistics
General statistics
Statistics were performed utilizing XLSTAT (Addinsoft, New York, United States;
Tests for normality were performed using the Shapiro-Wilks test for all indices and measured variables. All indices and variables were determined to be nonparametric in nature. Alpha was set at 0.05 for all results describing a p value.
All statistical tests were performed on each of these data sheets, resulting in three sets of results.
We used a Pearson correlation coefficient matrix to assess correlation between the various indices, which was conducted after performing a Fisher transformation to the data set (which normalizes the correlation coefficient distribution). This was the only test in which transformed data was utilized within the analysis.
Grouped variance between different combinations of indices was assessed using the Friedman test with and without multiple comparisons to account for within subject variation. The main assumption for the use of this test was that all indices were measuring the same physiological variable (i.e., autoregulation). The Friedman test was performed on the following combinations of data: all indices, ICP-derived indices (PRx, PAx, RAC), PbtO2-derived indices (ORx-5, ORx-30, ORx-60), NIRS-derived indices (THx, TOx, THx_a, TOx_a), and, in the short recordings, TCD-derived indices (Mx, Sx, Dx, Mx_a, Sx_a, Dx_a). The results for both the with and without multiple comparisons were identical; hence, only the Friedman test with multiple comparisons is mentioned within the Results section.
Multi-variate clustering and assessment of co-variance
Finally, multi-variate statistics were performed to delineate further the associations between the various indices. Currently, it is unclear as to which multi-variate clustering technique is superior within the exploration of time series-based physiologic variables; thus, we chose to employ an array of testing techniques. Three different multi-variate methods were employed to assess the co-variance within various combinations of indices. This was done so as to be comprehensive and to provide confirmation of the potential clustering seen in any individual given test.
First, principal component analysis (PCA) was performed using a Spearman type PCA, chosen to account for the nonparametric data distribution in the dataset (with significance set at p < 0.05). The PCA has been described in detail in other publications and is suited ideally as an “exploratory” statistic for small patient cohorts with large numbers of variables. 26 –28 The purpose of PCA is to highlight which combinations of variables explain the overall variance within the entire dataset, and thus which variables may be related and of further interest to study via other methods. We refer the readers to cited publications on PCA for more information. 26 –28
Second and third, agglomerative hierarchal clustering (AHC) and k-means cluster analysis (KMCA) (using Euclidean distance) were also performed. These tests provide an overall assessment of the similarity between variables, grouping them into clusters (or stems on a dendrogram, as seen within AHC) based on the mean distance away from one another, as assessed by Euclidean distance.
For the AHC, the statistical strength of the correlation between the clusters produced in the dendrograms was quantified using cophenetic correlation coefficients. Cophenetic correlations coefficients were produced by the Spearman correlation between the original Euclidean distance matrix calculated for the ACH and the cophenetic distance matrix. The cophenetic distance is defined as the distance between two clusters that contain two indices individually and the point where both clusters are merged (i.e., it represents the height on the dendrogram at which the branch points occur). The cophenetic correlation coefficient is believe to be an estimate of how well the AHC dendrogram maintains pairwise distances when compared with the original data set (i.e., the baseline distance matrix between variables).
With the KMCA, the number of clusters can be set by the investigator. We utilized the “elbow method” of KMCA to determine the appropriate number of clusters for the final analysis. The elbow method consists of computing all possible k-means clusters. Subsequently, a plot of the within-group sum of squares versus cluster number allowed selection of an inflection point (or “elbow”) at which the plot showed the most dramatic slope change. This is deemed the “most appropriate” cluster number for the final analysis.
Outcome analysis—logistic regression
Finally, a binary univariate logistic regression analysis was performed, comparing each index to dichotomized outcome. Outcome was assessed by the Glasgow Outcome Scale (GOS) at six months post-injury. The patient outcomes were dichotomized into: “Good Outcome” (GOS of four or five) and “Poor Outcome” (GOS of three or less). We also assessed the association of each index to mortality.
Results
Patient demographics
The median age of the patients within this previously described retrospective TBI cohort was 33 years (range: 16–76 years), with a median admission GCS of seven (range: three to 14). Three patients underwent surgical evacuation of mass lesions on admission to the hospital. For further details on the patient population, we refer the readers to previous publications focused on the clinical characteristics of this cohort. 18,24,25 After removal of those patients without PbtO2 monitoring, there were a total of 37 patients included in the final analysis. An example of the various signal and autoregulatory index changes during a plateau wave from one of the patient datasets can be seen in Figure 1, while the co-variation of these signals and indices during systemic hypertension can be seen in Figure 2.
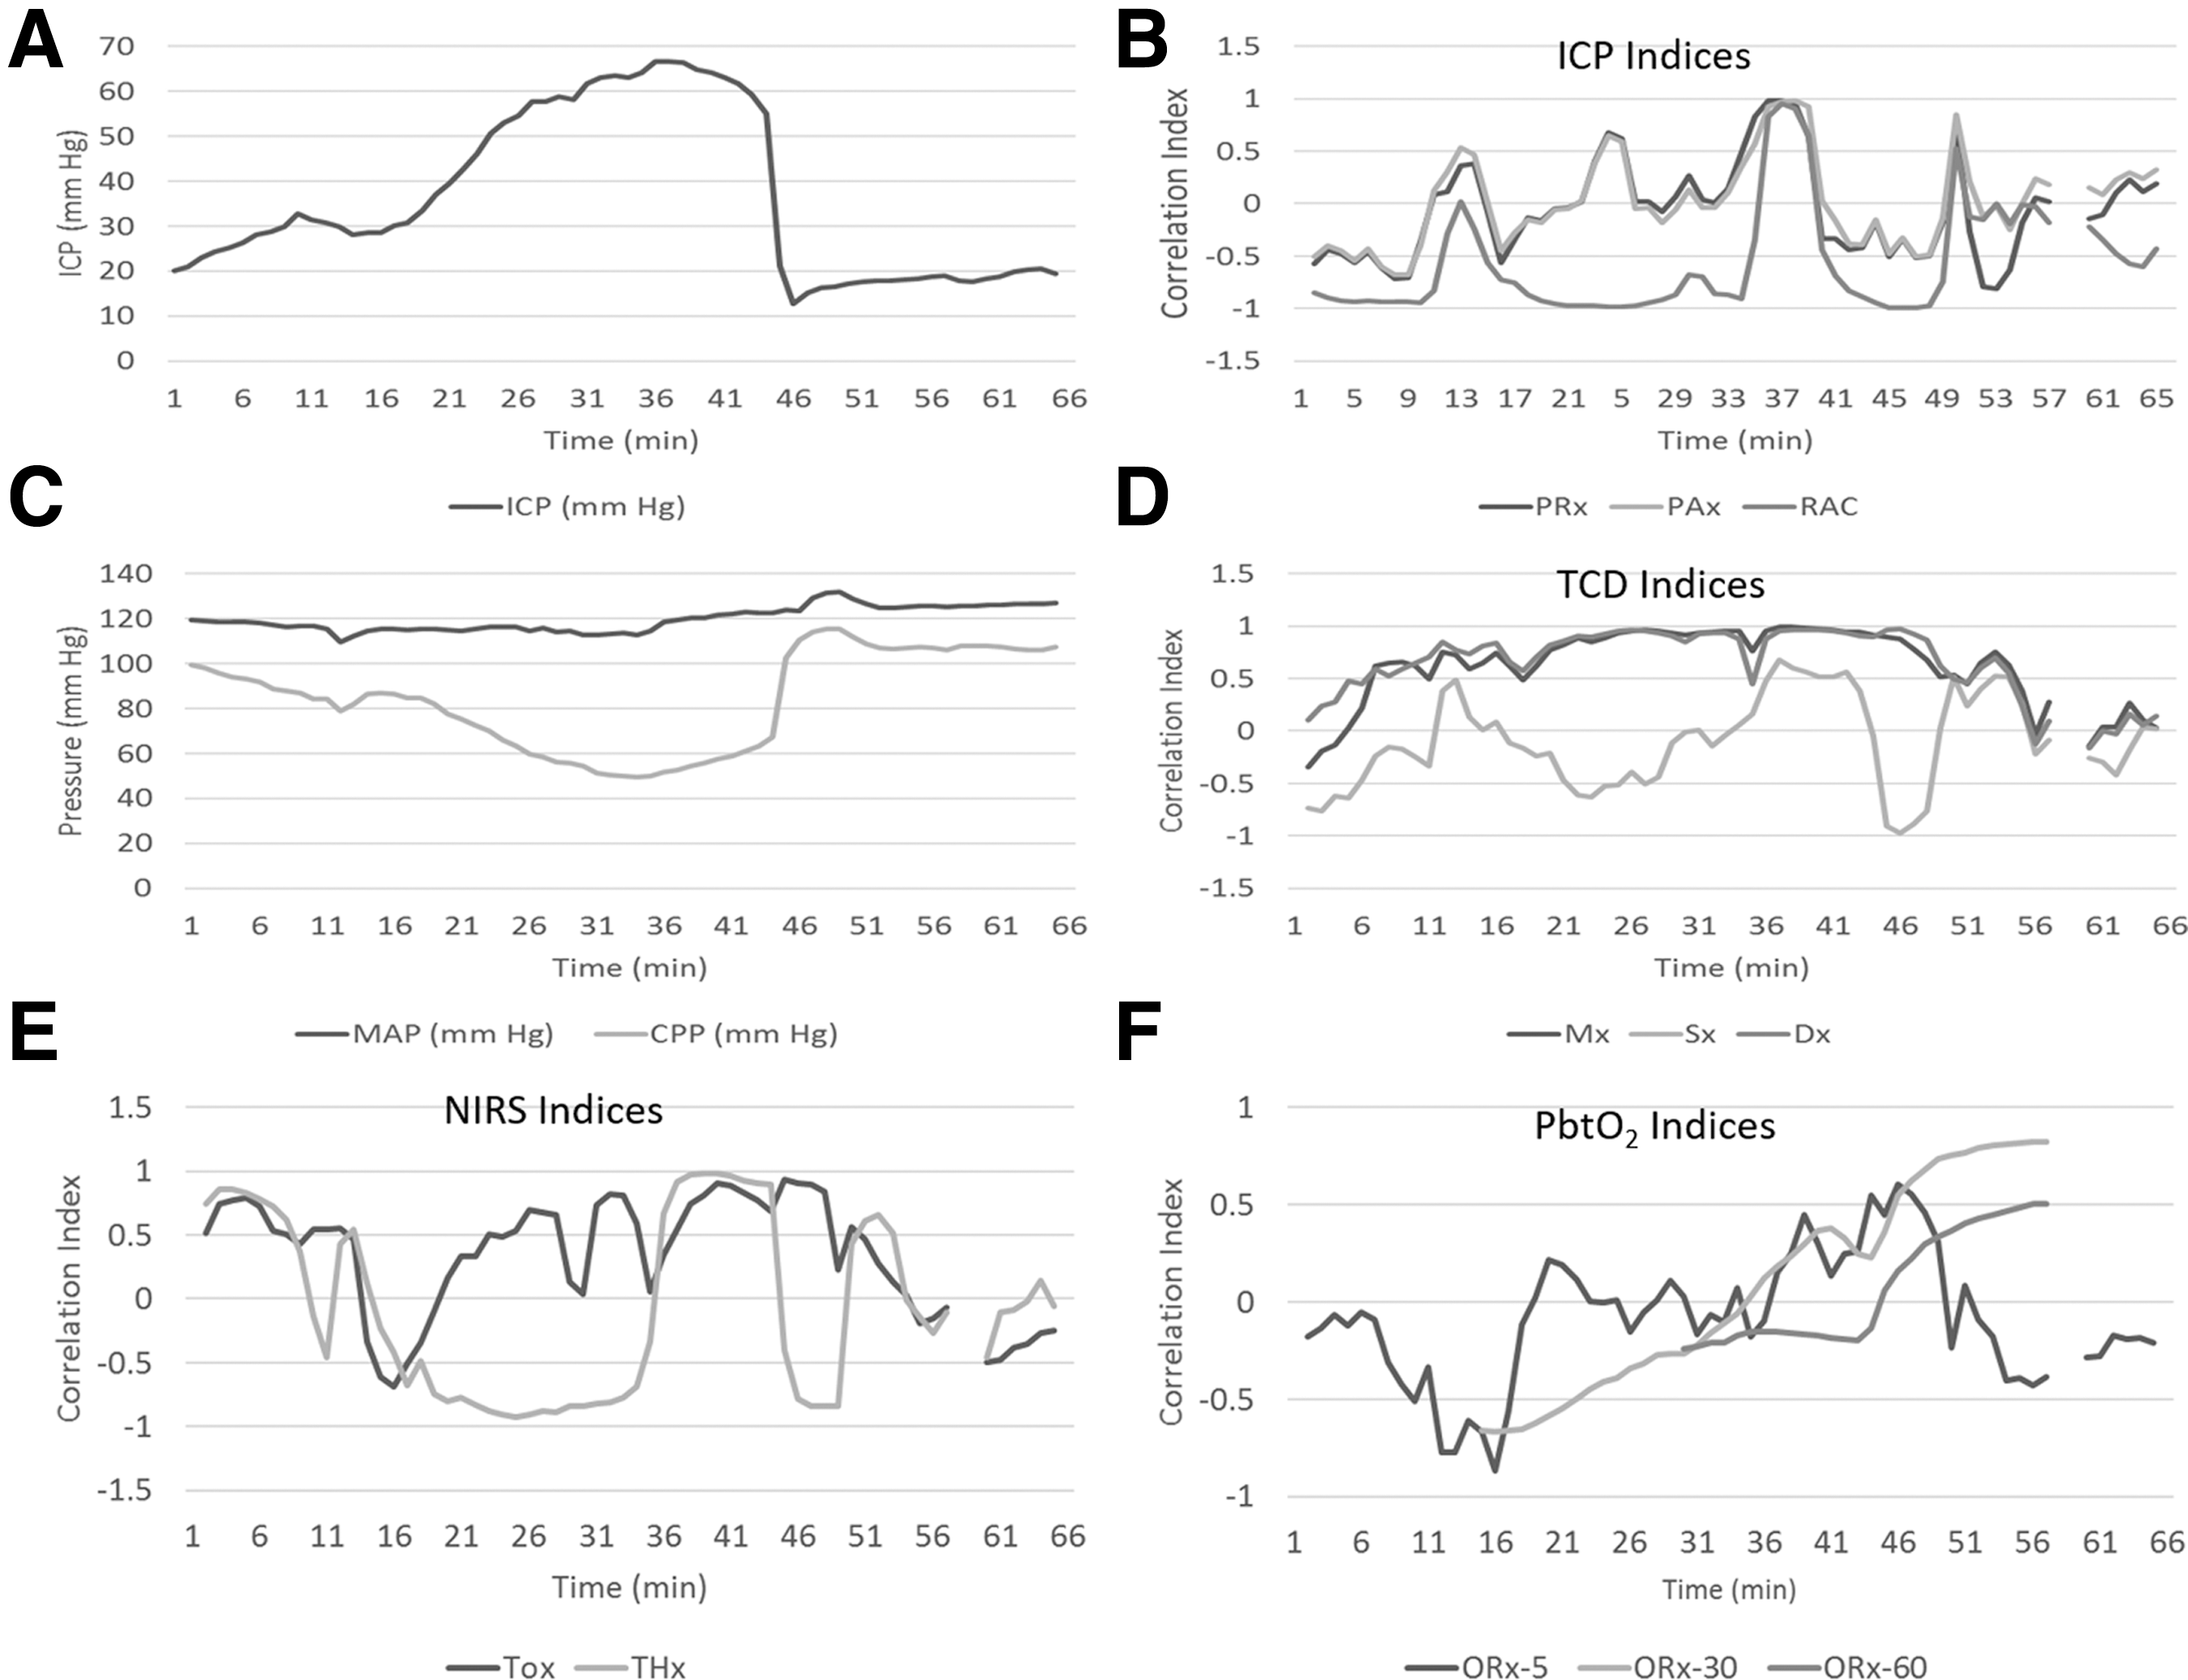
Patient example of index variation during plateau wave. ICP, intracranial pressure; min, minutes; mm Hg, millimeter of mercury; MAP, mean arterial pressure; CPP, cerebral perfusion pressure; PRx (between ICP and MAP), PAx (between AMP and MAP), RAC (between AMP and CPP), TCD, transcranial Doppler; NIRS, near infrared spectroscopy; PbtO2, brain tissue oxygen monitors; ORx (between PbtO2 and CPP; 5, 5-min calculation window; 30, 30-min calculation window; 60, 60-min calculation window), Mx (between FVm and CPP), Sx (between FVs and CPP), Dx (between FVd and CPP); TOx (between TOI and CPP), and THx (between THI and CPP).
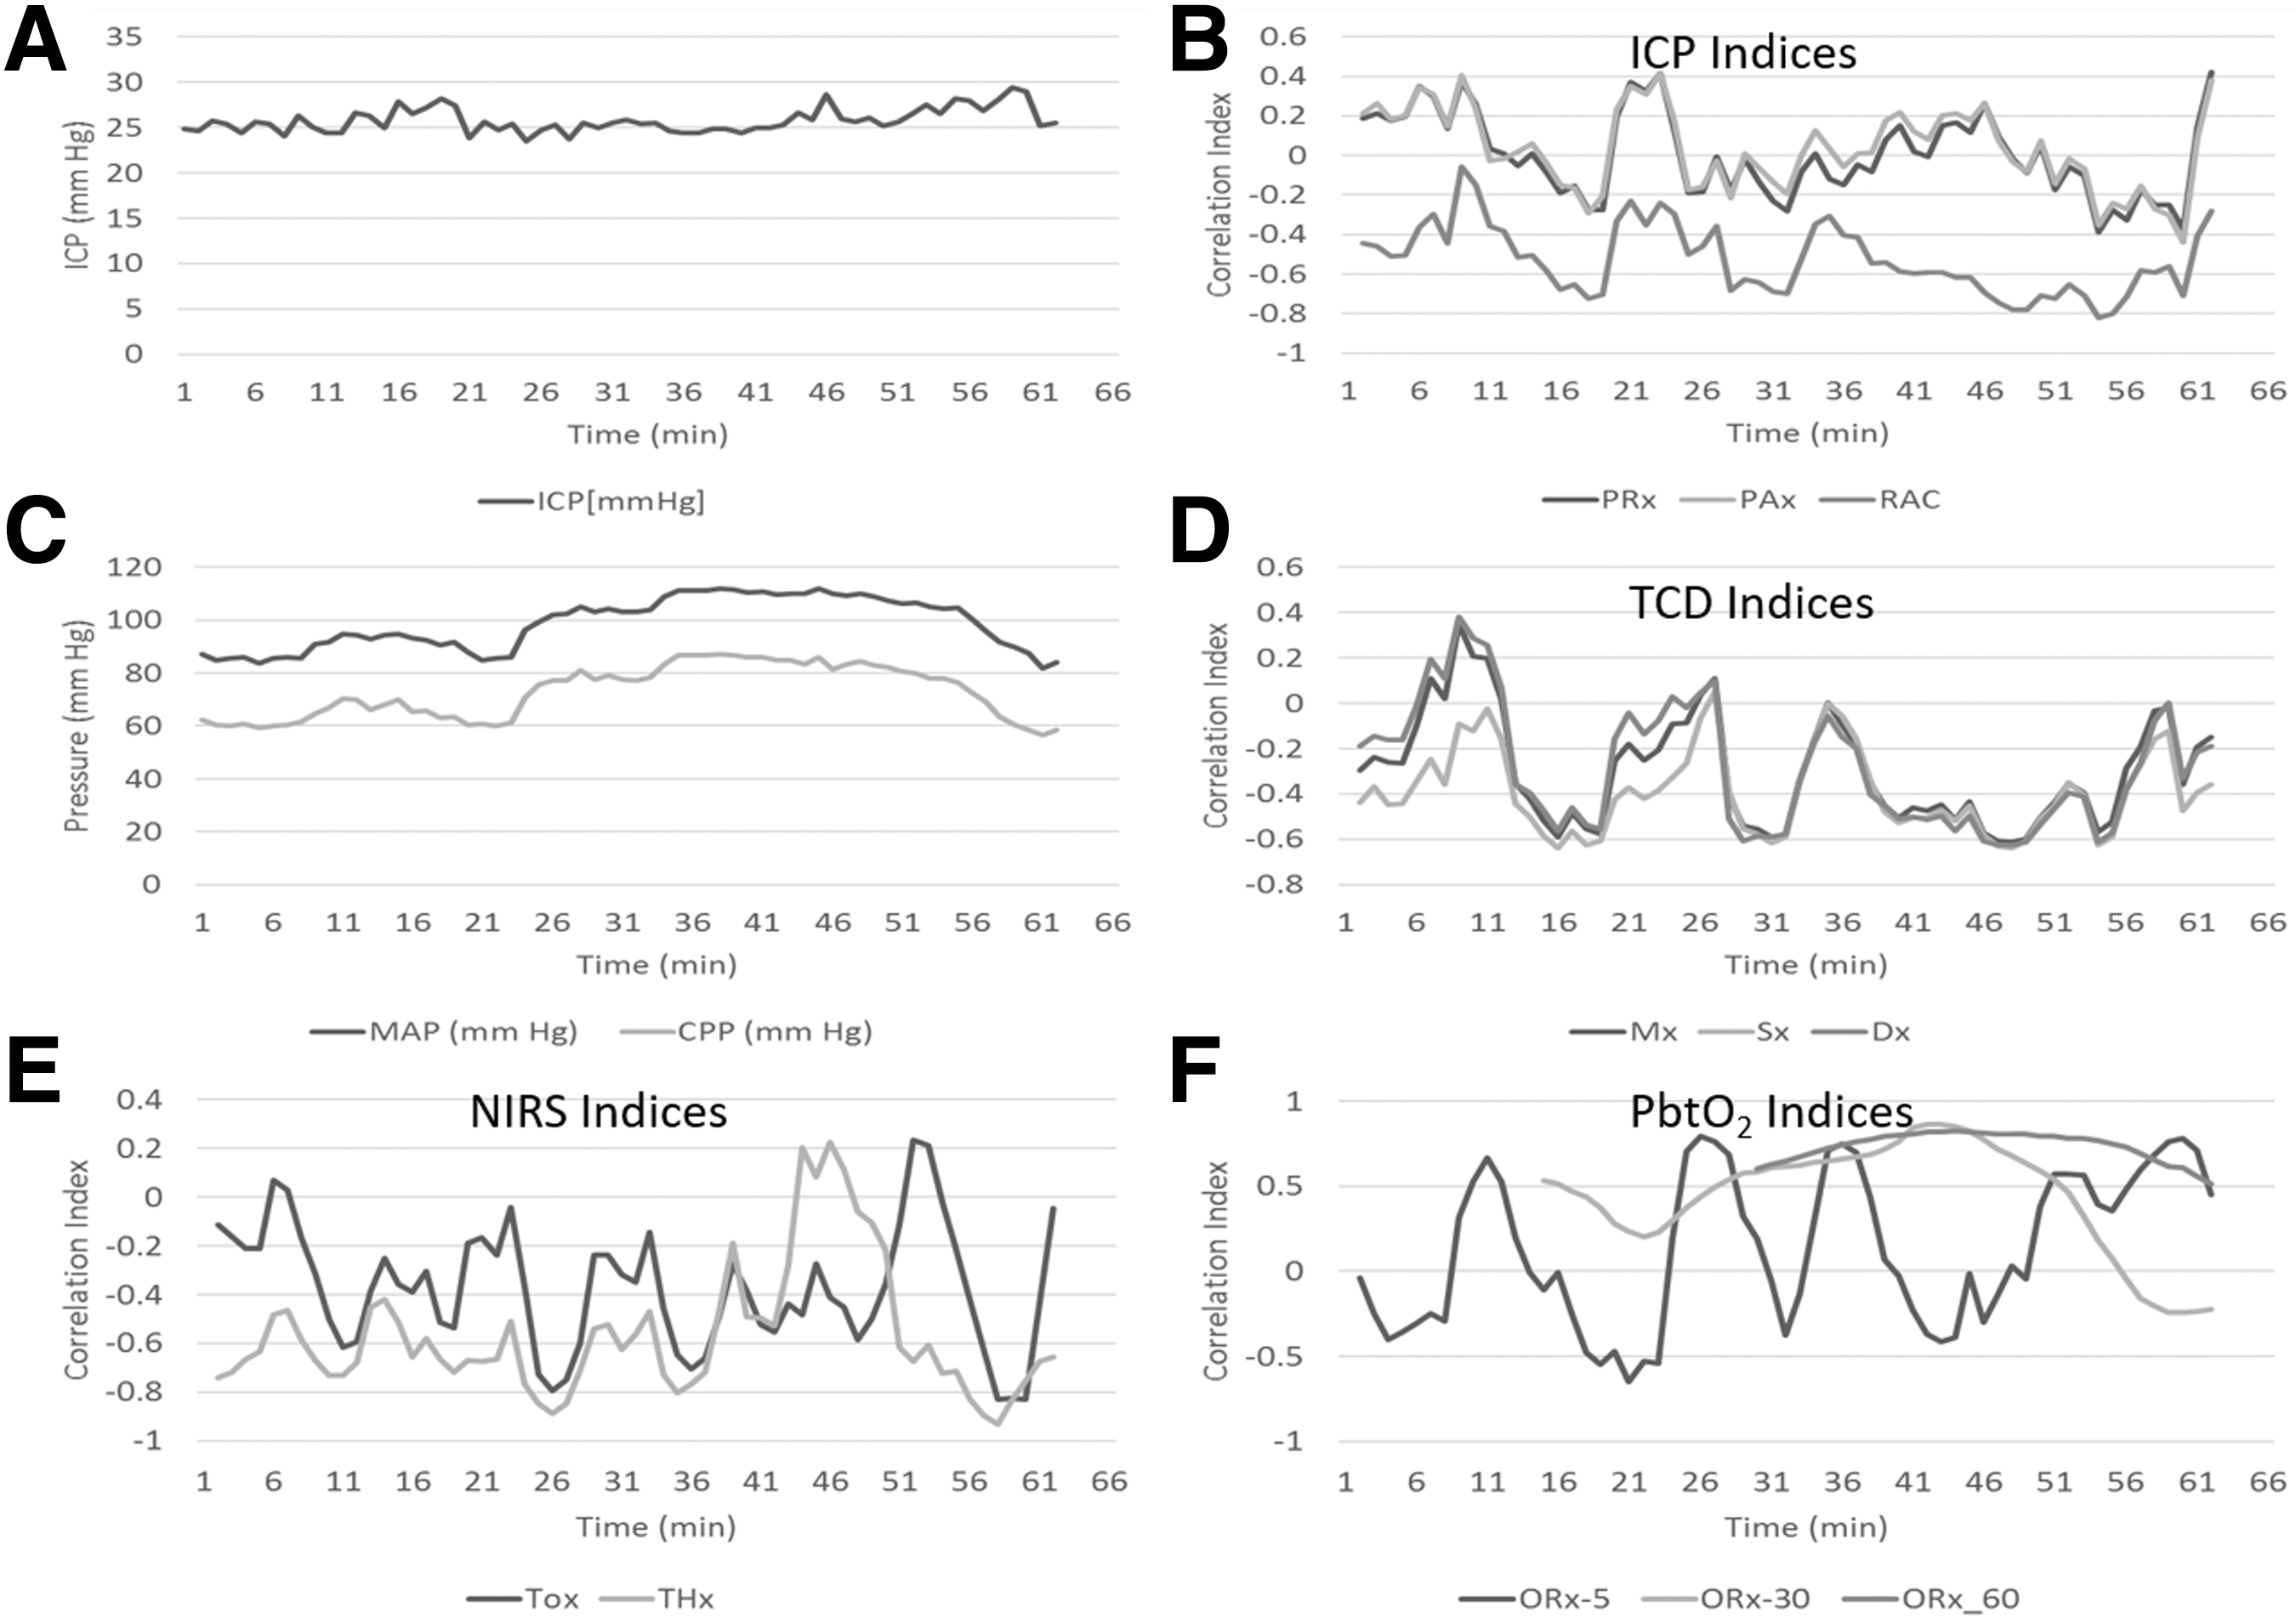
Patient example of index variation during increase in mean arterial pressure. ICP, intracranial pressure; min, minutes; mm Hg, millimeter of mercury; MAP, mean arterial pressure; CPP, cerebral perfusion pressure; PRx (between ICP and MAP), PAx (between AMP and MAP), RAC (between AMP and CPP), TCD, transcranial Doppler; NIRS, near infrared spectroscopy; PbtO2, brain tissue oxygen monitors; ORx (between PbtO2 and CPP; 5, 5-min calculation window; 30, 30-min calculation window; 60, 60-min calculation window), Mx (between FVm and CPP), Sx (between FVs and CPP), Dx (between FVd and CPP); TOx (between TOI and CPP), and THx (between THI and CPP).
Interindex correlation
The Pearson correlation coefficient matrix for the grand mean data set can be seen in Table 2. The Pearson matrices for the 30 min average and minute-by-minute data sheets (and all Pearson p value matrices) provided very similar results and are hence not shown here, but are available in Appendix A of the supplementary materials (see online supplementary material at
The described indices are Pearson correlation coefficients between various variables: PRx (between ICP and MAP), PAx (between AMP and MAP), RAC (between AMP and CPP), ORx (between PbtO2 and CPP; 5 = 5 minutes calculation window, 30 = 30 minute calculation window, 60 = 60 minute calculation window), Mx (between FVm and CPP), Mx_a (between FVm and MAP), Sx (between FVs and CPP), Sx_a (between FVs and MAP), Dx (between FVd and CPP), Dx_a (between FVd and MAP), TOx (between TOI and CPP), TOx_a (between TOI and MAP), THx (between THI and CPP) and THx_a (between THI and MAP). *Values in bold typeface are those that reached statistical significance (p < 0.05).
ICP, intracranial pressure; MAP, mean arterial pressure; AMP, pulse amplitude; PbtO2, brain tissue oxygen monitors; CPP, cerebral perfusion pressure; FVm, mean flow velocity; FVs, systolic flow velocity; FVd, diastolic flow velocity; TOI, total oxygenation index; THI, total hemoglobin index.
PbtO2-based indices (ORx-5/ORx-30/ORx-60) failed to display strong correlations with any of the other indices of autoregulatory assessment within the grand mean data set. Strong correlations were seen, however, between ORx-30 and ORx-60. All r values were 0.250 or less, with most failing to reach statistical significance. The only exception to this was with the correlation between ORx-60 and THx (r = −0.341, p = 0.039). This raises the question as to whether ORx-30 or ORx-60 can be utilized safely as a surrogate for autoregulatory assessment.
The TCD-based indices (Mx, Sx, and Dx) displayed interesting correlation patterns within the grand mean data set. Robust correlations were observed for Mx vs. Dx (r = 0.911, p < 0.0001), and Mx vs. Sx (r = 0.726, p < 0.0001) were seen. Further, the TCD indices derived against CPP (Mx, Sx, and Dx) were strongly correlated with those derived from MAP (Mx_a, Sx_a, and Dx_a). The Mx displayed a moderate correlation with the ICP-derived indices (PRx, PAx, and RAC) with r values ranging from 0.3 to 0.4. The Mx was strongly correlated with the spatially resolved NIRS indices (TOx and THx): TOx (r = 0.618, p < 0.0001) and THx (r = 0.487, p = 0.002). Sx and Sx_a were correlated with the ICP-derived indices, Mx and Dx (as mentioned previously), with the remaining correlations being weak. Finally, Dx and Dx_a only displayed strong correlations between Mx and Sx, with the remaining index correlations being weak.
The NIRS-based spatially resolved indices displayed strong intratechnique correlations. Only the statistically significant strong correlations are reported, with the remaining displaying weak correlations (r values <0.3) (the exact r values can be seen in Table 1). TOx displayed moderate-to-strong correlations with THx, PRx, Mx, Sx, and Dx. THx displayed moderate-to-strong correlations with TOx, RAC, Mx, Sx, and Dx. Of note, most NIRS-based autoregulatory indices displayed weak, or absent, correlation to ICP-derived indices (such as PRx, PAx, or RAC). Importantly, NIRS-based indices displayed moderate-to-weak correlation with PRx, with most r values around 0.3 or less.
Friedman test (with multiple comparisons) for grouped similarity between indices
A Friedman test, with multiple comparisons, was conducted on different groups of indices to assess whether similar variance existed between the means in each group. The main assumption made for this statistical test was that each index measured the same physiologic parameter (i.e., autoregulation) with the same range of measurement.
In the grand mean sheet, the Friedman test on the whole group of indices (i.e., 16 variables in total) indicated that these indices were dissimilar (p < 0.0001, Q = 249.797). Testing of clusters of indices based on the modality they were derived from showed that, even within clusters, there was clear lack of similarity between the ICP-based indices (i.e., PRx, PAx, and RAC; p < 0.0001, Q = 48.054), the TCD-based indices (i.e., Mx, Mx_a, Sx, Sx_a, Dx, and Dx_a; p < 0.0001, Q = 141.046), and the NIRS-based indices (p < 0.0001, Q = 38.849). The PbtO2-based indices (ORx-5, ORx-30, and ORx-60) were found, however, to share substantial commonality based on the Friedman test (p = 0.155, Q = 3.722). Similar results were found for the 30-min mean and minute-by-minute data sheets, described in Appendix B of the supplementary materials (see online supplementary material at
Interindex relationships—multi-variate tests (PCA, AHC, and KMCA)
PCA
A range of multi-variate tests were performed (i.e., PCA, AHC, and KMCA) to further assess interindex relationships. For the grand mean data, the PCA test was performed using a Spearman type PCA (given the nonparametric nature of the dataset). Twenty principal components (PC) (also referred to as factors [F]) were identified, with the first eight PCs composing ∼90% of the overall variance in the dataset. The PC eigenvalue data, Scree plots, and variable specific loadings can be seen in Appendix C of the supplementary materials (see online supplementary material at
A loading biplot for PC1 (denoted F1) and PC2 (denoted F2) can be seen in Figure 3. As can be seen also in Figure 3, the ICP-derived indices (PRx, PAx, and RAC) are clustered in the same quadrant of the biplot, contributing to the overall variance of both PC1 and PC2. Further, PRx/PAx/RAC appeared to be associated with TCD-based Sx and Sx_a, in terms of their contributions to the variance of the whole data set. Similarly, the TCD-based indices (Mx, Mx_a, Dx, and Dx_a) were co-located within the area of the biplot most associated with PC1. The NIRS-based spatially resolved THx, THx_a, TOx, and TOx_a were co-located with the Sx/Sx_a TCD indices. Of note, ORx-/ORx-30/ORx-60 were all co-located, but separated from the other variables, indicating they are essentially unrelated to all the other indices. Further, ORx-5/ORx-30/ORx-60 were located close to the origin of the biplot, indicating that they contribute little variance to the two main PCs of the data sheet. The 30-min mean and minute-by-minute data sets displayed similar results and can be seen in Appendix C of the supplementary materials (see online supplementary material at
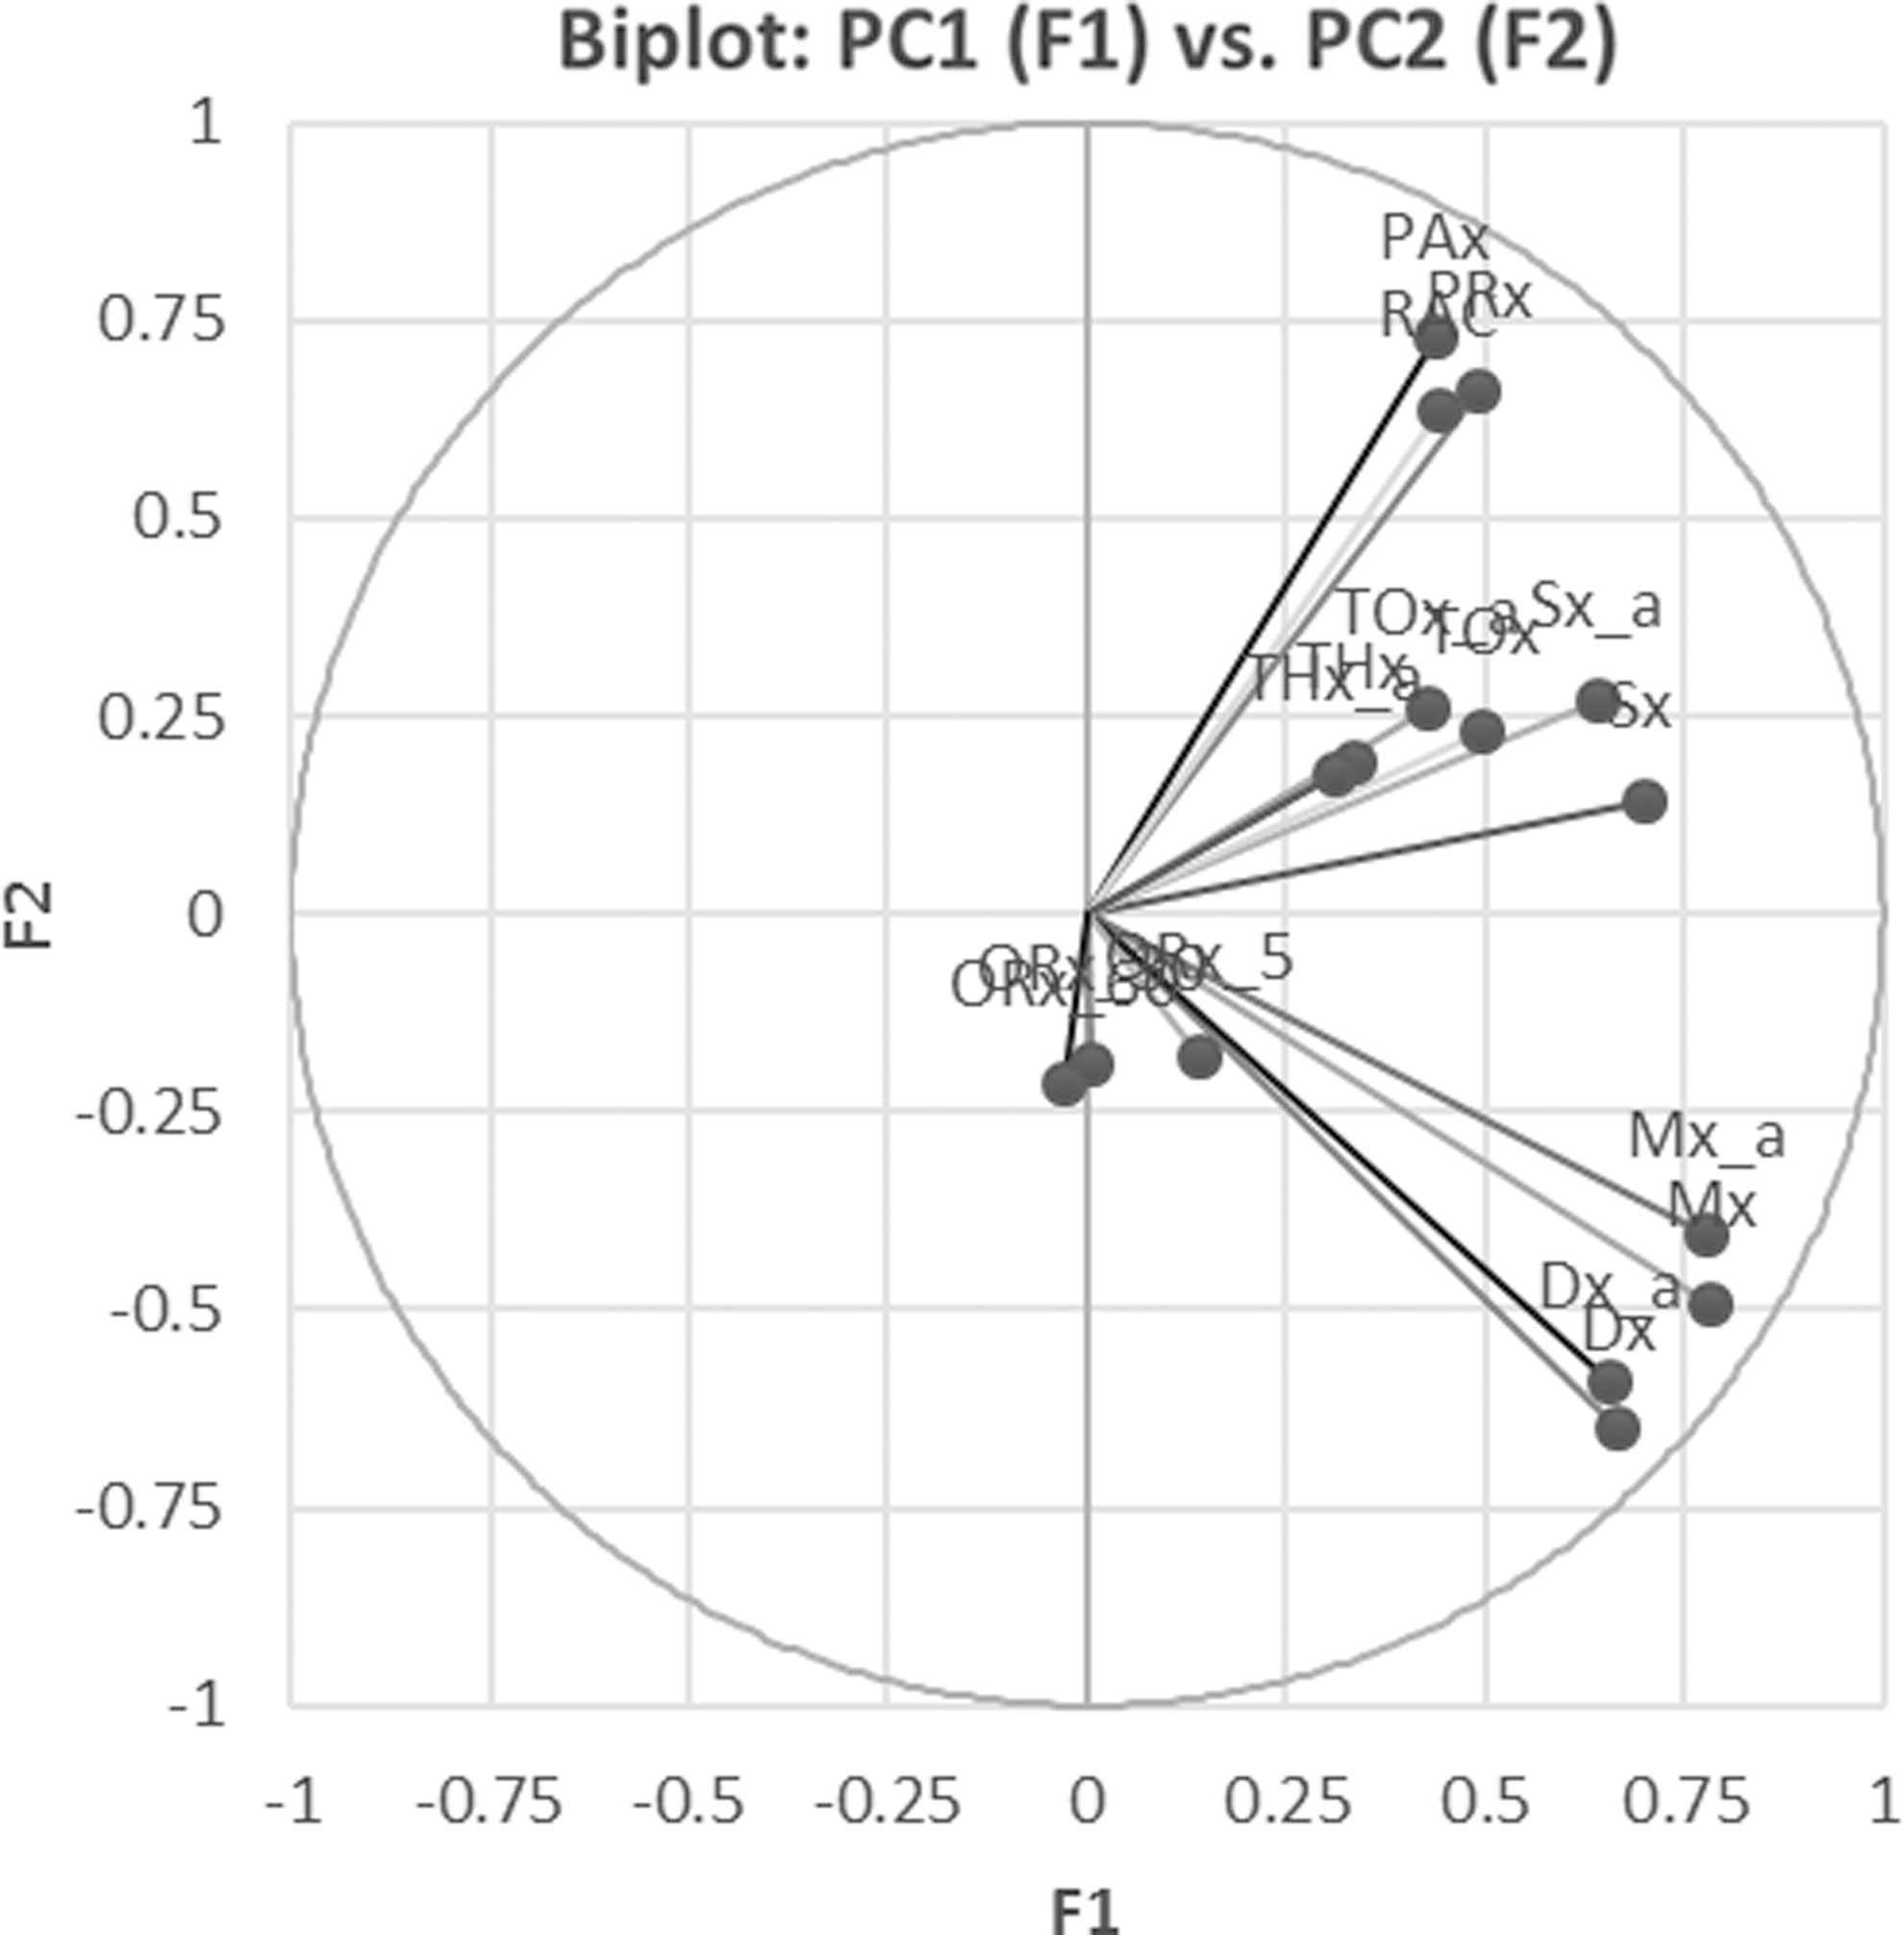
Principle component analysis (PCA) loading biplot of factor (F)1 (PC1) versus F2 (PC2)—minute-by-minute data set. PC1 and PC2 are the two components that contribute the largest amount of variance to the entire data set. The above biplot of PC1 versus PC2 displays which variables contribute variance to PC1 and PC2. The longer the arm connecting (0,0) to the variable (such as PRx), the larger the contribution of that variable. Similarly, the quadrant on the biplot in which the variable falls correlates to its contribution to a particular PC. The upper left quadrant is primarily PC2; lower left quadrant is neither PC1 nor PC2; the upper right quadrant is PC1 and PC2; the lower right quadrant is primarily PC1.
AHC
We wished to assess further the interindex relationships and thus applied AHC analysis to see whether different associations appeared. Figure 4 displays the hierarchal dendrogram generated from this analysis on the minute-by-minute data. As can be seen within the dendrogram, the TCD-based indices, ICP-based indices, PbtO2-based indices, and NIRS-based indices seem to co-cluster under similar branches. Another relation of interest is that of Sx/Sxa with PRx/PAx/RAC, where these indices arise from the same limb of the dendrogram. This is concordant with the results of the Pearson correlation matrix and the PCA. In addition, the spatially resolved NIRS indices (THx, THx_a, TOx, and TOx_a) appear to co-localize with the Sx/Sx_a TCD indices on the dendrogram (similar to the Pearson and PCA).
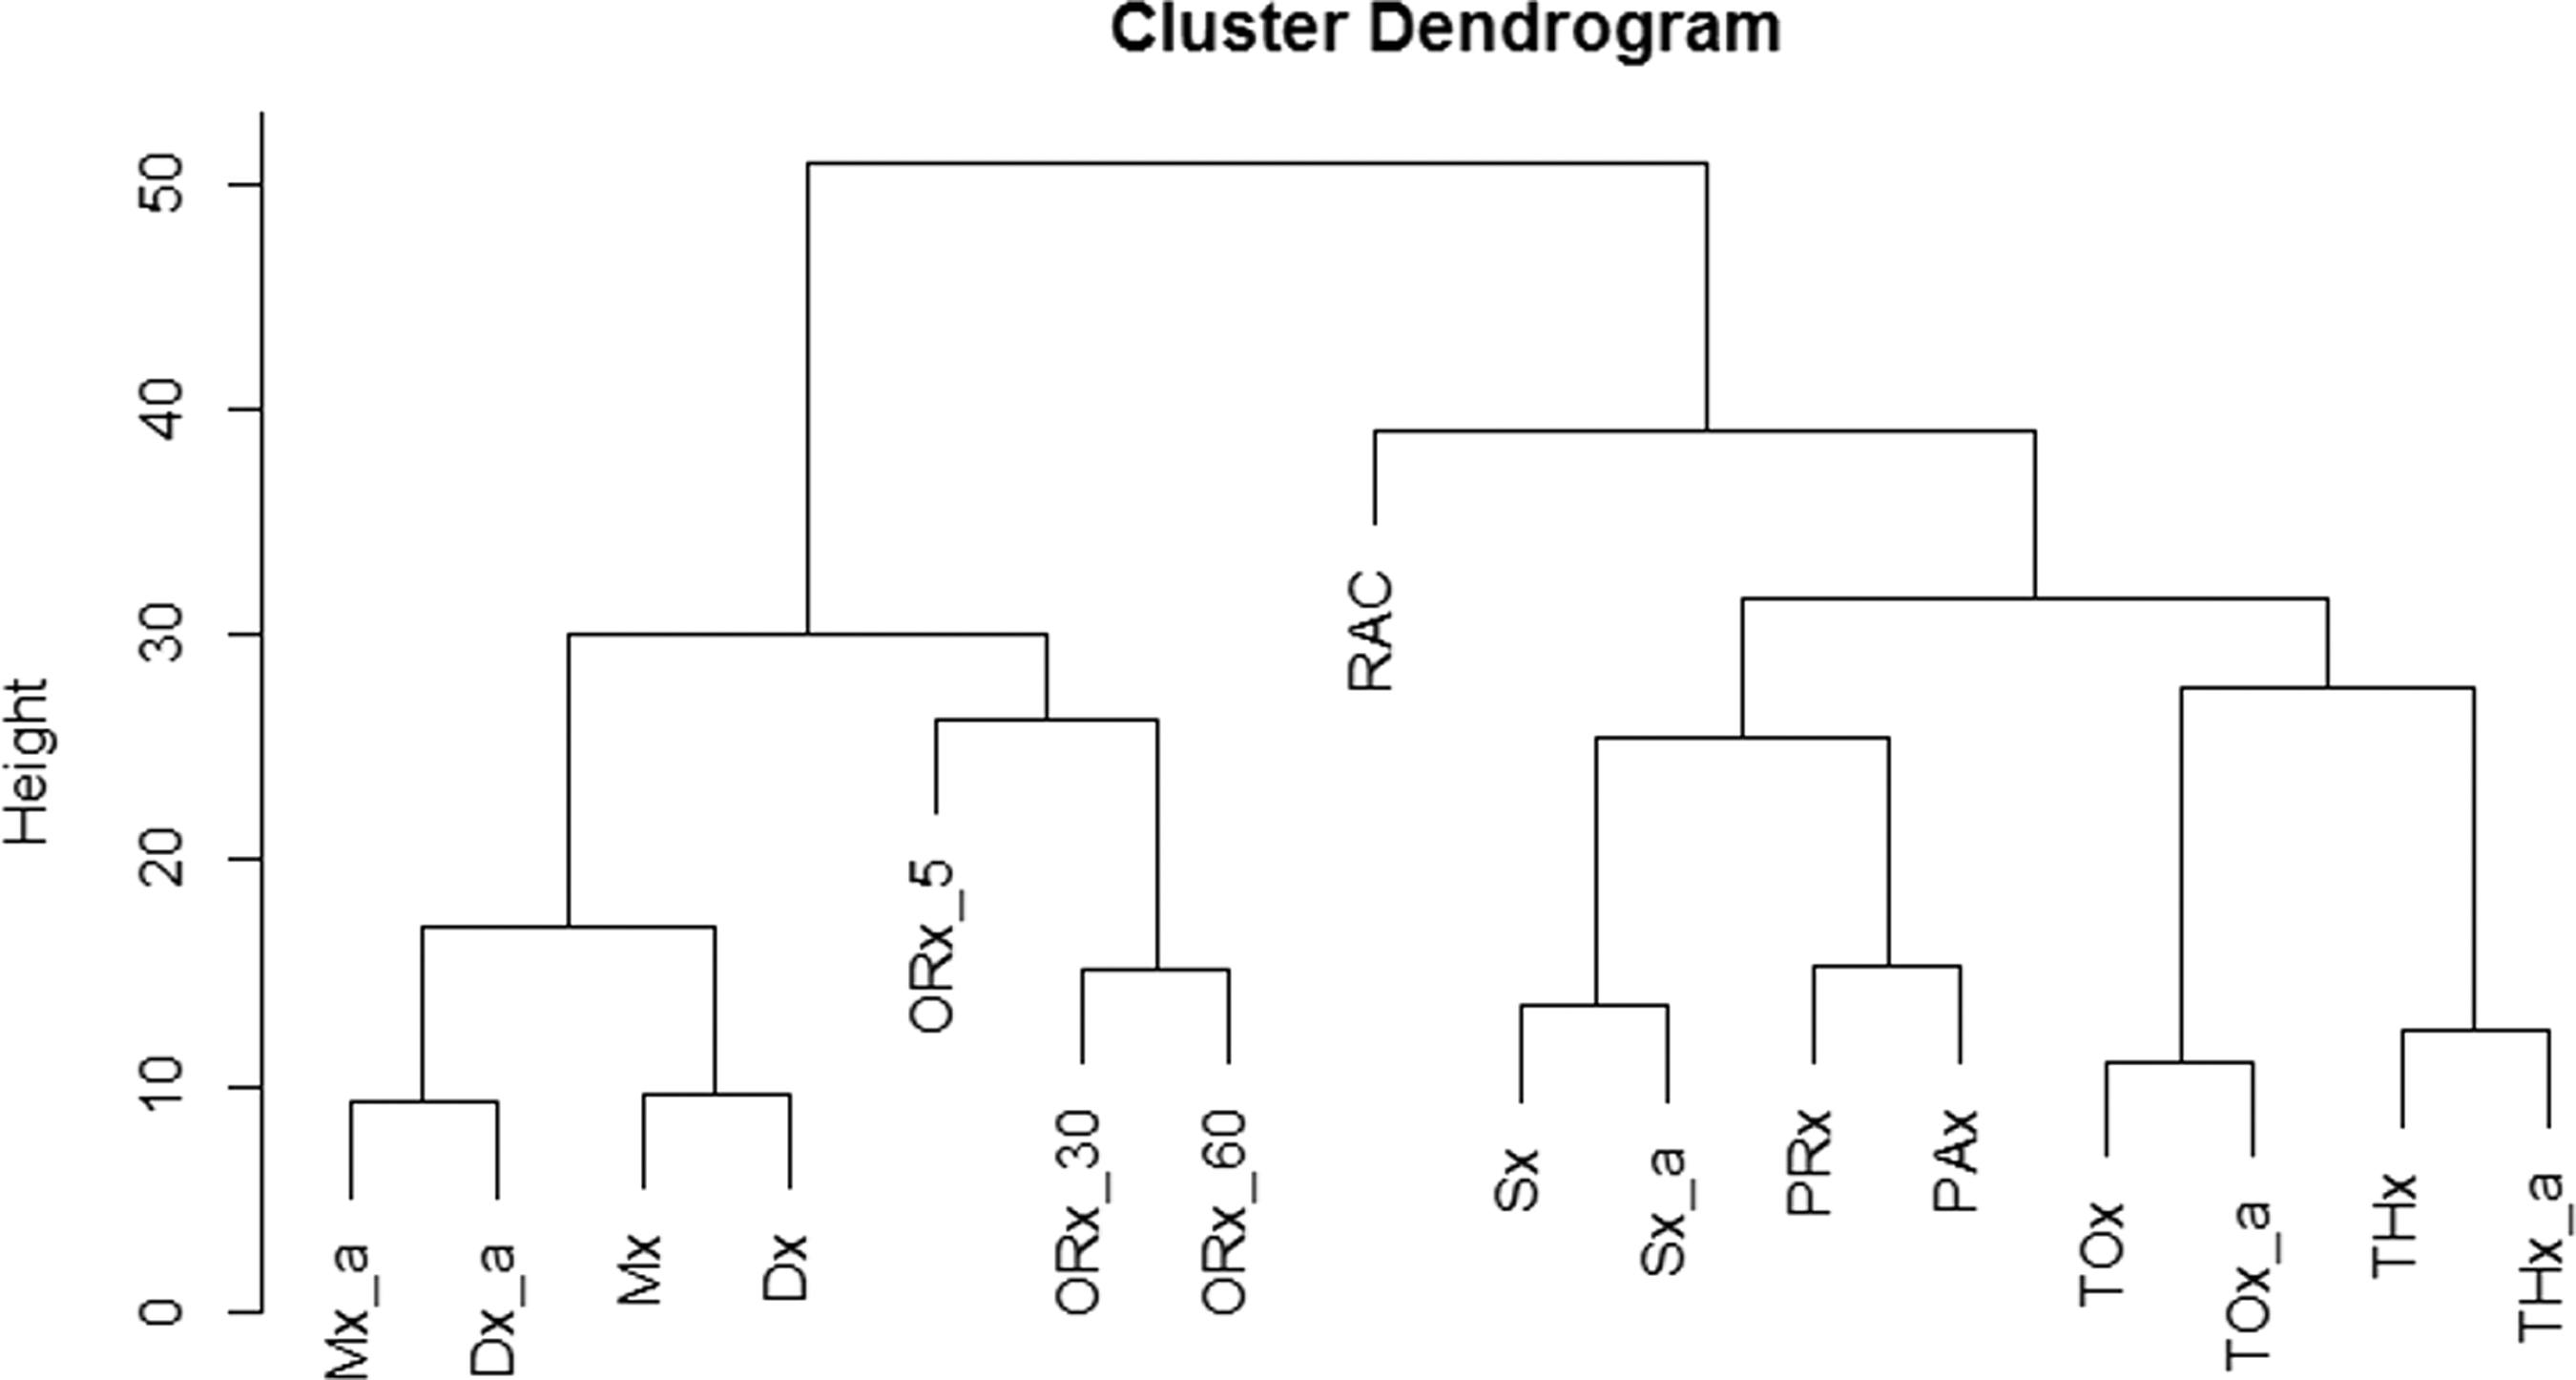
Agglomerative hierarchal clustering dendrogram—minute-by-minute data
An interesting association was observed between the NIRS indices and PRx and PAx. This was seen in the PCA (and KMCA; see subsequently), but was not robustly demonstrated by the Pearson correlation coefficients. Finally, ORx-5/ORx-30/ORx-60 clustered on a separate limb of the dendrogram, having little association with the other indices. The cophenetic correlation coefficient derived for the AHC dendrogram displayed in Figure 4 was 0.822, indicating a statistically robust clustering. Applying AHC to the 30-min and grand mean data sets resulted in similar hierarchical dendrograms with similar clustering of indices (cophenetic correlation coefficients of r = 0.812 and r = 0.746, respectively), confirming the relations/clustering seen in the minute-by-minute data set.
KMCA
To complete our cluster analysis, we employed the KMCA, using seven centers of cluster (based on Euclidean distance and the elbow method of cluster number determination). Appendix D of the supplementary materials (see online supplementary material at
Binary univariate outcome analysis
A univariate logistic regression analysis compared each autoregulatory index with binary outcomes at six months, assessed using the GOS, dichotomized in two ways: “Good” (four or five) vs. “Poor” (three or less) outcome, and “Alive” vs. “Dead.” Table 3 outlines the area under the receiver operating curve (AUC) for each index as a predictor of the two outcome categories, along with p values for the logistic regression models. We split the indices into two groups: A. invasive indices—composed of those requiring CPP for calculation—and B. noninvasive indices—composed of those derived from MAP, which could be derived via noninvasive continuous MAP measurement.
AUC = area under the receiver operating curve. The described indices are Pearson correlation coefficients between various variables: PRx (between ICP and MAP), PAx (between AMP and MAP), RAC (between AMP and CPP), ORx (between PbtO2 and CPP; 5 = 5-min calculation window, 30 = 30-min calculation window, 60 = 60-min calculation window), Mx (between FVm and CPP), Mx_a (between FVm and MAP), Sx (between FVs and CPP), Sx_a (between FVs and MAP), Dx (between FVd and CPP), Dx_a (between FVd and MAP), TOx (between TOI and CPP), TOx_a (between TOI and MAP), THx (between THI and CPP) and THx_a (between THI and MAP).
ICP, intracranial pressure; MAP, mean arterial pressure; AMP, pulse amplitude; CPP, cerebral perfusion pressure; PbtO2, brain tissue oxygen monitors; FVm, mean flow velocity; FVs, systolic flow velocity; FVd, diastolic flow velocity; TOI, total oxygenation index; THI, total hemoglobin index.
All models produced by univariate logistic regression failed to reach statistical significance, given the small patient numbers (n = 37). Some interesting trends merit comment, however. Within the “invasive” index group, the ICP derived indices (PRx, PAx, and RAC) displayed the highest AUCs in both the prediction of Good vs. Poor outcome and mortality, with positive values of these indices associated with Poor outcome and mortality. The RAC was the strongest predictor of both outcomes (AUC = 0.730).
In comparison, within the noninvasive index group, the TCD-based indices (Mx_a, Sx_a, and Dx_a) displayed better prediction of both dichotomized outcome, compared with the NIRS indices. Mx_a and Sx_a displayed the strongest predictive capabilities of the noninvasive indices.
Given the small patient cohort studied, however, none of the aspects of the logistic regression reached statistical significance. Therefore, the above described relationships are trends that require further validation.
Discussion
The use of continuously updating measures of autoregulatory capacity has gained acceptance within the ICU and neurocritical care communities, receiving support through recently published international multi-modal monitoring consensus statements. 2,3 Most of the literature on these indices addresses PRx or Mx, with PRx emerging as the most commonly used method of continuous autoregulatory assessment in TBI. 1,2 PRx is based on the concept that the 10-sec by 10-sec variation in a surrogate measure of pulsatile cerebral arterial blood volume (i.e., ICP) in association with a driving force for cerebral blood flow (i.e., MAP) yields valuable information about cerebral pressure autoregulatory capacity.
To date, the literature supports a strong association between PRx and patient outcome, 15,16 with PRx used for the determination of patient specific optimum CPP. 17 Further, PRx and TOx (equivalent of COx) are the only two indices that have been validated experimentally, using the gold standard measure of autoregulation (the lower limit of autoregulation on the Lassen curve). 29,30 Within Brady and colleagues, 29 it was demonstrated within piglet models that PRx and TOx nicely respect the lower limit of autoregulation when CPP is manipulated, with increasingly positive values found below this limit. Thus, PRx and TOx currently serve as the only two clinically applicable indices that have been shown to represent autoregulation in controlled animal studies, and therefore serve as the only “validated” indices to date.
Numerous other indices of autoregulation can be derived by applying the concept of a moving Pearson correlation coefficient between a hemodynamic input function (CPP or MAP) and a measure of cerebrovascular physiology. Robust support for the clinical use of these “other” indices, however, such as those derived via non–PRx-based correlations (i.e., between ICP, TCD, NIRS, and PbtO2-derived signals), is lacking. Thus, it is currently unknown to what extent these other indices actually measure autoregulation and whether they are correlated to a commonly utilized assessment of autoregulatory capacity, such as PRx.
Our retrospective analysis of this small cohort of patients with ICP, MAP, TCD, NIRS, and PbtO2 monitoring provides interesting insights into these interindex associations, with concordant results across three distinct data sheets: minute-by-minute, 30-min nonoverlapping mean, and grand mean data. A few important relationships are highlighted below.
First, and most importantly, these indices are not all related. This is clear, based on all forms of analysis that we undertook: Pearson correlation, Friedman test (with and without multiple comparisons), PCA, AHC, and KMCA. Thus, for the treating clinician, it is critical to understand that these indices are derived from different invasive/noninvasive cranial monitoring and may measure different aspects of physiology. One cannot simply substitute a less commonly described index for one that has been well defined, such as PRx. With that said, our analysis produced some interesting relationships that could drive further study.
Second, PRx displayed strong correlations with PAx and RAC across Pearson correlation, PCA, AHC, and KMCA. It is not surprising that these indices are related, because they are all derived from ICP or AMP. Of note, PRx was not found to be strongly correlated to Mx (r = 0.356, p < 0.0001), a finding confirmed in all three data sheets across the short recordings. This is in contradiction to a previously defined strong correlation between PRx and Mx. 5,6 The reason for this is likely related to the small patient numbers, short monitoring duration, and impact of injury/treatment heterogeneity.
Third, TCD-based indices (regardless of whether calculated via CPP or MAP) are associated and co-cluster during formal cluster analysis. This is unsurprising and has been described previously in larger cohorts. What was interesting was the strong association of Sx/Sx_a with the ICP-derived indices across all of the analyses. This strong relationship with PRx/PAx/RAC may stem from the contribution of systolic peaks in CBF to ICP and its derivatives (i.e., AMP), suggesting Sx/Sx_a may be associated closely with PRx/PAx/RAC. This is in contrast to Mx/Dx (and their MAP derivatives), which may more closely relate to cerebral blood volume (CBV), and therefore do not strongly associate with PRx/PAx/RAC on Pearson, PCA, AHC, and KMCA. These relationships require further investigation and physiologic validation. The strong association between Sx/Sx_a with PRx/PAx/RAC may imply, however, that Sx/Sx_a might be the best surrogate for PRx/PAx/RAC, compared with the other invasive/noninvasive indices.
Fourth, PbtO2-based indices (ORx-5/ORx-30/ORx-60) all failed to display strong correlations with any of the other indices, as assessed through Pearson correlation, Friedman Test, PCA, AHC, and KMCA. This was confirmed across the minute-by-minute, 30-min, and grand mean data. Notably, but not surprisingly, ORx-5, ORx-30, and ORx-60 were found to be co-related on Pearson correlation, PCA, ACH, and KMCA across all data sheets and recording lengths. The divergence of ORx from the other indices measured likely stems from the fact the PbtO2 is a slowly changing parameter, at a frequency that is lower than most slow waves.
Taking all of this into consideration, ORx may be a questionable assessment of autoregulatory capacity and should be used with caution in the clinical setting. Derivation of patient-specific CPP optimal values based on ORx, as described in some studies, 30,31 should be interpreted with caution, because PbtO2 can be influenced greatly by many systemic factors, and because these indices do not appear to be associated strongly with any of the other indices, including the thoroughly studied PRx/Mx. Moreover, using thresholds defined by other indices (i.e., PRx or Mx) 15,16 with ORx should be avoided entirely, because it appears that this index is not the same as PRx or Mx.
Fifth, NIRS-based indices displayed variable correlation with indices derived from ICP, PbtO2, and TCD signals, especially PRx and Mx. The NIRS indices display intramodality correlation of varying degrees (increasing in the 30-min and grand mean data sets). Further, these NIRS indices seem to co-cluster on PCA, AHC, and KMCA. Of interest, with both PCA and AHC, TOx/THx (and their MAP-based equivalents) appear to cluster with the ICP-derived indices. Based on the animal studies validating PRx and TOx against the lower limit of the Lassen curve, 29 –32 the association between ICP-derived indices and TOx/TOx_a is not that surprising. The cluster of THx and THx_a with the ICP-derived indices has not been well documented. It is possible that the spatially resolved NIRS indices, with parent signals designed to exclude the contamination of extracranial blood flow, may represent frontal lobe pulsatile cortical blood flow through the small arteries/arterioles. This may explain the clustering and association with PRx/PAx/RAC/Sx/Sx_a, and not Mx/Dx, which are potentially more representative of CBV. In addition, the “classic” clustering of these indices has been to group TOx/Mx group together (CBF effects) and THx/PRx together (CBV effects).
Our multi-technique analysis provides inferences that are not concordant with these classical views and suggest that the NIRS-based spatially resolved indices are more closely related to ICP (for both THx and TOx). These NIRS indices may therefore both be metrics of CBV (perhaps oxygenated and deoxygenated versions). This relation was confirmed on every test (PCA, ACH, and KMCA) across all data sheets. Further to this, the relationships described within the article are statistically robust. The ACH dendrogram, for example, is a statistically significant and robust outcome based on a strong cophenetic correlation coefficient (r = 0.822). This indicates a quite strong AHC intracluster association and essentially means the clusters on this test are not by chance. This was of course confirmed with the grouped variances within PCA and grouped clustering on KMCA testing. Despite our results, however, further exploration of these relationships is required to better understand the physiology and associations between indices of autoregulation.
Finally, univariate logistic regression analysis comparing each index (invasive and noninvasive) with dichotomized patient outcomes provided some interesting trends, although our small sample size means that these analyses fail to reach statistical significance, even for indices that have been shown previously to correlate with outcome. Within the invasive index category, the ICP-derived indices provided the strongest prediction of both mortality and Good versus Poor outcome. The RAC produced the highest AUC for both categories of outcome prediction. The worst outcome prediction was provided by the PbtO2-derived indices (ORx-5/ORx-30/ORx-30). Within the noninvasive index category, Mx_a and Sx_a were superior to all other indices (both TCD and NIRS derived), and thus may be the best surrogate measures of autoregulatory capacity in the absence of invasive ICP monitoring. Despite the interesting trends, it must be re-emphasized that given the small patient cohort, none of the results from univariate analysis were statistically significant.
Limitations
Despite these interesting results, some critical limitations within our study must be addressed. First, this is a retrospective cohort study. The patient population is composed of those with heterogenous injury patterns, ICU/hospital courses, and potentially varied ICU therapies during the recorded signals. This impacts the interpatient signal variability and potentially the results of our analysis. This may be exemplified by our lack of strong correlation between PRx and Mx, which has been defined previously in larger cohorts of TBI patients with TCD recordings. 5,6 Therefore, our results are only hypothesis generating and by no means definitive in terms of the relationships between the various autoregulatory indices.
Second, the population was small, consisting of only 37 patients. Third, the duration of signal recording was quite limited for each patient within the short recording cohort, with typically only two sessions lasting one hour each. Thus, depending on the individual patient events (i.e., suctioning, ICP therapies, etc.) during these periods, various segments of data were either too artefactual to include in the final analysis (such as during suctioning or turning), or significantly impacted by administered therapies (such as hypertonic saline boluses). Further, we demonstrated weaker correlation between THx_a and PRx than in a previously published study, based on similar recordings. 24 We believe the reason for the weaker correlation coefficient stems from the fact that the population of this current study is only a subpopulation of the original group (i.e., those with all the monitoring modalities available). Also, we only used the short (1–2 h) recordings, given these were the only recordings available with TCD.
Fourth, the erratic nature of spontaneous slow waves may be the main driving factor as to why some indices failed to produce reproducible relationships. It may be that in the continuous measure of these indices within the ICU, we should apply filters related to slow wave power, focusing only on those periods in which power and signal coherence meet a certain threshold. This could potentially improve some of the relationships seen. Longer recording sessions would be required for this.
Fifth, even though the metric of autoregulation provided by individual indices are dissimilar, it is important to highlight that this does not indicate that CPP optimum derived from these indices is divergent as well. This would need to be explored in patients with all of the above monitoring modalities, across much longer recording intervals.
Sixth, the application of the Friedman test in this circumstance (i.e., to compare across indices) is controversial, given one can argue that these indices are not the same and in fact do not measure the same physiology. Thus, the results of analysis should be interpreted with caution. We were able to confirm the results of the Friedman analysis, however, by displaying the interindex dissimilarities using Spearman ranked correlation, PCA, ACH, and KMCA.
Seventh, the use of multi-variate statistical tests, such as PCA, are meant as “exploratory” methods of analyzing small patient cohorts with many recorded variables. PCA, AHA, and KMCA are not definitive tests, in that they do not indicate statistically significant associations or correlations between various combinations of variables. These tests are designed merely to provide some idea on groupings of variables across the entire data set and serve only to drive further directed studies of specific relationships identified. Thus, the associations of Sx/Sx_a and the NIRS indices with PRx/PAx/RAC require further investigation to better understand the physiologic link between these indices.
It must be re-emphasized that this study in no way indicates that the various indices described either measure, or do not measure, autoregulatory capacity. In addition, the relationships (or lack thereof) described within this article are based on a small population with some significant limitations, and thus should be taken as a preliminary exploratory analysis. This study was only meant to further explore the interindex relationships in a cohort of patients with many monitoring devices. The result of our analysis requires validation. Based on this study, we plan on prospectively validating these results on a new cohort of adult patients with TBI by obtaining long recording sessions, including TCD. Further to this, given the potential for autocorrelative structure within the data as we move from observation to observation within a given patient, and the potential for interpatient differences, our future analysis will include advanced analysis of the autocorrelative structure within and between various indices, plus the application of nonlinear mixed effects modeling to account for both within and between patient differences.
Conclusions
Continuously updated autoregulatory indices, based on correlations between hemodynamic inputs (CPP and MAP) and indices of cerebrovascular physiology derived from a range of invasive and noninvasive monitors, are different and can be correlated poorly with one another. These indices cluster in several groupings, however, which provide insights regarding the pathophysiology that underlies their production. Caution must be advised when utilizing less commonly described autoregulation indices (such as ORx) for the clinical assessment of autoregulatory capacity, because they appear to be not related to commonly measured/established indices, such as PRx. Further prospective validation of these results is required.
Footnotes
Acknowledgments
This work was made possible through salary support through the Cambridge Commonwealth Trust Scholarship, the Royal College of Surgeons of Canada—Harry S. Morton Travelling Fellowship in Surgery, the University of Manitoba Clinician Investigator Program, R. Samuel McLaughlin Research and Education Award, the Manitoba Medical Service Foundation, and the University of Manitoba Faculty of Medicine Dean's Fellowship Fund.
These studies were supported by the National Institute for Healthcare Research (NIHR, UK) through the Acute Brain Injury and Repair theme of the Cambridge NIHR Biomedical Research Centre, an NIHR Senior Investigator Award to DKM. Authors were also supported by a European Union Framework Program 7 grant (CENTER-TBI; Grant Agreement No. 602150).
Author Disclosure Statement
FAZ has received salary support for dedicated research time, during which this project was partially completed. Such salary support came from: the Cambridge Commonwealth Trust Scholarship, the Royal College of Surgeons of Canada—Harry S. Morton Travelling Fellowship in Surgery, the University of Manitoba Clinician Investigator Program, R. Samuel McLaughlin Research and Education Award, the Manitoba Medical Service Foundation, and the University of Manitoba—Faculty of Medicine Dean's Fellowship Fund. DKM has consultancy agreements and/or research collaborations with GlaxoSmithKline Ltd; Ornim Medical; Shire Medical Ltd; Calico Inc.; Pfizer Ltd; Pressura Ltd; Glide Pharma Ltd; and NeuroTraumaSciences LLC. MC and PS have financial interest in a part of licensing fee for ICM+ software (Cambridge Enterprise Ltd, UK). MC is an honorary co-Director of Technicam Ltd- producer of Cranial Access Device used for CMD insertion. For the remaining authors, no competing financial interests exist.
References
Supplementary Material
Please find the following supplemental material available below.
For Open Access articles published under a Creative Commons License, all supplemental material carries the same license as the article it is associated with.
For non-Open Access articles published, all supplemental material carries a non-exclusive license, and permission requests for re-use of supplemental material or any part of supplemental material shall be sent directly to the copyright owner as specified in the copyright notice associated with the article.