




Abstract
The Glasgow Outcome Scale-Extended (GOSE) is often the primary outcome measure in clinical trials for traumatic brain injury (TBI). Although the GOSE's capture of global functional outcome has several strengths, concerns have been raised about its limited ability to identify mild disability and failure to capture the full scope of problems patients exhibit after TBI. This analysis examined the convergence of disability ratings across a multi-dimensional set of outcome domains in the Transforming Research and Clinical Knowledge in Traumatic Brain Injury (TRACK-TBI) Pilot Study. The study collected measures recommended by the TBI Common Data Elements (CDE) Workgroup. Patients presenting to three emergency departments with a TBI of any severity enrolled in TRACK-TBI prospectively after injury; outcome measures were collected at 3 and 6 months post-injury. Analyses examined frequency of impairment and overlap between impairment status across the CDE outcome domains of Global Level of Functioning (GOSE), Neuropsychological (cognitive) Impairment, Psychological Status, TBI Symptoms, and Quality of Life. GOSE score correlated in the expected direction with other outcomes (mean [M] Spearman's rho = 0.21 and 0.49 with neurocognitive and self-report outcomes, respectively). The subsample in the Upper Good Recovery (GOSE 8) category appeared quite healthy across most other outcomes, although 19.0% had impaired executive functioning (Trail Making Test Part B). A significant minority of participants in the Lower Good Recovery subgroup (GOSE 7) met criteria for impairment across numerous other outcome measures. The findings highlight the multi-dimensional nature of TBI recovery and the limitations of applying only a single outcome measure.
Introduction
T
Over the last several decades, the gold standard measure of global outcome following TBI has been the Glasgow Outcome Scale (GOS), 9 –11 or its extended form, the GOSE. 12 The GOS/GOSE is a simple, practical index that rates patients on a crudely defined, ordinal scale. The GOS has 5 levels—dead, persistent vegetative state, severe disability, moderate disability, and good recovery; the 8-level GOSE expands each of the top three GOS levels into an “upper” and “lower” category. The GOS/GOSE are intended to broadly reflect a patient's capacity in domains such as dependence on others and social reintegration, with the lowest rating across functional domains used as the overall score. 9 There are a number of purported advantages of the GOS/GOSE that have contributed to its nearly universal use as the primary outcome measure in clinical trials for TBI. For example, scores can be obtained relatively efficiently through multiple modes of assessment (e.g., phone, in-person, mail). 12 –14 Further, the GOSE can be used across the TBI severity spectrum, 15,16 and has been adapted for use with TBI subsamples and non-TBI diagnostic groups. 16 –19 The efficiency and flexibility of the measure likely explain the GOSE's high follow-up rates, which consistently exceed those of neurocognitive and other outcome assessments. 20,21
Yet due to its emphasis on global outcome, the GOSE may be insufficiently sensitive to the numerous specific sequelae of TBI. 22 It is also not brain specific and can reflect disability from multiple causes (e.g., polytrauma). The acute and lingering effects of TBI can take many forms (e.g., emotional and cognitive impairment, physical disability, and social deficits), which are imperfectly related to reengagement in normal day-to-day activities as emphasized by the GOSE. 23 –26 In the context of the limited success of prior acute TBI treatment trials, 27 this supports a need to explore the value of multi-dimensional sets of outcome measures, which may reveal ways to stratify patients into meaningful groups and lead to the development of precision medicine assessment and treatment approaches. 23,27,28 The inability of the GOSE to capture the multi-dimensional nature of TBI outcomes is supported by reports that GOSE scores are only modestly correlated with measures of cognitive function, 10,12,16,29 –35 and may be unable to discern relatively subtle cognitive deficiencies. 19,21,36 Additionally, the majority of patients with severe TBI who fall into the Good Recovery category of the GOS continue to report TBI-related disability, including compromised independence, social isolation, deterioration of work skills, and/or reduced work status. 37 These findings further illustrate the potential shortcomings of the GOSE to capture the full spectrum of impairment that results from TBI.
In addition to its limited scope, psychometric issues diminish the GOSE's performance and limit the statistical approaches available to analyze GOSE data. For example, inter-relater reliabilities of the GOS and GOSE were historically poor, 11,31,38,39 a problem that reduces statistical power and obscures true effects. 40 Although higher agreement can be obtained using more newly developed structured interviews. 10,11,14,15,41 misclassification remains widespread, 11,13,14,31,39 –45 with rater variation ranging from 17% 43 to as high as 40%. 45 Additionally, ceiling effects have been reported for the GOS 22,46 and have been suspected of the GOSE 7,30,47 given the range of subtle impairments possible for patients with otherwise “good” recovery. The common decision to dichotomize GOSE scores into “favorable” and “unfavorable” groups can also diminish statistical power, particularly when misclassification is high. 48 However, retaining the ordinal nature of GOSE scores complicates analyses, as analyses of ordinal outcome measures require more specialized statistical approaches that can be challenging to implement. 14
Objective and aims of the current project
Because an accurate and consistent assessment of TBI outcome is critical to patient treatment and comparative research alike, it is vital that both the strengths and deficiencies of the GOSE be understood. The current project examined the convergence of disability ratings across a multi-dimensional set of outcome domains. To accomplish this, data from the multi-center Transforming Research and Clinical Knowledge in Traumatic Brain Injury (TRACK-TBI) Pilot Study were used, which collected common data elements (CDEs) recommended by the CDE Workgroup 49 (Fig. 1) in a sample that represented all levels of TBI severity. The first aim was to report 6-month TBI outcome in this sample across the domains of global function, neurocognitive performance, psychological status, TBI symptoms, and quality of life. The second aim was to examine the overlap in recovery information across the CDEs to better understand the multi-dimensional nature of TBI outcomes.
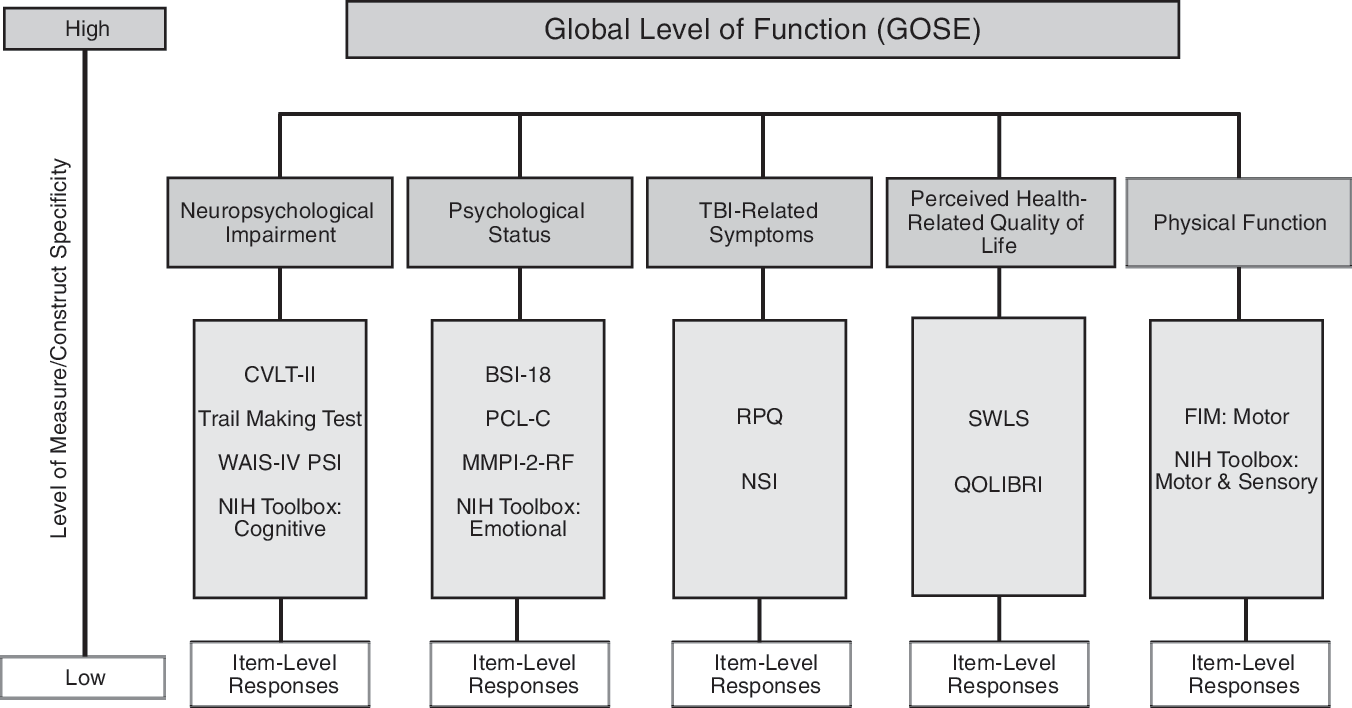
Multi-dimensional assessment of traumatic brain injury (TBI) outcome with the TBI Common Data Elements (CDE).
Methods
Study population
Data were extracted from the TRACK-TBI Pilot Study database. 50 Participants were recruited from three U.S. acute care centers: San Francisco General Hospital (UCSF), University of Pittsburgh Medical Center (UPMC), and University Medical Center Brackenridge (UMBC) in Austin, TX. Patients were eligible if they were English-speaking, presented to one of the participating sites with an external force head trauma, and underwent computed tomography (CT) within 24 h of injury. Exclusion criteria included comorbid life-threatening disease, incarceration, active psychiatric hold, and pregnancy. Details about the TRACK-TBI Pilot Study population and recruitment criteria can be found in prior publications. 50,51
Common data elements extracted from the TRACK-TBI Pilot dataset
The TRACK-TBI dataset includes several CDEs—a set of widely applicable measures proposed by the inter-agency CDE Workgroup as a means of standardizing TBI outcome research, and which are now recommended by the National Institute of Neurological Disorders and Stroke (NINDS) and the National Institutes of Health (NIH). 49,51 –55 The Workgroup organized the Outcome CDEs according to three “tiers” (core, supplemental, emerging), within which relevant “domains” of recovery were identified and operationalized as clinical measures. 55 The current project examined a subset of recommended Tier 1 and 2 Outcome CDEs (Table 1) that included the following domains and their associated measures: Global Level of Function (GOSE; Table 2), Neurocognitive Impairment (California Verbal Learning Test-Second Edition [CVLT-II], 56 Trail Making Test [TMT], 57 Wechsler Adult Intelligence Scale-Fourth Edition Processing Speed Index [WAIS-IV PSI] 58 ), Psychological Status (Brief Symptom Inventory-18 [BSI-18], 59 Post-Traumatic Stress Disorder [PTSD] Checklist-Civilian Version [PCL-C] 60 ), TBI-Related Symptoms (Rivermead Post-Concussion Symptoms Questionaire [RPQ]), 61 and Perceived Generic Quality of Life (Satisfaction With Life Scale [SWLS]). 62 Other CDE-recommended measures included in the study were the Cognitive and Motor Subscales of the Functional Independence Measure (FIM) 63 and the Social Integration subscale of the Craig Handicap Assessment and Reporting Technique Short Form (CHART-SF). 64 Descriptive statistics of scores on the FIM and CHART-SF in this sample have been reported (Tables 3 and 4). However, due to the limited proportion of the sample with complete data (FIM) and unclear guidelines for interpreting clinical significance (CHART-SF), these measures were not used in the primary analyses for the current project.
TBI, traumatic brain injury.
AIS, Abbreviated Injury Scale; CDEs, Common Data Elements; CT, computed tomography; FIM, Functional Independence Measure; GCS, Glasgow Coma Scale; ISS, Injury Severity Score; LOC, loss of consciousness; MV, motor vehicle; PTA, post-traumatic amnesia.
Additionally, the current analysis included the Demographic and Clinical Assessment CDEs 49,53 recommended by the CDE Workgroup 49 for characterizing a broad spectrum of patients varying in injury severity and time since injury. These included subject characteristics (age, gender, race, education), subject and family history (previous TBI hospitalization, psychiatric history), injury- or disease-related events (cause of injury, injury classification [uncomplicated vs. complicated], Abbreviated Injury Scale [AIS], Injury Severity Score [ISS]); and injury assessment and evaluations (Glasgow Coma Scale [GCS], loss of consciousness [LOC], post-traumatic amnesia [PTA], FIM). (Although the study collected the FIM Cognitive and Motor subscales—designated as Tier 1 “core” CDE outcomes—their administration only to patients needing physical rehabilitation resulted in samples too small (ncog = 100; nmotor = 97) for meaningful analysis).
GOSE
GOSE scores fall on an 8-point ordinal scale ranging from Death (1) to Upper Good Recovery (8). 65 The possible scores and conceptual rubric for determining GOSE scores are presented in Table 2.
CVLT-II
The subscales of the CVLT-II 56 used in the current analyses were the Trails 1–5 Total (immediate recall) Score, the Short and Long Delay Cued and Free Recall scores, and the Recognition Discrimination score. CVLT-II scores were standardized by age and gender using the measure's official normative sample, and the cut scores of T ≤ 37 (Trials 1–5 Total Score) and z ≤ −1.33 (all other subscales) were used to define impairment (both cut scores correspond to roughly the 9th percentile). 66
TMT
Demographically adjusted (i.e., by gender, age, race, and education) T scores for performance on TMT-A and TMT-B were derived based on a total normative population (age range 20–79; M = 50, SD = 10). 67 Impairment cut scores for TMT-A and TMT-B were set at T ≤ 37. 68
WAIS-IV PSI
WAIS-IV PSI aggregates the age-adjusted scores on the Symbol Search and Coding subtests 58 and is scaled with a M = 100 and SD = 15. The cut score used in the current project was ≤ 79, 69 which is just below the ninth percentile.
BSI-18
Raw scores on the BSI-18 were converted to T scores based on the standard normative sample, and the cut score used to define clinical significance for each subscales was T ≥ 63. 59
PCL-C
The current study compared two approaches to establishing the clinical significance of PCL-C scores. First, analyses used the lower bound of the recommended cutoff range for TBI samples (36–44), 70 with ≥ 36 suggestive of PTSD. 2,71 (In populations in which the base rate of PTSD is ≤ 15%, cut scores below the upper diagnostic threshold for TBI samples of 44 will likely overestimate PTSD prevalence. 91 However, although the prevalence of PTSD within TBI samples is thought to be 16–39%, 90 diagnostic thresholds set lower than 44 may still overestimate clinical-level PTSD, but will help clinicians detect the presence of minimum levels of disorder. 91 ) Second, PTSD diagnosis was determined using the algorithm-derived Symptom Cluster Method (SCM), whereby rating endorsements ≥ 3 (moderately bothersome) on key Diagnostic and Statistical Manual of Mental Disorders, 4th Edition (DSM-IV)-defined clusters (comprising one “re-experiencing item,” three “numbing/avoidance” items, and two “hyperarousal” items) indicate symptoms suggestive of PTSD. 72
RPQ
The current project examined three configurations of the RPQ: the RPQ-3, a composite of the headache, dizziness, and nausea items, intended to reflect an acute cluster of post-concussive symptoms; the RPQ-13, a composite of the items not included in the RPQ-3 and which reflect a separable cluster of symptoms; and each item-level symptom (e.g., headache, dizziness, nausea). 73 Individual item cut points for clinical significance were set at ≥ 2, where ratings of 2, 3, and 4 indicate that the symptom is mildly, moderately, or severely more problematic than compared with pre-injury, respectively. 74
SWLS
A SWLS score of 20 is considered the “neutral” point below which participants are considered “unsatisfied” with life to varying degrees; therefore, the current project used a cut score of ≤ 19 to indicate general dissatisfaction with life. 50,62 Additionally, SWLS raw scores were converted to z scores using published normative ratings and dichotomized into impairment groups (impairment defined as z ≤ −1.33, or roughly the lower ninth percentile). A normative reference value of M (SD) = 23.96 (6.33) was derived by averaging normative values across seven published healthy adult samples, 62,75 –79 all of which reported highly consistent distributions of SWLS ratings across demographic groups. 78
Statistical analysis
The two main objectives of the analyses were to describe the sample's 6-month clinical outcomes and to report on convergence versus divergence between the GOSE and other outcome measures. To understand potential patterns of bias in reported rates of neuropsychological and functional impairment, completion rates of the Outcome CDEs were computed, and patterns of missingness on the GOSE and CVLT-II at 6 months were examined using select demographic, acute injury, and 3-month recovery measures. Analyses were conducted using Statistical Package for the Social Sciences (SPSS; IBM) v. 24. 80 Significance was assessed at α = 0.05 unless otherwise specified.
Descriptive statistics for the GOSE are presented at 3 and 6 months (Fig. 2). Other outcome variables, however, are reported only at the 6-month time-point. As 6 months was the major outcome assessment of interest in the study, this was the time-point at which the most complete set of outcome measures was collected on the full sample. Outcome data on the subsample of patients who completed a 12-month assessment has been published elsewhere. 50
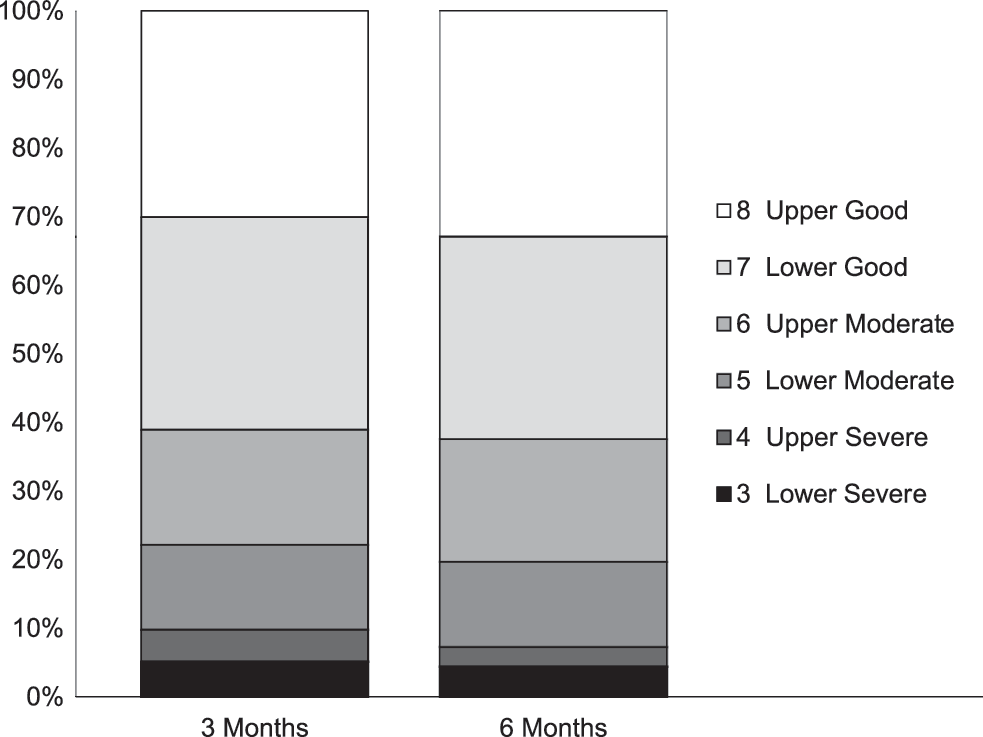
Distribution of valid cases per the Glasgow Outcome Scale-Extended (GOSE) categories 3–8 at 3 and 6 months. N with GOSE outcome data was 456 at 3 months and 415 at 6 months (of 586 subjects enrolled).
The distributional properties of Demographic, Clinical Assessment, and Outcome CDEs are reported in Tables 3 and 4. Descriptive statistics for categorical CDEs are presented in frequencies (percentages); continuous CDEs are summarized with M (SD). Outcome measures for which raw scores were converted to standard scores, index scores, T scores, or z scores for analysis are noted in the CDE descriptions above. To yield clinically interpretable data on the outcome measures, continuous measures were dichotomized into impaired/not impaired categories. For neuropsychological measures with widely accepted normative reference groups (CLVT-II, WAIS-IV PSI, TMT, BSI-18), we selected a common cutoff corresponding to the ninth percentile of the normative distribution (operationalized as T ≤ 37 or ≥ 63, z ≤ −1.33, or standard score [SS] ≤ 79 depending on how each measure was scaled). This was done to align expected base rates of impairment (i.e., at 9%) between measures as much as possible. For measures without established normative reference groups (RPQ, SWLS, PCL-C), empirically established or recommended cut scores were used and rates of impairment in published non-TBI samples were presented for comparison with the current data. See the Note to Table 4 for citations to the reference samples used to facilitate interpretation of the current study data.
RPQ item-level base rates reflect percent of normal sample reporting presence of symptoms on RPQ rating categories ≥ 2. 74
Base rate of life dissatisfaction for adult, community-based samples per Isoaho. 101
SWLS normative M = 23.96 (SD = 6.33) represents the average SWLS score reported across seven normal/healthy adult samples. 62,75 –79
A review of eight studies 102 –109 that used the PCL-C (M = 34.58; average cut score 36.29) on primary care, non-TBI samples indicated that the average base rate of PTSD is 19.7%. This estimate falls within the reported range of PTSD prevalence for TBI groups of 16–39%. 110
Calculated according to DSM-IV criteria of at least one of five re-experiencing symptoms, three of seven avoidance symptoms, and two of five increased arousal symptoms. 72
A review of five studies 106,108,111 –113 that evaluated prevalence of PTSD in community and primary care samples using the PCL (M = 33.79) indicated that the base rate of PTSD when using the SCM method is 14.2%. This falls below the reported range of prevalence (16–39%) for TBI samples. 110
BSI-18, Brief Symptom Inventory (18 item); CDE, common data element; CHART, Craig Handicap Assessment and Reporting Technique Short Form; CVLT-II, California Verbal Learning Test–Second Edition; DSM-IV, Diagnostic and Statistical Manual of Mental Disorders, 4th edition; PCL-C, Post-traumatic Stress Disorder Checklist–Civilian Version; M, mean; RPQ, Rivermead Post-Concussion Symptoms Questionnaire; SD, standard deviation; SWLS, Satisfaction With Life Scale; TMT, Trail Making Test; WAIS-IV, Wechsler Adult Intelligence Scale–Fourth Edition.
Associations between outcome measures and acute measures of injury severity were computed using Pearson's r for associations between continuous CDEs, Spearman's rho for associations in which one CDE was ordinal, and Pearson's r pb (point biserial) for associations in which one CDE was dichotomous. 81 For illustrative purposes, the percentages of cases scoring above thresholds for clinical significance/impairment was also presented at each level of GOSE outcome.
Results
Sample characteristics and loss to follow-up
Frequencies (percentages) and M (SDs) of the demographic and clinical assessment CDEs for the full sample (n = 586) and subsample of patients who completed the 6-month GOSE (n = 415) are presented in Table 3. Because other outcome CDEs were only administered at in-person assessments, sample sizes (completion rates) were lower, ranging from 46.4–59.7% (Table 3). The 6-month GOSE sample comprised mostly adults ranging from 16–94 years of age (M = 44.42, SD = 18.93) who were predominantly male (69.4%), Caucasian (81.0%), and who had completed high school (54.0%) or some college (31.6%). Level of injury severity for this group per GCS ranged from severe (GCS 3–8; 15.2%) to mild (GCS 13–15, 78.6%). Of the subjects who completed the GOSE at 6 months, 47.2% had a head CT positive for acute intracranial findings. This constituted 88.4% of the 86 subjects with a GCS score of 3–12 and 36.2% of the 326 subjects with an initial GCS of 13–15.
A missing values analysis indicated that the increased missingness on the GOSE across time was systematic (Little's p = 0.049). Binary logistic regressions were conducted to determine whether demographic factors or markers of acute injury severity (GCS, positive CT, ISS, head-and-neck AIS) predicted missingness (Y/N) on the 6-month GOSE. Overall, patients with more severe injuries were more likely to complete the 6-month GOSE assessment. In particular, completion of the GOSE was predicted by severe TBI (GCS 3–8 vs. 13–15; odds ratio [OR] = 4.25, p < 0.001), higher ISS (OR = 1.03, p = 0.002), and AIS head/neck scores ≥ 3 (vs. <3; OR = 1.65, p = 0.006). Additionally, older subjects (OR = 1.01, p = 0.026) and those with more years of education (OR = 1.12, p = 0.001) were more likely to complete the 6-month GOSE. A number of other variables did not predict completion of the GOSE: gender (p = 0.080), race (p = 0.218), pre-injury employment type (p = 0.477), having returned to work at 3 months (p = 0.286), having been in rehabilitation at 3 months (p = 0.152), or family strain at 3 months (p = 0.878). Given the non-random patterns of missingness on this measure, the distribution of disability ratings on the GOSE should be interpreted with caution.
Completion of the other clinical outcome CDEs at 6 months was not predicted by initial severity. For example, although younger subjects (OR = 1.01, p = 0.028) and those with more education (OR = 1.08, p = 0.012) were somewhat more likely to have 6-month CVLT-II data, (Results of the missing values analysis indicated that missing values for the CVLT-II subscales used in the current project were missing completely at random (Little's p = 0.345)) no other acute injury or demographic variables significantly predicted CVLT-II completion. Pre-injury employment status was marginally predictive (p = 0.054), such that patients who were working full-time prior to their injury were nearly 2 times more likely to complete the CVLT-II at 6 months than patients who were pre-morbidly retired or disabled from working (OR = 1.86, p = 0.007).
Descriptive statistics for multi-dimensional clinical outcomes
Global level of function (GOSE)
Of the 415 subjects with a 6-month GOSE score, 28 (6.7%) were coded as dead (GOSE = 1) and 1 (0.2%) as in a vegetative state (GOSE = 2). Figure 2 presents the percentage of the sample at each time-point (3 and 6 months) that falls in the other six outcome categories (i.e., 3 = Lower Severe, 4 = Upper Severe, 5 = Lower Moderate, 6 = Upper Moderate, 7 = Lower Good, 8 = Upper Good). The percentage of this subsample that achieved Good Recovery (GOSE = 7 or 8) at 3 and 6 months was 61.1% and 62.4%, respectively. The percentage of this subsample of patients who were classified as having Moderate Disability (GOSE = 5 or 6) at 3 and 6 months was 29.1% and 30.3%, respectively. The percentage of this subsample of patients classified as having Severe Disability (GOSE = 3 or 4) at 3 and 6 months was 9.8% and 4.2%, respectively.
Neuropsychological impairment (CLVT-II, TMT, WAIS-IV PSI)
Table 4 presents descriptive statistics for the remaining clinical outcome variables at 6 months. To facilitate interpretation, these measures were dichotomized into impaired (vs. not impaired) categories, with impairment defined as the ninth percentile of the measure's normative reference group. The proportion of the sample meeting criteria for neurocognitive impairment at 6 months ranged from 10.2% (WAIS-IV PSI) to 27.6% (TMT Part A) across cognitive domains/measures (TMT Part B = 26.1%). Rates of impairment in verbal memory were in between these other measures (M = 14.7% across the six CLVT-II indices).
Psychological status (BSI-18, PCL-C)
The percentage of the sample falling above the clinical cutoff for significant emotional distress (T ≥ 63, roughly the most impaired 9% of the normative sample) ranged from 13.1% for BSI-18 Anxiety and Depression subscales to 16.9% for Somatization symptoms (GSI = 16.0%). The percentage of the sample with symptoms suggestive of PTSD (per responses to the PCL-C) was 24.0–51.2% depending on the criterion used to define probable PTSD, both much higher than rates reported from general primary care populations (14.2–19.7%; see Note in Table 4 for the source of comparison data).
TBI-related symptoms (RPQ)
The M (SD) symptom severity score was 1.83 (2.58) for the RPQ-3 and 11.52 (12.29) for the RPQ-13. Across all 16 items, the percentage of participants who endorsed one or more TBI-related symptoms at 6 months at the mild or higher level (rating of 2–4) was 73.5%. The percentage who endorsed one or more symptoms at the moderate or higher (3–4) and severe (4) levels was 52.1% and 27.4%, respectively. The most common symptoms endorsed (at a mild or higher level) were forgetfulness/poor memory (47.4%), taking longer to think (42.4%), irritability/anger (37.9%), frustration/impatience (37.9%), and headache (30.9%). The least commonly endorsed symptoms were double vision (9.4%), nausea (12.6%), and depression/tearfulness (17.2%). The rates of symptom endorsement were higher than the base rates in non-TBI (healthy) adults 74 for 14 of the 16 symptoms (see Table 4).
Quality of life (SWLS)
A large minority of the sample (41.5%) reported general dissatisfaction with life at 6 months (i.e., SWLS Total Score ≤ 19). Using available normative data from healthy adult populations (see Note in Table 4), 23.1% of the sample scored over the cutoff for clinically significant problems with life satisfaction.
Correlations between acute injury and clinical outcome variables
Correlations between clinical outcome measures and acute measures of injury severity (ISS, GCS, LOC duration, PTA duration, AIS Head/Neck ≥ 3) are presented in Table 5. Correlations between acute injury variables and GOSE scores were generally small to medium in magnitude (range 0.18–0.39) and were uniformly in the expected direction. For example, higher ISS score, lower acute GCS score, and more prolonged LOC and PTA duration were associated with poorer functional recovery (i.e., lower GOSE score). Correlations between acute injury variables and verbal memory (CVLT-II) scores were also small (range 0.08–0.25) and in the expected direction (more severe injury associated with lower memory performance at 6 months). Correlations between injury variables and other outcome measures (e.g., TMT, RPQ, BSI-18) were weaker and less consistent.
p < 0.05; ** p ≤ 0.01; *** p ≤ 0.001. Coefficients Spearman's rho (ordinal × ordinal/continuous) or Pearson's point-biserial r (dichotomous × ordinal/continuous).
AIS, Abbreviated Injury Scale; BSI-18, Brief Symptom Inventory (18-item); CDE, common data element; CHART, Craig Handicap Assessment and Reporting Technique Short Form; CVLT-II, California Verbal Learning Test–Second Edition; GCS, Glasgow Coma Scale; GOSE, Glasgow Outcome Scale–Extended; ISS, Injury Severity Score; LOC, Loss of consciousness; PCL-C, Post-Traumatic Stress Disorder Checklist–Civilian Version; PTA, post-traumatic amnesia; RPQ, Rivermead Post-Concussion Symptoms Questionnaire; SWLS, Satisfaction With Life Scale; TMT, Trail Making Test; WAIS-IV, Wechsler Adult Intelligence Scale–Fourth Edition.
Association between clinical outcome variables
Correlations between the clinical outcome measures at 6 months are presented in Table 6. These associations were generally in the expected direction and small to medium in magnitude. With regard to neurocognitive outcome measures, higher GOSE score was associated with better memory (GOSE vs. CVLT-II, Spearman's ρ = 0.17–0.24), processing speed (GOSE vs. WAIS-IV PSI, ρ = 0.30), and executive functioning (GOSE vs. TMT Part B, ρ = 0.23) at 6 months. With regard to self-report outcome measures, higher GOSE score was associated with lower emotional distress (e.g., GOSE vs. BSI-18 GSI, Pearson r = −0.52), lower TBI symptom burden (e.g., GOSE vs. RPQ-3/RPQ-13, r = −0.44 to −0.64), and better satisfaction with life (GOSE vs. SWLS, r = 0.42). On average, GOSE score correlated more strongly with self-report/symptom-based outcome measures (M ρ = 0.49) than neurocognitive measures (M ρ = 0.21). (Individual correlations were converted to Fisher z scores, averaged, and then converted back to the M r values reported, as suggested by Corey and colleagues. 96 ) Box plots depicting the distributions of scores on the CVLT-II (trials 1–5), BSI-18 GSI, RPQ (3-item), and SWLS stratified by GOSE score are presented in Figure 3.
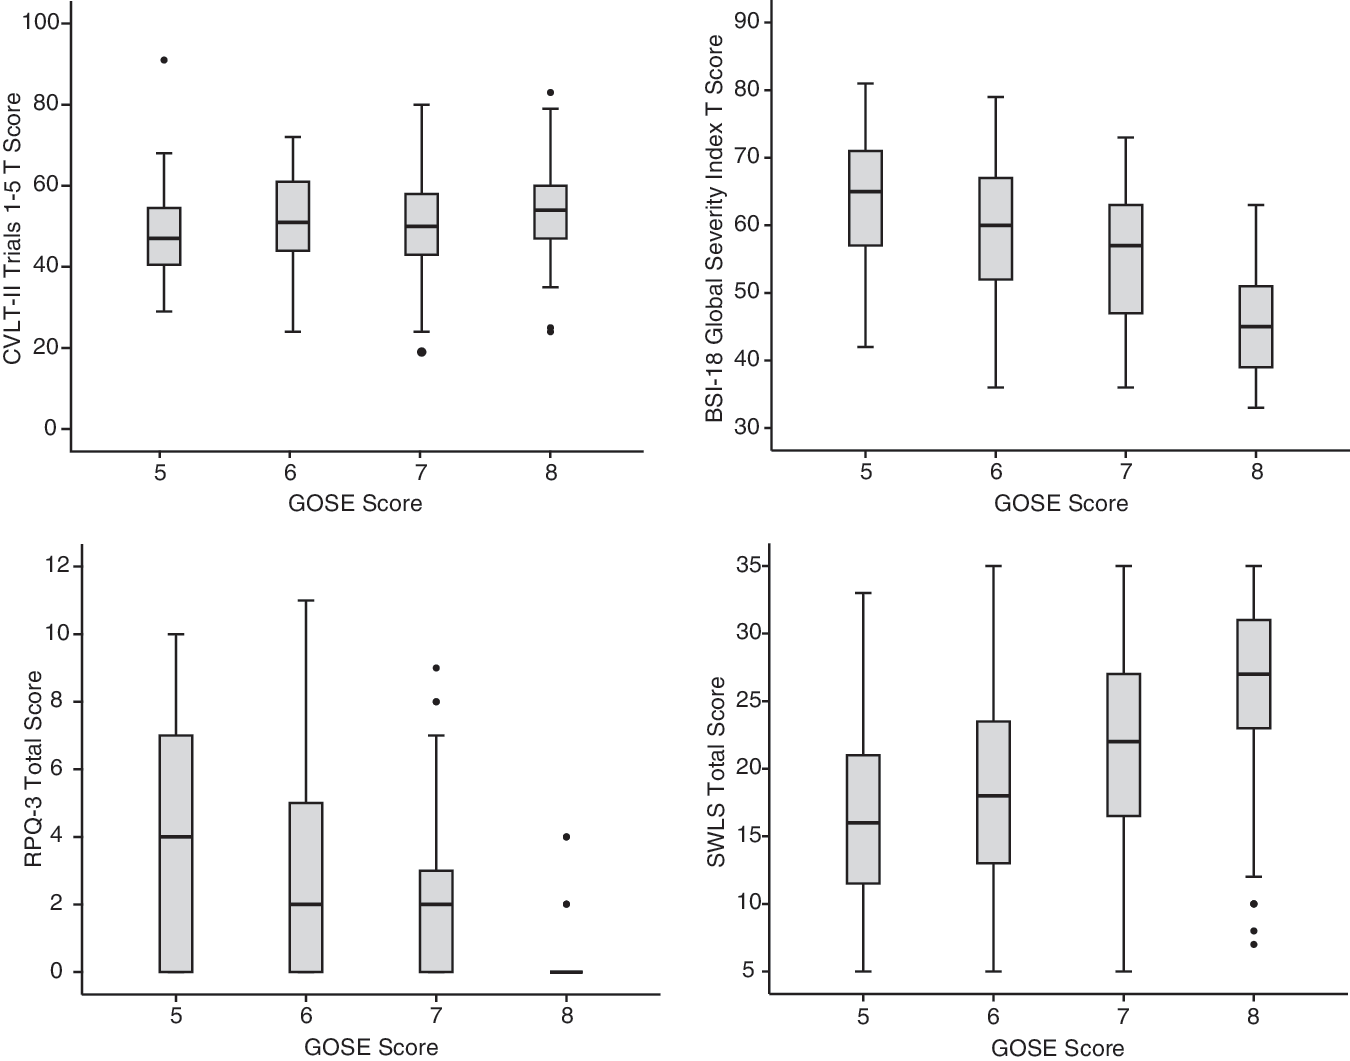
Distribution of select 6-month outcome measures stratified by Glasgow Outcome Scale-Extended (GOSE) score. Top left: California Verbal Learning Test-Second Edition (CVLT-II) Trials 1–5 T score. Top right: Brief Symptom Inventory-18 (BSI-18) Global Severity Index T score. Bottom left: 3-item Rivermead Post-Concussion Symptom Questionnaire (RPQ) total score. Bottom right: Satisfaction with Life Scale (SWLS) total score.
p ≤ 0.05. All coefficients are Pearson's r except for GOSE (Spearman's rho).
BSI-18, Brief Symptom Inventory (18 item); CDE, common data element; CHART, Craig Handicap Assessment and Reporting Technique Short Form; CVLT-II, California Verbal Learning Test–Second Edition; DSM-IV, Diagnostic and Statistical Manual of Mental Disorders, 4th edition; PCL-C, Post-Traumatic Stress Disorder Checklist–Civilian Version; RPQ, Rivermead Post-Concussion Symptoms Questionnaire; SWLS, Satisfaction With Life Scale; TMT, Trail Making Test; WAIS-IV, Wechsler Adult Intelligence Scale–Fourth Edition.
Table 7 presents the prevalence of impairment in neuropsychological, psychological, and quality-of-life outcomes stratified by GOSE score. Participants with severe functional recovery (GOSE 3 or 4) were excluded due to small cell sample sizes. For participants within the Upper Good Recovery group (GOSE 8), there was a relatively low prevalence of impairment on other clinical outcome variables. For example, within this subgroup the mean percentage of patients with processing speed (WAIS-IV PSI) and memory (CVLT-II) impairment was below base rates (WAIS-IV PSI = 3.2%; CVLT-II, M = 7.8%). However, 19.0% of these individuals met criteria for executive dysfunction (TMT Part B, T ≤ 63). Similarly, the sample coded as GOSE 8 had a relatively low prevalence of problems with emotional distress, TBI symptoms, and life dissatisfaction. On the other hand, higher prevalences of emotional and neurocognitive impairment were observed in the Lower Good Recovery (GOSE 7) group. Within this group, for example, a higher percentage of participants met criteria for memory impairment (CVLT-II, M = 14.7%), executive dysfunction (TMT Part B, 23.0%), emotional distress (BSI-18 GSI, 28.8%), poor life satisfaction (SWLS, 23.3–40.8% depending on the criterion), high PTSD symptoms (24.3–35.9% depending on the PCL-C criterion), and persistent TBI symptoms (e.g., 36.9% headache, 31.1% dizziness, 49.5% poor concentration). Finally, the prevalence of neuropsychological impairment and psychological distress in the lower GOSE (5 and 6) groups was striking on some measures. For example, over half of the sample (52.2%) within the Lower Moderate Disability group (GOSE 5) met criteria for probable DSM-IV PTSD, whereas this percentage dropped with each subsequent boost in GOSE score (i.e., 41.3%, 24.3%, and 2.8% of individuals in the GOSE 6, 7, and 8 groups, respectively).
BSI-18, Brief Symptom Inventory (18 item); CDE, common data element; CHART, Craig Handicap Assessment and Reporting Technique Short Form; CVLT-II, California Verbal Learning Test–Second Edition; DSM-IV, Diagnostic and Statistical Manual of Mental Disorders, 4th edition; PCL-C, Post-Traumatic Stress Disorder Checklist–Civilian Version; PSI, Processing Speed Index; RPQ, Rivermead Post-Concussion Symptoms Questionnaire; SWLS, Satisfaction with Life Scale; TMT, Trail Making Test; WAIS-IV, Wechsler Adult Intelligence Scale–Fourth Edition.
Discussion
The GOSE has long been the gold-standard primary outcome measure in clinical treatment trials of TBI. In this analysis of participants enrolled in the TRACK-TBI Pilot Study, outcome measures from each domain in the multi-dimensional assessment battery correlated significantly and in the expected directions, lending support for the convergent validity of each measure and suggesting that this diverse set of measures of day-to-day functioning (GOSE), cognitive functioning (CVLT-II, WAIS-IV PSI, TMT), emotional symptoms (BSI-18, RPQ, PCL-C), and quality of life (SWLS) tap into the common overarching construct of global TBI outcome. In particular, better functional recovery (higher GOSE score) was associated with better neurocognitive performance (i.e., memory, processing speed, executive functioning), lower symptom burden (including TBI and psychiatric symptoms), and better quality of life.
On the other hand, the magnitude of correlations between the GOSE and other outcome measures was rather modest (M ρ = 0.21 between GOSE and objective neurocognitive performance measures and M ρ = 0.49 between GOSE and self-reported measures of emotional functioning and quality of life). This implies that a great deal of unique information is available about individuals' recoveries when looking across these measures rather than focusing on a single global measure (e.g., the GOSE).
Importantly, we found striking differences in the multi-dimensional outcomes of the subsample of subjects in the best (Upper Good Recovery, GOSE 8) outcome category versus those within the Lower Good Recovery (GOSE 7) category. Indeed, the GOSE 8 subgroup looked relatively healthy across most other outcome domains. An exception to this was the nearly 20% of the sample in the GOSE 8 group who showed objective evidence of impairment in executive functioning (as reflected in poor performance on the TMT). More striking is the large percentage of subjects falling within the GOSE 7 category who were impaired on one or more objective neurocognitive or subjective self-report outcome measures. For example, within the GOSE 7 group, prevalence rates of impairment in verbal memory (CVLT-II, M = 14.7%) and executive functioning (TMT, B = 23.0%) were above the base rates (9%) given the thresholds selected to determine impairment, implying persistent neurocognitive disability related to TBI. Similarly, rates of significant emotional distress and low quality of life were relatively high in this subsample, with about a quarter showing clinically significant elevations in general distress (BSI-18 GSI, 28.8%), life dissatisfaction (SWLS, 23.3%), and PTSD symptoms (PCL-C, 24.3%), and higher percentages of subjects reporting persistent issues with specific symptoms (e.g., 58.3% perceived at least mild memory deficits). The striking difference in neuropsychological health between the GOSE 7 versus GOSE 8 groups supports the separation of these “Good Recovery” groups.
An implication of these findings is that the common practice to dichotomize GOSE scores between the Moderate Disability (GOSE 5–6) and Good Recovery categories (7–8), or at lower GOSE levels, results in the mislabeling of a number of subjects as achieving the best possible recovery, when in fact they appear impaired on more detailed neuropsychological outcome measures. These data suggest that dichotomizing GOSE scores between the levels of 7 (Lower Good Recovery) and 8 (Upper Good Recovery) would more accurately classify only the healthiest subjects as truly achieving maximal recovery. This might also reduce the ceiling effects that have been reported to diminish statistical power to detect treatment effects in studies that used the GOSE as a primary outcome measure. 82 An alternative approach that has been suggested has been to move away from analyses that require the GOSE to be dichotomized (i.e., logistic regression) and instead to adopt statistical approaches that retain the multi-level ordinal scale of the measure. Indeed, there is evidence that leveraging the expanded score range of the GOSE (vs. the GOS) using ordinal analyses increases the efficiency of the measure and thereby reduces the sample sizes needed to detect significant treatment effects. 83 In practice, however, lesser known statistical approaches appropriate for ordinal variables can be challenging to implement and interpret. The most appropriate analyses for GOSE data are advanced nonparametric techniques, 84,85 such as the sliding dichotomy or proportional odds model. 65 The sliding dichotomy approach, however, requires a validated prognostic model by which to determine a patient's baseline prognostic risk, 86 and the proportional odds model carries a set of assumptions that are often difficult to meet. 87 –93
A third approach would be to use alternative outcome variables such as those measured on an interval scale, for which more accessible and potentially more powerful statistical analyses (e.g., linear regression) are available. Newer measures of functional/global outcome (e.g., the Functional Status Examination) show promise for quantifying the same domain of functioning as the GOSE but with a more dimensional/interval scale. 47,94 But given the imperfect overlap between functional, neurocognitive, and emotional outcomes, 16,21,29 –35,37 any approach that focuses on only one outcome domain will fail to capture the full story of recovery after TBI. Looking at any one outcome measure, the current study sample was functioning relatively well at 6-months post-injury in that only a minority of the overall sample was impaired on any one outcome measure. On some measures (e.g., the CVLT-II and WAIS-IV PSI), estimated impairment prevalences may have been underestimated due to demographic differences between the study sample and the normative samples for the tests. (The study sample comprised higher mean education levels and somewhat more Caucasian participants than were in the normative reference groups for the CVLT-II and WAIS-IV, which could be expected to lead to underestimates of impairment percentages than would have been obtained with better demographic matching between study and normative groups. Additionally, in scoring the TMT, the need to truncate study subjects' ages to match the range of the available normative sample (age 20–79) may have contributed to error in the estimation of impairment rates on this tests.) Nevertheless, these findings raise the possibility that alternative outcome measures could display similar ceiling effects as the GOSE. In addition to continuing to explore alternative outcome measures, it may be valuable to develop and test approaches that aggregate information from multiple outcome domains to better capture the multi-dimensional nature of TBI recovery and to increase the sensitivity of an outcome variable to residual disability.
One possible argument for prioritizing outcome measures of day-to-day functioning (e.g., the GOSE) is that one's engagement in normal day-to-day activities is a straightforward, relatively “objective” index of injury recovery. Given this assumption, it is interesting that GOSE scores correlated robustly with self-report measures of emotional functioning (M ρ = 0.49) and that these correlations were significantly stronger than what was achieved between GOSE scores and objective neurocognitive measures (M ρ = 0.21). To some degree, this may reflect method bias given that the GOSE and emotional variables are assessed from more similar modalities (self-report vs. interview) than are cognitive performance variables. 95 But given the distinction between the content assessed by the GOSE and emotional outcome variables, their strong association may also suggest that the GOSE is more sensitive to emotional than cognitive factors. The broader TBI literature has reported an important (and perhaps bidirectional) association between emotional functioning and day-to-day functioning. 16,21,96,97 This is consistent with the documented direct and indirect effects of TBI on emotional functioning, 98 –100 and implies that association (or lack thereof) between an outcome measure and self-reported emotional functioning should not necessarily be a factor in determining the validity of an outcome variable.
A major limitation of this study was the high rate of loss to follow-up and non-random pattern of missingness of the outcome measures. Although the GOSE was completed at a higher rate than the neuropsychological outcome measures, completion of the GOSE was more closely related to acute markers of injury severity, implying potentially more bias in the distribution of 6-month outcomes for this measure in particular. Additionally, direct comparison of impairment rates across neurocognitive tests may be problematic due to the different normative reference groups used for each measure and the imperfect matching of the study sample and normative reference groups for measures. Given these issues, the absolute prevalence rates of impairment presented here should be interpreted cautiously. Replication of these analyses in samples with higher follow-up rates, with additional outcome measures, and with more precise adjustment of neurocognitive data to relevant normative comparison groups, such as orthopedic trauma controls, would be valuable. Although a strength of the TRACK-TBI Pilot Study was its adherence to the TBI CDE, given that some outcome domains (e.g., quality of life, TBI symptoms) were only measured using one primary measure, these data cannot address to what degree these measures are performing as expected or optimally to assess their respective target constructs. Studies that include multiple measures from the key outcome domains will be useful to verify instrument performance and to make empirically supported recommendations regarding how to adjust the CDEs over time.
Although the TBI research field has historically placed significant emphasis on patients' “global” or “functional” recovery as measured by the GOS/GOSE, an integrated approach to assess outcome across functional domains, such as neurocognitive and emotional functioning, provides a more granular understanding of patient recovery after TBI. The current study highlights that a significant minority of patients who appear to have recovered relatively well using the GOSE can be classified as impaired on other outcome measures. Given the complex nature of recovery and the lack of success of prior treatment trials for TBI (as is reflected in the ongoing TBI Endpoints Development Initiative), 27 additional work is needed to improve upon the GOSE's measurement of functional outcome and to consider alternative end-points for clinical trials. Ongoing large-scale prospective studies (e.g., TRACK-TBI) will provide a host of novel outcome data that will significantly inform the refinement and selection of key clinical outcome measures for the TBI research field.
Footnotes
Acknowledgments
This work was supported by the National Institutes of Health (grant nos. RC2 NS0694909 [to G.T.M.], RC2 NS069409-02S1 [to G.T.M.], and R03 NS100691-01 [to L.D.N.]) and the Department of Defense (USAMRAAW81XWH-13-1-0441; to G.T.M.); Registry:
The additional TRACK-TBI investigators are as follows: Shelly R. Cooper, BA (Department of Neurological Surgery, University of California, San Francisco, San Francisco, CA); Kristen Dams-O'Connor, PhD (Department of Rehabilitation Medicine, Icahn School of Medicine at Mount Sinai, New York, NY); Wayne A. Gordon, PhD (Department of Rehabilitation Medicine, Icahn School of Medicine at Mount Sinai, New York, NY); Andrew I. R. Maas, MD, PhD (Department of Neurological Surgery, University Hospital Antwerp, Antwerp, Belgium); Amy J. Markowitz, JD (Department of Neurological Surgery, University of California, San Francisco, San Francisco, CA); David K. Menon, MD, PhD (Departments of Anaesthesia and Neurocritical Care, University of Cambridge, Cambridge, United Kingdom); Pratik Mukherjee, MD, PhD (Department of Radiology, University of California, San Francisco, San Francisco, CA); Ava M. Puccio, RN, PhD (Department of Neurological Surgery, University of Pittsburgh Medical Center, Pittsburgh, PA); Mary J. Vassar, RN, MS (Department of Neurological Surgery, University of California, San Francisco, San Francisco, CA); John K. Yue, BA (Department of Neurological Surgery, University of California, San Francisco, San Francisco, CA); Esther L. Yuh, MD, PhD (Department of Radiology, University of California, San Francisco, San Francisco, CA).
Author Disclosure Statement
Dr. Nelson reports grants from NIH and the Medical College of Wisconsin's Center for Patient Care and Outcomes Research, Clinical and Translational Science Institute, and Advancing a Healthier Wisconsin Endowment during the conduct of the study. Dr. Ranson has nothing to disclose. Dr. Ferguson reports grants from the NIH (R01NS067092, R01NS088475), the VA (1I01RX002245), the Craig H. Neilsen Foundation, and Wings for Life during the conduct of this study. Dr. Giacino reports grants from the Department of Defense, NIH, NIDILRR, James S. McDonnell Foundation and other support from the Barbara Epstein Foundation during the conduct of the study. Dr. Okonkwo reports grants from NIH and the Department of Defense during the conduct of the study. Dr. Valadka has nothing to disclose. Dr. Manley reports grants from the Department of Defense, NIH, and other support from One Mind, Palantir, and Johnson & Johnson Family of Companies/DePuySynthes/Codman Neuro during the conduct of the study. Dr. McCrea reports grants from the Department of Defense, National Collegiate Athletic Association, and National Football League during the conduct of the study.