




Abstract
Ethanol intoxication (EI) is a frequent comorbidity of traumatic brain injury (TBI), but the impact of EI on TBI pathogenic cascades and prognosis is unclear. Although clinical evidence suggests that EI may have neuroprotective effects, experimental support is, to date, inconclusive. We aimed at elucidating the impact of EI on TBI-associated neurological deficits, signaling pathways, and pathogenic cascades in order to identify new modifiers of TBI pathophysiology. We have shown that ethanol administration (5 g/kg) before trauma enhances behavioral recovery in a weight-drop TBI model. Neuronal survival in the injured somatosensory cortex was also enhanced by EI. We have used phospho–receptor tyrosine kinase (RTK) arrays to screen the impact of ethanol on TBI-induced activation of RTK in somatosensory cortex, identifying ErbB2/ErbB3 among the RTKs activated by TBI and suppressed by ethanol. Phosphorylation of ErbB2/3/4 RTKs were upregulated in vGlut2+ excitatory synapses in the injured cortex, including excitatory synapses located on parvalbumin (PV)-positive interneurons. Administration of selective ErbB inhibitors was able to recapitulate, to a significant extent, the neuroprotective effects of ethanol both in sensorimotor performance and structural integrity. Further, suppression of PV interneurons in somatosensory cortex before TBI, by engineered receptors with orthogonal pharmacology, could mimic the beneficial effects of ErbB inhibitors. Thus, we have shown that EI interferes with TBI-induced pathogenic cascades at multiple levels, with one prominent pathway, involving ErbB-dependent modulation of PV interneurons.
Introduction
B
Clinical data have shown that ethanol intoxication (EI) is a potential modifier of TBI outcome. EI is detected in up to 55% patients admitted for TBI, with the great majority of patients displaying a binge-drinking pattern (i.e., not being chronic alcoholics). 3,6 Surprisingly, positive blood-alcohol level (BAL) has been associated with a better outcome of TBI, 7 –12 although not in all studies. 13,14 In particular, Berry and colleagues reported BAL >230 mg/dL as being strongly associated with reduced mortality in moderate-to-severe TBI. 10 Likewise, patients with positive BAL showed a faster recovery of neurocognitive functions, 15 although other studies found detrimental or no effect. 16,17
Interaction between EI and TBI has been investigated in experimental models utilizing different TBI models and different schedules of ethanol administration: ethanol administration before a fluid percussion injury 18 or three-dose ethanol administration before and after controlled cortical impact (in rats) 19 worsened sensorimotor recovery, whereas single-dose ethanol administration soon after blunt TBI 12 or before blunt TBI, 20 contusive TBI, 21 or controlled cortical injury 22 lead to faster recovery. Thus, EI may provide context-dependent beneficial effects in TBI, offering an entry point to understanding board- or subtype-specific targets of intervention.
Mechanistic understanding of EI influence on TBI is limited: EI at the instance of trauma modulates the neuroinflammatory cascade, reducing production of proinflammatory cytokines and enhancing secretion of interleukin (IL)-13, 20,23 although it is also reported to increase brain edema. 24 Nevertheless, EtOH pharmacological spectrum of activities include antagonistic effects on N-methyl-D-aspartate receptor (NMDAR) 25 and agonistic effects on gamma-aminobutyric acid (GABA) receptor, 26 suggesting that EI may affect multiple, distinct sets of biological functions in neurons, astrocytes, and immune cells (such as synaptic plasticity, proliferation, and inflammation) at once.
At the molecular level, these functions are mediated and orchestrated (although not exclusively) by a set of receptor tyrosine kinases (RTKs), including, among many, the ErbB family and Trk family receptors (involved in synaptic plasticity and astrocyte proliferation), 27 –29 Axl/Dtk/Metk receptors (affecting microglia physiology), 30 and EphA and EphB family receptors (modulating astrocyte responses). 31 Because distinct sets of RTKs control different biological responses and structures (synaptic plasticity, astroglial responses, and neurovascular unit), 28,31 –34 monitoring the activation status of such receptors make it possible to probe the ongoing cellular responses elicited by TBI and the combination of EI and TBI. In particular, activation of the ErbB family RTKs provides an entry point to the excitation/inhibition balance in the affected cortex: In fact, ErbB family members are expressed on inhibitory interneurons, 35 –37 where they control the strength of excitatory synapses. 27,38 Among the inhibitory interneurons, ErbB receptors are prominent regulators of parvalbumin-positive (PV) Interneurons 39,40 and thus provide an entry point to the effects of EI and TBI on perisomatic inhibition and cortical excitability. 41
Therefore, we monitored the impact of EI on behavioral and histological consequences of TBI and exploited an array of antibodies directed against phosphorylated RTKs to identify the pattern of RTK activation in TBI and how this was influenced by EI. Because of the highly dynamic nature of phosphorylation events, this approach provided a more direct sampling of the ongoing signaling compared to gene-transcription profiling. In addition, because RTKs are targeted by a growing number of small molecules approved for human use (e.g., see a previous work 42 ), they provide opportunities for drug repurposing in TBI.
We have demonstrated that EI accelerates neurological recovery and ameliorates the histological damage caused by TBI. The RTK array analysis revealed that EI prevented the TBI-induced phosphorylation of several RTKs and, in particular, the ErbB family. We have demonstrated that phosphorylated ErbB family members are localized in vesicular glutamate transporter 2 (vGlut2) synapses on inhibitory neurons, and that neuroprotective effects of EI can be partially recapitulated by pharmacological modulation of ErbB or by chemogenetic control of PV interneurons.
Methods
Animals, ethanol administration, and traumatic brain injury model
The experiments described were approved by the local veterinary and animal experimentation service under the license n.1222 and successive integration. B6 mice were bred locally (Ulm University, Ulm, Germany) under standard husbandry conditions (24°C, 60–80% humidity, 14/10 light/dark cycle, with ad libitum access to food and water). B6/PV-Cre mice were a kind gift of Pico Caroni (FMI, Basel, Switzerland) and were bred locally (Ulm University) under the same conditions. Experimental data are reported from a total of 194 mice from an overall cohort of 224 mice (with 30 mice experiencing acute mortality or meeting termination criteria, see below). Experimental groups and mice allocations for each group with respective readouts are summarized in Supplementary Table 1 (see online supplementary material at
Immediately after the experimental TBI, animals were administered 100% O2 and were monitored for apnea time. After spontaneous breathing was restored, scalp skin of anesthetized mice was stitched with Prolene 6.0 surgical thread and animals were transferred to a warmed recovery cage (single-housed) with ad libitum access to food and water. Additional doses of buprenorphine were administered every 12 h for the following 24 h post-injury. For sham-surgery, mice were subject to the same procedures and treatments (anesthesia, skin opening and closure, handling, and positioning in the TBI apparatus), but no trauma was delivered.
To avoid unnecessary suffering of mice, their general state was checked regularly using a score sheet developed for TBI determining fixed termination criteria. Effort was made to minimize animal suffering and reduce the number of necessary animals.
Phospho–receptor tyrosine kinase screening
For the screening of RTK activation pattern, a single time point (3 h) was considered and four experimental groups were included: 1) saline-sham (n = 8); 2) ethanol-sham (n = 5); 3) saline-TBI (n = 7); and 4) ethanol-TBI (n = 5). Mice were sacrificed 3 h after TBI (or sham surgery) by cervical dislocation and the brain was quickly dissected in ice-cold phosphate-buffered saline (PBS). Cortex samples 1.5–2.0 mm in diameter were dissected from the parietal lobe (somatosensory area) and snap-frozen. In order to obtain cortical protein extracts, cortical samples were thawed in homogenization buffer (1 × Lysis Buffer; CST; 20 of mM Tris-HCl [pH 7.5], 150 mM of NaCl, 1mM of Na2 EDTA (ethylenediaminetetraacetic acid), 1 mM of ethylene glycol tetraacetic acid, 1% Triton, 2.5 mM of sodium pyrophosphate, 1 mM of β-glycerophosphate, 1 mM of Na3 VO4, and 1 μg/mL of leupeptin) containing phosphatase (1 tablet per 10 mL of lysis buffer) and protease (1 tablet per 50 mL of lysis buffer) inhibitor (Roche cOmplete tablets; Sigma-Aldrich, Taufkirchen, Germany) cocktail and homogenized with 20 strokes of Dounce apparatus. Tissue homogenates were then cleared by centrifugation (10,000 g, 10 min) and assayed for protein concentration with the Bradford protein assay.
Phospho-RTK activation screening was based on a nitrocellulose-membrane sandwich immunoassay and was performed according to the manufacturer's instructions (R&D Systems, Minneapolis, MN). Briefly, nitrocellulose membrane spotted with the anti-RTK antibody were blocked in array buffer 1 for 1 h at room temperature (RT), before being incubated with 500 μg of tissue homogenates diluted in 1.5 mL of Array buffer 1 for 24 h at 4°C. Thereafter, membranes were quickly rinsed in sterile water and washed 3 × 10 min in wash buffer. Membranes were then incubated with the anti-phospho-tyrosine horseradish peroxidase (HRP) detection antibody, diluted to 1 × Array Buffer 2, for 2 h at RT. Membranes were then washed again as before and detection of the HRP was performed by adding to each membrane 1 mL of the Chemi Reagent Mix and imaged using the chemiDOC MP Imaging System from Bio-Rad (Hercules, CA).
Array images were then quantified using ImageJ (NIH, Bethesda, MD). A fixed-size region of interest (ROI) was drawn on each antibody spot and the integrated median gray value was obtained, together with a value for the local background. Each experimental run contained at least two saline-sham samples, and values for each spot are expressed as percentage of the saline-sham reference.
Drugs and drug administration
The ErbB2 inhibitor, Lapatinib (Selleck chemicals, Munich, Germany), the ErbB inhibitor, AG825 (Tocris, Bristol, UK), the broad-spectrum TK inhibitor, LDN-211904 (Merck, Darmstadt, Germany), and the platelet-derived growth factor (PDGF) inhibitor, CP-673451 (Selleck Chemicals, Munich, Germany), were commercially available. Each drug was dissolved in a minimal volume of dimethyl sulfoxide and diluted in vehicle (containing 5% PEG-400, 5% Tween-80, and 90% saline) before administration. Mice were administered with each drug in a volume of 400 μL of vehicle by oral gavage. The experimental design included 1) mice administered with vehicle undergoing sham-surgery (veh-S; n = 4), 2) mice pre-treated with ethanol (5 g/kg) diluted in vehicle and undergoing sham surgery (eth-S; n = 3), 3) mice administered with vehicle undergoing TBI (veh-TBI; n = 5), 4) mice pre-treated with ethanol and undergoing TBI (eth-TBI; n = 4), and 5) mice pre-treated with specific inhibitors undergoing TBI. For ErbB inhibitors Lapatinib and AG825, two treatment doses were considered: 10 mg/kg (n = 6 and n = 5, respectively) and 50 mg/kg (n = 4 and n = 4, respectively). For LDN-211904 (n = 4) and CP-673451 (n = 4), only one dose (10 mg/kg) was considered. In pre-treated mice, all drugs (or vehicle alone) were administered 30 min before TBI. In addition to the four groups cited above, for Lapatinib and AG825 one more group was analyzed: mice treated with the specific inhibitor 30 min after TBI (n = 4 and n = 4, respectively). In this group, only one dose (50 mg/kg) was administered. Of note, administration of ethanol diluted in saline or saline alone did not produce a significantly different effect on behavioral or histological readouts than ethanol diluted in PEG400-Tween80-saline vehicle or of vehicle alone.
Behavioral and neurological score assessment
Overall neurological impairment was evaluated using the composite Neurological Severity Score (NSS), as described by Flierl and colleagues. 43 At 3 h post-injury, 24 h post-injury, 2 days post-injury (dpi), 3 dpi, 5 dpi, and 7 dpi, assessment of motor (muscle status, abnormal movement), sensory (visual, tactile, and proprioceptive), reflex, and balance abilities were tested. Animals are awarded 1 point for failure to perform a task, such that scores ranged from 0 to 10, increasing with severity of dysfunction. The Arena Escape test, part of NSS evaluation, was performed putting the animals into a circular, brightly-lit area whose wall included a narrow opening leading to the dark compartment. The time required to enter the dark compartment was measured and averaged over three attempts. The Beam Walk test was performed as previously reported: Mice were habituated to walking over a suspended wooden beam, from an open platform to a dark compartment, and the test was then repeated at 2 and 7 dpi. 44 Time required to reach the dark box was measured.
Immunostaining, confocal imaging, and image analysis
For evaluation of ErbB family members' phosphorylation by immunostaining, mice treated with either 1) saline (sal-S; n = 3) or 2) ethanol (eth-S; n = 3) were subject to sham surgery, and independent groups of 3) saline pre-treated (sal-TBI; n = 5) and 4) ethanol pre-treated (eth-TBI; n = 4) mice underwent the TBI procedure (as indicated above). In order to further evaluate the phosphorylation of ErbB2 after the administration of ErbB-specific inhibitors: AG825 and Lapatinib, the following groups were considered: 1) mice treated with vehicle and undergoing sham surgery (veh-S, n = 3), 2) mice treated with vehicle and undergoing TBI (veh-TBI, n = 3), 3) mice treated with AG825 inhibitor and undergoing TBI (n = 3), and 4) mice treated with Lapatinib and undergoing TBI (n = 3). Mice were perfusion-fixed (25 mL of ice-cold PBS followed by 50 mL of ice-cold 4% paraformaldehyde [PFA] in PBS) after 3 h or 7 days. Brains were dissected and stored in PFA (4% in PBS) for 18 h at 4°C, before being washed in PBS, cryoprotected in 30% sucrose in PBS, and embedded in optimum cutting temperature compound (TissueTek; Sakura Finetek USA, Torrance, CA). Sections were cut in cryostat at 40-μm thickness. Immunostaining was performed as previously reported. 46 Briefly, free-floating brain sections spanning the trauma site were blocked in bovine serum albumin 3%+ donkey serum 3%+ Triton 0.3% in PBS for 2 h at 24°C and incubated with primary antibody in blocking buffer for 40 h at 4°C.
The following primary antibodies were used: rabbit anti-phosphorylated-ErbB2 (pErbB2; 1:200, #2243; Cell Signaling Technology [CST], Danvers, MA), rabbit anti-phosphorylated-ErbB3 (pErbB3; 1:1000, #2842; CST), phosphorylated ErbB4 (pErbB4; 1:400, ab109273; Abcam, Cambridge, MA), mouse anti-vGlut1 (1:500, #135311; Synaptic Systems, Brussels, Belgium), guinea pig anti-vGlut2 (1:500, #135404; Synaptic Systems), mouse anti-Synaptotagmin-2 (1:200, ab154035; Abcam), and goat anti-PV (1:1000, PVG-214; Swant, Bellizona, Switzerland).
For detection of phospho-ErbB2 and phospho-ErbB3 and phospho-ErbB4, the tyramide signal amplification protocol was used (Alexa Fluor-488 Tyramide SuperBoost kit, B40922; Thermo Fisher Scientific, Waltham, MA), and the manufacturer's instructions were modified according to free-floating staining. Briefly, sections were washed 3 × 10 min in PBS at RT and incubated for 60 min with poly-HRP–conjugated secondary antibody. After washing (3 × 30 min in PBS at RT), sections were incubated in tyramide working solution (100 × tyramide stock solution, 100 × H202 solution, and 1 × reaction buffer) for 10 min, the tyramide working solution was stopped by adding the sections in stop reagent. After washing (3 × 30 min in PBS at RT), brain sections were incubated with opportune secondary antibodies (Alexa-conjugated donkey antimouse, antirabbit, anti–guinea pig) diluted 1:500 together with the nuclear stain TOPRO-3 (Invitrogen, Carlsbad, CA) 1:1000 for 2 h at RT and mounted using FluoroGold mounting medium. For assessment of neuronal loss, the following groups were considered: 1) mice administered with vehicle and undergoing sham surgery (veh-S; n = 3), 2) mice administered with ethanol (eth-S; n = 3, 5 g/kg, diluted in vehicle) undergoing sham surgery, 3) mice administered with vehicle undergoing TBI (veh-TBI; n = 5), 4) mice administered with ethanol undergoing TBI (eth-TBI; n = 4), 5) mice administered with AG825 or Lapatinib (n = 5 and n = 6, respectively), and 6) mice administered with LDN or CP (n = 4 and n = 4, respectively). Mice were sacrificed at 7 dpi by perfusion/fixation, and brain tissue was then processed for immunostaining as reported above. Immunostaining was performed with mouse anti–neuronal nuclei (NeuN; 1:100, MAB377; Millipore, Billerica, MA) with the same experimental protocol detailed above.
Confocal images were acquired using an LSM-700 (Carl Zeiss AG, Jena, Germany) inverted microscope, fitted with a 20 × air or 40 × oil objective. All images were acquired in 12-bit format and imaging parameters were set in order to obtain signal for the immunostained antigen >150 while avoiding saturation in high-intensity neurons. For neuronal density measurements, ROIs corresponding to the trauma site and spanning the surrounding regions for at least 1500 μm were acquired with 20 × objective in tile-scan mode, with optical section thickness set at 1 μm. NeuN+ were counted in ROIs located in the primary injury site (on the axis of the injury site; Supplementary Fig. 1) (see online supplementary material at
For phospho-RTK quantification, images were acquired with 40 × objective with optical thickness set at 500 nm and using the tile-scan mode to acquire composite pictures spanning the primary injury site and the penumbra. Confocal image stacks composed of 10 optical sections were collapsed in maximum-intensity projection using the ImageJ software suite (NIH). For overall pErbB2, pErbB3, and pErbB4 levels, two fixed-size rectangular ROIs were located symmetrically on each side of the axis of the injury site and the mean gray value was computed.
For analysis of pErbB2 colocalization with synaptic markers, single optical sections acquired with the 40 × /oil objective were considered and each channel was acquired independently to prevent fluorescence cross-bleed. Each synaptic marker was evaluated independently against pErbB2 (the following co-immunostainings were performed: pErbB2/vGlut1, pErbB2/vGlut2, and pErbB2/Syt2). Multi-channel images were processed in ImageJ (NIH); ROIs for synaptic analysis were located at 40–50 μm from the axis of the injury site. pErbB2 fluorescence images from veh-TBI samples were thresholded to allow a binary classification and the colocalization of pErbB2+ synapses and vGlut1, vGlut2, or Synaptotagmin was visually evaluated by listing the number of pErbB+ synapses also displaying >10 pixels positive for each synaptic marker considered. A minimum of 150 synapses for each marker were evaluated (from three replicates) and the percentage of pErbB2+/vGlut1+, pErbB2+/vGlut2+, and pErbB2+/Syt2+ synapses (over the total number of pErbB2+ in the considered ROIs) was computed.
Intracerebral injection of adeno-associated virus and chemogenetic agonist administration
For the study of PV activation or inhibition by chemogenetics, and the eventual additive effect of ethanol, PV-Cre mice were injected with adeno-associated virus (AAV)9 expressing either activator pharmacologically selective actuator module (PSAM) or inhibitor PSAM. For both the former and the latter (independently), the following experimental design was considered: 1) mice injected with saline and subject to sham surgery (sal-actPSAM-S and sal-inhPSAM-S, both n = 3), 2) mice injected with pharmacologically selective effector molecule (PSEM) and subject to sham surgery (PSEM-actPSAM-S and PSEM-inhPSAM-S, both n = 3), 3) mice injected with saline and subject to TBI (sal-actPSAM-TBI and sal-inhPSAM-TBI, both n = 4), 4) mice injected with PSEM and subject to TBI (PSEM-actPSAM-TBI and PSEM-inhPSAM-TBI, both n = 5), 5) mice injected with PSEM, administered ethanol and subject to TBI (eth-PSEM-actPSAM-TBI and eth-PSEM-inhPSAM-TBI, both n = 4), and 6) mice administered with ethanol alone and subject to TBI (eth-actPSAM-TBI and eth-inhPSAM-TBI, both n = 3).
Intracerebral injection of AAV vector was performed at the age of P30–P40 as previously reported. 47 Briefly, mice were pretreated with buprenorphine (0.01 mg/kg; Reckitt Beckiser Healthcare, Berkshire, UK) and meloxicam (1.0 mg/kg; Böhringer Ingelheim, Biberach an der Riß, Germany) before being put into a stereotaxic frame (Bilaney Consultants GmbH, Düsseldorf, Germany) under continuous isoflurane anesthesia (4% in O2 at 800 mL/min). Skin scalp was incised on the midline to expose the skull. Using a hand-held micro drill, a burr hole was drilled at the coordinates (x = +2.0, y = −2.0), corresponding to the primary somatosensory cortex. AAV9 vectors, encoding floxed PSAM-carrying AAV9 (excitation, pAAV(9)-pCAG-flox-PSAM(Leu41Phe,Tyr116Phe)5HT3-WPRE; inhibition, pAAV(9)-cbaflox-PSAM(Leu141Phe,Tyr116Phe)GlyR-WPRE was obtained from Vector Biolabs (Malvern, PA) at the titer of 9*10 viral genomes/mL. Next, 200–500 nL of viral suspension were injected at z = −0.4/0.7 using a pulled-glass capillary connected to a Picospritzer microfluidic device.
Injection was performed with 10-msec pulses over 10 min and the capillary was kept in place for 10 more minutes before being withdrawn. 13,48 Scalp skin was stitched with Prolene 7.0 surgical threads and animals were transferred for recovery in single cages with facilitated access to water and food. Animals were monitored for eventual neurological impairment for the following 72 h and were administered additional doses of buprenorphine, if needed. TBI procedure was performed 30–40 days after viral injection. No increase in mortality or morbidity was observed in mice intracranially injected in comparison to mice,which were subject to TBI, but were never subject to microdrilling and viral injection (corresponding to the saline-TBI or vehicle-TBI mice used as controls in behavioral and pharmacological experiments). The PSEM308 agonist (obtained from Apex Scientific Inc., Stony Brook, NY) 48 was administered as previously reported 47 at the dose of 5 g/kg 20–30 min before the TBI procedure by intraperitoneal injection (diluted in sterile saline at 20 mg/mL). Administration of ethanol was performed as reported above (oral gavage, diluted in saline, 5 g/kg).
Blood gas analysis
For the evaluation of hypoxemia and hypercapnia, which may result from the interaction of ethanol intoxication and TBI, blood gas analysis was performed. Three experimental groups were considered: 1) ethanol administered, sham TBI (n = 3); 2) saline-pretreated and TBI (n = 3); and 3) ethanol-pretreated, TBI (n = 4). Baseline reference values for PaO2 and PaCO2 were obtained from Schwarzkopf and colleagues. 49 Briefly, 50 μL of arterial blood was drawn from the abdominal aorta in calcium-heparin–containing syringes. Blood gas tensions were measured using a Radiometer ABL 800® blood gas analyzer.
Blood glial fibrillary acidic protein assay
For glial fibrillary acidic protein (GFAP) blood measurements, the following experimental groups were considered: 1) mice administered with saline undergoing sham surgery (n = 3), 2) mice administered with ethanol (5 g/kg) and undergoing sham surgery (n = 3), 3) mice administered with saline undergoing TBI (n = 4), and 4) mice administered ethanol undergoing TBI (n = 4). Whole blood was taken by puncture of the right ventricle and transferred into sterile plasma EDTA microtubes (Kabe Labortechnik, Nuembrecht-Elsenroth, Germany). After centrifugation at 800g for 10 min at 4°C, the supernatant was taken and centrifuged at 13,000g for 2 min at 4°C. Plasma samples were analyzed by commercially available enzyme-linked immunosorbent assay specified for mouse GFAP, according to the manufacturer's instructions (LSBio, Seattle, WA). Colorimetric detection was made at a wavelength of 450 nm using a plate reader (Tecan Sunrise Plate Reader; Tecan, Crailsheim, Germany).
Blood ethanol assay
For assessment of blood ethanol levels, we considered the following groups for both the 15-min and the 3-h time point (two independent cohorts of mice for each time point): 1) saline-Sham (sal-S; n = 3), 2) ethanol-Sham (eth-S; n = 3), 3) saline-TBI (sal-TBI; n = 4), and 4) ethanol-TBI (eth-TBI; n = 4). Blood ethanol analysis was performed on blood plasma taken from mice after TBI with or without ethanol administration. The analysis was performed using the manufacturer's instructions (Abcam plc, Cambridge, UK). Briefly, plasma (obtained as for the GFAP assay) was diluted 1:500 for ethanol-treated samples and 1:10 for saline-treated samples. The standard was used at 0.1 mM of pure ethanol standard in ethanol assay buffer. Next, 50 μL of diluted sample was added to each well and 50 μL of reaction mix (46 μL of ethanol assay buffer, 2 μL of ethanol probe, and 2 μL of ethanol enzyme mix) was added. Wells were shortly mixed, incubated for 30 min at RT, and the output was measured with OD 570 (Fluostar Optima plate scanner; BMG LABTECH GmbH, Ortenberg, Germany).
Statistical analysis
Statistical analysis was performed using the GraphPad Prism software suite (GraphPad Software Inc., La Jolla, CA). Analysis of behavioral performance and RTK arrays was done using two-way analysis of variance (ANOVA), with Tukey's post-hoc test. For comparison of neuronal density values, one-way ANOVA with Bonferroni's correction for multiple comparisons was applied. For comparison of blood GFAP levels and blood ethanol levels, because the data distribution did not approximate a normal distribution, a nonparametric Mann–Whitney U test was used. Behavioral data are displayed as mean ± standard error of the mean. Statistical significance was set at p < 0.05. Statistical significance is reported in figures as follows: ****p < 0.0001; ***p < 0.001; **p < 0.01; *p < 0.05.
Results
Acute ethanol administration accelerates neurological recovery after traumatic brain injury
To establish the effect of ethanol on the behavioral and sensorimotor outcome of TBI, we administered a single dose of ethanol (5 g/kg or saline) by oral gavage 30 min before mice were subjected to experimental TBI (or sham surgery). All mice undergoing TBI displayed a brief apnea time, whose duration was comparable in the ethanol-treated groups and in saline-treated mice (6.3 ± 1.0, 6.8 ± 1.1 vs. 7.1 ± 1.4 sec, respectively; p > 0.05). We monitored the progression of neurological deficits using the NSS score and two sensorimotor tests: the Beam Walk and the Arena Escape Test.
NSS score displayed a significant effect of TBI (F (3,11) = 39.7; p < 0.0001), of time (F (5,55) = 29.8; p < 0.0001) and a significant TBI × time interaction (F (15,55) = 10.1; p < 0.0001). Post-hoc analysis revealed at 3 h a significant difference post-injury, with the TBI groups having a significantly higher NSS score than sal-S or eth-S mice (0.5 ± 0.5 and 0.5 ± 0.5, respectively), although there was no difference in NSS scores among sal-TBI and eth-TBI mice (5.4 ± 1.8 in Sal-TBI vs. 3.5 ± 1.8 in eth-TBI; p = 0.12; Fig. 1A). Both sal-TBI and eth-TBI mice displayed a progressive recovery in NSS score; however, the eth-TBI displayed a trend toward faster neurological recovery (at 24 h post-injury, NSS was 3.5 ± 1.5 and 2.0 ± 1.0 for sal-TBI and eth-TBI, respectively; p = 0.067; at 2 dpi, NSS was 2.0 ± 1.0. and 1.5 ± 0.5 in sal-TBI and eth-TBI, respectively; p = 0.55; Fig. 1A).

Neurological recovery after administration of ethanol in TBI. (
Latency to escape a brightly-lit arena through a small slit (Arena Escape test; AE) was significantly affected by TBI (TBI on AE: F (3,20) = 6.5; p = 0.003). However, the effect of time on AE was not significant (F (3,54) = 2.6; p = 0.058). Post-hoc analysis revealed that escape time was longer in sal-TBI than in sal-S mice (at 2 dpi, 15.8 ± 6.1 vs. 5.3 ± 2.4 sec; p = 0.0036), whereas eth-TBI mice (6.4 ± 2.2 sec) performed significantly better than sal-TBI (eth-TBI vs. sal-TBI, p = 0.045; eth-TBI vs. eth-S, p = 0.75; Fig. 1B). Notably, the performance of sal-TBI mice did not improve over time (at 7 dpi, 12.7 ± 4.6 sec; p < 0.001 sal-TBI vs. sal-S) and the performance of eth-TBI mice stayed at control (eth-S and sal-S) level.
When sensorimotor skills were tested in the 11-mm round Beam Walk (BW) test, a significant effect of TBI on BW was detected (F (3,18) = 15.2; p < 0.0001) and of time on BW (F (3,54) = 21.7; p < 0.0001), with a significant interaction between TBI and time (F (9,54) = 3.4; p = 0.0021). Post-hoc analysis revealed that sal-TBI mice performed significantly worse than sham controls (at 2-dpi time point, 29.3 ± 6.8 sec in sal-TBI as compared to 7.9 ± 1.6 sec in sal-S; p < 0.0001; Fig. 1C), although the performance recovered over time (at 7 dpi, 12.6 ± 2.2 vs. 7.8 ± 1.9 sec; p = 0.682). However, eth-TBI mice performed significantly better than saline pre-treated ones after TBI (at 2 dpi, 17.8 ± 5.8 vs. 29.3 ± 6.8 sec, respectively; p < 0.0001) and recovered to baseline level in shorter time (at 3 dpi, 18.6 ± 3.4 sec in sal-TBI as compared to 9.1 ± 1.8 sec in eth-TBI and 7.6 ± 1.2 sec in eth-S; eth-TBI vs. eth-S, p = 0.78; sal-TBI vs. sal-S, p < 0.001). Sal-S and eth-S were always identical in their performance (Fig. 1C).
The observed differences in the Beam Walk and in the Arena Escape tests were not attributed to an overall impairment in locomotion. In fact, when tested in the open field, the average speed was not statistically different between sal-TBI and eth-TBI mice at 2 dpi or at later time points (2 dpi: 6.7 ± 3.2, 7.7 ± 6.3, and 11.1 ± 6.0 cm/s for sham, sal-TBI, or eth-TBI, respectively; 7 dpi: 11.2 ± 7.9, 7.0 ± 5.0, and 12.0 ± 6.2 cm/s for sham, sal-TBI, or eth-TBI, respectively; two-way ANOVA, time × treatment group, p > 0.05).
In order to exclude possible respiration-depressing effects of ethanol after TBI, we measured PaO2 and PaCO2 on arterial blood in a dedicated cohort of mice, administered either saline or ethanol, which underwent TBI and were sacrificed 15 min later. Despite the high dose, ethanol did not affect respiratory drive in addition to any putative anesthesia-induced respiratory depression: The measurement of arterial blood gas tensions immediately after TBI yielded PaCO2 values 35 ± 7 mm Hg (n = 3) and 36 ± 13 mm Hg (n = 4; p > 0.05) in the vehicle- and ethanol-treated animals, respectively This demonstrates that there was no major additional ethanol effects on respiratory drive and/or alveolar ventilation (likewise, in eth-Sham [n = 3], PaCO2 was comparable 36 ± 1 mm Hg). Similarly, we excluded the occurrence of ethanol- or TBI-induced hypoxemia, because the blood gas analyses showed comparable immediate post-TBI PaO2 values (282 ± 121 vs. 212 ± 79 mm Hg, in the vehicle- and ethanol-treated animals, respectively, as compared to 267 ± 47 mm Hg in eth-S mice; p > 0.05).
We also measured blood alcohol levels 15 min and 3 h (in two distinct cohort of mice) after trauma, to verify whether ethanol levels were comparable in eth-S and eth-TBI. At the 15-min time point, eth-S and eth-TBI displayed comparable levels of blood ethanol (10.0 ± 0.9 and 14.6 ± 2.7 μmol, respectively; p = 0.057; Fig. 1D). However, in mice sacrificed at the 3-h time point, blood ethanol levels were significantly higher in eth-TBI mice than in eth-S (2.7 ± 1.4 μmol in eth-sham vs. 10.0 ± 1.2 μmol in eth-TBI, corresponding to 125 ± 68 and 461 ± 56 mg/dL, respectively; p < 0.05); negligible levels of ethanol were detected in saline-administered mice (0.04 ± 0.04 and 0.03 ± 0.03 μmol in sal-S and sal-TBI, respectively; Fig. 1D). In addition, we measured blood GFAP levels (a proxy of the severity of parenchymal damage caused by TBI in human and murine models) at the 3-h time point: Plasma GFAP was strongly elevated in both TBI groups compared to sham mice, but were not significantly affected by ethanol (1.25 ± 0.32 ng/mL in sal-TBI vs. 1.17 ± 0.42 ng/mL in eth-TBI, as compared to 0.058 ± 0.004 and 0.058 ± 0.013 ng/mL in sal-S and eth-S groups, respectively; p > 0.05 for sal-TBI vs. eth-TBI; Fig. 1E). 29,30
Taken together, these data show that sensorimotor abilities were significantly conserved after trauma in ethanol-treated TBI mice compared to sal-TBI, suggesting an acute neuroprotective effect of ethanol.
Screening receptor tyrosine kinase activation identifies multiple signaling cascades activated by traumatic brain injury and affected by ethanol
In order to gain mechanistic insights on the neuroprotective effect of EI in TBI, we set out to screen the phosphorylation level (in other words, the activation status) of 38 different RTKs representing multiple functional pathways (including neuronal, glial, vascular, and inflammatory responses) and endowed with high translational potential. To achieve this aim, we sampled the trauma site from mice treated with saline or ethanol which underwent TBI or sham surgery. Whole-cortex protein extracts were then probed for RTK phosphorylation using nitrocellulose antibody arrays.
For four phospho-RTK (EphA7, EphA8, EphB2, and EphB4) absolute levels were below the detection limit and could not be analyzed. Two-way ANOVA revealed a statistically significant difference between treatment groups (F (3,21) = 15.25; p < 0.0001) and a significant interaction between TBI and EI (F (102,714) = 3.005; p < 0.0001). Post-hoc analysis (35 groups, six comparisons per group) revealed that Sal-TBI caused a statistically significant upregulation of the phosphorylation levels of nine RTKs (ErbB2, p = 0.011; ErbB3, p = 0.001; FGFR1, p = 0.0004; FGFR3, p = 0.0311; hepatocyte growth factor receptor [HGFR]/c-Met, p < 0.0001; MSP-R, p = 0.022; EphA2, p < 0.0001; EphA3, p < 0.0001; EphA6, p = 0.0204) and the downregulation of one RTK (IGF-R1) when compared to sham samples which had not reached statistical significance after multiple-comparisons correction.
Ethanol displayed a mainly negative effect on TBI-activated RTK, although not all activated RTK were equally downregulated by EI (Fig. 2A,B). When sal-TBI and eth-TBI groups were compared post-hoc, EI caused a statistically significant downregulation of nine RTKs: ErbB2 (154 ± 15% in sal-TBI vs. 73 ± 26% in eth-TBI; p = 0.0003), ErbB3 (166 ± 19% in sal-TBI vs. 67 ± 20% in eth-TBI; p < 0.0001), fibroblast growth factor receptor 1 (FGFR1; 170 ± 31% in sal-TBI vs. 75 ± 21% in eth-TBI; p = 0.001). Other RTKs whose activation was significantly reduced by ethanol include PDGF-Rb (138 ± 16% in sal-TBI vs. 67 ± 21% in eth-TBI; p = 0.0029), Flt-3 (135 ± 49% in sal-TBI vs. 71 ± 34% in eth-TBI; p = 0.0088), EphA2 (190 ± 72% in sal-TBI vs. 137 ± 51% in eth-TBI; p = 0.04), MSP-R (150 ± 109 in sal-TBI vs. 93 ± 85% in eth-TBI; p = 0.0237), EphA3 (although with large variations: 209 ± 103% in sal-TBI vs. 152 ± 33% in eth-TBI; p = 0.0243), and EphA6 and EphB1 (EphA6, 152 ± 33% in sal-TBI vs. 75 ± 19% in eth-TBI; p = 0.0011; EphB1, 138 ± 22% in sal-TBI vs. 64 ± 11% in eth-TBI; p = 0.0041). Additionally, some RTKs were not affected by ethanol, such as HGFR/c-Met (269 ± 151% in sal-TBI vs. 255 ± 121% in eth-TBI; p > 0.05) and FGFR3 (147 ± 35% in sal-TBI vs. 108 ± 35% in eth-TBI; p > 0.05).

Phosphorylation of multiple RTKs after TBI and their modulation by ethanol. (
Taken together, these data suggest that the effect of ethanol in TBI is multi-faceted and involves the modulation of multiple signaling cascades unfolding in possibly multiple cellular subpopulations.
ErbB2, ErbB3, and ErbB4 phosphorylation is upregulated by traumatic brain injury and it is downregulated by concomitant ethanol intoxication
Among the multiple RTKs modulated by TBI and ethanol, we decided to analyze in further detail the effect of TBI and ethanol intoxication on ErbB2/3/4 activation and signaling, because of their high expression in the cerebral cortex and because of their translational value given that these receptors can be targeted with U.S. Food and Drug Administration (FDA)-approved small molecules. 42,52,53 First, we sought to validate the screening results and identify the cellular sources of the phosphorylated RTKs by immunostaining of brain sections (sampling the trauma site) from sal-sham, eth-sham, sal-TBI, or eth-TBI mice (perfused 3 h after TBI) for phosphorylated ErbB2 (pY1221/1222), phosphorylated ErbB3 (pY1289), and phosphorylated ErbB4 (pY1284).
At 3 h post-injury, pErbB2, pErbB3, and pErbB4 immunofluorescence levels were strongly increased in the site of injury in sal-TBI mice compared to sal-sham control cortical samples and nearby cortices (371 ± 68%, 422 ± 73%, and 321 ± 57% of baseline, respectively; p < 0.01; Fig. 3A–F). Notably, whereas eth-sham did not display significantly lower levels of pErbB2, eth-TBI mice showed a significant reduction in pErbB2 fluorescence intensity (204 ± 47% of sal-sham; p < 0.05 vs. sal-sham and vs. sal-TBI; Fig. 3A,B). Likewise, ethanol pre-treatment resulted in the blunting of TBI-induced upregulation of pErbB3 and pErbB4 (249 ± 51% and 203 ± 48.9% of baseline, respectively; p < 0.01 sal-sham and vs. sal-TBI; Fig. 3C–F). Thus, immunostaining data validated the antibody array findings and demonstrated the suppressive effects of ethanol on ErbB family activation after TBI.

Suppression of TBI-induced phosphorylation of ErbB2 and ErbB3 in vGlut2+ excitatory synapses by ethanol. (
pErbB2 and pErbB3 (and, to a lesser extent, pErbB4) displayed a strikingly punctuate pattern, reminiscent of synaptic localizations in the areas proximal to the injury site and in the penumbra. pErbB4 also displayed immunolocalization in cell bodies and proximal dendrites of a subset of neurons. In fact, when cortical samples were co-immunostained for pErbB2 together with the excitatory presynaptic markers vGlut1 and vGlut2, pERbB2 puncta colocalized almost exclusively with vGlut2+ puncta (93 ± 4%) and very little with vGlut1 (3 ± 2%) and never with the marker of inhibitory synapses, Synaptotagmin-2 (Fig. 3G,H).
Acute administration of ErbB2 inhibitors mimics ethanol effect on traumatic brain injury behavioral outcome.
We further investigated the importance ethanol-induced suppression of RTK, particularly of ErbB- signaling in TBI. More accurately, we explored whether specific RTK inhibitors could recapitulate EI-associated improved behavioral outcomes. Because the pharmacokinetics of ErbB inhibitors have not been studied in the context of TBI (Lapatinib penetration of the brain has been previously assessed, although in a condition in which no central nervous system [CNS] insult was delivered),
54
we verified that pre-administration of 50 mg/kg of the ErbB inhibitors, AG825 and Lapatinib (or vehicle), could affect pErbB2 levels in the cortex after TBI. Mice were sacrificed 3 h after trauma and pErbB2 immunofluorescence levels were assessed: Whereas in sal-TBI we detected a significant increase in ErbB2 phosphorylation in vGlut2+ synapses (Sal-TBI 354 ± 60% vs. sal-s; p < 0.01 vs. sham), TBI-induced pErbB2 increase was strongly limited by pre-treatment with AG825 50 mg/kg (AG825-TBI 162 ± 46% of sal-S; p < 0.01 vs. TBI; Supplementary Fig. 2) (see online supplementary material at
Thereafter, distinct groups of mice were administered ErbB2 inhibitors (AG825 50 mg/kg or Lapatinib 50 mg/kg) a PDGF receptor (PDGFR) inhibitor (CP-673451, 10 mg/kg) or the broad RTK inhibitor (LDN-211904, 10 mg/kg), in a single administration before TBI, and assessed for their performance in sensorimotor and behavioral tests. We also considered two groups of mice treated with a lower dose (10 mg/kg) of either Lapatinib or AG825. For comparison, independent groups of mice were pre-treated with ethanol diluted in vehicle or with vehicle alone and subject to sham surgery or to TBI. No difference in performance in any test was detected between veh-S and eth-S mice, which were comparable to saline pre-treated mice (cfr. Fig. 1).
When assessed in the Beam Walk test, mice treated with 50 mg/kg of AG825 or Lapatinib performed significantly better than vehicle-treated TBI mice and comparable to eth-TBI mice (at 2 dpi, 10.1 ± 2.7 and 12.6 ± 2.4 sec, respectively, as compared to 30.9 ± 7.8 sec in veh-TBI and 14.3 ± 2.8 sec in eth-TBI mice; p < 0.001 vs. veh-TBI for both compounds; ethanol was diluted in vehicle for proper comparison; Fig. 4A). The effect of ErbB inhibitors was still detectable when a 10-mg/kg dose was administered, with trends toward dose-dependent effects (although for AG825 the strong trend did not reach statistical significance; at 2 dpi, 15.1 ± 2.3 and 17.3 ± 3.4 sec and p = 0.071 for AG825 10 vs. 50 mg; p < 0.05 for Lapatinib 10 vs. 50 mg; Fig. 4A). The broad-selectivity RTK inhibitor, LDN-211904, also produced a significant improvement in performance (8.6 ± 3.4 sec; p < 0.01 vs. veh-TBI; Fig. 5A) whereas the PDGFR-selective drug, CP-673451, did not affect significantly the performance (at 2 dpi, 22.0 ± 6.5 sec; p > 0.05 vs. veh-TBI; Fig. 4A). At 7dpi, eth-TBI as well as mice treated with either dose of Lapatinib, AG825, or LDN were similar in performance to sal-S or eth-S mice, whereas sal-TBI was still significantly slower (Fig. 4B).
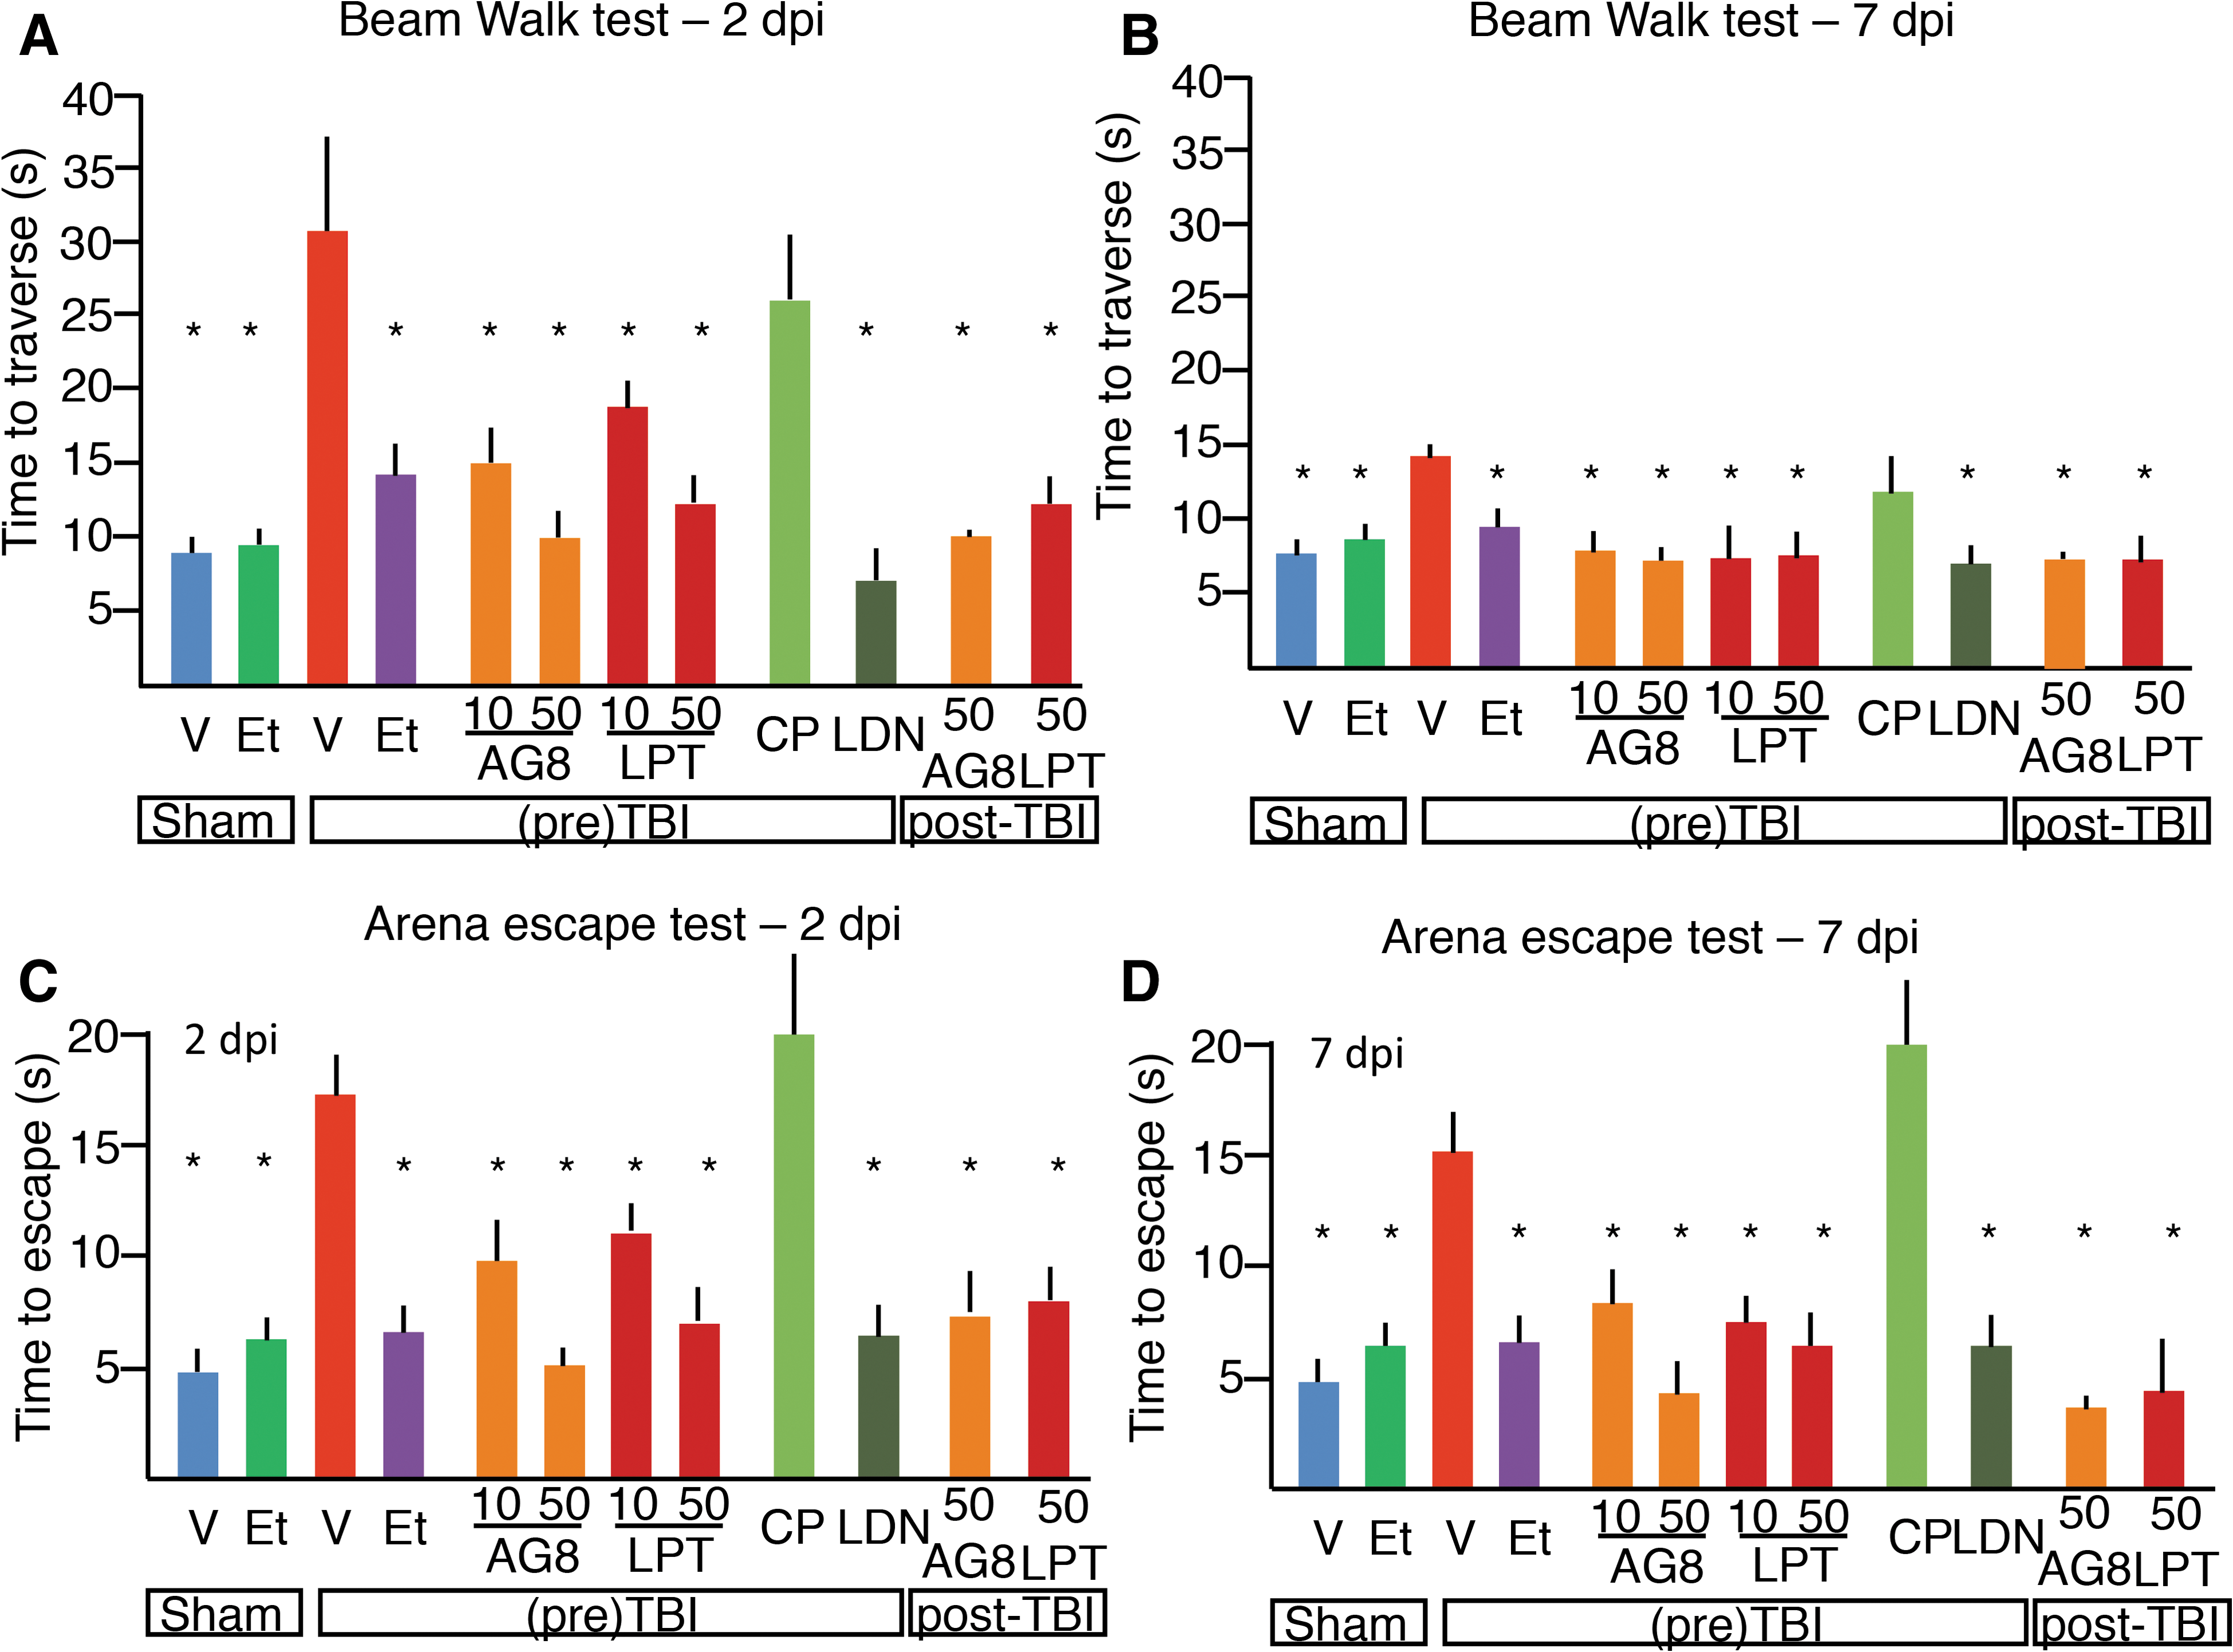
Improvement in behavioral outcome by administration of ErbB inhibitors before or after TBI. (
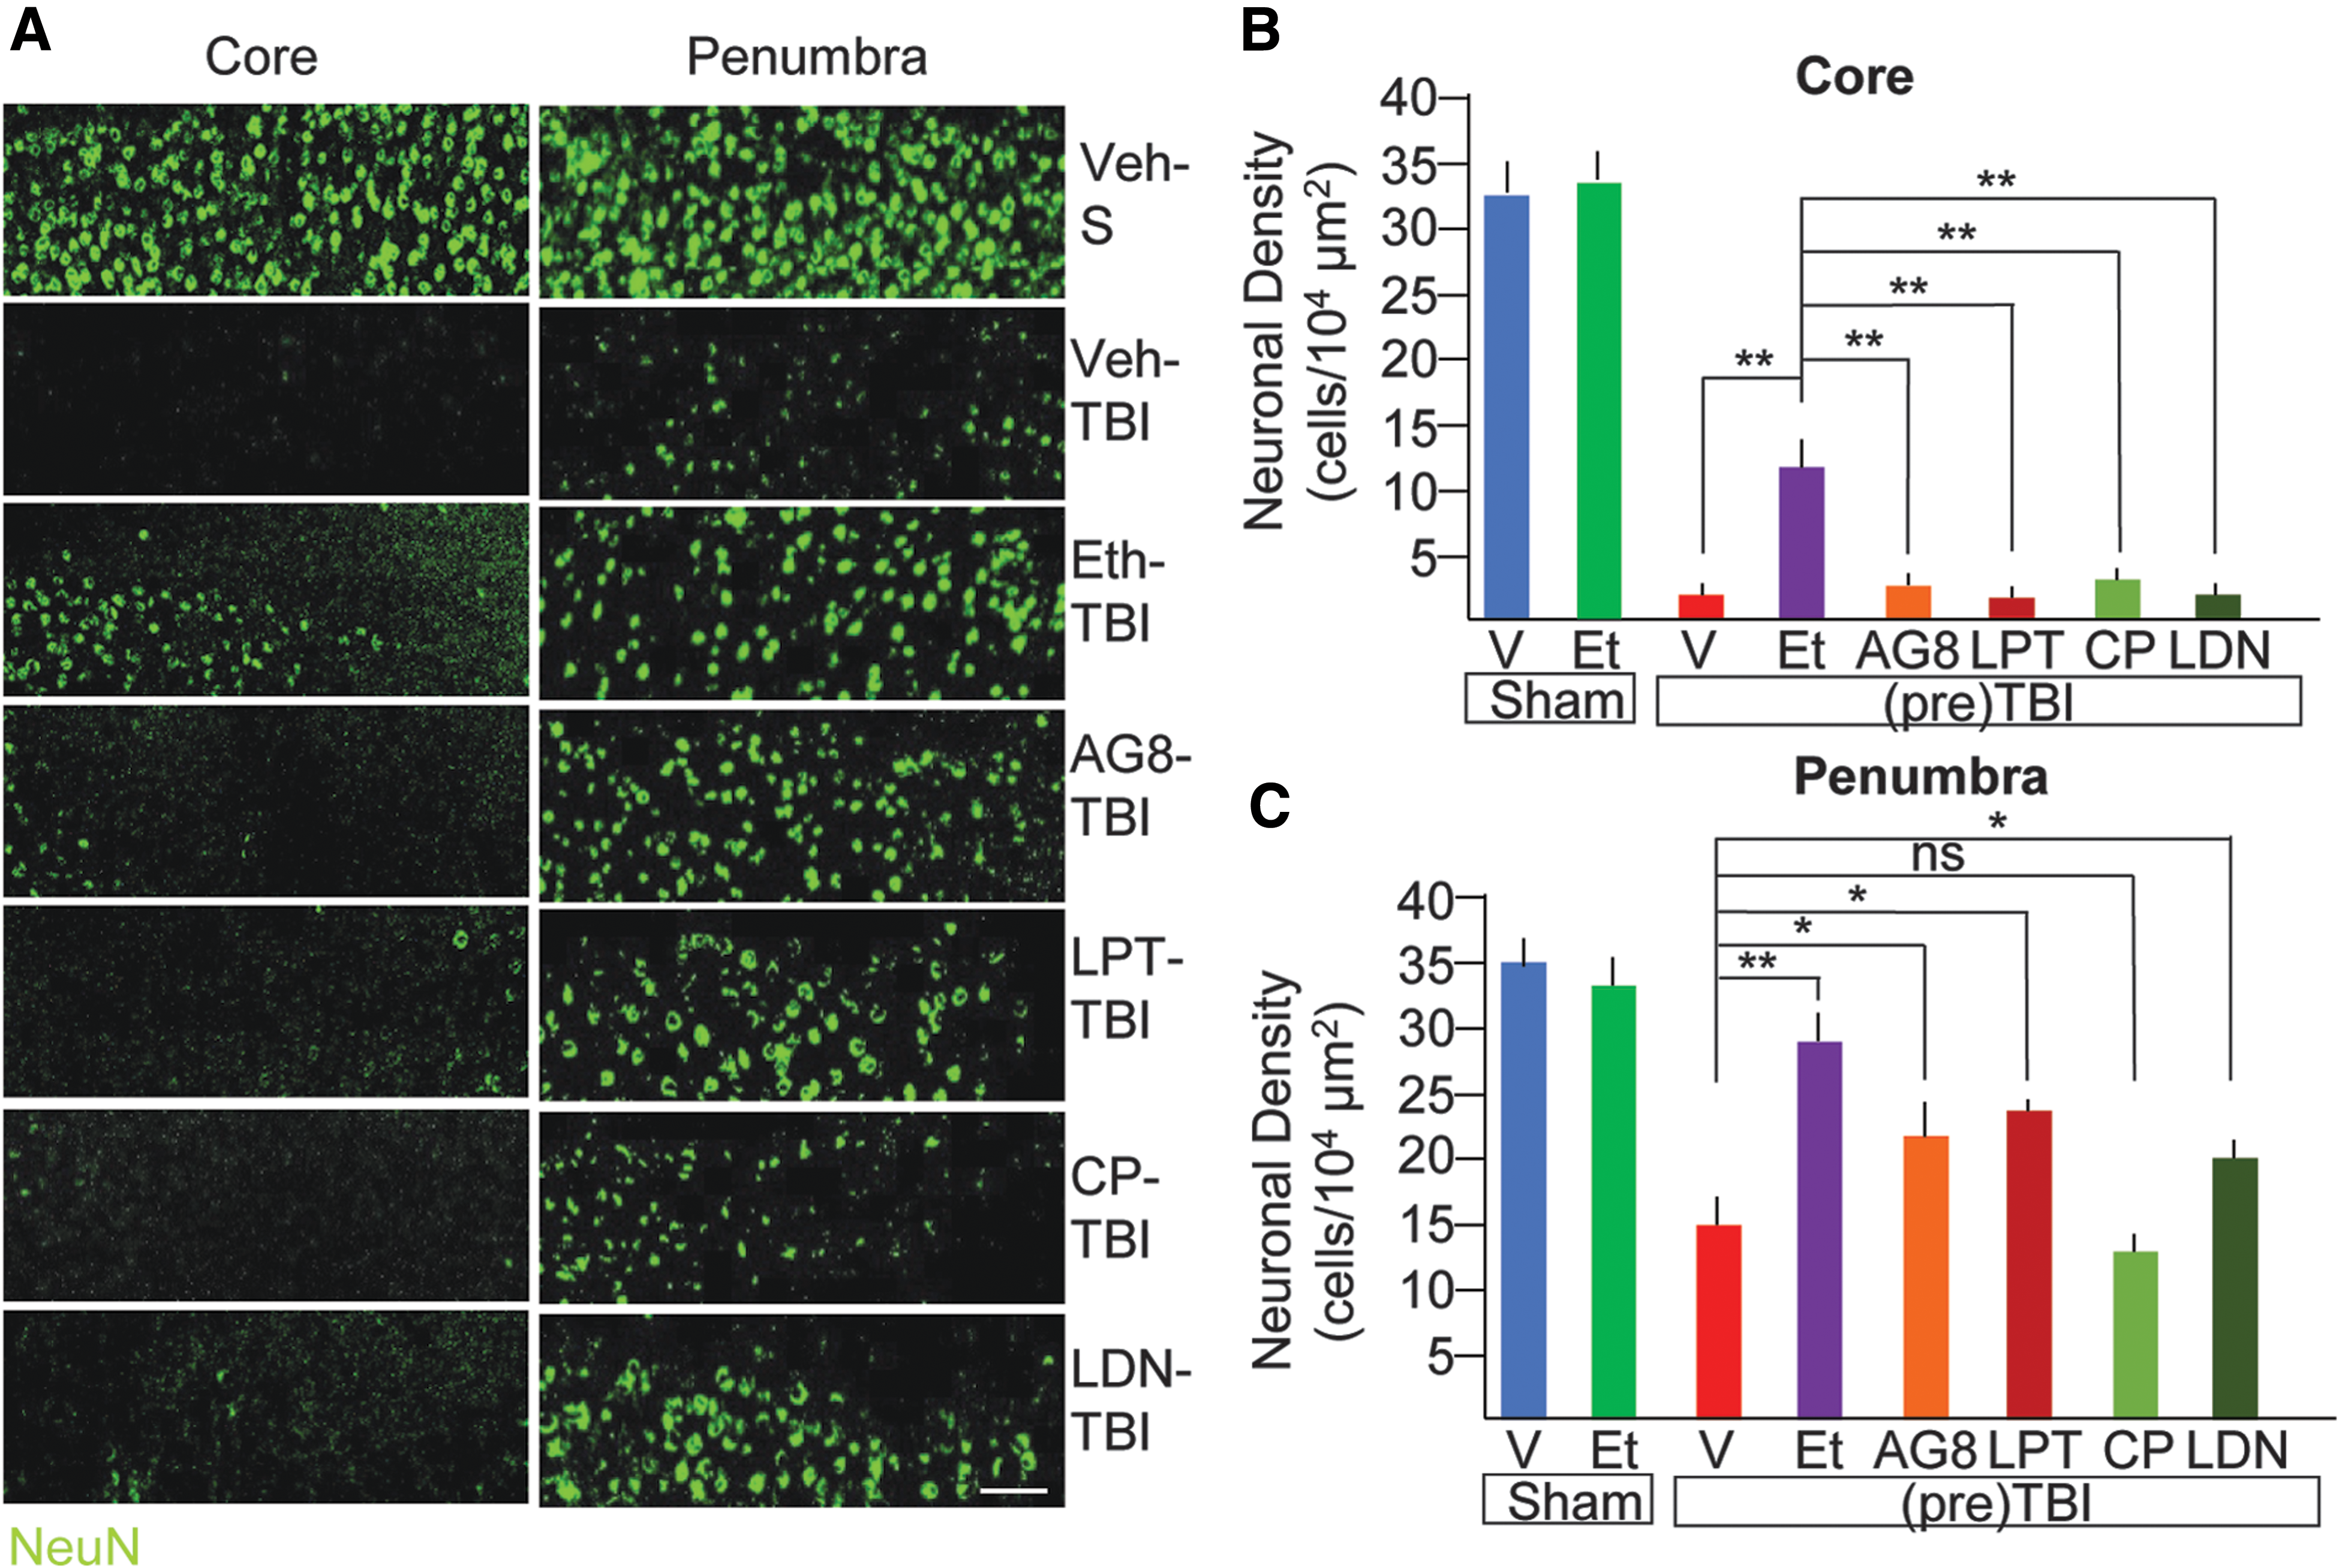
Ethanol pre-treatment and ErbB inhibitors treatment reduces neuronal loss after TBI. (
Likewise, performance in the Arena Escape test was significantly modified by RTK inhibitors. Both 10- and 50-mg/kg AG825- and Lapatinib-treated mice performed significantly better than vehicle-treated ones after TBI (at 2 dpi, 9.1 ± 2.4 and 6.4 ± 1.1 sec for AG825 and 11.3 ± 1.3 and 7.5 ± 1.6 sec, respectively, vs. 17.2 ± 2.4sec; p < 0.05; Fig. 4C) and comparably to the ethanol-treated ones (7.4 ± 2.2 sec, p > 0.05 when compared to AG825 and Lapatinib). Likewise, mice pretreated with the broad-selectivity RTK inhibitors were comparable to veh-S, eth-S, or eth-TBI mice (6.1 ± 2.4 sec; p > 0.05 when compared to veh-S or eth-S or eth-TBI), whereas mice pretreated with the PDGFR inhibitor performed comparably to the veh-TBI mice (20.0 ± 6.5 sec; p > 0.05 vs. veh-TBI; Fig. 4C). Like in the Beam Walk, in the Arena Escape tests the improved performance of mice acutely treated with AG825 or Lapatinib was still detectable at 7 dpi (Fig. 4D).
To explore the translational potential of ErbB inhibitors as therapeutic agents for acute TBI, we administered a single dose of 50 mg/kg of Lapatinib (an FDA-approved drug, is known to be able to penetrate the brain parenchyma) 55 or of the alternative ErbB inhibitor, AG825, 30 min after TBI. Performance of mice in the Beam Walk and Arena Escape tests was evaluated at 2 and 7 dpi. Interestingly, mice treated with either ErbB inhibitor post-TBI displayed a significantly improved performance in both tests (for the Beam Walk, 10.1 ± 0.6 and 12.5 ± 2.3 sec at 2 dpi; for the Arena Escape, 6.2 ± 2.2 and 8.4 ± 1.9 sec for AG825 and Lapatinib, respectively, at 2 dpi; p < 0.05 compared to sal-TBI). The beneficial effect was persistent at 7 dpi.
Traumatic brain injury–induced neuronal loss is prevented by ethanol intoxication and ErbB inhibitors
We then explored the structural counterparts of the reduced behavioral disturbances observed in ethanol-pretreated TBI mice. To this aim, we measured the density of NeuN-positive cells in the injury area (“core,” defined by the longitudinal axis of the injury site in coronal sections) and in the penumbra (Supplementary Fig. 1 (see online supplementary material at
Because our findings had shown that EI results in a significant suppression of TBI-induced ErbB phosphorylation and we have shown that ErbB inhibitors partially recapitulate EI effect, we set out to verify whether selective inhibition of ErbB signaling could be sufficient to partially recapitulate EI effect on neuronal survival. To this aim, mice were administered either with two structurally distinct ErbB inhibitors (Lapatinib, 10 mg/kg and AG825 10mg/kg; because both 50 and 10 mg/kg proved effective in behavioral tests, we selected the lowest dose to ensure specificity) or with a PDGFR inhibitor (CP-673451, 10 mg/kg) or with a broad-spectrum RTK inhibitor (including EphR within its selectivity spectrum, LDN-211904, 10 mg/kg). All drugs were administered in a single dose before the TBI and mice were then sacrificed after 7 days for the evaluation of the neuronal survival. 56 Single-dose administration of either drug did not affect apnea time and acute or overall survival (not shown), and all drugs were well tolerated. Although ErbB inhibitors did not affect NeuN+ cells in the core (2.3 ± 0.9 and 1.5 ± 0.3/104 μm2 for AG825 and Lapatinib, respectively; p > 0.05 vs. veh-TBI), they significantly preserved neuronal density in the penumbra (21.3 ± 3.2 and 23.3 ± 4.7/104 μm2 for AG825 and Lapatinib, as compared to 10.6 ± 5.1/104 μm2 in veh-TBI; p < 0.05; Fig. 4A,C), albeit to a lesser extent than what obtained with ethanol. In fact, the broad-spectrum RTK also caused a significant increase in surviving NeuN+ cells in the penumbra (19.9 ± 3.2/104 μm2; p < 0.05 vs. veh-TBI), whereas administration of the PDGFR inhibitor was much less effective (13.5 ± 4.5/104 μm2; p < 0.05). Neither of them, however, helped with preservation of NeuN+ cells in the core (2.9 ± 2.4 and 1.9 ± 0.2/104 μm2; p > 0.05; Fig. 4A,C).
Traumatic brain injury–induced increase in pErbB2 excitatory synapses on parvalbumin interneurons is prevented by ethanol intoxication
ErbB receptors are expressed mainly in inhibitory neurons (in the cortex), 35 –37 including PV interneurons, where they control the strength of excitatory inputs 38,40 and, in turn, the level of perisomatic inhibition and principal neurons firing. 39,41 We therefore elected to investigate whether ErbB2 phosphorylation in excitatory synapses on PV interneurons was upregulated by TBI and affected by ethanol. PV interneurons were identified by immunostaining for PV, and the subpopulation within a 500-μm ROI centered on the injury site and restricted to layers I–IV was considered. On each PV interneuron, the fraction of vGlut2 ErbB2+ synapses over the total vGlut2+ was counted. The fraction of vGlut2+ ErbB2+ was comparatively low in sal-S and eth-S (8 ± 5% and 5 ± 4% of all vGlut2+ were pErbB2+). However, in sal-TBI mice, 57 ± 21% of vGlu2+ on PV interneurons was pErbB2+. Notably, in eth-TBI samples, the fraction of vGlut2+ ErbB2+ synapses on PV interneurons was significantly lower than in sal-TBI samples (34 ± 18%; p < 0.05 vs. sal-TBI; Fig. 6A,B). Thus, TBI results in ErbB phosphorylation in excitatory synapses on PV interneurons, an effect prevented by concomitant EI. Given that EI and TBI reciprocally regulate PV excitatory input, we reasoned that TBI-induced increase in PV activation and perisomatic inhibition may have pathogenic effects, which would be prevented by EI. We therefore set out to manipulate directly PV firing in TBI, to verify whether suppression of PV firing may recapitulate EI effect.
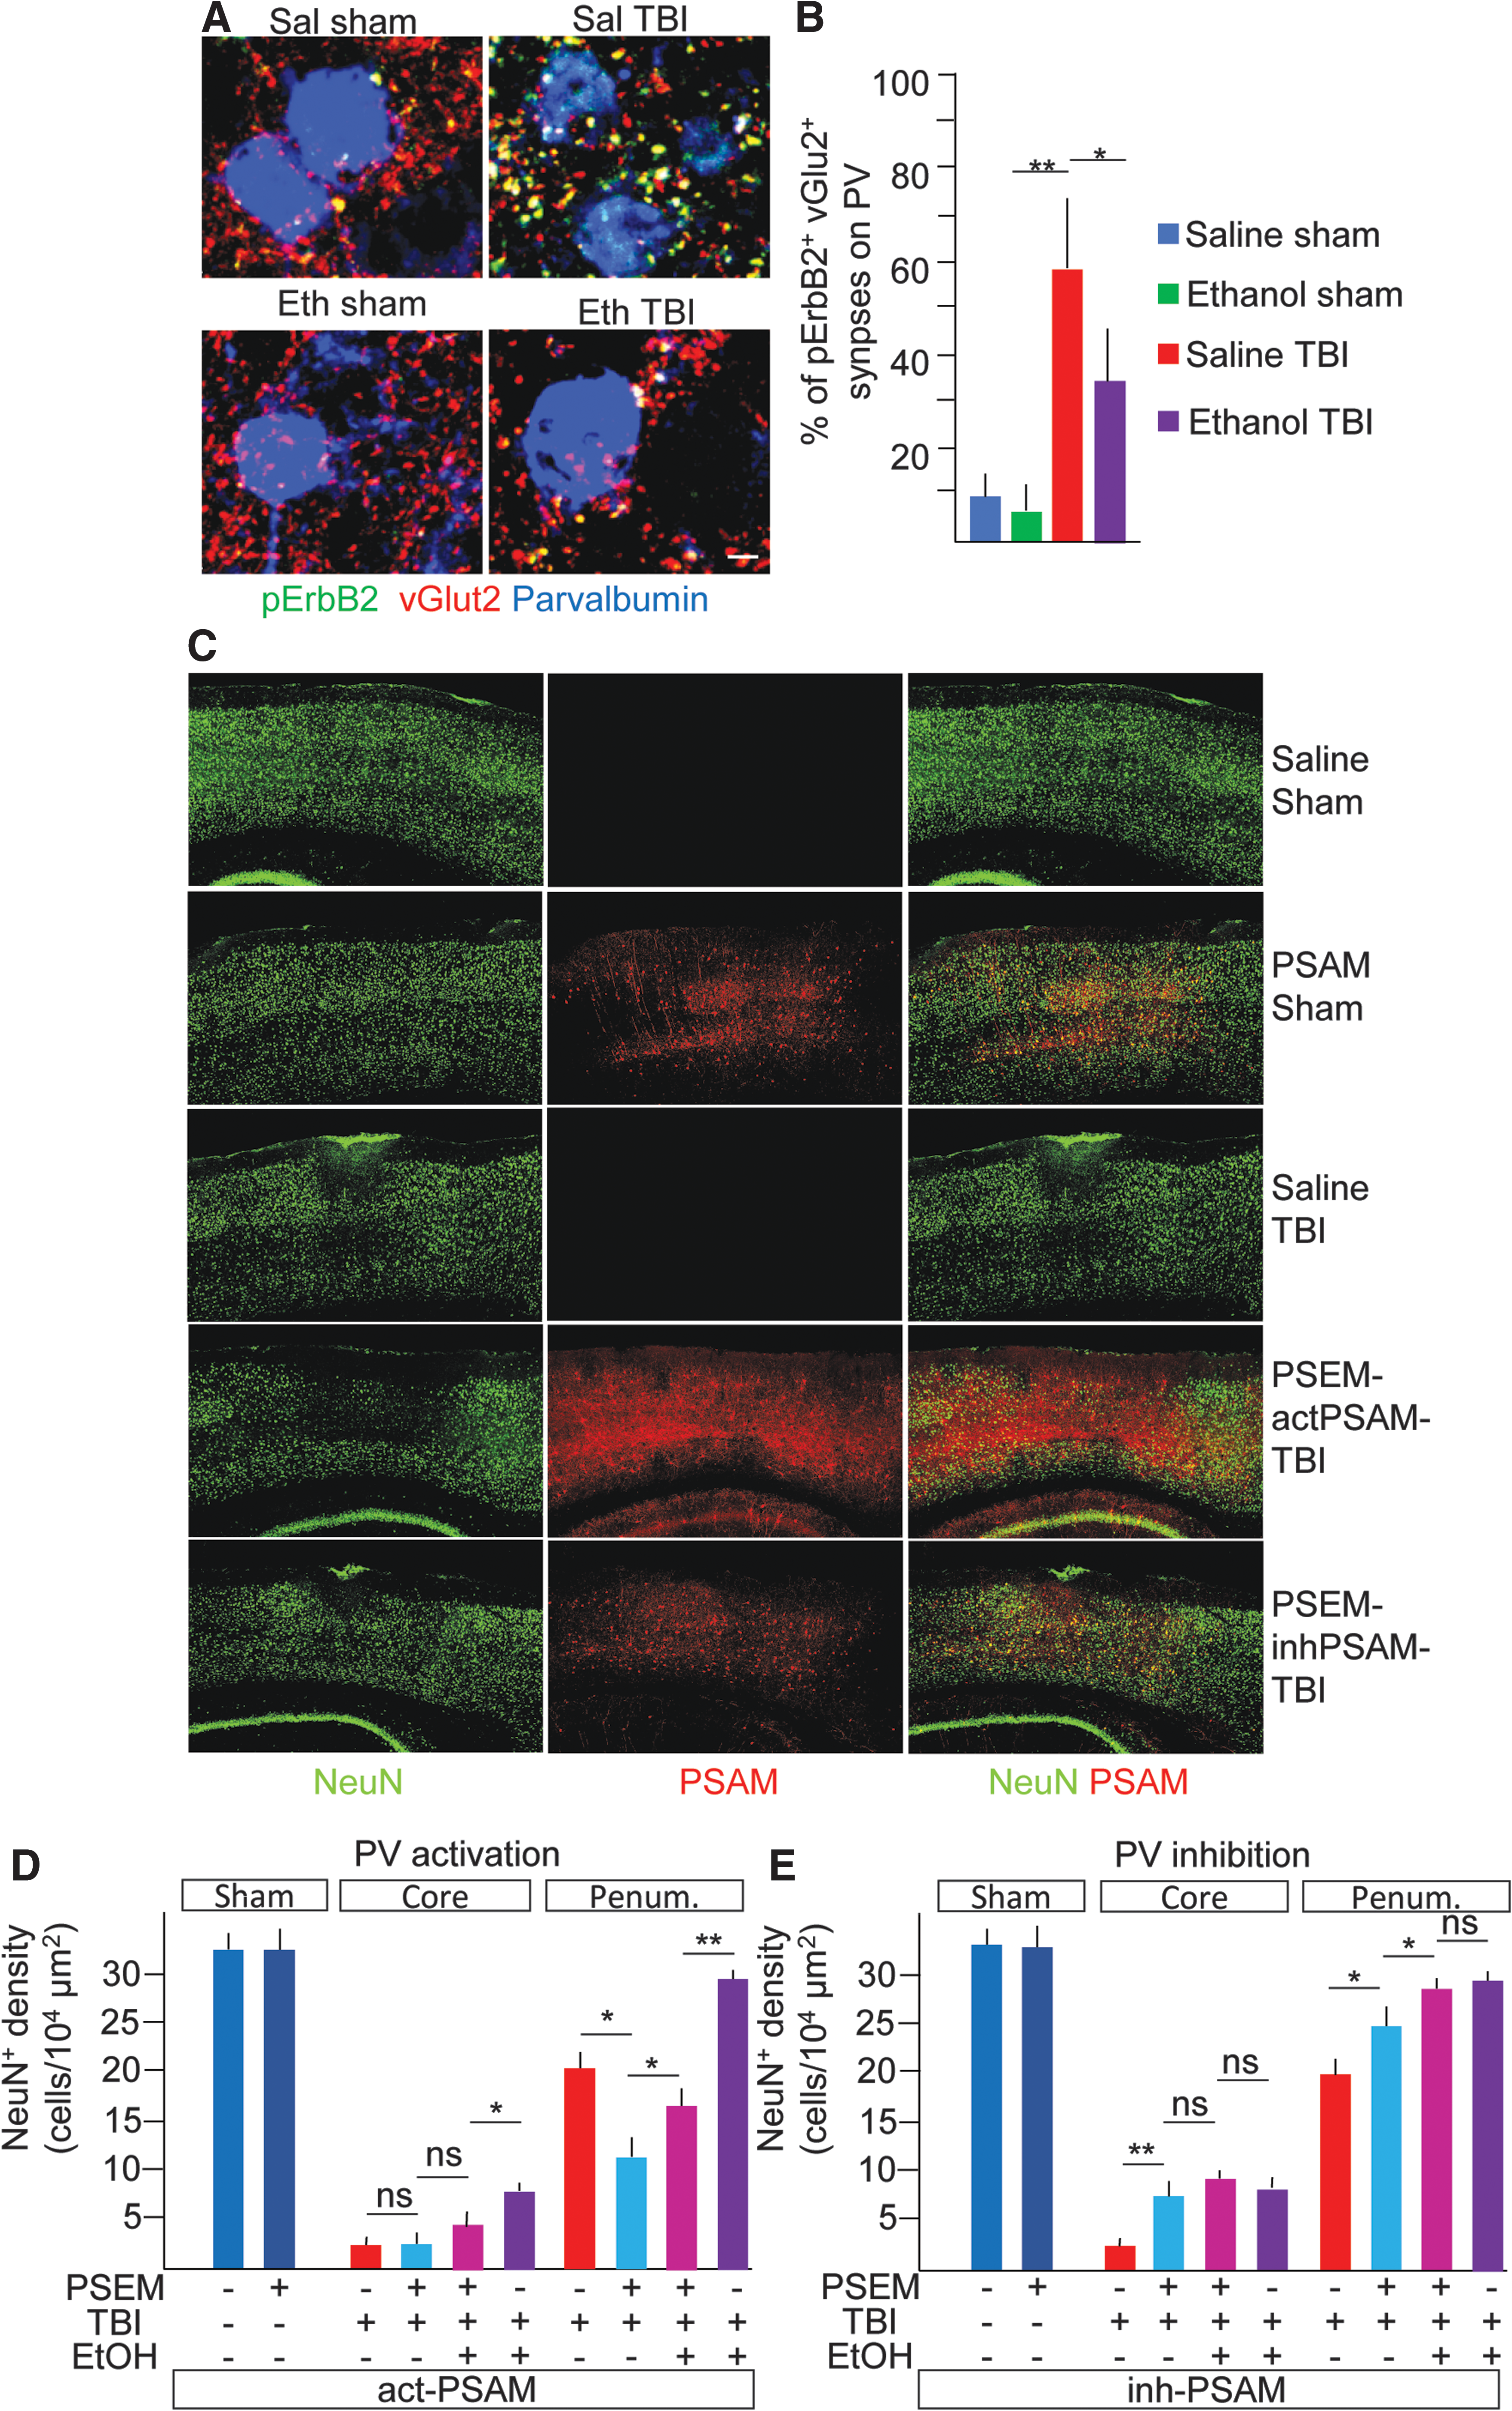
pErbB phosphorylation involves excitatory synapses on PV interneurons and chemogenetic suppression of PV interneurons reduces neuronal loss after TBI. (
Chemogenetic inhibition of parvalbumin interneurons partially mimics but does not fully preclude ethanol intoxication–associated neuroprotection
We injected AAV9 encoding either cation- or anion-permeable engineered ion channels with orthogonal pharmacology (PSAM, either excitatory or inhibitory) in the somatosensory cortex of PV-Cre mice. 48 Mice were then injected 30 min before further procedures with either saline alone or the orthogonal agonist (pharmacologically selective effector module, PSEM308) and subjected to either sham surgery or TBI. Mice were sacrificed at 7 dpi. The density of NeuN+ cells at 7 dpi both in the core and in the penumbra of the TBI-induced lesion was used as a readout. In sham-operated mice, whether administered with saline or PSEM and expressing either excitatory or inhibitory PSAM, NeuN+ cell density was comparable at 7 dpi (32.4 ± 4.4, 33.4 ± 2.9, 31.9 ± 6.5, and 34.2 ± 4.8 NeuN+ cells/104 μm2; p > 0.05; Fig. 6C–E). In saline pre-treated mice (sal-actPSAM-TBI or sal-inhPSAM-TBI, only saline but no PSEM administered), irrespective of PSAM expression, TBI resulted in almost complete loss of NeuN+ cells in the core lesion (2.3 ± 1.4 and 1.9 ± 1.1 NeuN+ cells/104 μm2 in saline-treated mice expressing either actPSAM or inhPSAM; p < 0.05 vs. sal-S samples; Fig. 6D,E) and a significant loss of neurons in the penumbral zone (20.1 ± 3.3 and 19.4 ± 4.4 NeuN+ cells/104 μm2; p < 0.05 vs. sal-s samples; Fig. 6D,E). However, when PV interneurons were activated in mice undergoing TBI (PSEM-actPSAM-TBI), the number of NeuN+ cells in the core was not affected (3.1 ± 1.4 NeuN+ cells/104 μm2), but an increased loss of neurons in the penumbra was observed (10.5 ± 2.7 NeuN+ cells/104 μm2; p < 0.05 vs. sal-actPSAM-TBI; Fig. 6D). On the other hand, inhibiting PV interneurons (PSEM-inhPSAM-TBI) produced a significantly higher number of NeuN+ cells in the core (8.2 ± 3.1; p < 0.05 vs. sal-TBI) and a larger preservation of NeuN+ cells in the penumbra (24.4 ± 3.2 NeuN+ cells/104 μm2; p < 0.05 vs. sal-inhPSAM-TBI). Thus, acute inhibition of PV firing resulted in reduced long-term principal neurons vulnerability whereas activation of PV firing increased neuronal loss.
We than reasoned that if reducing excitation of PV interneurons was the major mechanism of EI-associated neuroprotection and suppressing PV firing would preclude any further beneficial effect of EI. We therefore administered ethanol (5 g/kg) together with PSEM in PV-Cre mice expressing the inhibitory PSAM and compared the loss of neurons to that observed in PSEM-only administered mice. Although EI did not improve neuronal survival in the core lesion when applied together with the chemogenetic inhibition of PV interneurons (9.3 ± 1.4 cells/104 μm2; p > 0.05 vs. PSEM alone or EI alone), EI exerted an additional beneficial effect on the preservation of neurons in the penumbra (28.4 ± 1.1 cells/104 μm2; p < 0.05 vs. sal-TBI and vs. PSEM-TBI; Fig. 6E), with PSEM + EI being comparable to EI alone (29.5 ± 2.2 cells/104 μm2, p > 0.05 vs. PSEM + EI; Fig. 6E). Likewise, when ethanol was pre-administered to mice in which PV firing was enhanced, it did not enhance survival in the core of the lesion compared to chemogenetics only (4.1 ± 1.7 cells/104 μm2; p > 0.05 vs. PSEM) and the PSEM + EI group showed fewer cells than EI alone (7.9 ± 1.2 cells/104 μm2). Conversely, the addition of EI to the chemogenetic activation of PV interneurons increased neuronal survival compared to chemogenetic only (17.6 ± 2.4 cells/104 μm2 vs. 10.5 ± 2.7 NeuN+ cells/104 μm2; p < 0.05; Fig. 6), although did not reach the level of preservation produced by EI alone (27.8 ± 3.4 NeuN+ cells/104 μm2). Taken together, these data indicate that inhibition of PV interneurons does not preclude EI effects, but chemogenetic activation of PV strongly decreases EI-associated neuroprotection.
Ethanol intoxication does not reduce overall survival upon traumatic brain injury
Finally, we retrospectively investigated whether EI had a significant effect on the overall survival of experimental mice to TBI. In the sal-TBI and veh-TBI groups, a total of 52 mice underwent TBI procedure and 11 died either during the procedure or met the pre-specified criteria for euthanization (21.2%). In eth-TBI groups, a total of 45 mice underwent TBI, with 12 fatal outcomes (26.7%). When all animals treated with inhibitors were grouped together, 7 fatalities were observed out of 48 which underwent TBI (14.6%). The χ2 value was 1.067, with p = 0.58. Therefore, neither ethanol administration nor RTK inhibitors caused a significant increase in overall mortality after TBI.
Discussion
Here, we have shown that ethanol pre-treatment, resulting in a BAL comparable to the one that was found to be highly correlated with protective effects on TBI patients (>230 mg/dL), 10 results in enhanced recovery of sensorimotor skills and in reduced neuronal loss in cortex after blunt TBI, supporting the hypothesis of neuroprotective effects of ethanol observed in clinical series. Lower doses of ethanol were not explored, because we have previously reported that the dose of 1 g/kg does not provide protective effects on sensorimotor performance.
We have investigated the involved mechanisms exploiting as an entry point the pattern of phosphorylation of multiple RTK after TBI. Activation of RTK may be a physiological, protective response set in motion by the trauma itself (and therefore, in agreement with the classical antiapoptotic role of RTK, play a protective role in TBI). Under this viewpoint, EI-associated downregulation of activation of several RTKs may reveal that EI may limit the initial damage and prevent the activation of the protective response in the first place. Given that ethanol has powerful GABAergic activities 26 and it is an NMDAR antagonist, 25 it may prevent excitation-related damage 7 and limit excitation-related RTK activation (such as the phosphorylation of ErbB 38 or FGFR and EphB phosphorylation). 31,57 On the other hand, in the CNS, RTK may be involved in maladaptive responses to trauma, which may be directly pathogenic. In fact, activation of PDGFR has been linked to increased permeability of the blood–brain barrier (BBB) after trauma, and the PDGFR inhibitor, Imatinib, has been shown to reduce edema and reduce cognitive dysfunctions. 33 Further, activation of the RTK EphA2 has been linked to increased BBB dysfunction and neuronal loss in a stroke model. 58 Thus, although the RTK activation pattern reveals the breadth of EI impact on TBI-associated signaling events, the specific role of each RTK (and associated cascades) in EI-associated neuroprotection should be investigated in a case-by-case manner. Of note, some cascades endowed with pathogenic potential are not modulated by EI: Tie-2 phosphorylation, which is linked to reduced permeability of endothelial barriers, is not significantly modified by ethanol pretreatment. 34 Likewise, HGFR signaling is strongly activated by TBI, but not affected by EI. The role of HGFR in TBI has never been explored before, but its involvement in enhancing NMDAR 59 may suggest a potential involvement.
Notably, several of the TBI-activated RTKs are also involved (although not exclusively) in the regulation of synaptic events: EphB signaling can potentiate NMDAR currents 60 and may therefore enhance glutamate toxicity in the acute phase of TBI. Activation of other RTKs, such as FGFR1 and the ErbB family, is known to control protein clustering at inhibitory synapses 61,62 and excitatory inputs on interneurons, 28 respectively. Thus, our RTK screening reveals that EI may affect strongly events unfolding at the synaptic level after trauma and may identify new targets for intervention at this level.
Focusing on the ErbB receptor family, we have shown that TBI induces the phosphorylation of ErbB receptors in excitatory synapses and that specific inhibitors of ErbB are able to recapitulate a significant fraction of EI-associated neuroprotection. ErbB family expression pattern has been originally reported to include pyramidal cells as well as inhibitory interneurons. However, recent data obtained by in situ hybridization and reporter expression based on ErbB4 endogenous promoter 35 –38 as well as cell-specific knockout experiments 40 have demonstrated that ErbB4 expression is restricted in the cortex only to inhibitory interneurons (although ErbB4 is expressed in several non-GABAergic subpopulations in subcortical structures) and that ErbB4 is dispensable for the function of excitatory synapses between pyramidal neurons. 36 Although data on the expression of ERbB2 and ErbB3 are not as detailed, ErBB family members signal either as ERbB4 homodimers or as heterodimers of ErbB4, ErbB3, and Erbb2, 63 and therefore their expression is predicted to be comparable. Thus, we show that TBI induces the phosphorylation of ErbB in excitatory synapses on inhibitory interneurons. Among inhibitory interneurons, ErbB expression in PV interneurons has been shown to be highly relevant for the control of the function of these cells in normal cortex 39,40 and under pathological conditions. 64,65
The effect of EI on ErbB and PV activation may appear paradoxical, considering the GABAergic action of ethanol. However, ErbB phosphorylation on interneurons has been shown to be homeostatically regulated: Reduced cortical excitation leads to the decrease in ErbB phosphorylation in PV interneurons, de-potentiation and de-stabilization of excitatory synapses, and, ultimately, reduced PV activation. 27,66 Reciprocally, activation of ErbB results in the insertion of α-amino-3-hydroxy-5-methyl-4-isoxazolepropionic acid receptor (AMPAR) and increase excitation to inhibitory interneurons, 27 although the ratio between AMPAR and NMDAR may change significantly. 38 Thus, after TBI-associated depolarization, upregulation of ErbB in excitatory synapses on PV interneurons may result in upregulation of perisomatic inhibition, whereas concomitant EI may prevent it and leave PV interneurons at their basal state of excitatory input. We speculate that upregulation of ErbB phosphorylation may be a homeostatic event triggered by TBI-triggered excitation and may lead to increased PV excitation after TBI. In fact, ErbB receptors are activated by the extracellular domain of several isoforms of neuregulins (Nrg). Immature Nrg are transmembrane proteins (widely expressed in principal neurons) 67 whose extracellular N-terminal domain is released upon activity-dependent proteolysis 68 and activates ErbB family receptor signaling. 28 Nrg1 has been shown to act directly on ErbB receptors localized on interneurons to enhance the release of GABA. 67,69 In fact, seizure activity strongly enhances activation of the Neuregulin1/ErbB signaling unit, 70 whereas deletion of ErbB4 in PV interneurons increases seizures susceptibility. 67 On the other hand, administration of soluble Nrg1 rapidly upregulates excitatory inputs in PV interneurons through ErbB4 signaling. 27
If excitatory input to PV is upregulated as a consequence of TBI, and prevented by EI, downregulation of PV firing would mimic, at least partially, EI effects. Our chemogenetic manipulation of PV firing, in fact, demonstrates that whereas increasing PV firing is detrimental, decreasing it results in an improved neuronal survival. This result may apparently contradict the current model of hyperexcitability and excitotoxicity-induced neuronal death in TBI. 71 Although a number of neurons may be directly killed by an excitotoxic mechanism at the instance of trauma, it must be noted that cortical neurons subject to TBI develop a hyperexcitable phenotype several weeks after trauma. 71,72 On the other hand, recordings of sensory-evoked responses in multiple TBI models have revealed that cortical neurons are largely hypoactive 68 and do not respond to sensory stimulation in agreement with increased inhibition. 73 –75 This effect has been hypothesized to contribute to the generation of TBI-associated acute neurological deficits. 75 Thus, cortical neurons may be actually hypoactive soon after trauma, an effect that may be related to increased inhibition (in fact, activation of PV interneurons have been shown to be sufficient to completely shutting down the firing of principal cells). 41
Although the mechanisms linking neuronal hypoactivity to cell death in TBI require further elucidation, the current evidence is in agreement with the view that preventing neuronal silencing by either preventing ErbB upregulation (as in the case of EI) or reducing perisomatic inhibition (as in the case of chemogenetic inhibition of PV interneurons) may contribute to neuroprotection (Fig. 7). In fact, neuronal activity has been shown to increase resilience of neurons to several toxic agents and to neurodegenerative processes through activity-controlled neuroprotective transcriptional programs 46,76 –79 and silencing neurons renders them more sensitive to the degenerative processes (Fig. 6). 46

ErbB-mediated the effect of ethanol on inhibitory microcircuitry after TBI. Ethanol pre-treatment results in suppression of the activation of multiple RTKs by TBI. In particular, TBI-induced activation of ErbB phosphorylation in vGlut2+ synapses on PV interneurons is suppressed by ethanol. Loss of excitation attributed to excess inhibition may increase the vulnerability of neurons to TBI-induced neurotoxic cascades; and by suppressing PV-mediated perisomatic inhibition, ethanol may enhance neuronal survival. This effect is recapitulated by either direct ErbB inhibition or by direct suppression of PV firing by chemogenetics. FGFR1, fibroblast growth factor receptor 1; PDGFR, platelet-derived growth factor receptor; PV, parvalbumin; RTK, receptor tyrosine kinase; TBI, traumatic brain injury; vGlut, vesicular glutamate transporter.
Nevertheless, the neuroprotective mechanisms of EI may extend beyond the limitation of post-TBI inhibition. In fact, chemogenetic suppression of PV interneurons does not preclude EI effects and EI enhances neuronal survival even in the case of strong activation of PV interneurons. Given that ethanol is both a GABA agonist 26,51 as well as an NMDAR antagonist, 25 EI-associated neuroprotection may include direct decrease of excitability at the instance of trauma, reduced excitotoxicity through glutamate receptor inhibition, as well as modulatory effects on the neuroimmunological response. 20
Intriguingly, blockade of ErbB2 signaling by trastuzumab enhances peripheral nerve regeneration after acute or chronic damage. 80 However, the mechanism involved requires the interaction between Neuroligin expressed on axons and ErBB2 and epidermal growth factor receptor (EGFR) expressed on Schwann cells, whose interactions control Schwann cell dedifferentiation after injury and may therefore be independent of potential effects in the CNS. 80 Nevertheless, in polytrauma patients suffering from central and peripheral nervous system injuries, targeting of ErbB signaling would be highly attractive for the delivery of a double benefit.
The present work has been performed, in agreement with ethical guidelines for animal experimentation, providing the animals with the best supportive care and with the opportune measures to prevent unnecessary pain. This has required the administration of O2 during the procedure and the treatment of animals with buprenorphine. Although these conditions are not comparable to those experienced by human patients after TBI, we have provided evidence showing that the combination of ethanol and buprenorphine did not result in additional respiratory suppression and PaCO2 levels were comparable in ethanol and saline pre-treated animals. In addition, administration of O2 has been shown to have neuroprotective effects in a TBI + hemorrhagic shock model. 81 Although administration of O2 may have affected the disease process examined in our model, it must be stressed that neuroprotection was observed with hypoxemia lasting for no less than 2 h, whereas our animals were returned to ambient air within 15 min of the trauma. Further, any protective effect of O2 would have been balanced across groups, given that PaO2 was comparable across treatment groups.
We have identified a previously unrecognized strong effect of TBI on ethanol metabolism leading to distinct pharmacokinetics in eth-TBI versus eth-S, which resulted in significantly higher levels of ethanol assessed 3 h (but not 15 min after TBI). Given that the kinetics of the BAL are different in terms of metabolism, they could not be matched by increasing the dose administered to the eth-S group. In addition, administration of doses larger than 5 g/kg (32% ethanol [v/v]) may be against ethically acceptable practices for animal experimentations given that they may cause mucosal damage or unacceptably high mortality rates. TBI has been previously shown to affect liver biochemistry and gene expression, 82,83 which may affect drug metabolism 84 ; in addition, TBI decreases perfusion of the liver (and of other abdominal organs). 85 These factors may contribute to the altered pharmacokinetics of ethanol in TBI and may contribute to accounting for the increased BAL values. Thus, the difference in BAL obtained by administering the same ethanol dose in eth-S and eth-TBI mice should be considered a limitation of the present study (and further investigations of TBI-induced changes in pharmacokinetics are warranted). However, it is noteworthy that for no RTKs, the effect of eth-S and eth-TBI was qualitatively divergent (i.e., eth-S and eth-TBI either showed both to decrease RTK [such as for ErbB2, ErbB3, FGFR1, Flt3, and PDGFR] activation or to have no or limited effect on RTK activation [like for HGFR, FGFR3, and EphA2]), and there is no evidence suggesting that higher levels of ethanol found in eth-TBI mice may have a radically different or opposite effect on RTK than those observed in eth-S mice. Therefore, the difference in BAL between eth-S and eth-TBI does not negate the main conclusions of the article. Given that patients with very high BAL have been reported on, 86 and in clinical series ethanol has been reported to be protective for the groups with the highest BAL, 10 the effect of high-dose ethanol on TBI remains relevant for clinical and translational investigations.
The translational potential of our finding is supported by the identification of Lapatinib (an FDA-approved drug for the treatment of breast cancer) as a potential neuroprotective agent when administered before but, most important, also after the trauma. Lapatinib pharmacokinetics have been described and partial, dose-dependent penetration of the brain has been shown in murine models. 54,87 Penetration of brain parenchyma has been shown to be enhanced when the BBB is disrupted, 88 suggesting that it may reach therapeutically relevant concentrations in murine and human brains after TBI. We have supported the Lapatinib data with a second ErbB inhibitor, AG825. Although AG825 has been previously used in vivo, 89 –91 currently no pharmacokinetics data about AG825 penetration of the BBB are available.
In conclusion, our data provide support to the clinical evidence of a neuroprotective effect of high-dose ethanol in TBI, showing a mechanistic effect targeting multiple signaling cascades, including, importantly, RTK signaling, controlling the activity and plasticity of inhibitory interneurons. Direct modulation of the pathways that control inhibitory microcircuits may therefore offer a new approach for understanding and targeting TBI pathogenic pathways.
Footnotes
Acknowledgments
This work has been supported by the Deutsche Forschungsgemeinschaft as part of the Collaborative Research Center 1149 “Danger Response, Disturbance Factors and Regenerative Potential after Acute Trauma.” F.R. and R.R. are also supported by the ERANET-NEURON initiative “External Insults to the Nervous System” as part of the MICRONET consortium and by the Baustein program of the Medical Faculty of Ulm University.
Author Disclosure Statement
No competing financial interests exist.
References
Supplementary Material
Please find the following supplemental material available below.
For Open Access articles published under a Creative Commons License, all supplemental material carries the same license as the article it is associated with.
For non-Open Access articles published, all supplemental material carries a non-exclusive license, and permission requests for re-use of supplemental material or any part of supplemental material shall be sent directly to the copyright owner as specified in the copyright notice associated with the article.
