
Abstract
Accurate and reliable assessment of the conscious state of patients with severe traumatic brain injury (TBI) is vital for their future management. The purpose of the present study is to find an effective and accurate magnetic resonance imaging (MRI) method for predicting recovery of consciousness in patients with severe TBI. Multimodal MR techniques, including structural MRI, MR spectroscopy (MRS), diffusion tensor imaging (DTI), were used to evaluate brain damage in 58 patients with severe TBI. Statistical analysis compared imaging results and recovery over a relatively long period to find the most potent prognostic indicators and predictive method. A total 33 patients gained recovery of consciousness (RC), and 25 did not (NRC). Compared with the RC group, those in the NRC group had a significantly lower N-acetylaspartate to creatine (NAA/Cr) ratio of pons (1.43 ± 0.54 vs. 1.70 ± 0.42), more fiber lines (1046.3 ± 100.8 vs. 975.6 ± 128.1), less peripheral grey matter (pgrey) (579.23 ± 78.85 vs. 638.23 ± 61.16), lower fractional anisotropy (FA) of fibers (0.42 ± 0.04 vs. 0.45 ± 0.03), older age (43.08 ± 14.61 vs. 30.57 ± 12.89), and higher apparent diffusion coefficient (ADC) of fibers (0.99 ± 0.14 vs. 0.89 ± 0.06); all p < 0.05. Age, pgrey, ADC of fibers, NAA/Cr of pons were selected by logistic regression analysis to predict RC, with p values of 0.033 and 0.031, 0.035, 0.030, respectively. Age, pgrey, ADC of fibers, NAA/Cr of pons are effective indicators in the predictive model of RC.
Introduction
P
Accurate and reliable assessment of the conscious state of patients with severe TBI is vital for their future management. Clinical assessment of consciousness, however, relies on inferences made from observed responses to external stimuli, yet the responses of severely brain-damaged patients may be very limited or inconsistent. The clinical evaluation of consciousness in noncommunicative patients remains erroneous in 40% of cases. 4,5 It is crucial to find an alternative tool to access the damage of the brain and make a predictive model of recovery of consciousness for patients with TBI for a long period.
Conventional magnetic resonance (MR) was used initially, and many studies have shown a poor prognosis if there are lesions in the pons and basal ganglia, especially when they are bilateral. 6 –8 More advanced MR technology has been applied to TBI research: structural MR imaging (MRI) uses a tissue segmentation procedure with regional parcellation to quantify gray matter (GM), white matter (WM), and cerebrospinal fluid (CSF) of brain regions and the whole brain. It enable investigators to evaluate the extent of tissue loss after TBI 9,10 ; diffusion tensor imaging (DTI) can evaluate the density, integrity, and directionality of white matter tracks 11,12 ; proton MR spectroscopy (MRS) can provide metabolic information on brain damage that may not be visible on morphological imaging. 5,13
We expect to use multimodal MR techniques such as structural MRI, DTI, and MRS to make a comprehensive assessment of brain damage and to find the most potent prognostic indicators for recovery of consciousness.
Methods
Subjects
Our Institutional Review Board approved the study. Written informed consent was obtained from next of kin.
Patients were enrolled consecutively between January 2010 and December 2016 from the neurosurgery, emergency, or rehabilitation department of our institution. The inclusion criteria were: (1) absence of previous neurological disorders; (2) severe TBI with a coma history, defined as a Glasgow Coma Scale (GCS) score ≤8 measured within 24 h post-injury and before the initiation of paralytics or sedatives; (3) hemodynamic, ventilatory, and neurological conditions allowing transportation and prolonged supine position without risk to the patient; (4) without recovery of consciousness at the time of MRI examination; (5) MRI could be performed within 6 weeks post-trauma.
A total of 58 patients (aged 14–71 years, mean 35.8 years; 45 male, 13 female) with severe TBI were recruited. The causes of trauma were motor vehicle accident (n = 35), fall (n = 16), or violence and sport injuries, etc. (n = 7). All scans were acquired using the same scanner and scan parameters, and patients received uniform rehabilitation following departmental guidelines. Patients were re-admitted to our institution for rehabilitation and clinical follow-up. After final discharge, patients were assigned to a long-term home-based rehabilitation program, under guidance of a team including physiatric and neurological consultants. The judgment on unconscious state during follow-up was assessed by Coma Recovery Scale–Revised (CRS-R). 4 Recovery of consciousness was defined as reliable and consistent demonstration of at least one of the following: (1) functional interactive communication, (2) functional use of one or more objects, (3) clearly discernable behavioral manifestation of sense of self. 4,14
MR imaging and data processing methods
All subjects were scanned in one to six weeks after TBI. Before examination, patients were assessed for restlessness and were sedated, if necessary. A 1.5T MR scanner (Intera Systems, Philips, Netherlands) equipped with a standard eight-channel head coil was used. Detail MR scanning methods and parameters are as follows: Transverse T2-weighted images (T2WI) and sagittal T2WI (fast spin echo sequence, field of view [FOV] 230 × 230 mm, repetition time [TR] 2000 msec, echo time [TE] 550 msec, echo train 16, thickness 5 mm, spacing 1 mm); three dimensional (3D) T1-weighted images (3D turbo field echo sequence, FOV 230 × 230 mm, TR 7.2 msec, and TE 3.2 msec, 1 mm thick); DTI (single shot echo planar imaging sequence, FOV 224 × 224 mm, TR 11,000 msec, TE 66 msec, B value 800, and diffusion direction 32); MRS of pons (turbo spectroscopic imaging [TSI] sequence, FOV 230 × 180 mm, volume of interest size 10 mm3, thickness 15 mm, sample 256, sense acceleration factor 2, TSI acceleration factor 3, TR 1600 msec, and TE 288 msec). The MRS scan was aligned parallel to the anterior cranial fossa, to cover as much as possible of the pons in addition to the upper two-thirds (Fig. 1). The total scan time was approximately 20 min.
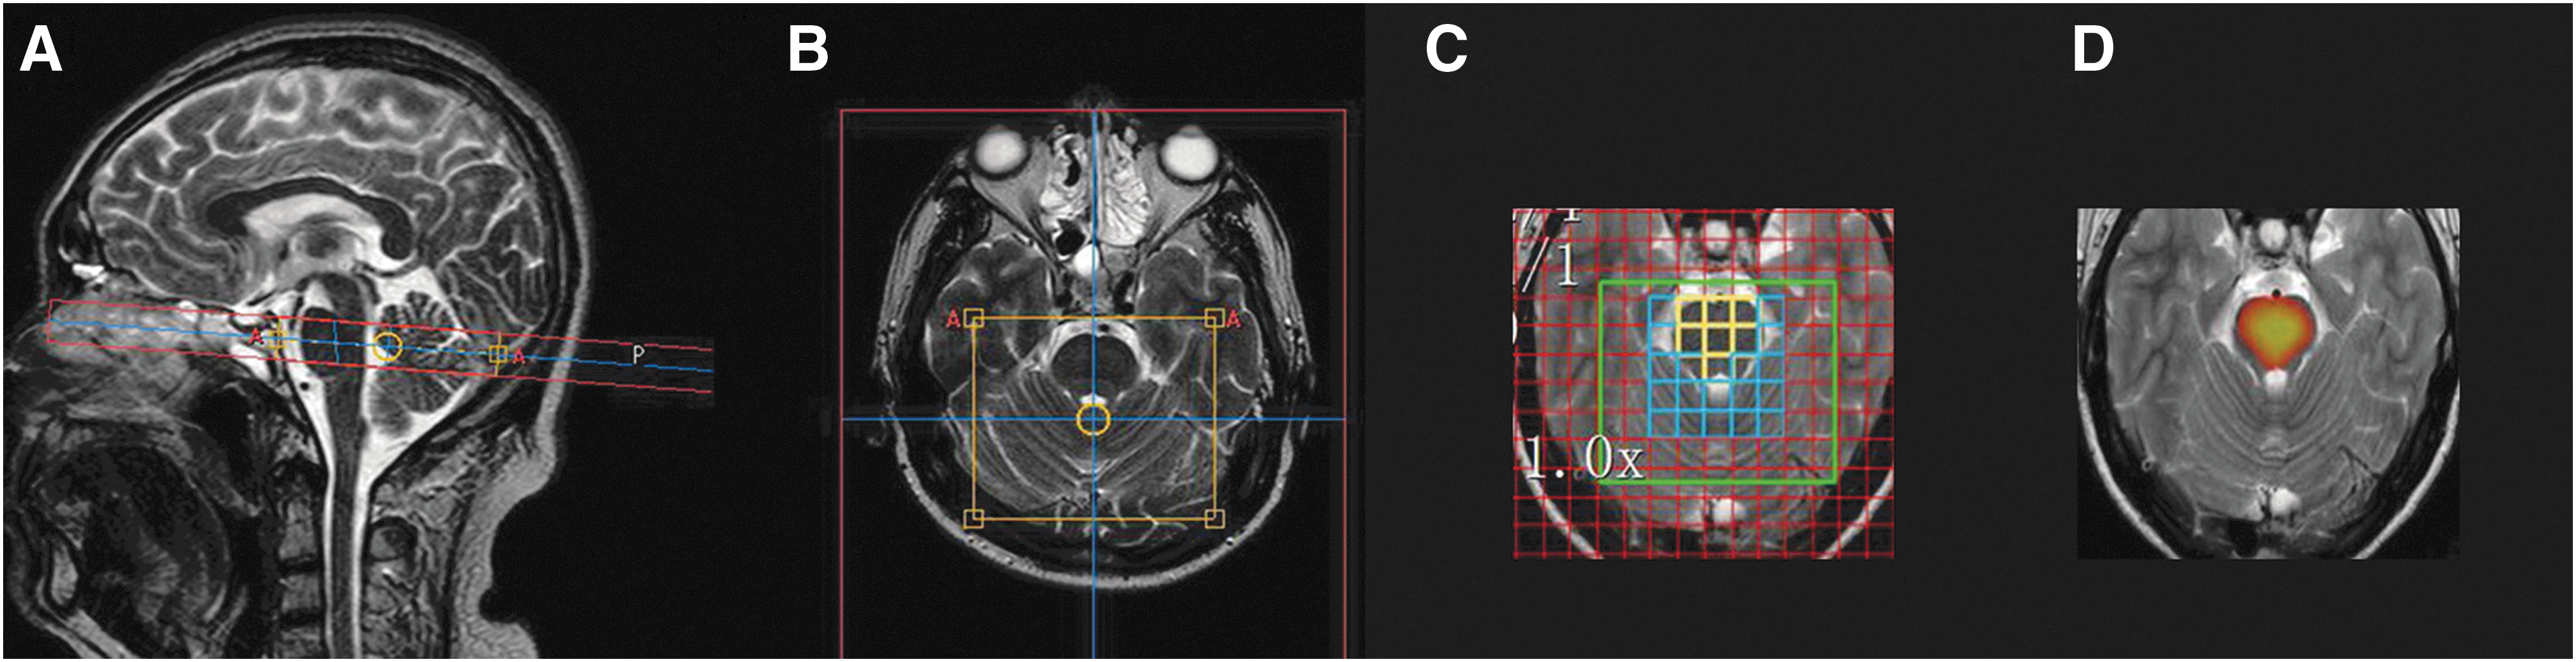
Positioning of the pons TSI scan and spectrum data processing. The TSI was positioned parallel to the anterior cranial fossa, showing the placement of volumes of interest in the pons. (
All MR raw data were transferred to a Philips Extended Workspace workstation (Achieva Release 2.6.3.5, Philips, Netherlands) or personal computer for analysis. The DTI were analyzed with Philips workstation. Using the fiber tracking application, 3D_T1 anatomical images were superimposed on a fractional anisotropy (FA) map to permit anatomical correlation. All the fibers connecting to the thalamus, whether it was descending or ascending, were reconstructed by multiple individual regions of interest (ROI) method with default parameters of program: FA thresholding value of 0.15, with maximum angle of 27 degrees and minimum fiber length of 10 mm. Three ROI were drawn freehand as the following methods: “Include” ROI was drawn to circumscribe the thalamus at its largest axial level, another “Include” ROI was drawn to circumscribe the ipsilateral hemisphere at just above the thalamus level, the last “exclude” ROI was drawn to circumscribe the corpus callosum on the midline sagittal image (Fig. 2). The FA, apparent diffusion coefficient (ADC), and lines of bilateral reconstructed fibers were obtained and averaged.

Post-processing steps of SIENAX to obtain peripheral grey matter (pgrey): (
The 3D_T1 data were processed using FSL (FMRIB Software Library
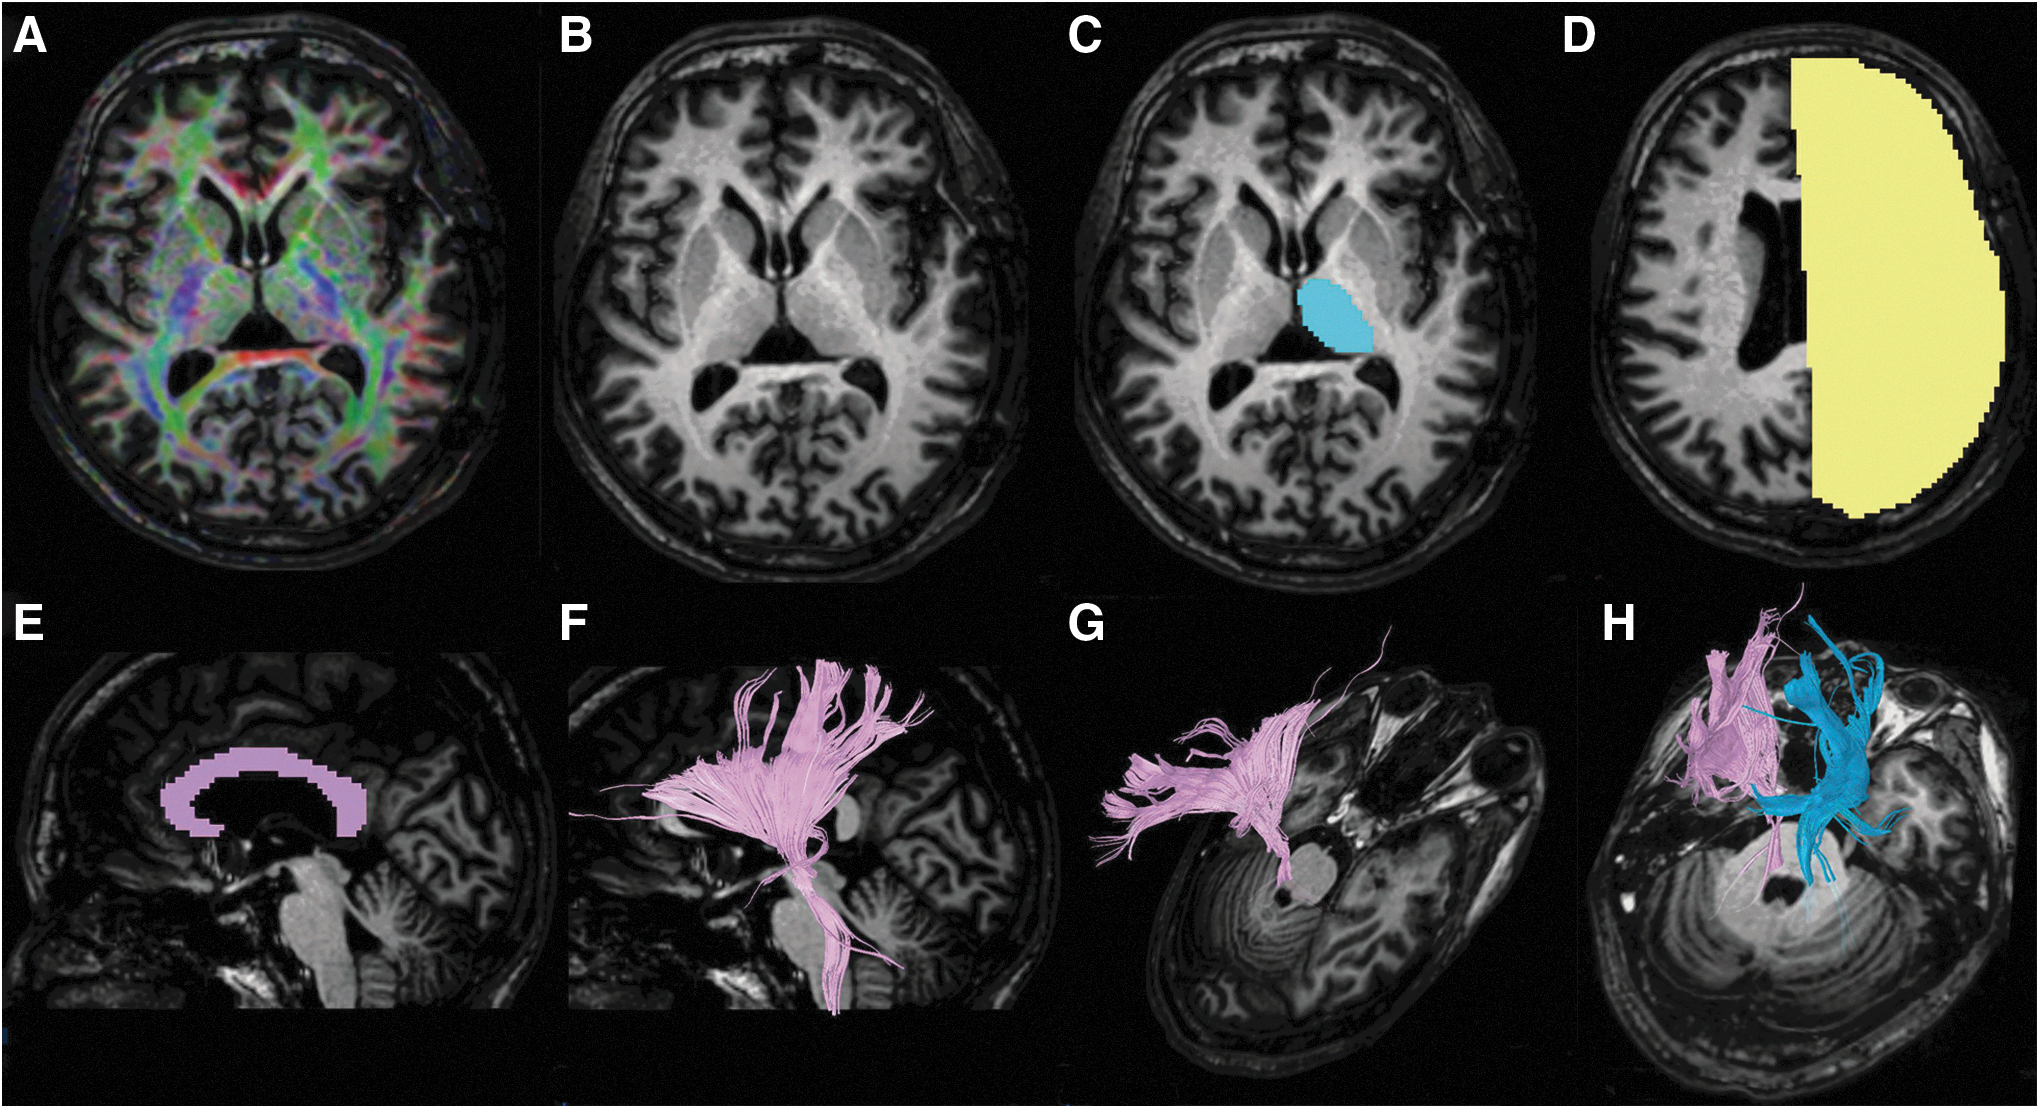
Reconstruction of fibers connecting to the thalamus. (A) three-dimensional (3D)_T1 anatomical images were superimposed on an fractional anisotropy map; (
The MRS data for the pons were processed with the Philips workstation using SpectroView software, by selecting LongTeBrain_csi, manually defining the ROI in the pons, and then selecting “display average.” The average metabolite concentrations and their ratios—i.e., N-acetylaspartate to creatine ratio (NAA/Cr)—were obtained.
Statistical analysis
Statistical analyses were performed using SPSS (v.19.0), and the threshold for statistical significance was set at p < 0.05. The patients were divided into two groups according to their final coma recovery result: recovery of consciousness (RC) and no recovery of consciousness (NRC). First, using single-factor analysis, independent variables were screened to select those with statistically significant differences between the two groups. The methods used for single-factor analysis are: “crosstab” chi-square analysis for nonranking count data such as sex, sedation during the examination; two independent samples t test for continuous variables such as age, NAA/Cr, pgrey, FA, ADC, and lines of fibers. Second, using binary logistic regression analysis, the selected variables were analyzed to find an effective predictive model for coma recovery.
Results
Of the 58 patients, consciousness was regained in 33 patients; among them, the consciousness recovery duration after TBI for 18 patients was less than one month, for 13 patients was one to six months, one patient was seven months, and one patient was 14 months. There were 25 patients who did not regain consciousness during the follow-up period; among them, three patients died in four to 12 months; the other 22 patients were followed at least 12 months. At the end of follow-up, eight patients among them were in a minimally conscious state, while 14 patients were in a vegetative state.
The results of single-factor analysis of variables for the RC and NRC groups are shown in Table 1, from which we could find that there were no statistically significant differences between the two groups in terms of sex (Pearson chi-square = 0.788, p = 0.375), sedation (Pearson chi-square = 0.045, p = 0.832), and yet there were statistically significant differences for age (p = 0.001), NAA/Cr of pons (p = 0.037), pgrey (p = 0.002), FA of fibers (p = 0.003), ADC of fibers (p = 0.002) and fiber lines (p = 0.022). When the RC group was compared with the NRC group, the NRC group had a lower NAA/Cr of pons (1.43 ± 0.54 vs. 1.70 ± 0.42), more fiber lines (1046.3 ± 100.8 vs. 975.6 ± 128.1), less pgrey (579.23 ± 78.85 vs. 638.23 ± 61.16), lower FA of fibers (0.42 ± 0.04 vs. 0.45 ± 0.03), older age (43.08 ± 14.61 vs. 30.57 ± 12.89) and higher ADC of fibers (0.99 ± 0.14 vs. 0.89 ± 0.06).
NAA/Cr = N-acetylaspartate to creatine ratio; FA = fractional anisotropy; ADC = .
Crosstab analysis, statistic is chi-square value.
Two independent samples t test, statistics are mean ± standard deviation.
The results of logistic regression analysis were shown in Table 2. When age, pgrey, ADC of fibers, FA of fibers, NAA/Cr of pons, fiber lines variables are entered, the regression results show that the age, pgrey, ADC of fibers, NAA/Cr of pons were selected into the logistic regression equation, while the fiber lines and FA of fibers were not selected. The pgrey and NAA/Cr of pons have a positive correlation with RC (B = 0.015, 2.342, respectively), while the age, ADC of fibers have a negative correlation with RC (B = -0.070, −13.647, respectively.
SE = standard error; ADC = apparent diffusion coefficient; pgrey = peripheral grey matter; NAA/CR = NAA/Cr = N-acetylaspartate to creatine ratio; FA = fractional anisotropy.
Regression method was“Enter.”Probability for stepwise: entry 0.05, removal 0.10.
Variables in the equation.
Variables not in the equation.
The predicted probability values (Pre) were saved during regression. The receiver operating characteristic (ROC) curve was drawn from the Pre, age, pgrey, ADC of fibers, NAA/Cr of pons, as shown in Figure 4. The area under the curve was 0.922 for Pre, 0.690 for NAA/Cr of pons, 0.721 for pgrey, 0.767 for ADC of fibers, and 0.742 for age.
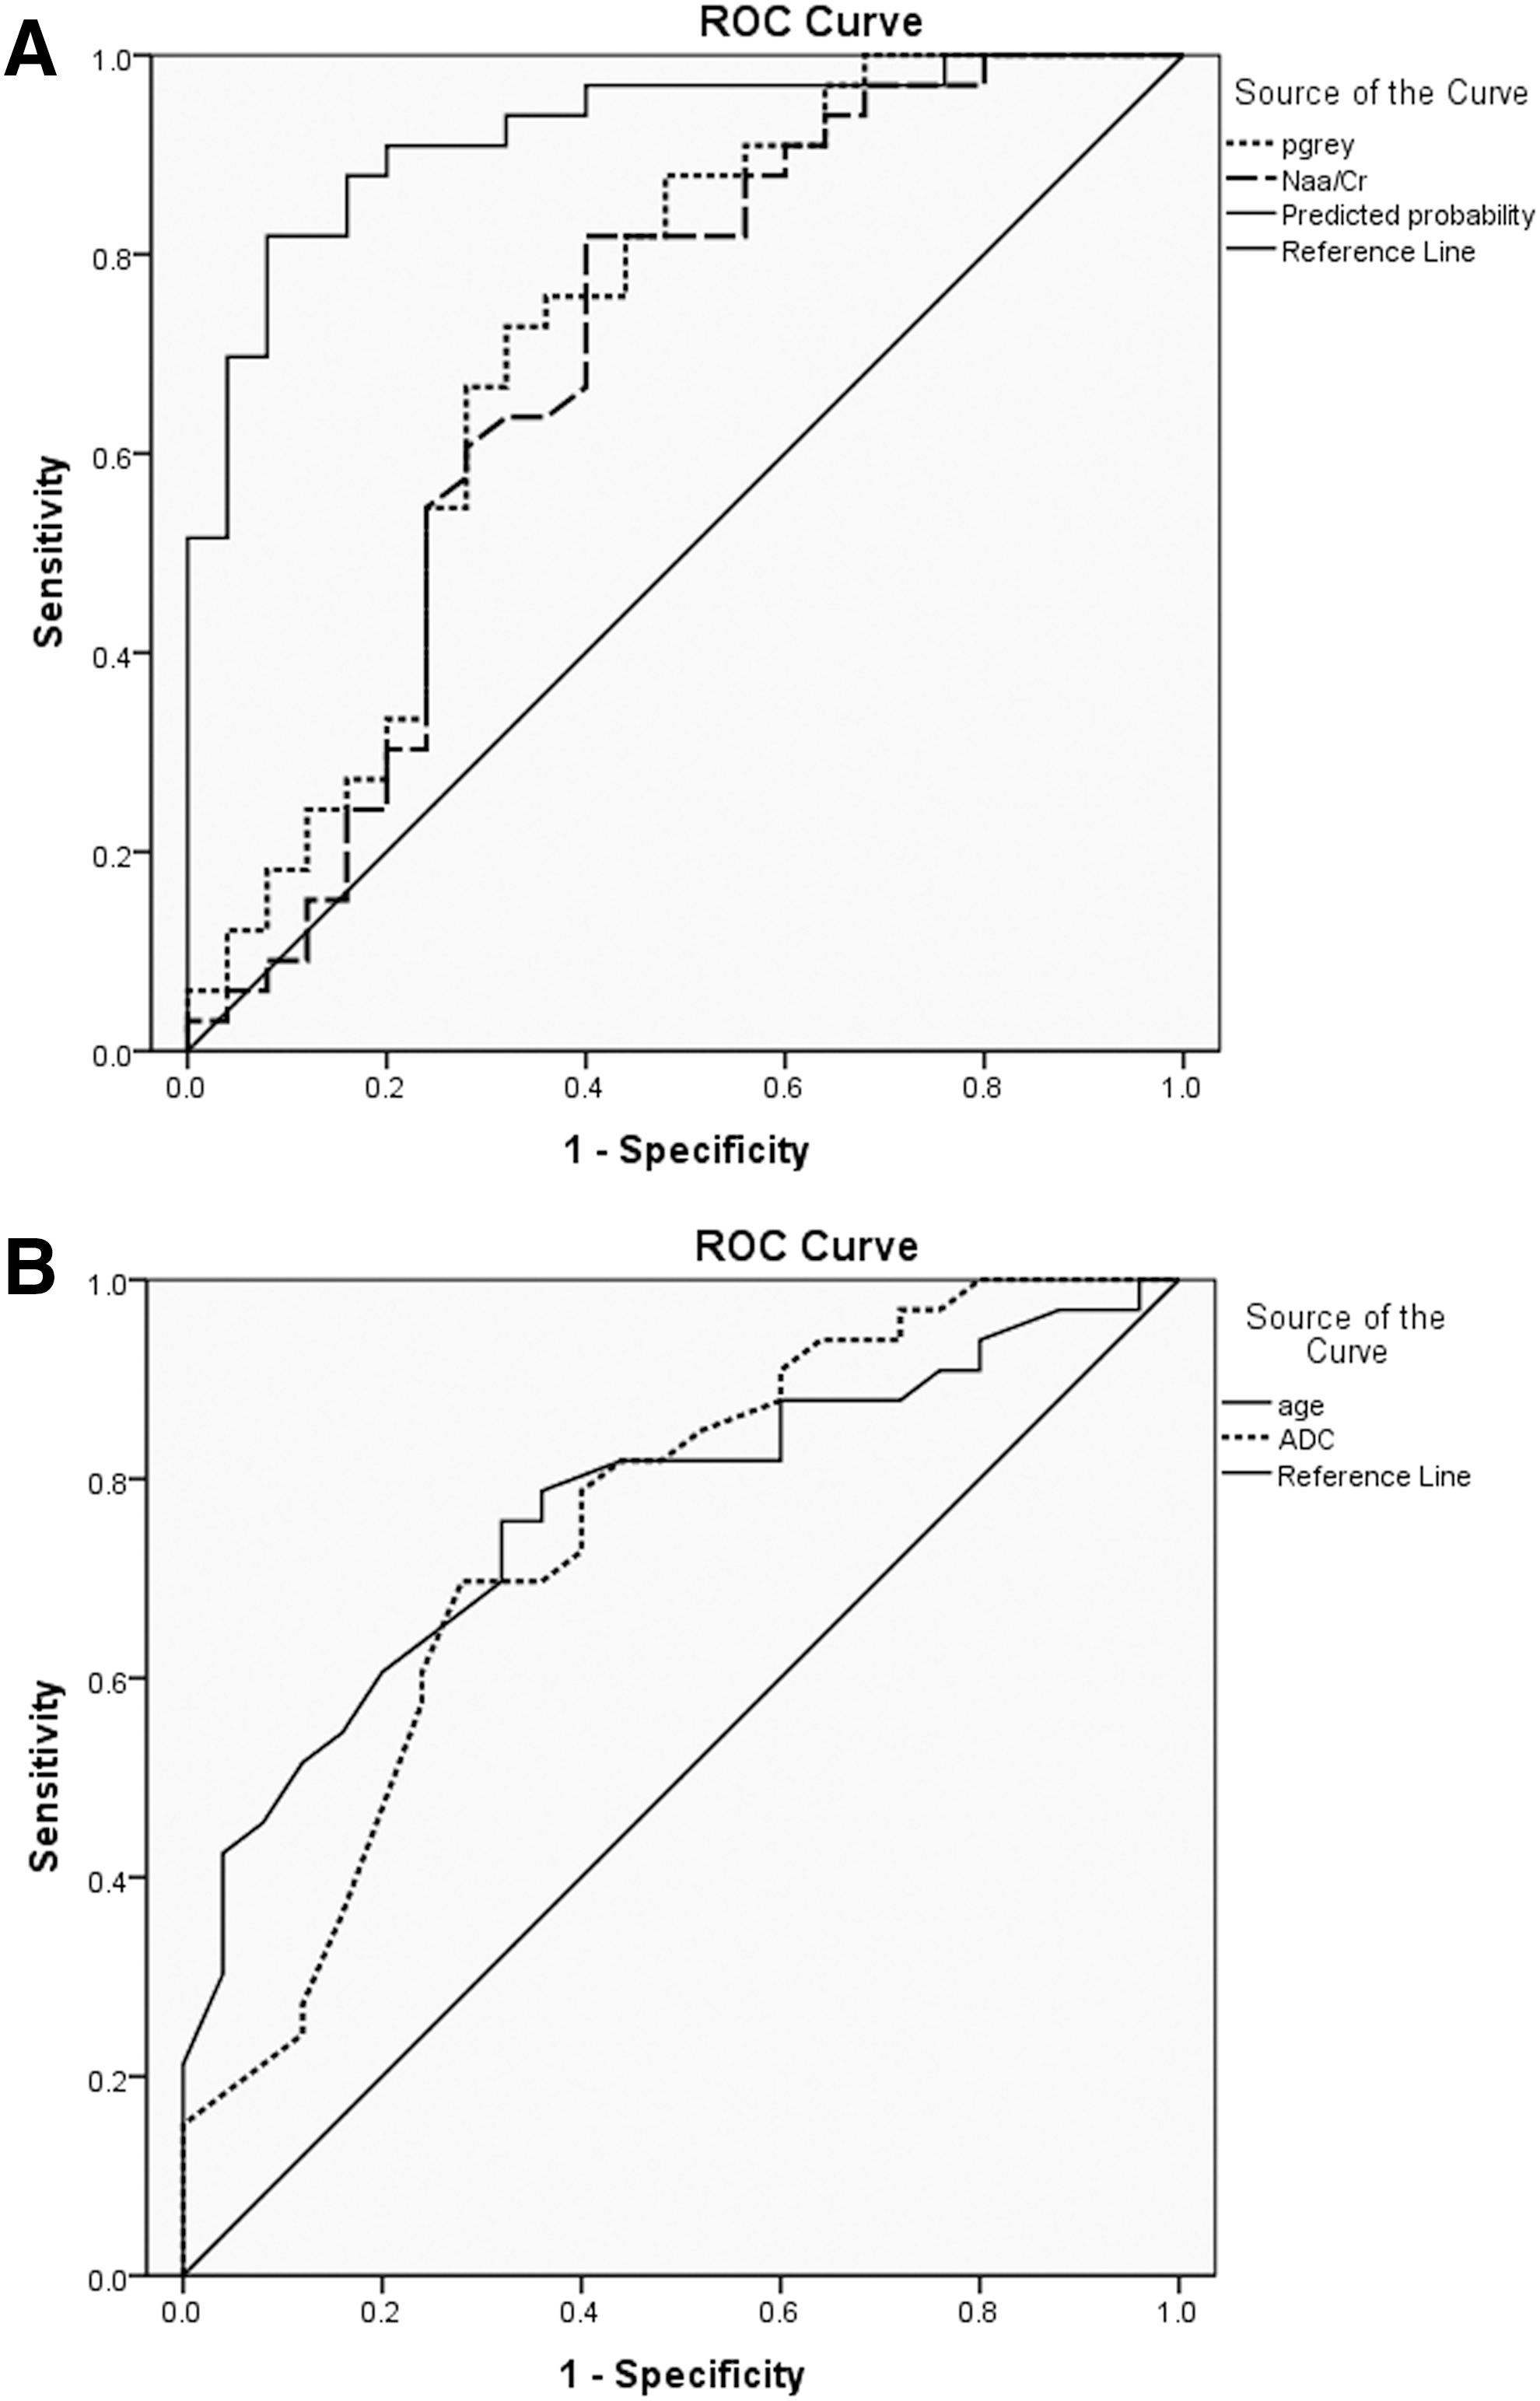
Receiver operating characteristic (ROC) curves for parameters to predict recovery of consciousness (RC).
Discussion
Consciousness was thought to represent an emergent property of cortical and subcortical neural networks and their reciprocal projections. The brain structures considered be relevant to consciousness are the ascending reticular activating system (ARAS), which is located mainly in the posterior upper part of the brainstem, the thalamus, and various specialized supratentorial areas of the cortex responsible for processing external and internal stimuli, short- and long-term storage, language comprehension and production, integration of information and problem solving, and attention. 16,17 Unconsciousness resulting from TBI was presumably from injury to the brainstem ARAS and thalamus, extensive damage to the cortex, or the interruption of white matter connections between the thalamus and cerebral cortex. 16 –19
DTI is better for observing microstructural damage to the white matter, using multi-directional gradients to obtain the anisotropy of water molecules diffusing in different directions within axons. The magnitude of diffusion of water molecules was represented by the ADC, which reflected the overall dispersion of molecules. 11,12 Tractography was a 3D modeling technique using the fiber assignment by continuous tracking (FACT) method to reconstruct fiber tracts, intuitively showing its projection, volume, and distribution characteristics. 20
MRS can detect the levels of brain metabolites in vivo. The main metabolites include N-acetyl aspartate (NAA), reflecting the density and activity of neurons; choline (Cho), reflecting the metabolic condition of the cell membrane; Cr, reflecting the overall metabolic level (relatively stable, and used as a reference). 21 Conventional MRS has difficulty measuring metabolites in the pons because of B0 inhomogeneity of the posterior fossa, whereas TSI is less sensitive to B0 inhomogeneity, and the scan time can be shortened to about 1 min if combined with sensitivity encoding, making it more suitable for use in the pons. 22,23 SINAX of FSL automated strip nonbrain tissue, segment brain tissue to get volume of pgrey matter, and normalized the volume for skull size to reduce head-size-related variability between subjects. 24 Based on the brain structures and the traumatic mechanism involved with unconsciousness and the features of different MR techniques, we have chosen structural MRI to observe damage of pgrey matter, DTI to observe the damage of nerve fiber bundles connecting the thalamus, and MRS to observe pontine injury.
A TBI-healthy control study has shown that NAA/Cr is associated with the prognosis of patients with TBI. 25 In another study, NAA/Cr of pons in the acute phase seems to separate patients who later recovered from patients with outcomes such as severe neurological impairment, death, or a vegetative state. 26 In the present study, lower NAA/Cr of pons in the NRC group compared with the RC group confirms these previous findings. Damage to neuronal cells would cause accelerated decomposition of NAA to acetyl coenzyme A and aspartate to provide energy and amino acids that are needed for membrane lipid synthesis and axonal myelin repair, so a significant decline in NAA would correspond to severe neuronal damage, implying a poor prognosis. 27
Among variables potentially influencing late recovery, several studies confirmed that patients who recovered responsiveness were significantly younger than patients who did not recover, while etiology did not significantly affect rate of recovery. 2,28,29 These results support the hypothesis that the adult brain has a decreased capacity for repair as it ages, because of a decreasing number of functioning neurons and a greater exposure to minor repetitive (often subclinical) insults to the brain as age increases. Our study also found that the age was an effective predictive value in terms of consciousness recovery. Because various supratentorial areas of the cortex play an important role in conscious awakening, 16,17 it is not surprising that the pgrey is an effective predictor of recovery of consciousness. Loss of pgrey can either be caused directly by brain injury or induced by secondary apoptosis, inflammation, excitotoxicity, and hypoperfusion.
In this study, the fibers connected to the thalamus, including going up to the cortex or down to ARAS, were reconstructed. Although NRC had a significantly lower FA of fibers, higher ADC of fibers, and less fiber lines than RC, FA of fibers and fiber lines were not included in the logistic regression equation. The ADC of fibers was the scalar measure of the total direction-independent diffusion in tissue, and increased ADC represents more free water molecules in tissue and destruction of barriers restricting diffusion (such as cell membrane and microtubules), and severe disruption of white matter microstructure. 30,31 FA describes the directional coherence of water diffusion in tissue, and decreased FA represents axonal swelling, decrease of myelin density, and axonal membrane thickness. 32 –34 That the FA of fibers failed to enter the predictive model may suggest that the increase of ADC of fibers may better reflect the severity of injury of fiber tracks.
The reconstruction of fiber was achieved by a computer-based algorithm under certain parameters such as: FA thresholding (terminate tracking when FA falls below a certain value), maximum angle (terminate tracking when angle between adjacent voxels exceeds a certain value), minimum length (fibers shorter than this minimum length will be discarded). So, under certain conditions, FA decreases, but the FA or angles do not exceed the limit; there are still fibers connected, which may undermine its predicting power.
The duration of this study was chosen to find a point of balance between the physiopathological changes and the medical and ethical issues raised by the management of TBI in patients. For example, the NAA began to decline minutes after trauma, reaching its lowest point within 48 h, and then became stable within a month after injury, whereas the NAA/Cr fluctuates during the six weeks to one-year period after TBI (decreasing or increasing depending on injury severity). 35 –37
Our study has limitations, and the results should be considered preliminary. The sample size was relatively small, and a larger sample is needed to overcome possible bias and to perform further detailed analysis (such as to determine how the predictive factors vary in patients with different speed of consciousness recovery). Patients were studied only once and were not evaluated for dynamic changes such as the progression of brain atrophy, 38 which is known to provide useful prognostic information. This study, however, was designed mainly to find a method for predicting the outcome of coma recovery at a relative early stage after TBI.
Methodological limitations should be noted also: observed indicators were limited, such as cerebral hemorrhage, encephalomalacia, etc., and were not included. First, this study is focused mainly on the structure of the brain related to consciousness; second, those indicators will also have an impact on the measured values such as fiber lines, pgrey, etc.
Conclusion
The results of this study show that the age, pgrey, ADC of fibers, NAA/Cr of pons are relatively the most effective prognostic indicators in a predictive model for recovery of consciousness. The pgrey, ADC of fibers, NAA/Cr indicators corresponded roughly with damage of the main brain structure such as the brainstem RAS, cortex, and connected white matter, which all play as an integrated whole system maintaining consciousness.
Footnotes
Author Disclosure Statement
No competing financial interests exist.