




Abstract
The Glasgow Outcome Scale–Extended (GOSE) was designed to assess global outcome after traumatic brain injury (TBI). Since its introduction, several empirically founded criticisms of the GOSE have been raised, including poor reliability; an insensitivity to small, but potentially meaningful, changes; a tendency to produce ceiling effects; inconsistent associations with neurocognitive, psychological, and quality-of-life measures; and an inability to assess the multi-dimensional nature of TBI outcome. The current project took a diagnostic approach to identifying the underlying causes of reported limitations by exploring the internal construct validity of the GOSE at 3 and 6 months post-injury using item response theory (IRT) techniques. Data were from the TRACK-TBI Pilot Study, a large (N = 586), prospective, multi-site project that included TBI cases of all injury severity levels. To assess the level of latent functional “impairment” captured by GOSE items independent of the assigned outcome category or GOSE total score, items were modified so that higher scores reflected greater impairment. Results showed that although the GOSE's items capture varying levels of impairment across a broad disability spectrum at 3 and 6 months, there was also evidence at each time point of item redundancy (multiple items capturing similar levels of impairment), item deficiency (lack of items capturing lower levels of impairment), and item inefficiency (items only capturing minimal impairment information). The findings illustrate the value of IRT to illuminate strengths and weaknesses of clinical outcome assessment measures and provide a framework for future measure refinement.
Introduction
The Glasgow Outcome Scale–Extended (GOSE) 1 and its predecessor, the Glasgow Outcome Scale (GOS), 2 are the most commonly used measures of global outcome after traumatic brain injury (TBI) 3 and were selected as “core” data elements for TBI research per the National Institute of Neurological Disorders and Stroke–sponsored Common Data Elements Workgroup. 4 The GOSE has been the primary outcome measure used in TBI studies aimed at U.S. Food and Drug Administration (FDA) registration and is currently the only outcome measure that has been accepted by the FDA for use in TBI research supporting New Drug Application approvals. 5 In light of the failure of past clinical trials of acute TBI treatment, however, the possible limitations in the GOSE's fitness as an outcome measure has recently been questioned. 6,7 This study used item response theory (IRT) analyses to take a diagnostic approach to exploring the strengths and weaknesses of the GOSE for sensitively measuring a wide spectrum of TBI-related disability.
The GOS was designed to address a need for a simple and standardized system for ordering patients into distinct outcome categories, with an early focus on patients who had experienced coma. 1 The original GOS used patient, family, or clinician responses to place patients into one of five broad categories: death, vegetative state, severe disability, moderate disability, or good outcome. 2 Early administration instructions were not standardized, and the criteria used to order patients into the upper three categories were rationally derived. In essence, patients who were dependent in self-care or unable to work (if they were working pre-injury) were classified as having severe disability. Patients who could care for themselves, but could not fully participate in pre-injury work or social activities, were classified as moderately disabled. Individuals who could perform all pre-injury work and social activities with minimal or no physical or mental deficits were labeled as demonstrating good recovery.
Recognizing that the limited number of GOS categories made it difficult to detect group differences or observe changes in recovery status, the measure was revised as the GOSE, with the upper three categories of the GOS divided into two levels each (“upper” and “lower”). 1 Thus, the GOSE is now scored on an 8-point ordinal scale where 1 = death, 2 = vegetative state, and 3–8 represent differing levels applicable to awake and responsive patients from lower severe disability to upper good recovery (see Nelson and colleagues 8 for a description of how these outcome levels are defined).
The GOS/GOSE initially had no standardized administration or scoring instructions, which may have contributed to variable inter-rater reliability estimates. 9 –12 Reliability improved somewhat with the introduction of a standardized interview format, 9,13 –16 although there is currently no universally accepted administration procedure. In the structured interview evaluated in this study, examinees are asked a series of questions about patients' abilities and participation with respect to basic and instrumental activities of daily living and social functioning (see Table 1 for the questions and their relationship to GOSE scores). Any report of dependence or decline in functioning is associated with a potential score on the GOSE scale (3–8 for individuals who are living and not in a vegetative state, the focus of this study), and the lowest of all domain scores becomes the overall GOSE score.2,16,17
GOSE Structured Interview Items, Scoring, and Recoding for IRT Analysis
The GOSE is typically scored such that the lowest domain score is used as the overall GOSE score.
Item 1 (ability to obey commands) was not included in analyses because it was a constant in this sample. Items pertaining to pre-injury status were also excluded given our interest in assessing the performance of the GOSE for quantifying injury-related functional limitations.
LGR, lower good recovery; LMD, lower moderate disability; LSD, lower severe disability; GOSE, Glasgow Outcome Scale–Extended; IRT, item response theory; UGR, upper good recovery; UMD, upper moderate disability; USD, upper severe disability; VS, vegetative state; n/a, not applicable.
Advantages of the GOSE include its emphasis on functioning in daily life, presumably of high relevance to patients and their families, as well as the relatively simple hierarchical structure, which has been regarded as straightforward to interpret, easy to use, and adaptable to TBI and other injury groups. 14,15,18 –20 The GOSE can also be administered through multiple assessment modalities (e.g., in-person, phone, or mail) 1,21,22 —factors that may explain why follow-up rates on the GOSE are higher than those of neurocognitive and other TBI outcome assessments. 23,24
Yet the GOSE also has a number of important shortcomings. For example, rater misclassification of patients persists, and the lack of a gold-standard method for administering the measure can preclude comparisons across or combining of samples. 9,10,12,16,21,25 –31 Ceiling effects have been suspected, if not demonstrated, 32 –36 even for the more fine-grained revised version (GOSE). 1,16,17 Further, the quasi-ordinal nature of GOSE outcome data makes the use of traditional statistical analyses based on interval variables inappropriate. Consequently, the measure is often dichotomized into “favorable” (e.g., GOSE scores 7–8 in many mild TBI studies) versus “unfavorable” outcome (GOSE scores ≤6), a procedure with potential drawbacks such as reduced variability, insufficient qualitative differences between categories straddling the cut point, and loss of statistical power. 37 Additionally, the cut point at which the GOSE is typically dichotomized for clinical trials may not be optimal, given our recent demonstration of elevated rates of residual symptoms and impairments in patients generally classified as achieving “good” (GOSE 7) recovery. 8
Given these issues, summarizing global outcome after TBI as one of eight broadly defined categories may not align with the field's push toward precision medicine, for which it is essential to utilize measures that accurately differentiate between individuals for both accurate prognoses and personalized care.
Objective and aims of the current project
Given the widespread use and reliance by TBI researchers and clinicians on the GOSE, understanding the instrument's structural and operational fitness is paramount to ensuring the valid assessment of patient outcomes in clinical trials. The current project took a diagnostic approach to identifying the underlying causes of reported limitations by exploring the internal construct validity of the GOSE using item response theory (IRT). IRT is a modeling technique routinely used to develop education- and health-related clinical assessment measures, 38 including the Patient Reported Outcomes Measurement Information System (PROMIS) 39 and the National Institutes of Health (NIH) Toolbox. 40 IRT provides tools to characterize the relationship between item responses and levels of an underlying dimensional construct (e.g., TBI-related functional impairment) and, in turn, can provide clues for how to improve existing health-related outcome measures. 38
A previous study applying a Rasch (one-parameter IRT) model to GOSE data collected from patients with remote mild-to-moderate TBIs suggested that the GOSE does not precisely measure the effect of injury on day-to-day activities and participation in this population. 41 However, this study had a small sample size for analyses of this nature (N = 89), studied patients much farther out from injury than is typical for clinical trials end points (mean [M] = 2.7 years), and did not consider a broader array of IRT models. In particular, whereas one-parameter models only quantify item difficulty (e.g., level of severity of TBI-related disability needed to expect an item to be endorsed), two-parameter models additionally allow items to vary in the degree to which they differentiate (discriminate) between patients differing in disability at the item's severity level. Figure 1 provides an example of items with different difficulty and discrimination parameters. The three items represented with solid lines have varying difficulty parameters, but the same discrimination parameter; the item represented by the dashed line is less discriminating.

Item response functions (IRFs) from a two-parameter item response theory (2PL-IRT) model, using four hypothetical dichotomous items within a hypothetical test. This model allows one to characterize items both in term of their “difficulty” and “discrimination.” Difficulty reflects the level of the latent construct (i.e., the point along the x-axis) at which participants have a 50% chance of endorsing an item. For example, among the three items depicted by solid lines, a lower level of the latent construct is required to endorse the lighter colored (leftmost) line, where a higher level of the construct is needed to endorse the solid black line. Discrimination reflects the slope of the line at the difficulty level of the item, where steeper slopes translate to being able to estimate individuals along the latent continuum with more precision (lower standard errors). In other words, items with high discrimination (solid lines) yield more “information” (i.e., more precise estimates) of individuals' scores on the latent construct of interest than items with lower discrimination (dashed line). For the goal of measuring TBI-related functional limitations along a wide spectrum of severity, a desirable test would contain items high in discrimination that span a wide range of difficulty (severity) levels. TBI, traumatic brain injury.
Using data from the multi-center
Methods
Study population
Data for the present study were from the TRACK-TBI Pilot Study database (N = 586). Because of our interest in the performance of the GOSE as a measure of TBI-related disability and because the proposed analyses require item-level data about daily functioning, participants who were dead or living in a vegetative state were excluded. Further, as described under Statistical analysis, we excluded individuals who were not working pre-injury from the analyses. Overall, 432 participants met inclusion criteria, 384 with 3-month and 348 with 6-month outcome data. The extracted sample ranged in age from 16 to 94 years (M = 43.3; standard deviation [SD] = 18.5) and were predominantly male (70.4%), Caucasian (80.7%; black = 7.4%; other = 11.9%), and educated (57.4% completed high school; 32.5% attended at least some college).
A summary of the demographic and injury characteristics of the full TRACK-TBI Pilot study sample and the sample used in analyses can be found in Table 2. Comparisons of subsamples included versus not included analyses at 3 and 6 months were not statistically significantly different in sex, race, Injury Severity Score, 42,43 or TBI severity (Glasgow Coma Scale 44 score group; presence vs. absence of computed tomography [CT] abnormalities at admission). Compared to the sample not included in analyses, the sample included in analyses was somewhat younger (age difference, M = 4 years at both 3 and 6 months; ps ≤ 0.011) and more educated (23.0% vs. 33.6% college educated at 3 months and 24.7% vs. 33.6% at 6 months; ps ≤ 0.007).
Demographic and Injury Characteristics of the TRACK-TBI Sample and Cases Included in 3- and 6-Month Analyses
The Injury Severity Score (ISS; range 1 to 75) is computed as the sum of the squares of the highest Abbreviated Injury Scale (AIS) score from the three most severely injured body regions. 42
The AIS allows for ratings of tissue damage on a 6-point ordinal scale (from 1 = minor to 6 = virtually unsurvivable) separately by body regions, including the head or neck, face, extremities or pelvic girdle, chest/thorax, abdomen, and external regions. We defined the maximum polytrauma AIS score using ratings from all body regions except for the head/neck and face. 42,43
The Glasgow Coma Scale score provides a crude index of level of consciousness, with possible scores ranging from 3 to 15. 44
CT, computed tomography; M, mean; SD, standard deviation.
Glasgow Outcome Scale–Extended
The GOSE 1 is scored on an 8-point ordinal scale ranging from Death (1) to Upper Good Recovery (8), although only patients who could achieve a score of 3–8 were relevant to this study. Table 1 lists the structured interview questions used in this study and how item responses can affect GOSE total scores. The GOSE is scored such that any report of injury-related functional limitations is associated with a level of disability (i.e., potential GOSE score), and the lowest score across the item responses is used as the overall GOSE score. The relative effects of TBI versus peripheral injuries on changes in functioning were not discerned in this study. The GOSE has been found to have excellent test-retest reliability (KW = 0.92) across structured interview formats (in-person vs. telephone) and good inter-rater reliability when ratings are made by psychologists and nurses (KW = 0.84). 21
Procedures
TRACK-TBI pilot study patient recruitment and eligibility
Patients with TBI were recruited acutely from three U.S. acute care centers: San Francisco General Hospital, University of Pittsburgh Medical Center, and University Medical Center Brackenridge in Austin, Texas, as well as a single rehabilitation center located at the Mount Sinai Rehabilitation Center (MSRC) in New York City (this latter cohort is not reported on here). 1* Patient eligibility included English-speaking, presentation at a participating site with an external force head trauma, and a clinically ordered CT scan completed within 24 h of injury. Exclusion criteria included pregnancy, incarceration, comorbid life-threatening disease, and active psychiatric hold. Representative institutional review boards for each site approved the study, and written informed consent was obtained from all participants or their legally authorized representatives. For details about the TRACK-TBI Pilot Study population and recruitment conditions, see McMahon and colleagues 45 and Yue and colleagues. 46
Outcome assessment schedule and study sample selection criteria
The structured interview form of the GOSE was administered by telephone at the 3-month time and in-person at the 6-month time point.
Overview of item response theory modeling
Using IRT, one posits that a cohesive dimension or construct (e.g., TBI-related disability) exists that is reflected by responses to a set of items. In modeling that latent dimension, one can then estimate parameters that quantify the type and strength of relationship between item responses and individuals' levels on the dimension. In the two-parameter IRT model discussed here, item performance is quantified through two metrics (depicted in Fig. 1). Item difficulty (a.k.a., severity, denoted b) refers to the level of severity (i.e., disability, denoted theta, θ) at which a patient has a 50% chance of endorsing an item (in the case of binary items).
In measuring TBI-related disability, for example, one would expect that items about limitations in self-care and social functioning would have different difficulty/severity levels, where a relatively high level of disability is needed to show impairment in basic self-care abilities, whereas impairments in complex activities, such as social functioning, might occur with lower levels of disability. The second item parameter, discrimination (denoted a), reflects how strongly an item is related to the latent dimension (akin to and sometimes equivalent to a loading in factor analysis). Items with higher discrimination provide more information about where individuals fall around their level of disability, which corresponds to being able to estimate individuals' levels on the latent dimension more precisely (i.e., with smaller standard errors).
For any pattern of item responses, severity and discrimination parameters can then be used to compute an IRT score that represents an individual's estimated location on the continuum of the latent trait that have, in some contexts, been shown to yield more efficient and sensitive measurement of group differences and change over time than classic approaches to scoring a measure based on classical test theory (CTT). 38,47,48 IRT-based scores have a number of potential advantages over CTT-based scoring approaches, which have been described elsewhere. 38
Researchers conducting IRT analyses are typically interested in using graphical methods to interpret item and test properties. Such graphics include the item response function, which traces the probability of endorsing an item across the latent variable continuum, and the item information function, which shows the precision with which the item captures someone's location on latent variable continuum. Item information is often used as an index of an item's ability to differentiate between individuals with different latent trait scores. When graphed as an item information curve (IIC), the point along the x-axis (θ) at which information is highest reflects item severity (b), and the height of the IIC is a function of item discrimination (a). In addition to evaluating item-level characteristics, one can evaluate the ability of a test as a whole to yield precise estimates of θ across the continuum of disability by summing all item information functions at each value of θ to yield the test's total information (I) function. The inverse of test information in IRT is somewhat analogous to the standard error of measurement (SEM) in CTT; however, unlike the SEM in CTT, IRT test information exhibits a different value depending on the respondent's location on the latent variable continuum (see p. 3 of an earlier work by Weiss). 49
Glasgow Outcome Scale–Extended item reorganization and modifications
Table 1 summarizes how we coded item responses to the structured interview 16 for IRT analysis (highly similar to the approach taken by Hong and colleagues 41 ). First, item 1 (ability to obey commands) was not included in the analyses given that it was a constant in this sample. Second, items concerning pre-injury status (not depicted in Table 1) were excluded, because these items were intended to facilitate ratings that reflect post-injury function relative to pre-injury function, but should not otherwise inform current function (see p. 576 of Wilson and colleagues). 16 Third, the rating scales of all items were scaled such that endorsement or higher scores reflected greater functional limitations (i.e., less independence, reduced work capacity, etc.). Fourth, for domains in which endorsement of the first item (2a, 5a, 6a, and 7a) requires response to a subsequent item concerning the extent of impairment (2b, 5b, 6b, and 7b), “a” items were merged with “b” items to form combined 3-point (0, 1, and 2) or 4-point (0, 1, 2, and 3) ordinal items. The three new items retained the “b” designation whereas the “a” items were dropped from the models. However, the effect of low endorsement rates (<10%) on the Independence in the Home item (2b) and high correlations (r = 0.86 at 3 months; r = 0.92 at 6 months) between the two Independence Outside the Home items (3a, 4a) produced perfectly discriminating (Guttman-type) items with slopes >5, requiring further item modification. 50
We then combined items 3a and 4a into a single dichotomous item where only cases endorsing both items in the pair were coded 1 (impairment) and cases endorsing neither or one of the items in the pair were coded 0 (none or some impairment). However, item 2 and item 3/4 remained highly correlated and, when introduced within the same IRT model, continued to yield discrimination values >5. Because combining these items did not remedy this issue, we primarily report the findings excluding item 2 from the model, but describe how item 2 performed in supplemental analyses in the prose.
Statistical analysis
Item response theory assumptions and model appropriateness
Most IRT analyses assume unidimensionality (i.e., that items measure a single underlying latent trait), monotonicity (that items either are all positively or all negatively related to the total score), and local independence (that only the latent trait influence item endorsement). 51 These assumptions were tested using the 3- and 6-month samples. There is not a universally accepted approach to determining that data are sufficiently unidimensional to perform IRT analyses. Following common recommendations, we primarily tested this by evaluating the fit of a one-factor confirmatory factor analysis (CFA) model.
We report the findings using robust unweighted least squares (ULSMV) estimation because of the high degree of skew (and therefore likely multi-variate non-normality of the data) and based on a published simulation study finding ULSMV to perform better than maximum likelihood estimation with data similar in form to the GOSE. 52 A disadvantage of estimation methods for categorical data is that, unlike full information maximum likelihood estimation procedures, they are not robust to data that are missing at random (MAR). To avoid knowingly submitting data to the model that were MAR, we opted to only analyze data for individuals who were working pre-injury (i.e., we excluded cases that had missingness on item 5 because of the question being irrelevant). This necessarily limits the applicability of the reported results to such individuals.
Common recommendations to consider a CFA model to fit well are root mean square error of approximation (RMSEA) <0.05 or <0.06 (although <0.08 has been described as fair) and comparative fit index (CFI)/Tucker Lewis index (TLI) >0.95 (but acceptable if >0.90). 53,54 However, these cutoffs are based on work done with interval-level data and maximum likelihood estimation, and there are no well-established cutoffs at this time for categorical data and associated estimation approaches. Because it was our goal to use IRT analyses to provide diagnostic clues about areas for improvement of the GOSE and because of uncertainty in the appropriateness of these cutoffs for our data, we deemed it acceptable to apply these decision rules rather loosely so long as the data appeared reasonably unidimensional. Second, we also evaluated internal consistency reliability of the item set at both 3 and 6 months. Total omega (with bias-corrected and accelerated confidence intervals) was selected over coefficient alpha because of its less-restrictive assumptions (as recommended by Dunn and colleagues 55 ). We considered 0.70 as an accepted minimum level of internal consistency reliability. 56
Point-biserial correlations between GOSE total scores and dichotomized (endorsed/not endorsed) items 57,58 (range r = −0.31 to −0.77) indicated that, at both time points, the six items were reasonably monotonic. IRT models were then fit at both time points to assess local dependence. All local dependence χ2 values at 3 months were below the lower (optimal) threshold of |5|. 59
For the IRT analyses, we selected a two-parameter/graded response (2PL/GR) hybrid model over a one-parameter (1PL) equivalent of this model (1PL/partial credit hybrid model). Whereas “two parameters” reflects the separate estimation of difficulty and discrimination parameters for each item, the term “2PL” is typically reserved for two-parameter models fit with dichotomous items, whereas the GR model represents an extension of the two-parameter model that uses polytomous items. An advantage of IRT is its flexibility in placing items with different numbers of response options onto the same (theta) scale. Our selection of the 2PL/GR model was based on an a priori preference to allow items to vary in discrimination, a decision that was supported statistically by our finding that the 2PL/GR model fit better (by likelihood ratio test) than a model where discrimination parameters were fixed across items. 2† In particular, significant likelihood ratio tests performed at 3 months (χ 2 [4] = 125.11; p < 0.001) and 6 months (χ 2 [4] = 101.05; p < 0.001) indicated that one or more items differed in discrimination from each other at each time point. 59
Finally, patient-level IRT scores (response pattern-based expected a priori scores) 60 were computed from the final 3- and 6-month IRT models for correlation with GOSE overall scores. For a handful of cases (11 at 3 months, 4 at 6 months), our strategy for recoding items 3 and 4 (i.e., coding endorsement of only one of these two items to reflect lack of impairment in Independence Outside the Home), while necessary to fit an acceptable IRT model, carried the potential to underestimate the relationship between traditional and IRT-based GOSE scores for non-substantive reasons. These cases are denoted with separate markers (squares) in Figure 3A and were not used to compute correlations.
Data analysis software
Preparatory descriptive and inferential analyses were run using SPSS software (v24; SPSS, Inc., Chicago, IL). 61 The CFAs were performed using Mplus (version 7.4; Muthén & Muthén, Los Angeles, CA), 62 with omega reliability analyses performed in R 63 using the MBESS package (R Foundation for Statistical Computing, Vienna, Austria). 55 All IRT analyses were run using IRTPRO (v4.2; Scientific Software International, Inc., Lincolnwood, IL). 64 For all analyses, alpha was set at 0.05, unless otherwise noted.
Results
Confirmatory factor analyses
Table 3 summarizes the model fit information and item parameter estimates of the 3- and 6-month one-factor CFAs. Fit statistics were sufficiently acceptable to warrant proceeding with IRT analyses, but were not universally supportive of strong unidimensionality. In particular, CFI and TLI were acceptable to good for 3 and 6 months (range, 0.933–0.983). RMSEA was within an acceptable (<0.08), but not good (<0.05), range (0.065 at 3 months; 0.079 at 6 months) at both time points. Factor loadings were satisfactory across all items, ranging from 0.52 to 0.95 at 3 months and from 0.43 to 0.95 at 6 months. Omega reliability (0.79 at both time points) was above the minimal acceptable threshold of 0.70.
Results Summaries for 1-Factor CFAs and Unidimensional IRT Models at 3 and 6 Months
2PL/GR IRT, two-parameter (1PL) logistic/graded response (GR) item response theory model; CFA, confirmatory factor analysis; CFI, comparative fit index; CI, confidence interval; IRT, item response theory; RMSEA, root mean square error of approximation; TLI, Tucker Lewis index.
Item response theory analyses: Sensitivity of Glasgow Outcome Scale–Extended items to traumatic brain injury–related disability
Item severity (difficulty; b) and discrimination (a) estimates are listed in Table 3. Severity estimates were mostly at a moderate-to-high level of severity and scaled roughly in an expectable direction. In particular, item 8a (Return to Normal Life; reflecting nonspecific symptoms) was least severe (b range, −0.36 to −0.30 over time) and item 3a4a (Independence Outside the Home) most severe (b range = 1.73–2.12), whereas item 5b (Work; b range, 0.74–1.51) and 6b (Social & Leisure Activities; b range, 0.47–1.55) fell in the middle of the severity spectrum as compared to other GOSE items. The severity estimate for item 7b (Family & Friendships) suggested a moderately high severity, but this may be less meaningful in light of the item's low discrimination. Item discriminations varied widely within and across both time points, with 6b (Social & Leisure Activities) most discriminating at both 3 (a = 4.91) and 6 months (a = 4.11) and 7b (Family & Friendships) least discriminating at both time points (a = 1.19–1.04).
Figure 2 depicts the item and test information functions for GOSE items 3–8. For items 3–7, both figures showed a similar pattern of results at 3 and 6 months in that item 6 yielded the most information across the widest theta interval, item 3a4a a moderate amount of information, and 5b and 7b lower information. The nearly flat information curve for 7b (Family & Friendships) indicates that this item provides minimal information to differentiate individuals along the impairment continuum. Item 8, the only item tapping a low level of severity, showed low information at 3 months, but high information at 6 months. The black total information curves also shown in Figure 1 illustrate that the information provided by these GOSE items about TBI-related disability as a whole is most for higher levels of impairment (i.e., they are located largely on the right side of the x-axis in the range of theta 0 to +3), and only one item (8a) can differentiate between individuals with milder levels of impairment (theta −3 to 0).
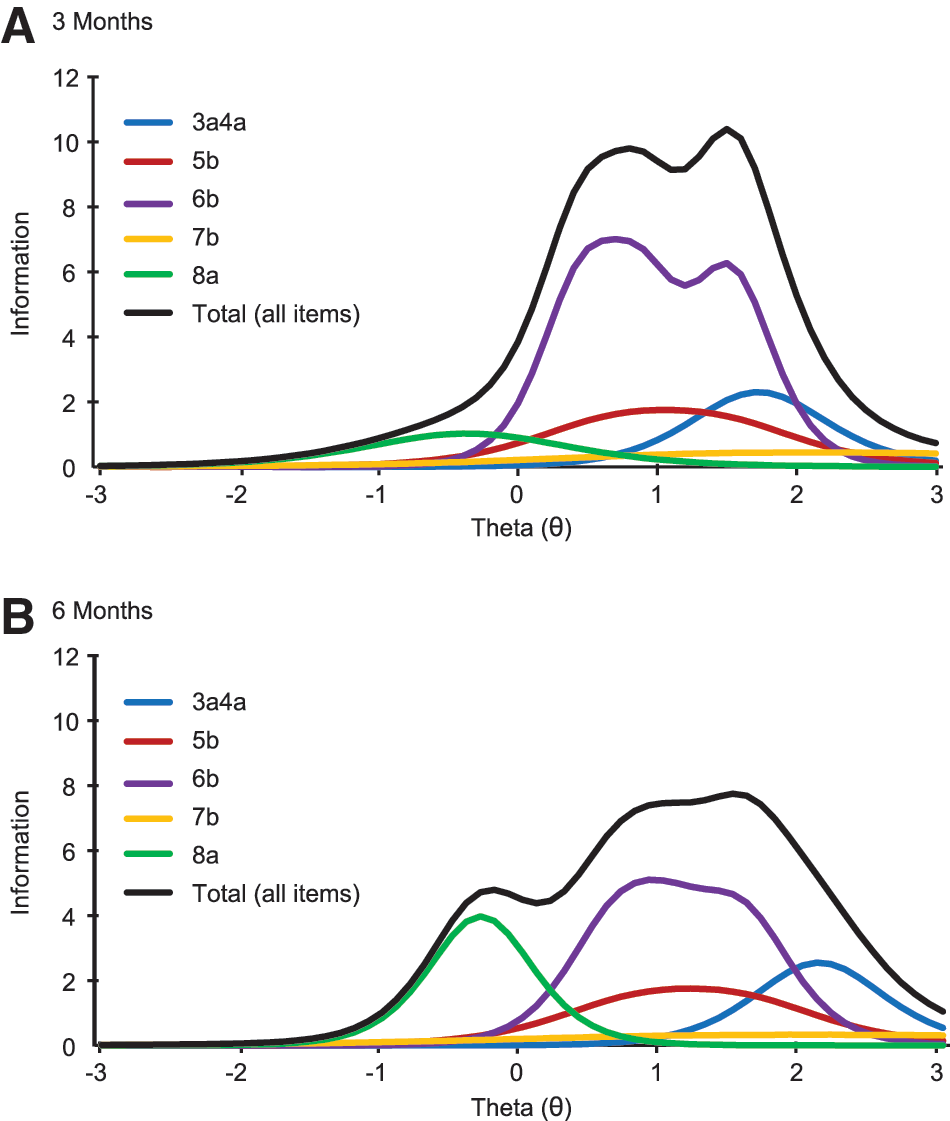
Two-parameter/graded response hybrid model item and total information functions (curves) for the five modified items of the GOSE instrument at 3 (
As described earlier, item 2b (Independence at Home) was not included in the above-mentioned model because, perhaps attributed to a high correlation between items 2b and 3a4a (r ∼ 0.80), discrimination values for these items were too high to trust (>5) when both were included in the model. However, sensitivity analyses were conducted to estimate the contribution of item 2b to the performance of the GOSE. When including both items 2b and 3a4a in a single IRT model (alongside the other GOSE items), the item information curves for the two items nearly perfectly overlapped. When excluding item 3a4a, but including item 2b, the item parameters nearly perfectly matched those of item 3a4a from the model reported in Table 3 (item 2b a = 3.01, b = 1.72, vs. item 3a4a a = 3.03, b = 1.73), and the resulting test information function closely matched that of Figure 2. Similarly, estimated theta scores from any of these three models (including both 2b and 3a4a, excluding 2b, or excluding 3a4a) yielded estimates that correlated ≥0.99 with each other. Taken together, these analyses indicate that items 2b and 3a4a could be considered redundant from a psychometric perspective, given that they appear to contribute the same amount of information about the same level of TBI-related functional limitations.
Overlap between Glasgow Outcome Scale–Extended total scores and item response theory–assessed latent impairment (theta) scores
Figure 3 plots the relation between latent impairment (x-axis) and GOSE total scores (y-axis) at 3 and 6 months, respectively, with circles denoting cases. Overall, GOSE total scores (determined by the minimum domain score across items as detailed in Table 1) correlate strongly and negatively with latent impairment scores (Spearman's ρ = −0.94 and −0.93 at 3 and 6 months, respectively). This indicates that, whereas traditional and IRT-based scores are strongly associated in the expected direction, a non-trivial percentage of variance (12–14%; e.g., 1–0.942) is not shared among these two measurement approaches. With the exception of GOSE 8, there was substantial variability in the IRT scores within each GOSE category, suggesting that IRT scores are more sensitive to individual differences in impairment relative to the coarse categorization of standard GOSE scores.
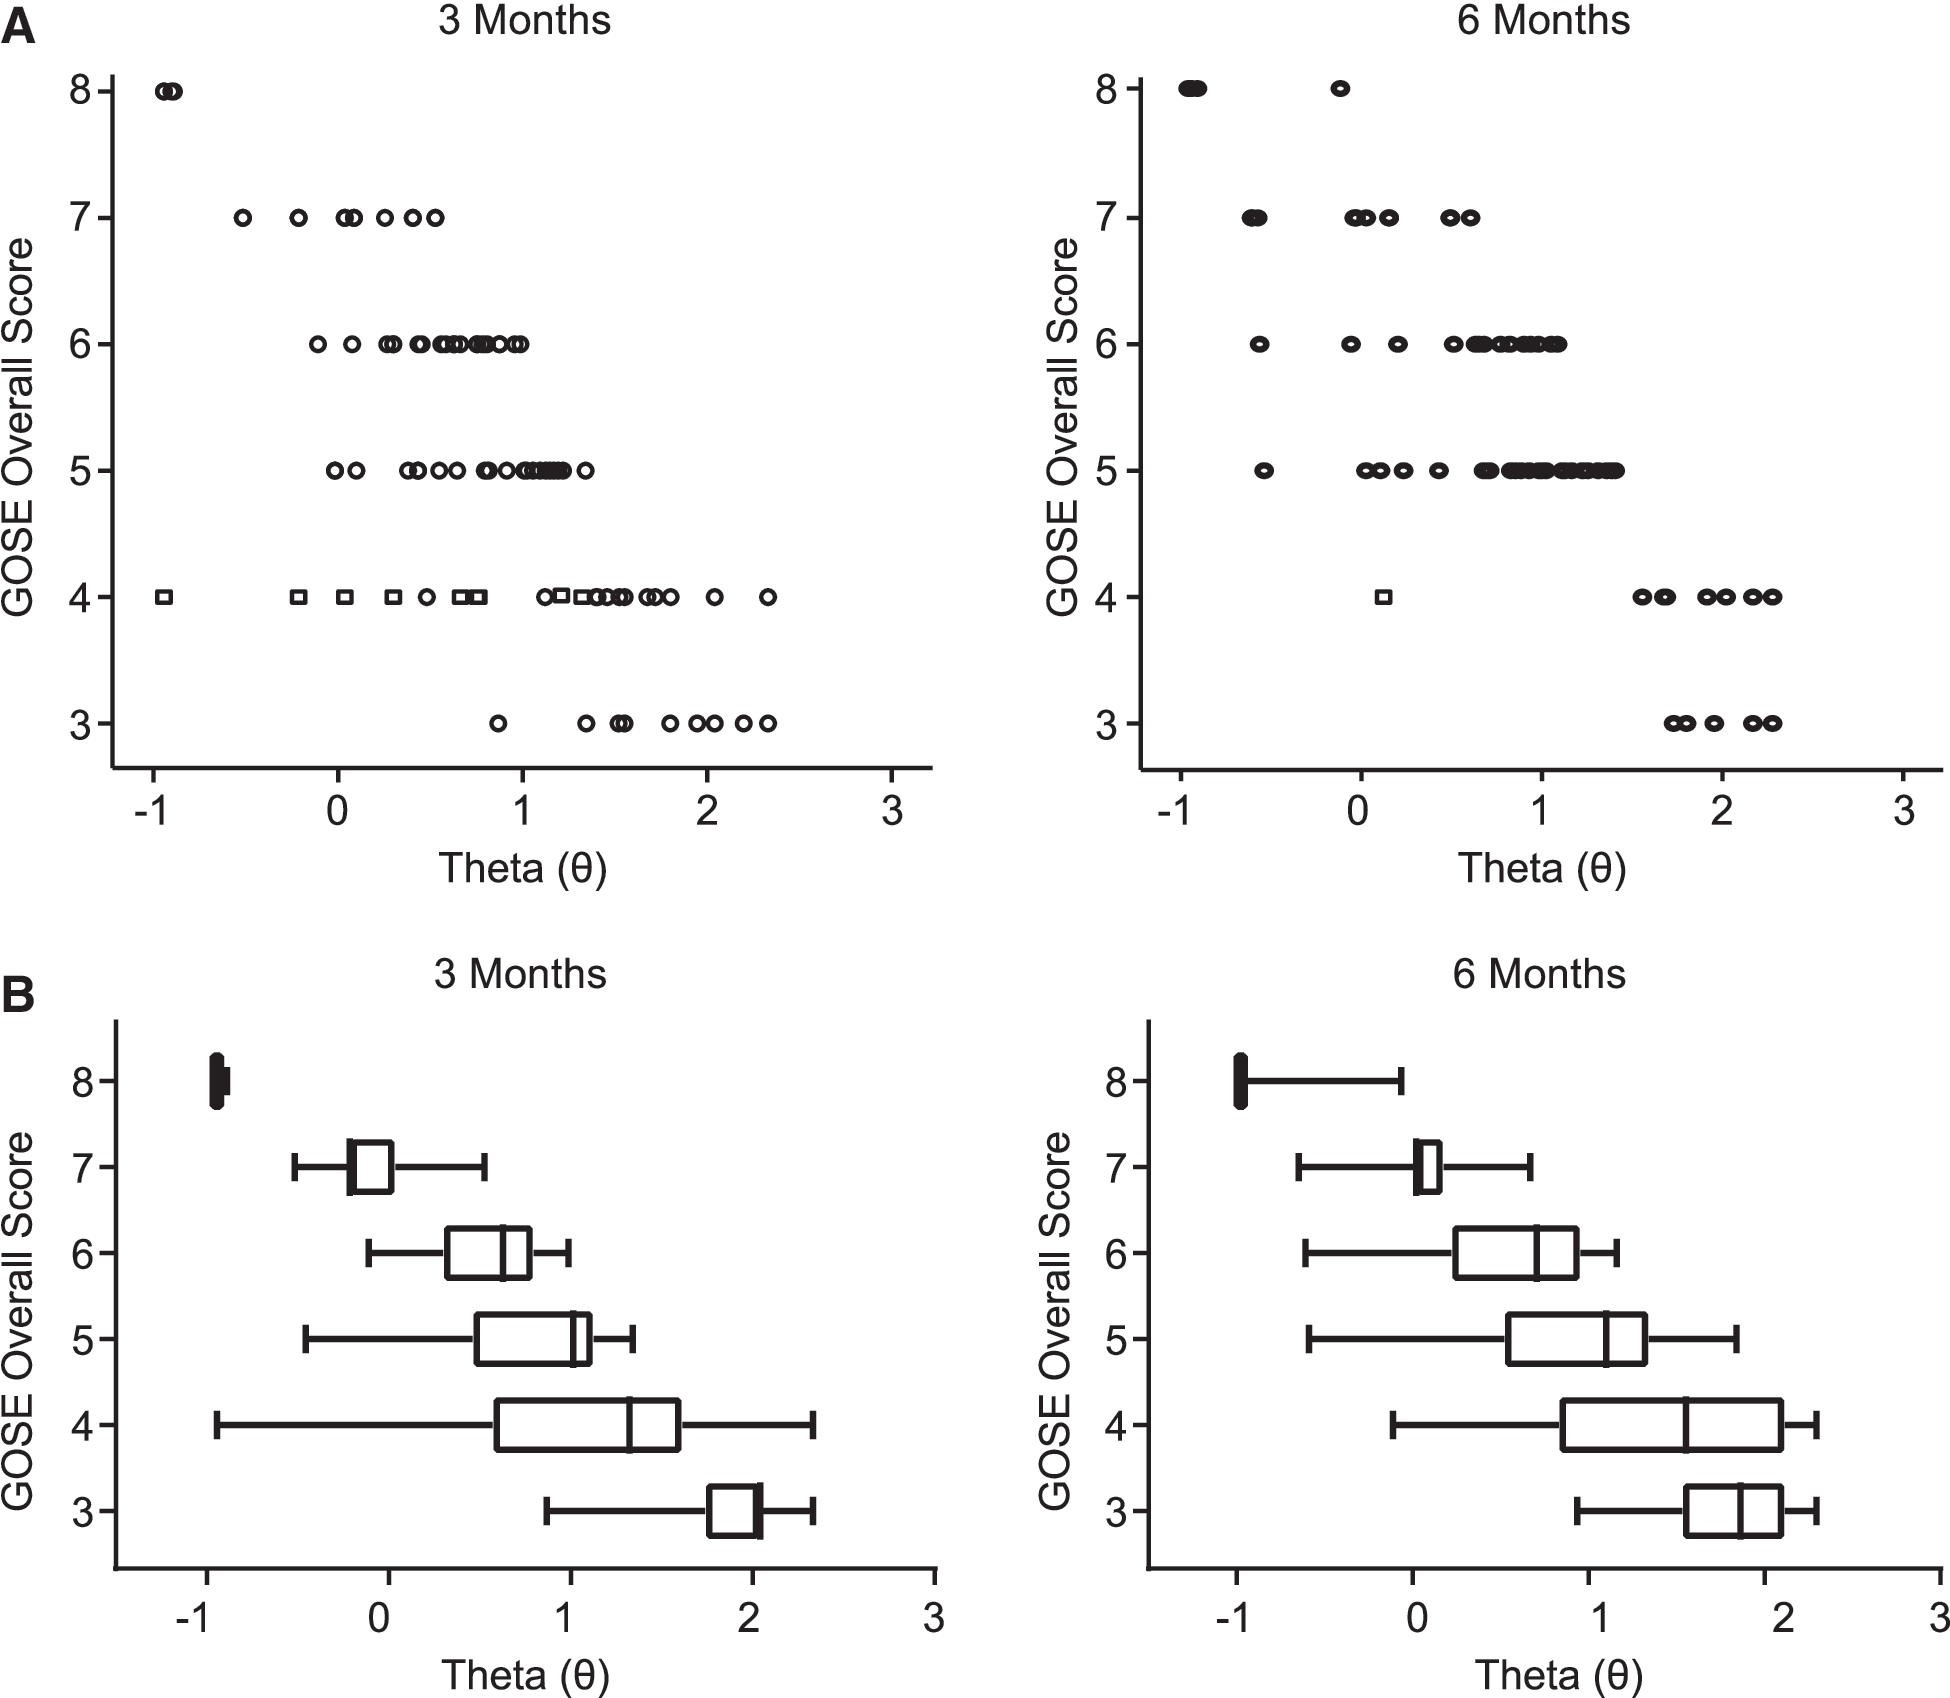
Scatterplot of GOSE total scores crossed by IRT theta (θ) z-scores at 3 and 6 months post-injury. Circles denote individual cases. Squares denote cases in which item recoding procedures necessary for IRT analyses introduced the potential to artificially deflate the association between traditional and IRT-based GOSE scores. These cases were not included in correlational analyses. Higher theta scores (rightward on x-axis) reflect greater latent impairment whereas lower GOSE total scores (downward on the y-axis) reflect poorer global outcome. Although the overall distribution of cases at both time points support the expected negative association between latent impairment and GOSE total scores (greater impairment ∼ lower GOSE total score), there was substantial variability of latent impairment occurring within the GOSE outcome categories 3 through 7. GOSE, Glasgow Outcome Scale–Extended; IRT, item response function.
Discussion
The GOSE is the current gold-standard measure of global outcome post-TBI, and it is used widely as a research tool and clinical trials endpoint. We used CFA and IRT to explore the structural and psychometric properties of the GOSE in an effort to explain the measure's reported limitations. Our findings indicated that the GOSE is not strongly unidimensional (i.e., it may not be ideal to assume that its items reflect a single underlying construct of TBI-related disability). This is not necessarily surprising in light of the instrument's diverse item content, spanning independence in self-care activities to participation in social activities. However, analyses suggested that it was sufficiently unidimensional to proceed with an exploratory IRT analysis. IRT modeling indicated that the GOSE best measures moderate-to-severe functional limitations, but is much less useful for measuring mild limitations. Additionally, that correlations between IRT-based GOSE scores and traditional GOSE total scores were strong suggested that, overall, global outcome measured as latent impairment is appropriately summarized by GOSE categories. However, if we assume that IRT-based scores represent true latent impairment levels, the traditional GOSE score may misclassify a substantial minority of patients in terms of their overall level of impairment. Further, because IRT-based GOSE scores are continuous in nature (vs. more ordinal traditional GOSE scores), IRT scores provide more fine-grained stratification of individual differences in impairment levels within each GOSE category. Such IRT-based scores may improve the performance of the GOSE in practical applications (e.g., detection of treatment effects), although such implications should be explored in future work.
Inspection of the better and poorer performing items according to this IRT analysis may also provide clues to understand the reported GOSE shortcomings (e.g., measurement imprecision). For example, the most problematic item at 3 and 6 months was 7b (Family and Friendship Disruptions domain), which provided very little information across the entire latent impairment continuum. One possible explanation is the item's double-barreled structure, in which two disparate conditions—“psychological problems/changes” and “family disruptions”—must co-occur for the item to (theoretically) be endorsed. Use of such questions is generally discouraged because their complex structure may encourage endorsement for a variety of reasons (e.g., if one or both facets of the question are true), and it is often unclear which aspect(s) of the question respondents endorsed. 65,66 As a result, 7b was ineffective at discriminating between patients and spanned nearly the entire (mild to severe) theta spectrum despite its intended function in the GOSE as a “moderate disability” item. 16 The utility of the item and, by extension the GOSE, might be improved by splitting the components of 7b into discrete items with distinct response options.
On the other hand, item 6b (Social Participation) appears to provide the most information of any GOSE item and does so across a relatively wide range of severity levels. This may reflect a number of things pertaining to the item's structure, wording, and content. Regarding its structure, item 6b has four response options (more than the two or three of most other GOSE items), which tends to increase an item's potential to provide information across a wider spectrum. But because item 7b (the other four-category item) provided minimal information, this explanation is not sufficient to understand the strong performance of item 7. Regarding its wording, it is possible that assessing participation in social activities is more straightforward (and therefore done with less error) as compared to other GOSE domains, such as work capacity, which, in the authors' experience, is more prone to variability in interpretation because of its emphasis on ability versus participation. Regarding its content, it is possible that social participation is a strong item because of its high relevance and close relationship to functional recovery for a wide variety of patients with TBI, something the instrument's authors stressed during its development. 2
Item 2b also demonstrated psychometric shortcomings and, for psychometric reasons, was difficult to combine with item 3a4a in an IRT model. However, this may have been less an issue with the inherent fitness of the constituent items than an artifact of our need to recode, combine, and eliminate select items before proceeding with IRT analysis in order to manage the low endorsement frequency and high correlation between some items. Combining items and collapsing across levels of severity to manage these technical issues (e.g., as was done for item 3a4a) may have inadvertently attenuated item discrimination and information. 67 Because items 2–4 reflect limitations in relatively basic activities of daily living, replication of these analyses in a larger sample better represented by severely injured patients may improve the performance of these items in such a model. However, given the high severity estimates of these items, this would not be expected to improve the performance of the GOSE at lower levels of impairment.
Claims that the GOSE is insensitive to mild disability 34 were also supported by our findings. Figure 2 showed that all but one item (8a; Return to Normal Life/Other Issues domain) measured moderate-to-severe latent impairment, and only item 8a measured “good recovery” (e.g., a low level of functional impairment). Thus, it is possible that adding other items like 8a may improve the instrument's sensitivity to mild/moderate disability. Because a diverse array of symptoms (e.g., headaches, dizziness, tiredness, sensitivity to noise or light, slowness, and memory problems) may compel item endorsement on item 8a, a fruitful step toward such a goal might include work to clarify the impact of differing symptoms on functional limitations after TBI. Inspection of the information function at both time points also suggests that 8a provided more information at 6 compared to 3 months. This is consistent with findings that the general TBI sequelae specified in 8a can persist even after other TBI symptoms have lessened or resolved, particularly when impairment is mild. 8,68
The GOSE's high-impairment bias is illustrated by the negatively skewed total information curves seen in Figure 2. That the instrument's items span limited severity levels and that a number of items provide limited information implies that estimates of functional limitations for patients with milder injuries have significant measurement error, which, alongside the limited score range of GOSE scores, may contribute to the GOSE's small and inconsistent associations with other outcome measures. 1,8,10,13,14,35,69 –73 The inability of the GOSE to measure low levels of impairment may also account for misclassifications, 9,10,12,16,21,25 –30 ceiling effects, 33 –36 and reports of inconsistent interrater agreement. 9 –12 An estimated 17–40% of GOSE total scores are misclassified downwardly (true outcome is classified as less favorable) or upwardly (where a true outcome is classified as overly favorable). 74
Figure 3 shows that, although most patients with severe-to-moderate latent impairment are classified as GOSE 3–5 (as expected from the item distributions in Figure 2), a few patients with low latent impairment (i.e., low theta scores) also received GOSE scores in this range. Therefore, GOSE scores reflecting greater impairment include both the expected patient population (e.g., those capable of demonstrating visual pursuit only or those in a minimally conscious state), but also those with low impairment (e.g., able to live at home without round-the-clock supervision). This further supports that the GOSE lacks items capable of objectively identifying, and thus categorizing, patients with milder impairment. If the full range of impairment is not represented by the available set of items, raters may be compelled to conduct subjective assessments that could either under- or overestimate true outcome. As a result, raters whose subjective assessments misalign will likely lead to poor rater agreement. Further, if too few items representing low-to-moderate impairment are available, raters may be obliged to overassign patients to the good recovery categories, which can result in ceiling effects.
Limitations and future directions
The current project had a number of limitations, some of which may have resulted from the restricted range of TBI severity reflected in our predominantly mild TBI (GCS 13–15) sample. The sparseness of response data for the two “severe disability” items, 2b and 3a4a, necessitated collapsing of different response options/items together. This may have limited the performance of these items and the generalizability of findings. Analyses should be replicated in a sample with a higher proportion of patients with moderate/severe TBI who are likely to manifest more limitations with these relatively basic activities of daily living. Further, Figure 3 shows that no participant at either time point had a theta score <−1 despite the GOSE being designed to capture a broad range of TBI impairment. Although this could be attributed to the lack of GOSE items capable of capturing mild impairment, or misclassifications, our sample may have simply lacked patients whose true outcomes were not as mild as implied by their GCS 13–15 or GOSE 8 scores.
These issues may also contribute to the minimal shift in the pattern of impairment from 3 to 6 months illustrated in Figure 3, which does not strongly support the reasonable expectation that patients whose injuries were longer ago would show lower levels of impairment than patients whose injuries were more recent. However, previous work with the TRACK-TBI data set found that 6-month follow-up rates were highest for severely injured patients, 8 which suggests that mild impairment may have been under-represented in our 6-month sample. Also, to avoid non-random missingness, we excluded participants who were not working pre-injury in the analyses. Additional analyses with a larger data set should be undertaken to understand how best to conceptualize and quantify the effects of outcome domains that have differential relevance across patients.
Additionally, we did not assess the longitudinal measurement invariance of the GOSE and were thus limited to the visual inspection of impairment patterns rather than the statistical analysis of change over time. 21 Future studies should attempt to obtain and retain sizable, balanced samples of patients representing all levels of TBI severity. Further, discrepancies were found between the reported GOSE total scores and the outcome scores expected based on item endorsements in 4–5% of cases across time points. Despite these rather small proportions, the source of these disparities was unknown. Therefore, to minimize the risk of spurious differences between latent impairment theta scores (derived from item-level data) and global outcome per the GOSE, we assumed that the item-level data from which we recomputed GOSE total scores were accurate. However, our corrections may have minimized the impact of misclassifications, the examination of which is also vital to understanding GOSE application and scoring. Future studies should implement standardized procedures for administering and scoring the GOSE so that problems can be identified and remedied.
Finally, although we felt the data were sufficiently unidimensional to proceed with the unidimensional IRT analysis, CFA analyses suggested that the GOSE is not strongly unidimensional (i.e., there may be more than one underlying dimension contributing to GOSE ratings). Whereas the presence of a nuisance dimension could corrupt parameter estimates, 75 the possibility that non-minor latent traits could also influence item endorsement and confound true global outcome is also concerning. Thus, additional research on larger samples would be valuable to more firmly establish the structure/dimensionality of the GOSE and better understand the extent to which the construct intended to be assessed by the GOSE (which is intentionally broad) is best modeled by one or more dimensions.
Conclusions
This study provided clues into psychometric weaknesses of the GOSE that may inform efforts to refine it or develop alternative outcome measures better suited to TBI clinical trials, where precise quantification of individual differences and changes in recovery are needed. Results show that, overall, the GOSE best measures moderate-to-severe TBI-related disability/functional limitations, with only one item on the GOSE structured interview that reflects into low-severity functional limitations. This is not surprising, in light of the authors' goals during its development, and supports conclusions by others that the GOSE lacks the sensitivity needed to discern individual differences in recovery for the diverse TBI population, many of whom recover to a degree that they show only subtle limitations in daily functioning. Analyses also showed that some items (e.g., item 5, Work; 6, Social & Leisure Activities) measure similar levels of severity (implying redundancy from a psychometric perspective), whereas other items (item 7, Family & Friendships) provide limited information about global outcome, perhaps because of complex wording contributing to variability in interpretation. These data support using IRT to reveal psychometric weaknesses that may contribute to past challenges using the GOSE to detect significant treatment effects.
Although hypotheses drawn from these data about how to improve the GOSE require empirical validation, paths toward improving outcome measurement might include improving the psychometric performance of the current GOSE instrument (e.g., by increasing the standardization of administration and clarity of items), adding additional highly discriminating items that span differing severity levels (especially in the mild severity range), or considering alternative or new outcome measures. Based on these data and general instrument development principles discussed here, any attempts to revise the GOSE or its associated structured interview forms should take care to write items that are simple and well defined for patients and that provide interviewers with concrete scoring criteria to ensure consistent application across patients and studies. In turn, such work will maximize the signal-to-noise ratio within GOSE scores and, in turn, improve its ability to reveal true individual differences in TBI-related functional limitations. Further increasing its score range may additionally improve its sensitivity to change and differences across patients.
Alternatively, development of new psychometrically informed instruments, or exploring alternative existing instruments that show promise for yielding more-precise assessment of functional limitations after TBI (e.g., the Functional Status Examination), 76,77 may be fruitful next steps to improve outcome measurement for TBI studies.
Footnotes
Acknowledgments
This work was supported by the National Institutes of Health (grant nos. RC2 NS0694909 [to G.T.M.], RC2 NS069409-02S1 [to G.T.M.], and R03 NS100691-01 [to L.D.N.]) and the Department of Defense (USAMRAA W81XWH-13-1-0441; to G.T.M.). Registry:
The TRACK-TBI Investigators: Shelly R. Cooper, BA (Department of Neurological Surgery, University of California, San Francisco, San Francisco, CA); (Kristen Dams-O'Connor, PhD (Department of Rehabilitation Medicine, Icahn School of Medicine at Mount Sinai, New York, NY); Wayne A. Gordon, PhD (Department of Rehabilitation Medicine, Icahn School of Medicine at Mount Sinai, New York, NY); Andrew I.R. Maas, MD, PhD (Department of Neurological Surgery, University Hospital Antwerp, Antwerp, Belgium); David K. Menon, MD, PhD (Departments of Anaesthesia and Neurocritical Care, University of Cambridge, Cambridge, United Kingdom); Pratik Mukherjee, MD, PhD (Department of Radiology, University of California, San Francisco, San Francisco, CA); Ava M. Puccio, RN, PhD (Department of Neurological Surgery, University of Pittsburgh Medical Center, Pittsburgh, PA); Mary J. Vassar, RN, MS (Department of Neurological Surgery, University of California, San Francisco, San Francisco, CA); John K. Yue, MD (Department of Neurological Surgery, University of California, San Francisco, San Francisco, CA); and Esther L. Yuh, MD, PhD (Department of Radiology, University of California, San Francisco, San Francisco, CA).
Author Disclosure Statement
Dr. Temkin reports grants from the Department of Defense, NIH, NIDILRR, and CDC during the conduct of the study. Dr. Dikmen reports grants from NIH and NIDILRR during the conduct of the study. Dr. Giacino reports grants from the Department of Defense, NIH, NIDILRR, James S. McDonnell Foundation, and other support from the Barbara Epstein Foundation during the conduct of the study. Dr. Okonkwo reports grants from NIH and the Department of Defense during the conduct of the study. Dr. Manley reports grants from the Department of Defense, NIH, and other support from One Mind, Palantir, and Johnson & Johnson Family of Companies/DePuySynthes/Codman Neuro during the conduct of the study. Dr. Nelson reports grants from NIH and the Medical College of Wisconsin's Center for Patient Care and Outcomes Research, Clinical and Translational Science Institute, and Advancing a Healthier Wisconsin Endowment during the conduct of the study.