




Abstract
Individuals with a mild traumatic brain injury (mTBI) often have executive control deficits; however, the underlying neural mechanisms of such deficits are yet to be clarified. Inhibitory control and cognitive monitoring are two fundamental aspects of executive control processes. This study investigated the executive control of mTBI by using the Stop-signal task. Eighteen adults with mTBI and 18 age-, sex-, and education level-matched controls were recruited. Behavioral performance and event-related potential correlates of response inhibition and error processing were compared between groups. The mTBI group tended to have a lower probability of inhibition and a longer stop signal reaction time. N1 amplitude was greater on successful trials. Also on successful trials, N2 and P3 peaked earlier than on failed trials. The N2 amplitude of the mTBI group tended to be smaller than that of the controls. The control group had larger P3 amplitude on successful trials than on failed trials, whereas the mTBI group exhibited no P3 amplitudes difference between the two trial types. In addition, the mTBI group showed significantly longer error positivity latency than did the controls. These results suggest that inhibitory control and error processing were inefficient in the mTB group even more than three months after injury. Electrophysiological markers of cognitive dysfunction can be used as a sensitive tool for determining executive control after mTBI.
Introduction
An estimated 1.7 million persons sustain a traumatic brain injury (TBI) annually in the United States. 1 Mild TBI (mTBI) accounts for at least 75% of all TBIs and has been recognized as a public health problem. 2 Patients with mTBI can exhibit emotional, behavioral, physical, and cognitive symptoms. 3 Most patients with mTBI histories are asymptomatic at three months after injury. 4,5 A minority of patients, however, do not recover fully and report persistent detrimental symptoms. 6,7
The cognitive sequelae of TBI may crucially affect a patient's degree of long-term dysfunction, including dysfunction of executive control, learning and memory, attention, and processing speed. 8 Inhibition is a component of executive control that plays a critical role in behavioral self-regulation, attention, memory, and learning.
Although various forms of inhibitory control exist, this study focused on the inhibitory control involved in stopping an ongoing action. Motor response inhibition enables an individual to overcome automatic or routine behaviors when they become improper because of an altered situation or intention. 9
Lack of inhibitory control is a common cognitive sequela of TBI. 10 Persons with a TBI are usually unable to withhold pre-potent responses and suppress inappropriate or unwanted behaviors. Moreover, efficient executive control requires cognitive processes to detect errors and corrections. Performance monitoring enables individuals to realign their behaviors with the prevailing goals of everyday life. Error processing, an aspect of executive control involving monitoring one's performance for the presence of errors, is crucial for learning from former behaviors. 11
Two paradigms frequently used to investigate motor response inhibition in the laboratory are the Go/No-go and Stop-signal tasks (SST). Subjects must inhibit pre-potent responses during the Go/No-go task, whereas they need to inhibit an ongoing response during the SST. In the Go/No-go task, a motor response is given to one stimulus category (Go trials) and withheld from another (NoGo trials). Most TBI research has used some variation of the Go/No-go task.
The SST, developed by Logan and Cowan, 9 enables disentanglement of various processes that operate in response to inhibition and quantification of inhibition. In the SST, subjects complete a speeded choice reaction task (Go trials) and occasionally receive a stop signal that instructs them to suppress their response to the choice reaction stimulus (Stop trials). 9,12 The SST is treated as a model for inhibitory control of an impulse. SST performance may be correlated with suppression of a pre-potent response during daily functioning and behaviors. Successful inhibition (SI) is evidence of good inhibitory control, whereas failed inhibition (FI) is evidence of poor inhibitory control.
To our knowledge, four studies investigating response inhibition in patients with brain damage have used the SST. 13 –16 One investigated inhibitory control after mTBI in individuals aged between eight and 72 years and reported that those with mTBI had slower stop signal reaction times (SSRTs) than did control participants without mTBI. 12 Another found that children with TBI exhibited deficits in the inhibition of ongoing responses. 14
The third study recruited 27 patients with head injury ranging in severity from mild to severe (aged 17 to 68 years) and 27 orthopedic patients for comparison purposes but did not discover any performance differences. 15 The final study examined the recovery of motor response inhibition in children with TBI immediately after TBI and over the subsequent two years; inhibition, as measured based on SSRTs, improved over time. 16 These four studied enrolled a wide range of age groups and patients with varying levels of TBI severity. Thus, related findings have been inconsistent and require clarification.
Electrophysiological methods have been used to increase the understanding of the cognitive sequelae involved in mTBI. 17 Event-related potential (ERP) can be employed to uncover electrophysiological markers of the covert cognitive dysfunctions associated with mTBI. 17,18 Few studies, however, have used the ERP technique during performance of the SST to explore the neural mechanisms underlying response inhibition in mTBI.
The N2 and P3 components of ERP waveforms have been associated separately with response inhibition in the SST. The N2 is maximal at the frontocentral site. 19 The N2 has been interpreted as reflecting the inhibition process 20 –22 and is generated by the inferior prefrontal cortex (PFC). 23 P3 is typically maximal in the central region 24,25 and has been associated with successful response inhibition, because it typically shows enhanced amplitude for successful stop trials compared with failed ones. 26 –28
In addition, the error related negativity (ERN) and error positivity (Pe) components regarding the commission of an erroneous response have been obtained by averaging the response-locked epochs of electroencephalographic data obtained in error trials and represent different aspects of error processing. The ERN is a sharp negative deflection with a frontocentral distribution immediately after an erroneous response. 29 –31 The ERN is hypothesized to reflect the activation of an error detection system in response to a mismatch between the intended and actual outcome of a response 30,32 or the activation of a general conflict monitoring system that becomes more active when competition between alternative response sets increases. 33
Further conscious error processing is thought to be reflected by Pe, which is a centroparietal positive deflection after ERN. In contrast to ERN, Pe does not occur in trials where the subject is unaware of an error that he or she has committed. 34 –36 The Pe is associated with awareness of erroneous responses and is more pronounced for perceived errors than for unperceived ones. 34
The generator of error detection and error awareness appears to be located in the anterior cingulate cortex (ACC). 37,38 The ERPs capitalize on the selective averaging of various stimulus types within the same experimental block to analyze Go and Stop trials and of the averaging successful and failed inhibitions after stop signals. Because ERPs have high temporal resolution, selectively averaged ERP waveforms can disclose the exact timing of various processes.
In the present study, behavioral and ERP indices were used to illustrate the processes of inhibitory control and error processing when adults with mTBI completed the SST. Behavioral performance and ERP correlated with response inhibition were hypothesized to be atypical in the mTBI group. In addition, inefficient error processing was expected to be revealed after commission errors of failed inhibitions in the mTBI group.
Methods
Participants
Patients were recruited through neurologists at Linkou Chang Gung Memorial Hospital in Taiwan. Eighteen adults with mTBI (seven male, 11 female; mean age, 28.28 ± 7.69 years; age range, 20.7–47.1 years) were enrolled in this study. The definition used for mTBI was that developed by the American Congress of Rehabilitation Medicine in 1993: head trauma with loss of consciousness lasting less than 30 min, a Glasgow Coma Scale score of 13–15, and post-traumatic amnesia lasting less than 24 h. 3
Among the mTBI participants, 13 had experienced motor vehicle accidents, two had experienced falls, one had sports-related injuries, and two had work-related injuries. Only one concussion had occurred in the mTBI group. The exclusion criteria were a history of neurological or psychiatric disease, current use of drugs affecting the central nervous system, a concussion within the preceding three months, and age of <20 or >50 years.
All participants with mTBI had normal post-traumatic computed tomography (CT) findings. The patients had no cerebral parenchymal injuries, such as hematoma or edema. The TBI history and diagnosis were collected and confirmed by the fourth author, who was a licensed neurologist. The time since trauma in the mTBI group ranged from 3.1 to 30.9 months, with a median of 7.8 months.
The mTBI group was compared with 18 healthy controls (mean age = 28.76 ± 8.76 years) matched for age, sex, and educational level to control confounding variables. The control participants were recruited on a voluntary basis from a campus or through a website advertisement. None had pre-existing neurological or psychiatric conditions (e.g., past TBI, substance abuse), and none had used drugs known to affect the central nervous system.
All participants were right-handed and had normal or corrected-to-normal vision. Informed consent was obtained from all participants. The experimental protocol was approved by the Institutional Review Board Ethics Committee in the Chang Gung Medical Foundation.
Measures
General intellectual functioning and mood symptoms
All participants completed the Chinese version of the Wechsler Adult Intelligence Scale-Third Edition (WAIS-III), 39 the Chinese version of the Beck Depression Inventory (2nd edition; BDI-II), 40 and the Chinese version of Beck Anxiety Inventory (BAI) 41 to assess intellectual abilities and measure levels of depressive and anxiety symptoms.
Post-concussion syndrome
The Rivermead Post-Concussion Syndrome Questionnaire (RPQ) 42 was used to evaluate the post-concussion syndrome (PCS). This self-report questionnaire comprises 16 symptoms commonly experienced after head injury. Symptom levels are rated on a 5-point scale (0 = none, 1 = no longer, 2 = mild, 3 = moderate, 4 = severe), with total scores ranging from 0 to 64. Three or more reported symptoms on the RPQ were used as a criterion for PCS (reporting at least three symptoms at the “mild” level). 43,44
Neuropsychological measures
The original Trail Making Test (TMT) is a neuropsychological test of visual attention and task switching. It consists of two parts: Trails A and Trails B. 45 The Comprehensive Trail Making Test (CTMT) 46 is a standardized set of five visual search and sequencing tasks that are heavily influenced by attention, concentration, resistance to distraction, and cognitive flexibility. The results of the five trails combine to provide an overall Composite Index. On the CTMT, Trail 1 is equivalent to Trails A and Trail 5 is similar to Trails B of the original TMT. Norms for each trail and the Composite Index are presented in the form of T-scores, which have a mean of 50 and a standard deviation of 10.
The Conners Continuous Performance Test–II (CPT–II) 47 is a commonly used measure of attention and concentration. 48 Attention-related deficits are commonly reported after TBI; 49 the CPT–II is sensitive to be used to identify subtle cognitive deficits impairments. Raw scores and general population T-scores were collected for Omissions, Commissions, Hit Reaction Time, Hit Reaction Time Standard Error, Variability, and Perseverations. All participants completed the CTMT and the CPT-II to assess cognitive functioning.
SST
In the SST, the participants were asked to complete a primary two-choice discrimination task involving Go stimuli (the letters “A” and “B”) and were instructed to withhold their response when a Stop stimulus (letter “S”) was displayed at unpredictable intervals after the Go stimulus. The “A” or “B” stimuli were presented one at a time and in a random order, each with 50% probability. The participants pressed the left button for the letter “A” and the right button for the letter “B” by using the index finger of the right hand.
The stimuli appeared as black upper-case letters (1.5 cm high × 1.5 cm wide) on a grey background in the center of a 17-inch computer screen positioned 60 cm in front of the participant at eye level. Each trial began with the appearance of a black central fixation cross for 500 msec, followed by that of the letter for that trial for 150 msec, and then a blank screen for 850 msec.
Researchers using the SST have varied the delay duration between stop signal and go signal (stop-signal delay) to fix the test in favor of one process or the other. In most studies, stop-signal delays are selected at random from a fixed set that is held constant throughout the experiment. 9 Every participant was instructed to not press the button on these trials.
When the Stop stimulus occurred soon after the Go stimulus, the participants were able to inhibit their response fairly easily, and the probability of inhibition P(I) was relatively high. By contrast, when the Stop stimulus occurred after a long interval after the Go stimulus, each participant more often fails to inhibit his or her response more frequently. In a random 25% of trials, the Go stimulus was followed by the Stop stimulus for 150 msec with random stimulus onset asynchrony (SOA) of 250, 300, 400, or 450 msec.
Ten blocks of trials were completed, with the blocks separated by rest periods. Each block lasted approximately 3 min and included 100 Go trials along with 32 Stop trials (eight for each SOA).
Behavioral analysis
Behavioral performance was measured using the reaction time (RT), intraindividual standard deviation of the RT (SDRT), the percent of accuracy, the percentage of commission and omission errors, P(I), and SSRT. 9,22 The SSRT, which measures the latency of the inhibitory process, was determined using the method of Logan and associates. 9 The mean of these four SSRTs in each SOA was the overall SSRT for the subject. The P(I) was calculated from each of the four SOAs. The mean of the four values of the P(I) in each SOA was the overall P(I).
A significant difference was discovered between the intelligence quotients (IQ) scores of the two groups. We controlled the participants' IQs to exclude a possible impact of higher intelligence by conducting a repeated measure analysis of covariance (ANCOVA). Performance in the CTMT and CPT-II tests were examined using one-way ANCOVA.
Physiological recording
The electroencephalogram (EEG) was recorded from 32 scalp locations using a Neuroscan Qcap 32 AgCl electrode cap. The vertical and horizontal electrooculogram (EOG) was recorded from electrodes located above and below the right eye and the outer canthus of both eyes. All recording sites were referred to average mastoids. Interelectrode impedance was kept below 10 kΩ. The EEG and EOG recordings were amplified with a DC to 70 Hz filter and digitized at a sampling rate of 500 Hz using a Neuroscan NuAmp amplifier.
ERP analysis
Stimulus-locked epochs
Stimulus-lock epochs were created from −200 to 1000 msec around the Stop signal onset and were baseline-corrected using the 200-msec pre-response period. Data were filtered off-line using a 40-Hz (12 dB/oct) low-pass filter and were checked for artifacts. Vertical and horizontal EOGs were subtracted from the ERPs. The method employed a regression analysis in combination with the artifact average to produce a reliable and valid method for artifact removal. 50 An artifact rejection criterion of ±75 μV was applied.
The ERP averages were obtained first for SI trials and FI trials, time-locked to Stop signal onset. Grand averages were calculated across the participants for each trial type and group. Because of the short interval between the Go and Stop stimuli, the elicited ERP responses overlapped in time, distorting the final ERP averages. 51 To correct for this differential overlap distortion problem, ERP subaverages for the successful and failed Stop signals were obtained for each of the four 50-msec time-delay subranges (SOA = 250, 300, 400, and 450 msec) for each participant. Then, for each condition, these four subaverages were put together in an equally weighted way (25% for each subaverage), respectively, thereby better equating the overlap from the Go-event ERPs on the successful and failed Stop-signal ERPs. 21
We focused on the N1, N2, and P3 components because they have been examined widely in previous SST studies. Through visual inspection of the waveforms, we used latency ranges 100–170 msec for N1, 170–350 msec for N2, and 300–600 msec for P3. The local peak latencies of N1, N2, and the P3 were then identified using a semiautomatic peak detection procedure. The N1 and N2 mean amplitudes were calculated within a 50-msec interval surrounding the largest negative going peak, whereas the P3 mean amplitude was measured within a ±25-msec interval surrounding the largest positive going peak.
Based on findings from previous studies, various channel settings were selected to analyze N1 (F3, F4, Fz, FC3, FC4, and FCz), N2 (FC3, FC4, FCz, C3, C4, and Cz), and P3 (C3, C4, Cz, CP3, CP4, and CPz). We averaged data from F3, F4, and Fz as data for the frontal region; those from FC3, FC4, and FCz as data for the frontocentral region; those from C3, C4, and Cz for the central region; and those from CP3, CP4, and CPz for the centroparietal region. A repeated measures analysis of variance (ANOVAs) was conducted; the between-subjects factor was Group and the within-subjects factors were Inhibition (SI vs. FI) and Region.
Response-locked epochs
Regarding response-locked epochs, the error-related potentials ERN were aligned to a 200-msec pre-response baseline. The ERP averages were obtained by averaging response-locked epochs for erroneous responses in the Stop trials. The latency ranges were 0–120 msec for ERN and 130–500 msec for Pe after each erroneous response.
Different channel settings were selected to analyze ERN (F3, F4, Fz, FC3, FC4, and FCz) and Pe (CP3, CP4, CPz, P3, P4, and Pz). We averaged data from F3, F4, and Fz as data for the frontal region; those from FC3, FC4, and FCz for the frontocentral region; those from CP3, CP4, and CPz for the centroparietal region; and those from P3, P4, and Pz for the parietal region. The ERN and Pe mean amplitudes were calculated within a ±25-msec interval surrounding the largest negative and positive peak, respectively. For ERN and Pe, a repeated measures ANOVAs was conducted; the between-subjects factor was Group, and the within-subjects factor was Region.
The Bonferroni method was used for post hoc analyses. Correlations between ERP components (N2, P3, ERN, and Pe) and RPQ scores in the TBI group were calculated using the Pearson product moment correlation, as were correlations of ERP components (N2, P3, ERN, and Pe) with SSRTs and P(I)s for all participants. The critical p value was set at 0.05.
Results
Psychometric variables
Six (33%) mTBI participants reported three or more remaining symptoms in the RPQ. No significant differences were discovered between the mTBI and the control group in terms of age, sex, education level, BDI-II depression scores, and BAI anxiety scores. Regarding the BDI-II and BAI, all participants had T-scores lower than 55, and these scores were considered normal. The Full-Scale IQ of the control group, however, was significantly higher than that of the mTBI group. The demographics and psychometric measures of the mTBI group and healthy controls are displayed in Table 1.
Demographics and Psychometric Variables for the Mild Traumatic Brain Injury and Control Groups
BAI, Beck Anxiety Inventory; BDI-II, Beck Depression Inventory (2nd ed.); WAIS-III, Wechsler Adult Intelligence Scale (3rd ed.); RPQ, Rivermead Post-Concussion Syndrome Questionnaire.
Standard deviation shown in parentheses.
p < 0.01.
Neuropsychological measures
There were no significant group differences in all variables of the CTMT and CPT-II tests (Table 2).
Neuropsychological Variables for the Mild Traumatic Brain Injury and Control Groups
mTBI, mild traumatic brain injury; CTMT, Comprehensive Trail Making Test; CPT-II, Conners Continuous Performance Test–II.
Standard deviation shown in parentheses.
SST performance
Table 3 summarizes the performance measures of the two groups. On Go trials, no significant differences were found between the groups in terms of RT, SDRT, accuracy, choice errors, or mission. Regarding the Stop trials, the SSRT at SOA = 250 msec exhibited a significant group effect (F (1,33) = 8.57, p = 0.006, η 2 = 0.21), whereas that at SOA = 300 msec was borderline significant (F (1,33) = 4.06, p = 0.05, η 2 = 0.11). Moreover, the overall SSRT exhibited a significance level (F (1,33) = 4.94, p = 0.03, η 2 = 0.13). The P(I) at SOA = 250 msec exhibited a significant group effect (F (1,33) = 9.86, p = 0.003, η 2 = 0.23), whereas that at SOA = 300 msec attained borderline significance (F (1,33) = 4.03, p = 0.05, η 2 = 0.11). No significant difference was found between the groups in terms of the overall P(I).
Performance on Stop signal task for the Mild Traumatic Brain Injury and Control Groups
SD, standard deviation shown in parentheses; MRT, mean reaction time; SSRT, stop signal reaction time; SOA, stimulus onset asynchrony; P(I), probability of inhibition.
p < 0.05, ** p < 0.01.
ERP measures
Table 4 presents the amplitudes and latencies of the N1, N2, and P3 components for SI and FI trials averaged over various regions of stimulus-locked epochs and groups, as well as those of the ERN and Pe components for erroneous trials averaged over various regions of response-locked epochs and groups.
Mean and Standard Deviation (In Parentheses) of Averaged Amplitude and Latency of Event Related Potential Components in Various Regions For Stimulus-Locked and Response-Locked Epochs
mTBI, mild traumatic brain injury; SI, successful inhibition; FI, failed inhibition; ERN, error related negativity; Pe, error positivity.
The stimulus-locked ERP waveforms are displayed in Figure 1, whereas the response-locked ERP waveforms after the erroneous response of Stop trials and correct response of Go trials are shown in Figure 2.
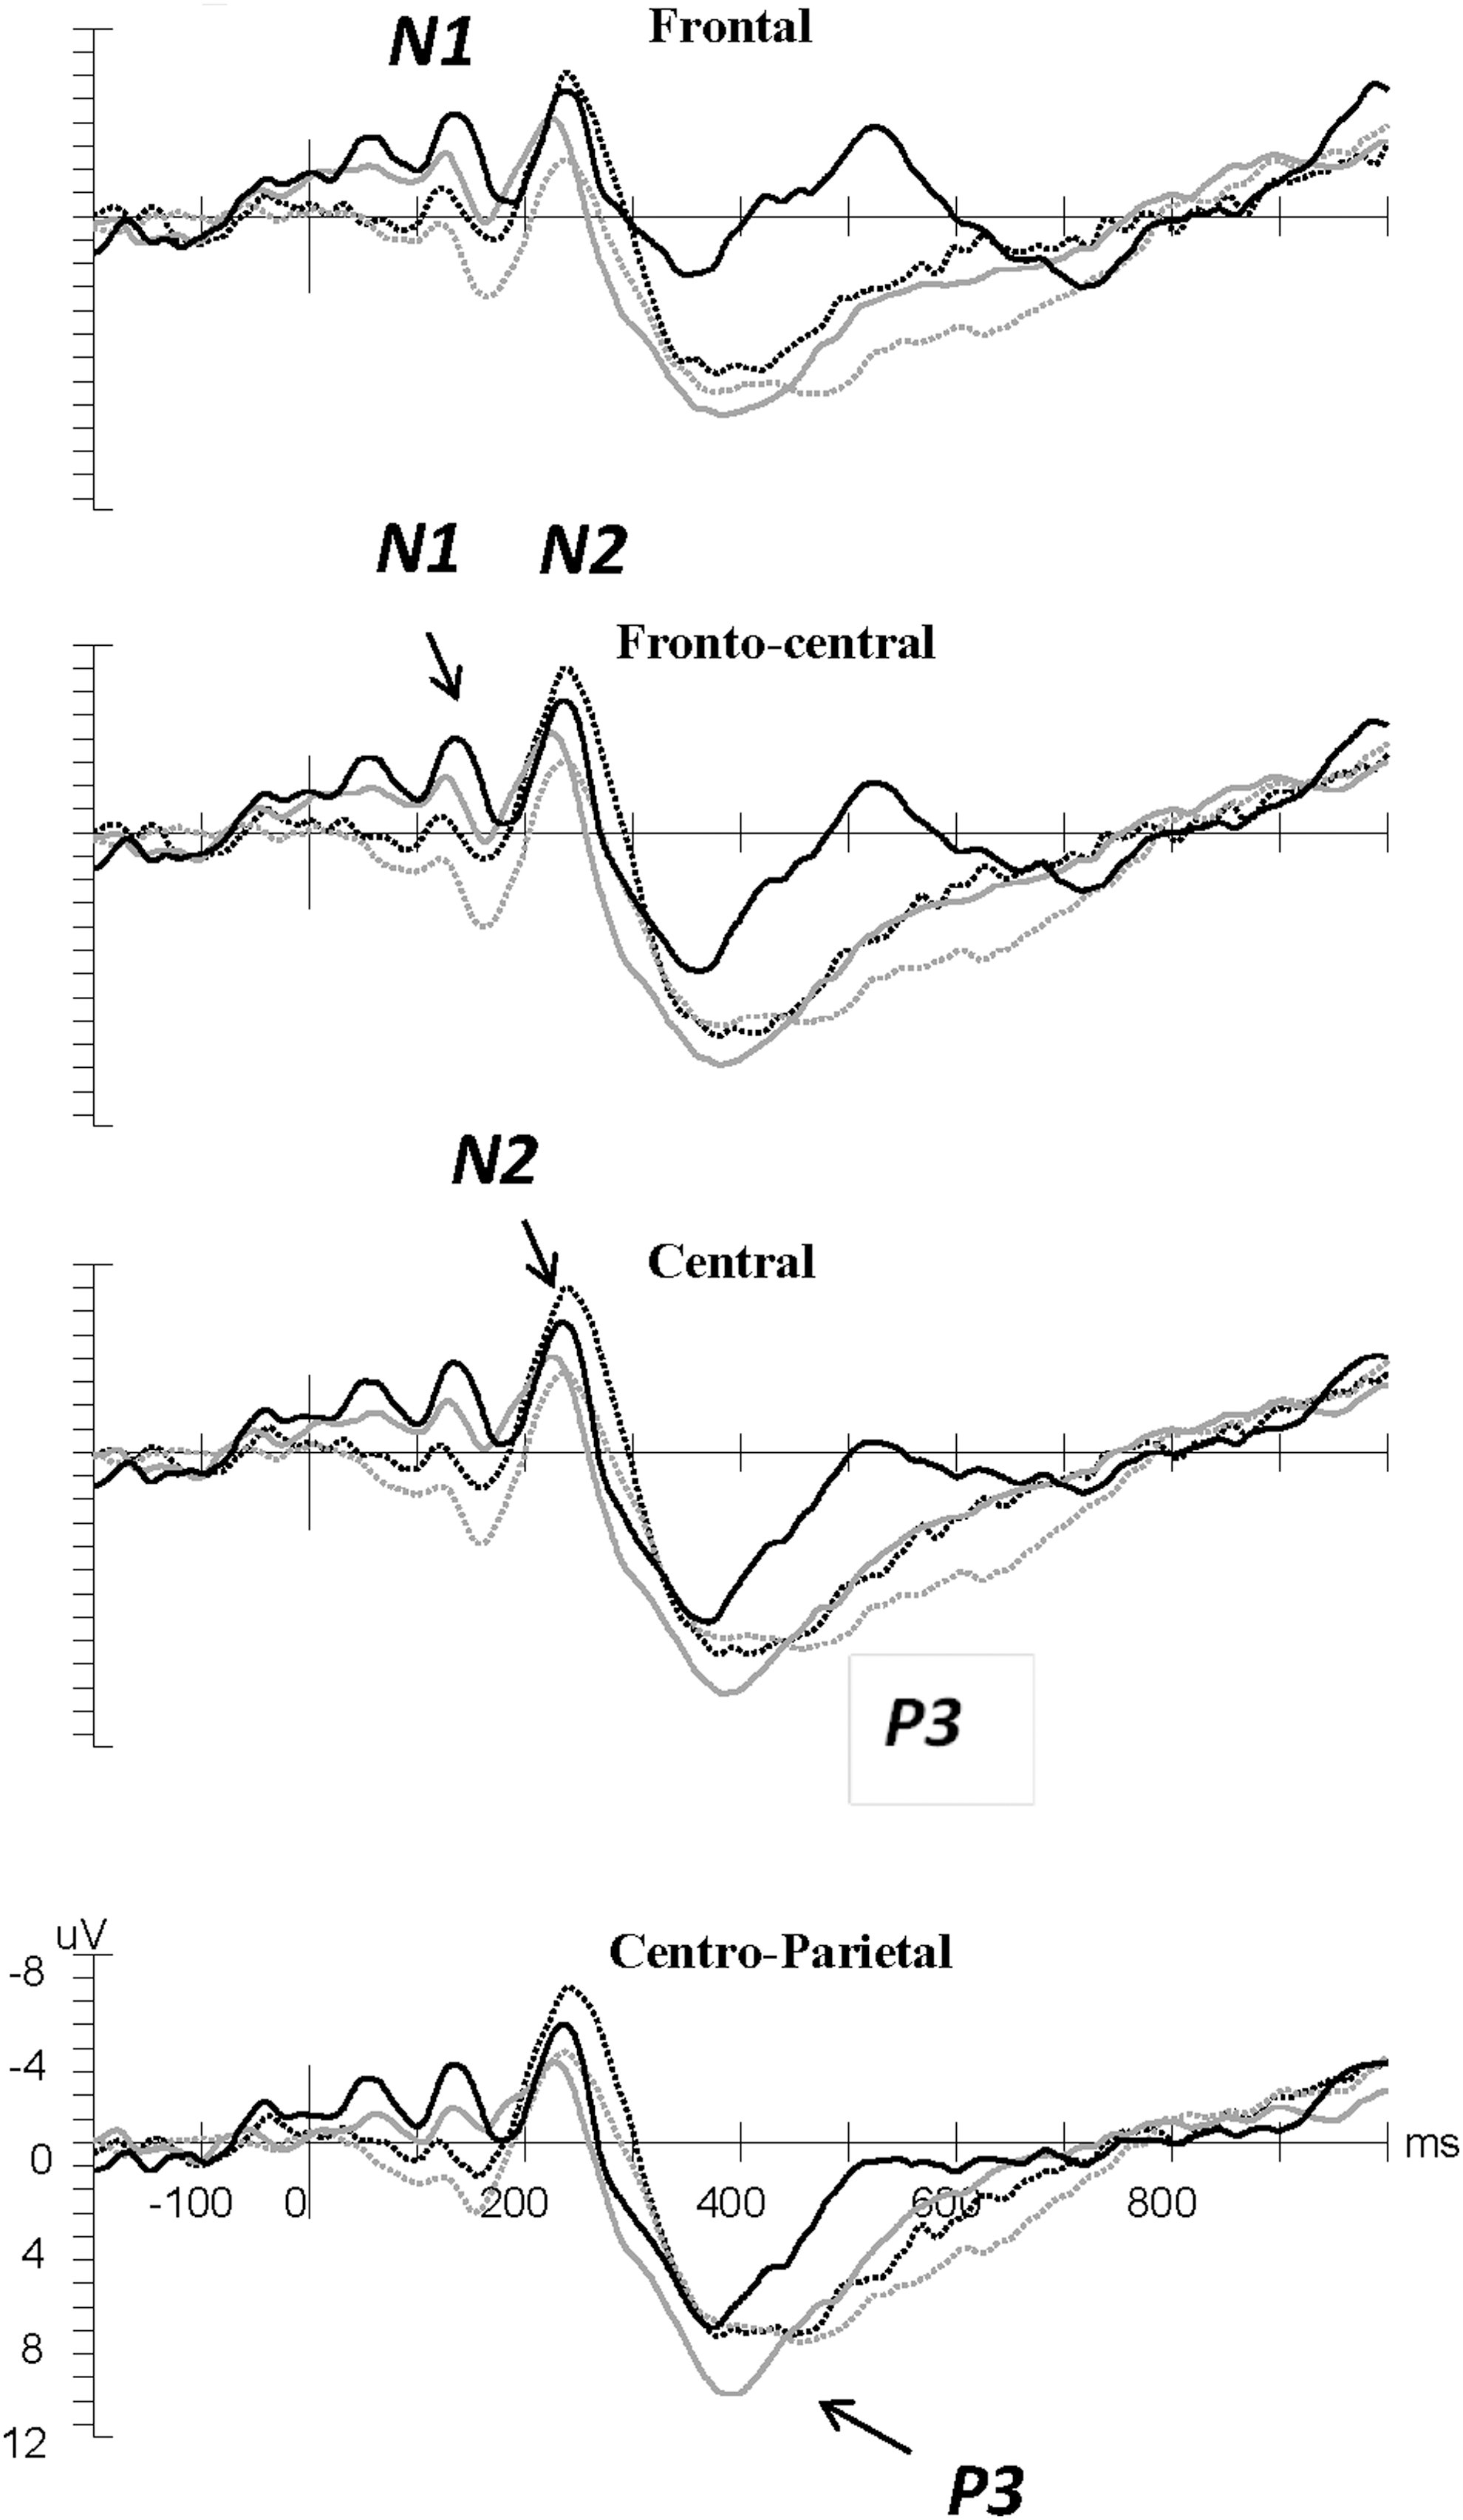
Waveforms averaged across frontal, frontocentral, central, and centroparietal regions of interest for N1, N2, and P3 related to the Stop signal (stimulus-locked). Grand average event-related potentials are shown in the control group (thick black line) and the mild traumatic brain injury group (thin gray line) for SI trials (solid line) and FI trials (dotted line). Zero point indicates the Stop signal onset. Labels indicate N1, N2, and P3.

Waveforms averaged across frontal, frontocentral, centroparietal, parietal regions of interest for error-related negativity (ERN) and error positivity (Pe) related to the button press (response-locked). Grand average event-related potentials are shown in the control group (thick black line) and the mild traumatic brain injury group (thin gray line) for erroneous trials in Stop trials (solid line) and correct trials in Go trials (dotted line). Zero point indicates the response onset. Labels indicate ERN and Pe.
N1 component
No effects were detected for N1 latency. Regarding N1 amplitude, Inhibition × Regions interaction was significant (F (1,34) = 5.78, p = 0.02, η 2 = 0.14). Post hoc analyses revealed that N1 was greater in the frontal and frontocentral regions during the SI trials than during the FI trials (frontal: −2.4 μV vs. −1 μV; frontocentral: −2.2 μV vs. −0.5 μV).
N2 component
No interactions were observed in N2 latency. The main effect of Inhibition was significant (F (1,34) = 37.06, p < 0.0001, η 2 = 0.51). There was earlier latency on SI trials than on FI trials (SI: 223 msec; FI: 246 msec). Regarding N2 amplitude, the main effect of Group reached a borderline significance level, and the mTBI group tended to have lower N2 amplitude (F (1,34) = 3.19, p = 0.08, η 2 = 0.09; control: −6.2 μV vs. mTBI: −3.4 μV). The main effect of Inhibition, however, was significant (F (1,34) = 19.39, p = 0.0001, η 2 = 0.35). Enhanced N2 amplitude was found in the frontal and frontocentral regions during FI trials rather than during SI trials (SI: −3.39 μV vs. FI: −6.36μV).
P3 component
Regarding P3 latency, no interactions were observed. The main effects of Inhibition and Region were significant (F (1,34) = 25.81, p < 0.0001, η 2 = 0.4 and F (1,34) = 5.08, p = 0.03, η 2 = 0.13, respectively). The P3 peak occurred earlier on SI trials than on FI trials (SI: 387 msec vs. FI: 435 msec). The P3 appeared to peak earlier in the central region than in the centroparietal region (central: 408 msec; centroparietal: 413 msec). Regarding P3 amplitude, Group × Inhibition interaction was significant (F (1,34) = 8.78, p = 0.005, η 2 = 0.19). Post hoc analyses revealed that P3 amplitude was greater on SI trials than on FI trials for the control group (F (1,53) = 23.85, p < 0.0001, η 2 = 0.31; SI:12.97 μV vs. FI: 10.09 μV), whereas for mTBI, no P3 amplitudes difference was discovered between trial types.
ERN component
For ERN latency and amplitude, no main effects or interactions were found.
Pe component
Regarding Pe latency, the main effects of Group and Region were significant (F (1,34) = 6.24, p = 0.01, η 2 = 0.15; F (1,34) = 6.05, p = 0.01, η 2 = 0.15, respectively). The Pe latency was significantly longer in the mTBI group compared with the controls (mTBI: 363 msec; controls: 305 msec). The Pe peak occurred earlier in the centroparietal region than the parietal region (centroparietal: 329 msec; parietal: 339 msec). Analyses of the Pe amplitude revealed that the main effect of Region was significant (F (1,34) = 21.55, p < 0.0001, η 2 = 0.38). No interaction effect or group effect was discovered. The Pe amplitude was significantly greater in the centroparietal region than in the parietal region (centroparietal: 11.1 μV vs. parietal: 10.3 μV).
Correlation
No statistically significant correlations were found between the SSRT, P3, ERN, and RPQ scores in the TBI group. In addition, no significant correlations were discovered between SSRT, P3, and ERN in all participants. Table 5 presents the relationships between RPQ score and N2 in the TBI group. The RPQ score was associated with N2 latency on SI and FI trials. Further, the RPQ score was correlated positively with N2 latency across the frontocentral and central regions on SI trials (frontocentral region: r 18 = 0.64, p=0.004; central region: r 18 = 0.71, p= 0.0009) and frontocentral region on FI trials (frontocentral: r 18 = 0.54, p=0.02). The evidence indicates that higher RPQ scores may have been linked to longer N2 latency on SI and FI trials.
Coefficients of Correlation between Rivermead Post-Concussion Syndrome Questionnaire Score and N2 Peak Latency and Amplitude in the Frontocentral and Central Regions for the Traumatic Brain Injury Group
RPQ, Rivermead Post-Concussion Syndrome Questionnaire; SI, successful inhibition; FI, failed inhibition; PL, peak latency; MA, mean amplitude.
p < 0.05; ** p < 0.01; *** p < 0.001; significant p values are shown in parentheses.
Further, as revealed in Table 6, P(I) was significantly correlated with N2 amplitudes, Pe latency, and Pe amplitude in all participants and negatively correlated with N2 amplitudes across the frontocentral and central regions on FI trials (frontocentral: r 36 = − 0.48, p=0.003; central: r 36 = − 0.43, p = 0.008). Higher inhibitory control tends to result in greater N2 amplitudes on SI and FI trials.
Coefficients of Correlation between Probability of Inhibition, N2, and Error Positivity in Various Regions of Interest for the Two Groups
Pe, error positivity; SI, successful inhibition; FI, failed inhibition; PL, peak latency; MA, mean amplitude; P(I), probability of inhibition
p < 0.05; ** p < 0.01; *** p < 0.001; significant p values are shown in parentheses.
Moreover, P(I) was negatively correlated with Pe latency across the centroparietal and parietal regions, respectively (centroparietal: r 36 = − 0.39, p = 0.01; parietal: r 36 = − 0.43, p = 0.008) and positively correlated with Pe amplitudes in these regions (centroparietal: r 36 = 0.34, p = 0.03; parietal region: r 36 = 0.36, p = 0.02). Higher inhibitory control is associated with shorter Pe latency and greater Pe amplitude.
Discussion
After removing the influence of intelligence on SST behavioral performance in the SST, the two groups performed comparably on Go trials. By contrast, on Stop trials, the mTBI group had lower P(I) at SOA = 250 msec, longer SSRT at SOA = 250 msec and 300 msec, and longer overall SSRT. The control group outperformed the mTBI group when the Stop stimulus occurred soon after the Go stimulus (SOA = 250 and SOA = 300 msec). When the Stop stimulus occurred long after the Go stimulus (at SOA = 400 and 450 msec), however, all participants appeared to have difficulty inhibiting their responses, and no group difference was discovered.
The mTBI group did not respond slowly on Go trials, but exhibited poor stopping performance on Stop trials. Therefore, the poor response inhibition in the mTBI group may be attributable not to a generally slower cognitive process, but rather to a deficiency in the processing of the Stop signal.
Enhanced N1 amplitude suggests that more attention is shifted to the Stop signal. 52,53 Enhanced N1 on SI trials relative to FI trials was found. This finding supports those of other previous studies, 52 –54 indicating that inhibitory control depends partially on the amount of attention switched to the Stop signal. It seems that attention plays an important role in the SST because of larger N1 on SI trials.
Regarding N2 and P3 latency, participants responded faster on SI trials than on FI trials in our study, suggesting faster inhibition process on SI trials. These findings were in line with those of previous studies that have argued that Stop signal processes follow a similar time course on SI and FI trials; therefore, the probability of successful stopping is higher on trials during which perceptual detection of the Stop signal is relatively fast. 28,55 As to N1 amplitude, N2 latency, and P3 latency, however, there were no significant differences between the TBI and the control groups.
The N2 amplitude was more pronounced on FI trials than on SI trials in our study; this was consistent with previous findings. 20,28 We discovered that a higher RPQ score was correlated with longer N2 latency in the mTBI group. Our findings also suggest that inhibitory control (higher P[I]) was significantly positively correlated with N2 amplitudes for all the participants.
Further, symptomatic mTBI has been associated with not only amplitude reduction but also with longer latency of cognitive ERPs for texture and cognitive paradigms in other studies. 56,57 In the present study, only one-third of the participants with mTBI had post-concussion syndrome. The N2 component elicited by the Stop signal is considered to reflect the inhibition process. 20 –22 Therefore, it seems plausible that the mTBI participants with more reported symptoms exhibited delayed inhibition.
Also noteworthy is that evidence of a difference in P3 amplitude between SI and FI trials was obtained for the control group. By contrast, no P3 amplitude difference was found between SI and FI trials for the mTBI group; that is, the mTBI group lacked modulation of P3 amplitude. The central P3 elicited on SI trials was not only the expression of response-inhibitory processes but also of the efficiency of inhibitory control. 28,38 This finding suggests impaired inhibitory control among the participants with mTBI.
More negative ERN amplitudes and more positive Pe amplitudes were observed on error trials than on correct trials for both groups. Regarding Pe amplitude and ERN latency and amplitude, no differences were discovered between the groups. The Pe latency of the mTBI group, however, was significant longer than that of the controls. Thus, error processing in individuals with mTBI may be preserved but less prompt. The Pe represents processes related to conscious awareness of an error and may be related to further cognitive processing after recognition of an error. 34,36 This finding indicated that the ability to recognize an error, and adapt one's behavior accordingly, may be inefficient in mTBI.
We also discovered that higher P(I) was associated not only negatively with Pe latencies but also positively with Pe amplitudes. Studies have argued that the amplitude of the Pe waveform varies with the degree of awareness of an error. 17,35 Therefore, the abnormality of Pe latency in participants with mTBI may reflect a deficit in cognitive control operations, which in turn would affect overall performance monitoring.
The lateral PFC is thought to conduct cognitive control through top-down influences on motor processing. 23,58 The ACC has been implicated in a variety of cognitive tasks that necessitate executive control processes. 33,59 Response inhibition is considered dependent on the integrity of specific regions in the lateral and medial areas of the PFC. 60,61 There were no group differences in standard cognitive tests; however, the behavioral and neurophysiological evidence in the SST revealed a specific PFC abnormality associated with inhibitory responses and error monitoring in the mTBI group.
Because ERPs can be influenced strongly by high level cognitive processes, the use of ERP analyses to assess patients with mTBI has the advantage of being an endogenous approach. Therefore, such analyses can detect changes in cortical functions and underlying brain disturbance and provide crucial information that is unobtainable through standard hospital imaging methods. Further, the ERP approach may be a more promising tool than behavioral measurement and can help researchers to isolate the key processes underlying cognitive dysfunction.
Limitations and directions for further research
A limitation of this study was its low number of participants. Although the sample was adequate for detecting medium and large effects, replication of these findings using a larger population is warranted. In addition, these participants constituted a convenience sample rather than a random sample. Healthy controls were invited from university campuses, leading to a highly intelligent sample and the mTBI group having lower IQs compared with healthy controls. Further, no abnormalities were evident in the conventional CT scans for the mTBI group. Thus, specific links between brain area and cognitive control could not be elucidated. More advanced imaging techniques should be employed for precise detection of brain lesions in future.
Finally, a limitation pertaining to the TBI group was that we did not characterize the sample through post-concussion syndrome. No significant correlations were found between the SSRT, P(I), and RPQ scores, but higher RPQ scores was correlated with longer N2 latency in the mTBI group. This limits the generalizability of our findings. Further clarification is necessary.
Conclusion
The results of this study indicated that two aspects of executive control (inhibition of ongoing responses and cognitive monitoring) appear to be deficient in those with mTBI even more than three months after the injury. Because of the high prevalence of frontal lobe damage, clinical descriptions of TBI often include features that are associated with executive control deficits. This study provided evidence that the SST paradigm and ERP techniques are sensitive approaches for exploring the underlying neural mechanisms of executive function in patients with mTBI. Electrophysiological markers of cognitive dysfunction can be used as a sensitive and objective tool for determining executive control after mTBI and can guide cognitive rehabilitation.
Footnotes
Acknowledgments
We are grateful to the participants for their enthusiastic participation in this study. The work presented in this article is supported by a research grant from Chang Gung Memorial Hospital, Taiwan, Grant No. CMRPD1C0141. A portion of this article was presented in poster form at the 23rd World Congress of Neurology (WCN 2017), Kyoto, Japan, September 2017.
Author Disclosure Statement
No competing financial interests exis