
Abstract
The purpose of the work is to investigate the effects of low-dose testosterone replacement therapy (TRT) and evoked resistance training (RT) on body composition and metabolic variables after spinal cord injury (SCI). Twenty-two individuals with chronic motor complete SCI (ages 18–50 years) were randomly assigned to either TRT+RT (n = 11) or TRT (n = 11) for 16 weeks following a 4 -week delayed entry period. TRT+RT men underwent twice weekly progressive RT using electrical stimulation with ankle weights. TRT was administered via testosterone patches (2–6 mg/day). Body composition was tested using anthropometrics, dual energy x-ray absorptiometry, and magnetic resonance imaging. After an overnight fast, basal metabolic rate (BMR), lipid panel, serum testosterone, adiponectin, inflammatory and anabolic biomarkers (insulin-like growth factor-1 and insulin-like growth factor-binding protein 3 [IGFBP-3]), glucose effectiveness (Sg), and insulin sensitivity (Si) were measured. Total body lean mass (LM; 2.7 kg, p < 0.0001), whole muscle (p < 0.0001), and whole muscle knee extensor cross-sectional areas (CSAs; p < 0.0001) increased in the TRT+RT group, with no changes in the TRT group. Visceral adiposity decreased (p = 0.049) in the TRT group, with a trend in the TRT+RT (p = 0.07) group. There was a trend (p = 0.050) of a 14–17% increase in BMR following TRT+RT. Sg showed a trend (p = 0.07) to improvement by 28.5–31.5% following both interventions. IGFBP-3 increased (p = 0.0001) while IL-6 decreased (p = 0.039) following both interventions, and TRT+RT suppressed adiponectin (p = 0.024). TRT+RT resulted in an increase in LM and whole thigh and knee extensor muscle CSAs, with an increase in BMR and suppressed adiponectin. Low-dose TRT may mediate modest effects on visceral adipose tissue, Sg, IGFBP-3, and IL-6, independent of changes in LM.
Introduction
Spinal cord injury (SCI) is a life-changing event that leads to several health-related consequences due to impairment of the somatic and autonomic nervous systems. The importance of restoring lean mass (LM) has been well established based on different body composition and metabolic variables after SCI. 1 –3 Several studies have demonstrated that lower extremity training using surface neuromuscular electrical stimulation (NMES) of paralyzed muscles increases LM, evokes muscle hypertrophy, and decreases ectopic adiposity. 2 –6 Use of interventions that restore LM and attenuate the increase in visceral adiposity and intramuscular fat (IMF) has been associated with improvement in carbohydrate, lipid, and anabolic profiles in individuals with chronic SCI. 2 Such interventions may mitigate morbidity due to the high prevalence in obesity, type 2 diabetes mellitus, dyslipidemia, and cardio-metabolic disorders after SCI. 7,8
Neuromuscular electrical stimulation-resistance training (NMES-RT) has emerged as a robust approach that evokes 35–40% muscle hypertrophy even years after SCI. 1 –5 This increase in muscle size has been associated with a 35% increase in circulating insulin-like growth factor-1 (IGF-1), likely triggering the downstream hypertrophy signaling pathway of the trained muscles. 2,9 Moreover, 12–16 weeks of NMES-RT improves glucose tolerance, as well as insulin sensitivity and mitochondrial health, after SCI. 2 –5 However, NMES-RT has limited restorative capacity on trunk muscle groups, visceral adiposity, and regional body composition parameters. 10 Most recently, the importance of maintaining trunk muscles after SCI on decreasing visceral adiposity, basal metabolic rate (BMR), and cardio-metabolic profile has been established. 11
Men with chronic SCI have 43% lower circulating serum testosterone (T) levels, compared with matched able-bodied control groups. 12,13 This extensive decline in T-levels may deprive the body of a key anabolic hormone and blunt the effects of NMES-RT. Greater visceral adipose tissue (VAT) accumulation may be associated with the decline in circulating serum T-levels. 11,14 VAT accumulation has been implicated in poor metabolic health in both the able-bodied and persons with SCI, possibly through the secretion of proinflammatory cytokines including C-reactive protein (CRP), interleukin-6 (IL-6), and tumor-necrosis factor-α (TNF-α). 15,16
The effects of testosterone replacement therapy (TRT) on muscle size, body composition, and metabolic profile have been well described. 17 –20 Bauman and colleagues showed that 1 year of 5–10 mg daily TRT in persons with SCI increased whole body and trunk LM and increased BMR, compared with a placebo group. 21 In the rat model of SCI, supra-physiological doses of testosterone attenuated the decline in muscle mass and trabecular bone loss. 22 However, the higher dose (7.5 mg/kg body weight) was accompanied by enlargement of the prostate gland. 22 Therefore, using TRT to restore LM in persons with SCI should be considered with caution, especially after reports about its efficacy on cardiovascular biomarkers. 23,24 In a double-blind placebo controlled trial, TRT gel for 1 year in older men with low testosterone (< 275 ng/dL) was associated with small reductions in cholesterol and insulin but not with other markers of glucose metabolism and inflammation. 24
The primary purpose of the current study was to investigate the effects of 16 weeks of an open-label randomized clinical trial of adding low-dose TRT to NMES-RT (TRT+RT) on parameters of body composition and metabolic health compared with TRT-only in men with chronic complete SCI. Our primary hypothesis is that TRT+RT may augment whole body anabolic homeostasis, increase muscle hypertrophy, decrease ectopic adiposity, and improve metabolic health compared with TRT only in men with chronic SCI. This may be associated with improvement in biomarkers of inflammation following a 16-week intervention.
Methods
Twenty-two men with motor complete SCI were recruited to participate in the current study (TEREX-SCI); a detailed study protocol was previously published. 25 Briefly, a 4-week delayed entry period began with a 2-day visit for baseline measurements to control for body weight and to educate participants on how to monitor their dietary intake (baseline 1; B1). The delayed-entry period was concluded by another two-day baseline visit for measurements of body composition and metabolic profile (baseline 2; B2). The 4-week delayed-entry period was followed by 16 weeks in which participants were randomly assigned in an open-label manner to either TRT+RT (n = 11) or TRT (n = 11). The TRT+RT group received 16 weeks of supervised progressive RT using surface neuromuscular electrical stimulation (NMES) and ankle weights. Both the TRT+RT and TRT groups received 16 weeks of transdermal T patches (2–6 mg/day); patches were applied to the shoulder at bedtime and the site of application was alternated between left and right shoulders. The 16-week period concluded with a 2-day visit for post-intervention measurements of body composition and metabolic profile (post-intervention; PI). For the three visits, each participant underwent a 2-day assessment period with an overnight stay.
Consenting and physical examination
The study was approved by the McGuire Veteran Affairs Institutional Research Board and the Virginia Commonwealth University (VCU) Office of Research and Innovation. The trial has been registered at
Interventions
Resistance training (RT) using evoked NMES
The RT protocol using surface NMES was recently described in detail and shown in a video publication demonstrating step-by-step strategies to effectively implement surface NMES in persons with SCI. 26 Briefly, one surface electrode was placed on the knee extensor muscles 2–3 cm above the superior aspect of the patella over the vastus medialis muscle, and the other lateral to and 30 cm above the patella over the vastus lateralis muscle. A Theratouch 4.7 stimulator unit (Rich-Mar, Inola, OK), was set to deliver biphasic rectangular pulses of 30 Hz, 450 μs pulses at a current amplitude (mA) sufficient to evoke full leg extension against gravity. The current was manually increased to evoke full knee extension (four sets of 10 repetitions) with a 2- to 3-min rest between sets as previously described. 2,10, 25,26 The sets were alternated between the right and left leg starting with the right leg; the current amplitude (mA) was recoded for every repetition. 2,6 Training was conducted twice weekly for 16 weeks with participants sitting in their own wheelchairs. No ankle weights were allowed in the first week of RT to ensure full leg extension against gravity. Once full knee extension was achieved for 40 repetitions without fatigue, ankle weights in 2-pound increments were progressively added on a weekly basis. Each leg was treated separately and no increase in ankle weights was recommended if the knee extensor fatigued with increasing current or failed to reach 40 repetitions.
Testosterone replacement therapy (TRT)
Following B2, TRT was administered daily via shoulder patches (Androderm, Watson Pharma. Inc., Parsippany, NJ) at doses of 2–6 mg/day. 19,27 Serum T concentration was measured and reviewed in blinded fashion every 4 weeks by an endocrinologist. Baseline dose was prescribed according to the initial T-level. A dose of 6, 4, and 2 mg/day was prescribed if the serum T-level was less than 300, 300–600, or above 600 ng/dL, respectively. The dose was decreased to 2 mg/day if the serum T concentration was more than 1000 ng/dL (34.7 nmol/L) and the participant was re-educated about use of the patch if the concentration was less than 250 ng/dL (8.7 nmol/L). Patches were returned after use and counted to ensure adherence to the intervention protocol. Each participant was given a 30-day supply. At the end of 30 days, a fasting blood sample was drawn to measure the level of circulating T and allow proper adjustment of the dose. Participants were instructed to place patches before bedtime and keep it on for 24 h, except patches were allowed to be removed in the morning before bathing and to be re-attached again on the same spot for the rest of the day. If skin irritation became an issue, participants were initially advised to move patches up or down on the shoulder muscles, away from the site of irritation; and if the situation was not resolved, a low-dose hydrocortisone cream was prescribed. Participants discontinued T patches on the last day of the study or 4 days prior to PI measurements.
Two-day assessment period
The 2-day assessment period included measurements of body composition, anthropometry, and dual energy x-ray absorptiometry (DXA; B1 and B2 and PI). Additionally, magnetic resonance imaging (MRI) scans were obtained for whole thigh, individual skeletal muscles, IMF, trunk VAT and subcutaneous adipose tissue (SAT) cross-sectional areas (CSAs) at B2 and PI. Participants were then escorted to the VCU Clinical Research Unit (VCU-CRS) for dinner and remained in the VCU-CRS unit overnight for metabolic studies the following morning.
Anthropometrics and body composition assessments
The height of each participant was determined while lying in a supine position using their left sides. Two smooth wooden boards were placed at the participant's head and heels and the distance between them was measured to the nearest centimeter. Measurements of abdominal girth (widest region of the trunk), waist (narrowest region of the trunk), and hip (encompasses both greater trochanters) and thigh (mid-point between anterior superior iliac spine and superior border of the patella) circumferences were measured in triplicate in the supine position. For the first three circumferences, participants were asked to take a deep breath, then exhale, and measurements were captured at the end of expiration. Measurements were repeated if there was a difference greater than 0.5 cm between repeated readings. 28
Dual energy x-ray absorptiometry
Body composition was measured by whole body scans using a GE Lunar Prodigy Advance scanner (GE Lunar Inc., Madison, WI). Fat free mass, fat mass (FM), %FM, and LM for total body, trunk, legs, arms, android, and gynoid regions were measured by DXA. 28 –31 The DXA scanner was calibrated using a daily quality control phantom according to manufacturer guidelines. Participants were transferred to the DXA table using either a ceiling lift or self-transfer with or without sliding board. Participants were allowed 20 min in a flat supine position to account for possible fluid shifts before starting the scan. Knees were strapped together using a large velcro strap above the knee joints and every effort was made to ensure that each leg was placed in a neutral position with the big toe facing upward. A lead research investigator checked that the whole-body posture was aligned straight with no rotation in the pelvis or shifting of the trunk. The arms were strapped close to the body in mid-prone position to ensure the total body was within the scanning field. All scans were performed and analyzed by a trained DXA operator using Lunar software version 10.5. Total body cuts were placed by the computer auto analysis program delineating anatomical regions of interest and final adjustments were made to ensure optimum inter-participant reproducibility. Short-and long-term precision of the regional and whole-body composition using DXA was recently determined in persons with SCI. 31 For long-term precision assessment, the root mean square-coefficient of variation (RMS-CV%) for each region did not exceed 6.0, 3.0, 4.4, and 2.0% for arms, legs, trunk, and total body mass, respectively. 31
MRI
Thigh muscle CSA (primary outcome variables)
MRI was performed at the VAMC using a General Electric Signa 1.5-T magnet as previously described. 2,32,33 Approximately 12–15 transaxial images (fast spin echo; repetition time, 850–1,000 msec; echo time, 6.7 msec; imaging frequency, 63.8 MHz; echo number, 1; echo train length, 3; flip angle, 90°; field of view, 20 cm; matrix size, 256 × 256) 8 mm thick and 16 mm apart, were taken from the hip joint to the knee joint using a General Electric body array flex coil to measure thigh CSA. By using a localized coil, the signal-to-noise ratio was improved, resulting in high-resolution images for analysis. The acquisition time per leg was 3.5 min. The participant's legs were strapped together to mitigate involuntary muscle spasms, and participants were provided earplugs to minimize the noise. Images were analyzed using Win-Vessel software (Ronald Meyer, Michigan State University). To distinguish muscle from fat, the outer perimeter of the thigh muscle group was manually traced, and pixel signal intensity was automatically determined via the software. A bimodal histogram segmentation was plotted that contained two distinct peaks, with the first peak representing the threshold for muscle and the second peak representing the threshold for fat. This mid-point value was used to separate muscle pixels from IMF pixels as previously described. 32,33
Regions of interest were manually traced including whole thigh CSA (thigh CSA = muscle CSA+ SAT CSA). Whole skeletal muscle CSA is the entire thigh muscle CSA including IMF and excluding bone CSA. Absolute skeletal muscle was determined via signal intensity after excluding IMF and femoral bone CSA. SAT CSA was defined as the area between the outside of the muscle CSA and inside of the thigh CSA. 2,32 33
Visceral and subcutaneous adiposity
MRI images were obtained using an Echelon RAPID Torso/Body Coil (Hitachi Medical Systems America, Twinsburg, OH) to capture multi-axial slices of the trunk region. Transverse axial images (axial in-phase/out-phase with a repetition time of 140 msec and echo time of 4.2 and 2 msec for the in-phase and the out-phase, respectively; a 42-cm field of view; matrix size of 256 × 256; 1 number of excitation; acquisition time of 40 sec and slice thickness was 0.8 cm and interslice space was 0.4 cm) were obtained from the xiphoid process to L4-L5 and from L4-L5 to the femoral heads. 11,14,15,34 In the supine position, subjects had lower extremities strapped to avoid unpredictable movement due to spasms during the scan and subsequent image artifacts. Participants were instructed to maintain their position during the scan and were asked to take a deep breath and hold it for 20 sec to prevent any respiratory artifacts that could alter the quality of images. 11
VAT was quantified in anatomical regions between liver and kidneys (VATL-k), between kidneys and umbilicus (VATK-U), between iliac crests and femoral heads (VAT IC-FH) and total VAT (VATtotal). Two participants were not scanned from the TRT+RT and TRT-only groups because of early withdrawal from the study in Week 8 and the other had sharpeners in his vertebral canal and was excluded for the fear of causing further damage to vital organs inside the magnet. 11,15 During the PI scan, TRT patches were removed 48–72 h prior to MRI scans to avoid possible skin burn.
Day 2—metabolic testing (secondary outcome variables)
After completing the body composition assessment, participants were then escorted to the VCU-CRS unit for dinner and remained there overnight for metabolic studies the following day.
Basal metabolic rate (BMR)
After an overnight fast of 10–12 h, participants were kept in a dark room for 20–30 min to attain a resting state during which BMR was measured as previously described. 30,35 Briefly, while the subject was in the supine position, a canopy was placed over the subject's head. Each subject was allowed 2–3 min before starting the test to ensure that subjects were calm and comfortable prior to initiating measurements. All subjects were instructed to stay awake during the entire test and to breathe normally. The canopy was then attached to a vacuum to draw expired gases to the flowmeter of the metabolic unit (COSMED KB42; COSMED, Rome, Italy). Prior to the test, the metabolic unit was calibrated using standard procedures as recommended by the manufacturer. Carbon dioxide and oxygen output were used to calculate the respiratory exchange ratio, and the BMR (kcal/day) was calculated using the average of the last 15 min of the test. 30,35
Serum T, anabolic growth factors, lipid panel, adiponectin, and inflammatory biomarkers
After BMR, blood samples were then collected after an overnight fast of 10–12 h. After placing an intravenous (IV) line, fasting blood samples were collected around 6.30 a.m. Total T was measured by liquid chromatography with isotope dilution mass spectrometry detection after supported liquid extraction (Esoterix, Inc.). The amount of testosterone in each sample was calculated from a linear plot generated by purified testosterone standards ranging from 2.5 to 5000 ng/dL. Free T concentration was calculated using sex hormone binding globulin (SHBG) and albumin concentrations (
Serum insulin-like growth factor-1 (IGF-I) and insulin-like growth factor-binding protein 3 (IGFBP-3) concentrations were measured by an immunoluminometric assay (Quest Diagnostics, Madison, NJ). Fasting lipid panel (high-density lipoprotein cholesterol, low-density lipoprotein cholesterol, total cholesterol, and triglycerides) was determined as previously described. 11 Inflammatory biomarkers CRP, IL-6, TNF-α, and free fatty acids (FFA) were determined by commercially available enzyme-linked immunosorbent assay (ELISA) kits (ALPCO Diagnostics, Salem, NH). Total adiponectin was quantified in duplicate by a colorimetric ELISA (ALPCO Diagnostics). This assay has a detection limit of 0.034 ng/mL. Adiponectin was expressed as (ng/mL) as well as after correction for body weight, LM and fat mass (ng/mL/ kg) to control for variability relative to body size and body composition. 37
Intravenous glucose tolerance test (IVGTT)
After fasting blood samples, an intravenous line was placed to facilitate infusion of glucose and blood sampling. Blood samples were taken before and every 2–3 min after glucose injection (0.3 gm/kg IV over 30–60 sec) and 30 min, followed by blood collection every 5–10 min ending at 180 min after glucose injection. Twenty minutes after the glucose injection a bolus of insulin (0.02 U/kg, regular short acting insulin, Humulin; Lilly) was injected to determine insulin sensitivity. Plasma glucose was measured by the autoanalyzer glucose oxidase method and plasma insulin concentrations were determined by commercial radioimmunoassay. The glucose disposal rate per unit of secreted insulin per unit time and glucose mediated glucose disposal rate were calculated from a least-squares fitting of the temporal pattern of glucose and insulin throughout the IVGTT using the MINMOD program. 38,39 The insulin sensitivity index (Si) describes the effect of insulin to promote glucose disposal and to inhibit hepatic glucose production. Glucose effectiveness (Sg) indicates the ability of glucose to cause its own uptake into the cell at basal insulin levels. 38
Dietary logs
Each participant met with a dietitian at the start of the study (B1 and B2) and was asked to maintain a weekly 5-day food dietary log monitoring their caloric intake for the duration of the study. 2,32 Participants were instructed to record all liquid and food consumption, but no nutritional advice was given on the size or the portion of the food in the first 4 weeks. However, information from dietary logs was used to attempt to balance the composition of diet (carbohydrates, fat, and protein) between groups. Dietary logs were analyzed on a weekly basis using a nutritional software package (Nutrition Data System for Research version 2014) under the supervision of a registered dietitian. After analysis was completed, the average caloric intake (kcal) and percentage macronutrients (carbohydrates, fat and protein) were calculated for 16 weeks. Each participant received a monthly feedback via phone call with the registered dietitian on how to maintain appropriate dietary habits based on BMR and the recommended percentage macronutrients (45% carbohydrates, 30% fat, and 25% total protein). 2,30 Every effort was made to balance the dietary habits between the TRT+RT and the TRT groups.
Statistical analysis
All data were tested for normality using the Shapiro-Wilk tests and if necessary (p < 0.05), data were then log-transformed prior to any statistical analysis. Outliers were detected using normal Q-Q plots at different time-points (B1, B2, PI) for each group. Unpaired t-tests were used to determine the difference in physical characteristics and dietary records between TRT+RT and TRT subjects at B1 or B2. We performed 3 × 2 mixed model analysis of variance tests to examine within-subject (B1, B2, PI) and between-group (TRT+RT vs. TRT only) differences, as well as the interaction between groups on the primary (muscle CSAs) and secondary outcome variables over the course of the 16-week study. When appropriate, a Bonferroni post hoc adjustment for multiple comparisons was performed to control for type II error. Independent t-tests were used to examine the differences in delta changes (PI-B2) in muscle size, IMF, and VAT CSAs between TRT+RT and TRT to account for the variance among participants. A repeated measure ANOVA was used to analyze serum T-levels for B2, and Weeks 4, 8, 12, and 16 of the study.
Pearson correlation coefficients were used to examine associations between changes in thigh muscle CSA or serum T-levels with body composition and metabolic variables. The sample size was calculated based on the effect sizes of NMES-RT on muscle CSA, VAT, and plasma insulin concentration as previously published. 2 The number of subjects necessary to find statistical differences in the primary outcome variables was found to be 10 participants per group. 25 Twelve subjects per group would provide greater than 80% power to detect a change of this magnitude using a two-sample t-test with an alpha level of 0.05. The additional two subjects per group were used to account for any drop-outs over the course of the study. One participant each from the TRT+RT (in Week 8) and TRT (in Week 13) withdrew from the study; however, their PI body composition and metabolic data points were estimated using the SPSS missing values option. Statistical analyses were performed using IBM-SPSS version 24.0 (SPSS, Chicago, IL) and all values are presented as mean ± standard deviation.
Results
Baseline physical and SCI characteristics were not different between the groups (Table 1). Three participants in the TRT+RT group and only one participant in the TRT group suffered skin irritation from using transdermal testosterone patches. Skin irritation was resolved by using over-the-counter hydrocortisone topical cream in two participants. Two other participants switched to transdermal gel in Week 10 (TRT+RT) and in Week 12 (TRT only) based on medical recommendations. One participant was medically asked to withdraw in Week 8 because of recurrent episodes of syncope. No other adverse events were observed.
Physical and SCI Characteristics for Participants Enrolled in the TRT+RT and TRT-Only Group
Values are presented as mean ± standard deviation.
SCI, spinal cord injury; TRT, testosterone replacement therapy; RT, resistance training; B1, baseline 1; B2, baseline 2 (4 weeks after B1 and immediately prior to 16-week interventions); BMI, body mass index; TSI, time since injury; ISNCSCI, International Standards for Neurological Classification of Spinal Cord Injury.
In the TRT+RT group, adherence to the progressive RT protocol was 98.5 ± 1.5% over 16 weeks. Five participants missed only one visit and the other five did not miss any of the scheduled visits of the 32 visits.
In the TRT+RT group, the amplitude of the current required to evoke full knee extension and number of repetitions (80 per week) did not change across the 16 weeks. The left knee extensor muscle group required less current to evoke full knee extension compared with the right knee extensor (p = 0.01–0.09) over the 16-week period. Ankle weights progressively increased for both the right (0 ± 0 to 20.0 ± 6.5 lbs) and left (0 ± 0 to 20 ± 6 lbs) legs over the course of 16 weeks of training (p < 0.0001).
Dietary intake and serum testosterone
Mean caloric intake was 1532 ± 547 and 1497 ± 127 kcal/day for the TRT+RT and TRT groups, respectively (p = 0.6) over the 16-week period. The dietary contribution of fat (37 ± 7% vs. 36 ± 6%; p = 0.6), carbohydrate (43 ± 9% vs. 42 ± 8%; p = 0.5), and protein (19.0 ± 4.5%, 0.81 ± 0.37 g/kg−1/day−1 vs. 20.5 ± 6.0%, 0.88 ± 0.24 g/kg −1/day−1; p = 0.5–0.6) was not different between the TRT+RT versus TRT groups.
Baseline serum T was not different between the TRT+RT and TRT groups. Four days after removal of the patches, serum T decreased (p = 0.001) in both TRT+RT (B1: 417 ± 169; B2: 413.5 ± 147.0; and PI: 258.5 ± 175.0 ng/dL) and TRT only (B1: 431 ± 251; B2: 435.5 ± 177.0; and PI: 288 ± 258 ng/dL) groups with no difference between the groups. Monthly serum T-levels, free T-level, and SHBG for TRT+RT and TRT during the period TRT was administered were reported in Table 2. Monthly serum T-level significantly (p = 0.05) increased in TRT+RT but not in the TRT-only group. Compared with B2, serum T-level increased by 41% (p = 0.02) in Week 4, with nonsignificant 27.3% and 47.2% increases were observed in Weeks 12 (p = 0.7) and 16 (p = 0.097) following TRT+RT, respectively. A nonsignificant 3% increase was noted in Week 12 following TRT only.
Metabolic Outcomes for Participants Enrolled in the TRT+RT and TRT-Only Group
Values are presented as mean ± standard deviation.
, statistical difference from B2; p < 0.001.
Significant interaction between TRT+RT and TRT groups; p < 0.05.
Measurements of T-levels were captured with patches on.
To convert values for total testosterone level to nanomoles per liter, multiply by 0.0347.
TRT, testosterone replacement therapy; RT, resistance training; T, testosterone; B1, baseline 1; B2, baseline 2 (4 weeks after B1 and immediately prior to 16-week interventions); PI, post-intervention following 16 weeks; Not available, data were not available because the TRT group was instructed to report for testing 4 days after the last patch; SHBG, sex hormone binding globulin.
Body composition variables
Physical characteristics
BMI significantly increased in the TRT+RT group (25 ± 4.5 kg/m2 to 26.6 ± 4.0 kg/m2; p = 0.047) with no change in the TRT-only group (24.4 ± 3.6 kg/m2 to 24.0 ± 3.4 kg/m2; p = 0.09). BMI was different between the two groups (p = 0.004). There was a trend of greater body mass (83 ± 15.5 kg vs. 77 ± 10; p = 0.051) between the TRT+RT and TRT-only groups at PI.
Anthropometrics
In the TRT+RT group, supine thigh circumference increased significantly (B1: 49.3 ± 8.0 cm; B2: 50 ± 8 cm; PI: 53 ± 8 cm; p = 0.003) with no changes in the TRT-only group, and the difference between the two groups was significant (p = 0.01).
Body composition variables
Trunk %FM showed a significant decrease (p = 0.029) following both interventions (Table 3). Both interventions led to significant increases in trunk LM (p = 0.03). There were no other differences in body composition variables at B1, B2, or PI between TRT+RT and TRT groups. There were 2.7 kg and 1.85 kg increases (p < 0.0001) in total body and legs LM in the TRT+RT group but not in the TRT-only group (Table 3).
Regional and Total Body %FM, FM, and LM following Repeated DXA Scans, as well as VAT CSA (cm2) for Persons with SCI for Participants Enrolled in the TRT+RT and TRT-Only Group
Statistical difference from B1; p < 0.05.
Statistical difference from B2; p < 0.003; p < 0.027.
Trend of decrease following TRT+RT compared with B2; p = 0.07.
Statistical interaction between the TRT+RT and TRT-only groups; p < 0.001 (leg lean mass), p < 0.02 (leg total mass).
%FM, percent fat mass; FM, fat mass; LM, lean mass; DXA, dual energy x-ray absorptiometry; VAT, visceral adipose tissue; CSA, cross-sectional area; SCI, spinal cord injury; TRT, testosterone replacement therapy; RT, resistance training; B1, baseline 1; B2, baseline 2 (4 weeks after B1 and immediately prior to 16-week interventions); PI, post-intervention following 16 weeks; VATL-k: VAT extended from the liver to the kidneys; VATk-U, VAT extended from the kidneys to the umbilicus; VATIC-FH, VAT extended from iliac crests to the femoral heads; VATtotal, Total VAT CSA.
Skeletal muscle and intramuscular fat (IMF) cross-sectional areas
Whole thigh muscle CSA, IMF CSA and %IMF
Table 4 demonstrates the changes in thigh skeletal muscle CSAs following TRT+RT and TRT. Figure 1 demonstrates significant delta changes (PI-B2) in whole thigh, whole thigh muscle, absolute thigh, and extensor muscle CSAs between the TRT+RT and TRT groups (p < 0.0001) for both the right and left legs.

Delta changes in muscle cross-sectional area (CSA; post-intervention–baseline 2) following 16 weeks of testosterone replacement therapy (TRT)+ resistance training (RT) or TRT-only interventions.
Whole Thigh CSA, Whole and Absolute Muscle CSA, and Intramuscular Fat in Persons with SCI for Participants Enrolled in the TRT+RT and TRT-Only Group
Statistical difference from B2, whole thigh muscle CSA (p < 0.0001).
x, statistical interaction between TRT+RT and TRT only groups for whole thigh muscle CSA (p < 0.0001).
x-, a trend of interaction between TRT+RT and TRT only groups for relative IMF (p = 0.08).
A1: area 1 (#1–4), reflects the proximal four MRI slices of the thigh immediately following inferior border of the gluteus maximus muscle.
A2: area 2 (#5–8), reflects the mid four MRI slices of the thigh.
A3: area 3 (#9–12), reflects the distal four MRI slices of thigh towards the knee joint.
CSA, cross-sectional area; SCI, spinal cord injury; TRT, testosterone replacement therapy; RT, resistance training; B2, baseline 2 (4 weeks after B1 and immediately prior to 16-week interventions); PI, post-intervention following 16 weeks; SAT, subcutaneous adipose tissue; IMF, intramuscular fat.
Whole thigh muscle (r = 0.5, p = 0.04) and absolute muscle (r = 0.5, p = 0.04) CSAs at B2 were related to serum T (n = 20). Circulating serum T at Week 12 was positively related to whole thigh muscle (r = 0.59, p = 0.022) and tended to be related to knee extensor (r = 0.42, p = 0.07) CSAs at PI (n = 20).
Absolute IMF and %IMF CSA decreased by 2 cm2 (p < 0.0001) and 4% (p < 0.001), respectively, following TRT+RT compared with the TRT-only group (Fig. 1). Changes in right whole absolute thigh muscle and knee extensor CSAs were negatively related to absolute IMF CSA (r = -0.88, p = 0.0001 and r = -0.80, p = 0.0001) and relative IMF (r = -0.91, p = 0.0001 and r = -0.83, p = 0.0001). Similar relationships were observed on the left side between thigh muscle, knee extensor CSAs and absolute IMF CSA. %IMF CSA-B2 was negatively related to Si B2 (n = 18; r = -0.48, p = 0.045), Sg PI (n = 19; r = -0.48, p = 0.034) and showed a trend with Si PI (n = 19; r = -0.43, p = 0.07).
Individual muscle CSA
For knee extensor CSAs (Table 5), there were significant increases in the proximal (34%; p < 0.0001), middle (32.2%; p < 0.0001) and lower (30 %, p < 0.0001) slices following the TRT+RT intervention. Interactions also were noted between the TRT+RT and TRT-only groups for upper (p = 0.007), middle (p = 0.009), and lower (p = 0.007) slices of knee extensor CSAs.
Whole and Absolute $ Muscle Cross-Sectional Area of Individual Muscle Groups for Persons with SCI Enrolled in the TRT+RT and TRT-Only Group
Absolute muscle CSA refers to the muscle CSA after excluding both bone and IMF CSAs.
, Statistical difference from B2, whole thigh muscle CSA (p < 0.0001).
x, statistical interaction between TRT+RT and TRT only group s for whole thigh muscle CSA (p < 0.0001–0.007).
#, between group effects between TRT+RT and TRT only groups (p < 0.04).
#-, a trend of between groups differences between TRT+RT and TRT only groups (p < 0.09).
x-, a trend of interaction between TRT+RT and TRT only groups for relative IMF (p = 0.08).
A1: area 1 (#1–4), reflects the proximal four MRI slices of the thigh immediately following inferior border of the gluteus maximus muscle.
A2: area 2 (#5–8), reflects the mid four MRI slices of the thigh.
A3: area 3 (#9–12), reflects the distal four MRI slices of thigh towards the knee joint.
SCI, spinal cord injury; TRT, testosterone replacement therapy; RT, resistance training; B2, baseline 2 (4 weeks after B1 and immediately prior to 16-week interventions); PI, post-intervention following 16 weeks; CSA: cross-sectional area; KE, knee extensor; IMF: intramuscular fat; RF, rectus femoris; SAT: subcutaneous adipose tissue; PI: post-intervention; HAMS, hamstrings.
After accounting for IMF (Table 5), proximal knee extensor CSAs of TRT+RT increased by 43.7% (p < 0.0001) with interaction (p < 0.0001) and between-group (p = 0.035) differences (Fig. 2). For middle and lower CSA slices, there were increases of 34% (p < 0.0001) and 33% (p < 0.0001), respectively, following TRT+RT with interaction (p < 0.0001, for both regions) and between-group (p = 0.04, for middle CSA slices) effect (Fig. 2A). For the rectus femoris muscle, a similar pattern was noted for proximal, middle, and distal CSA slices (p < 0.0001) following TRT+RT. Proximal (35.7%), middle (32%), and distal (29.5%) slices of the three vasti muscle CSA showed significant increase following TRT+RT, with significant interaction and between-group differences in proximal (p = 0.043), and a trend in the middle (p = 0.055) and the distal (p = 0.085) CSA slices (Fig. 2B). There was also an 8% increase in distal (p = 0.009) CSA of the hamstring muscles following TRT+RT intervention (Fig. 2C). Adductor muscle CSA showed an increase in the proximal slices (15%; p = 0.003) with a trend in the CSAs of middle (19.5%; p = 0.085) and distal (30.5%; p = 0.085) slices in the TRT+RT group (Fig. 2D).
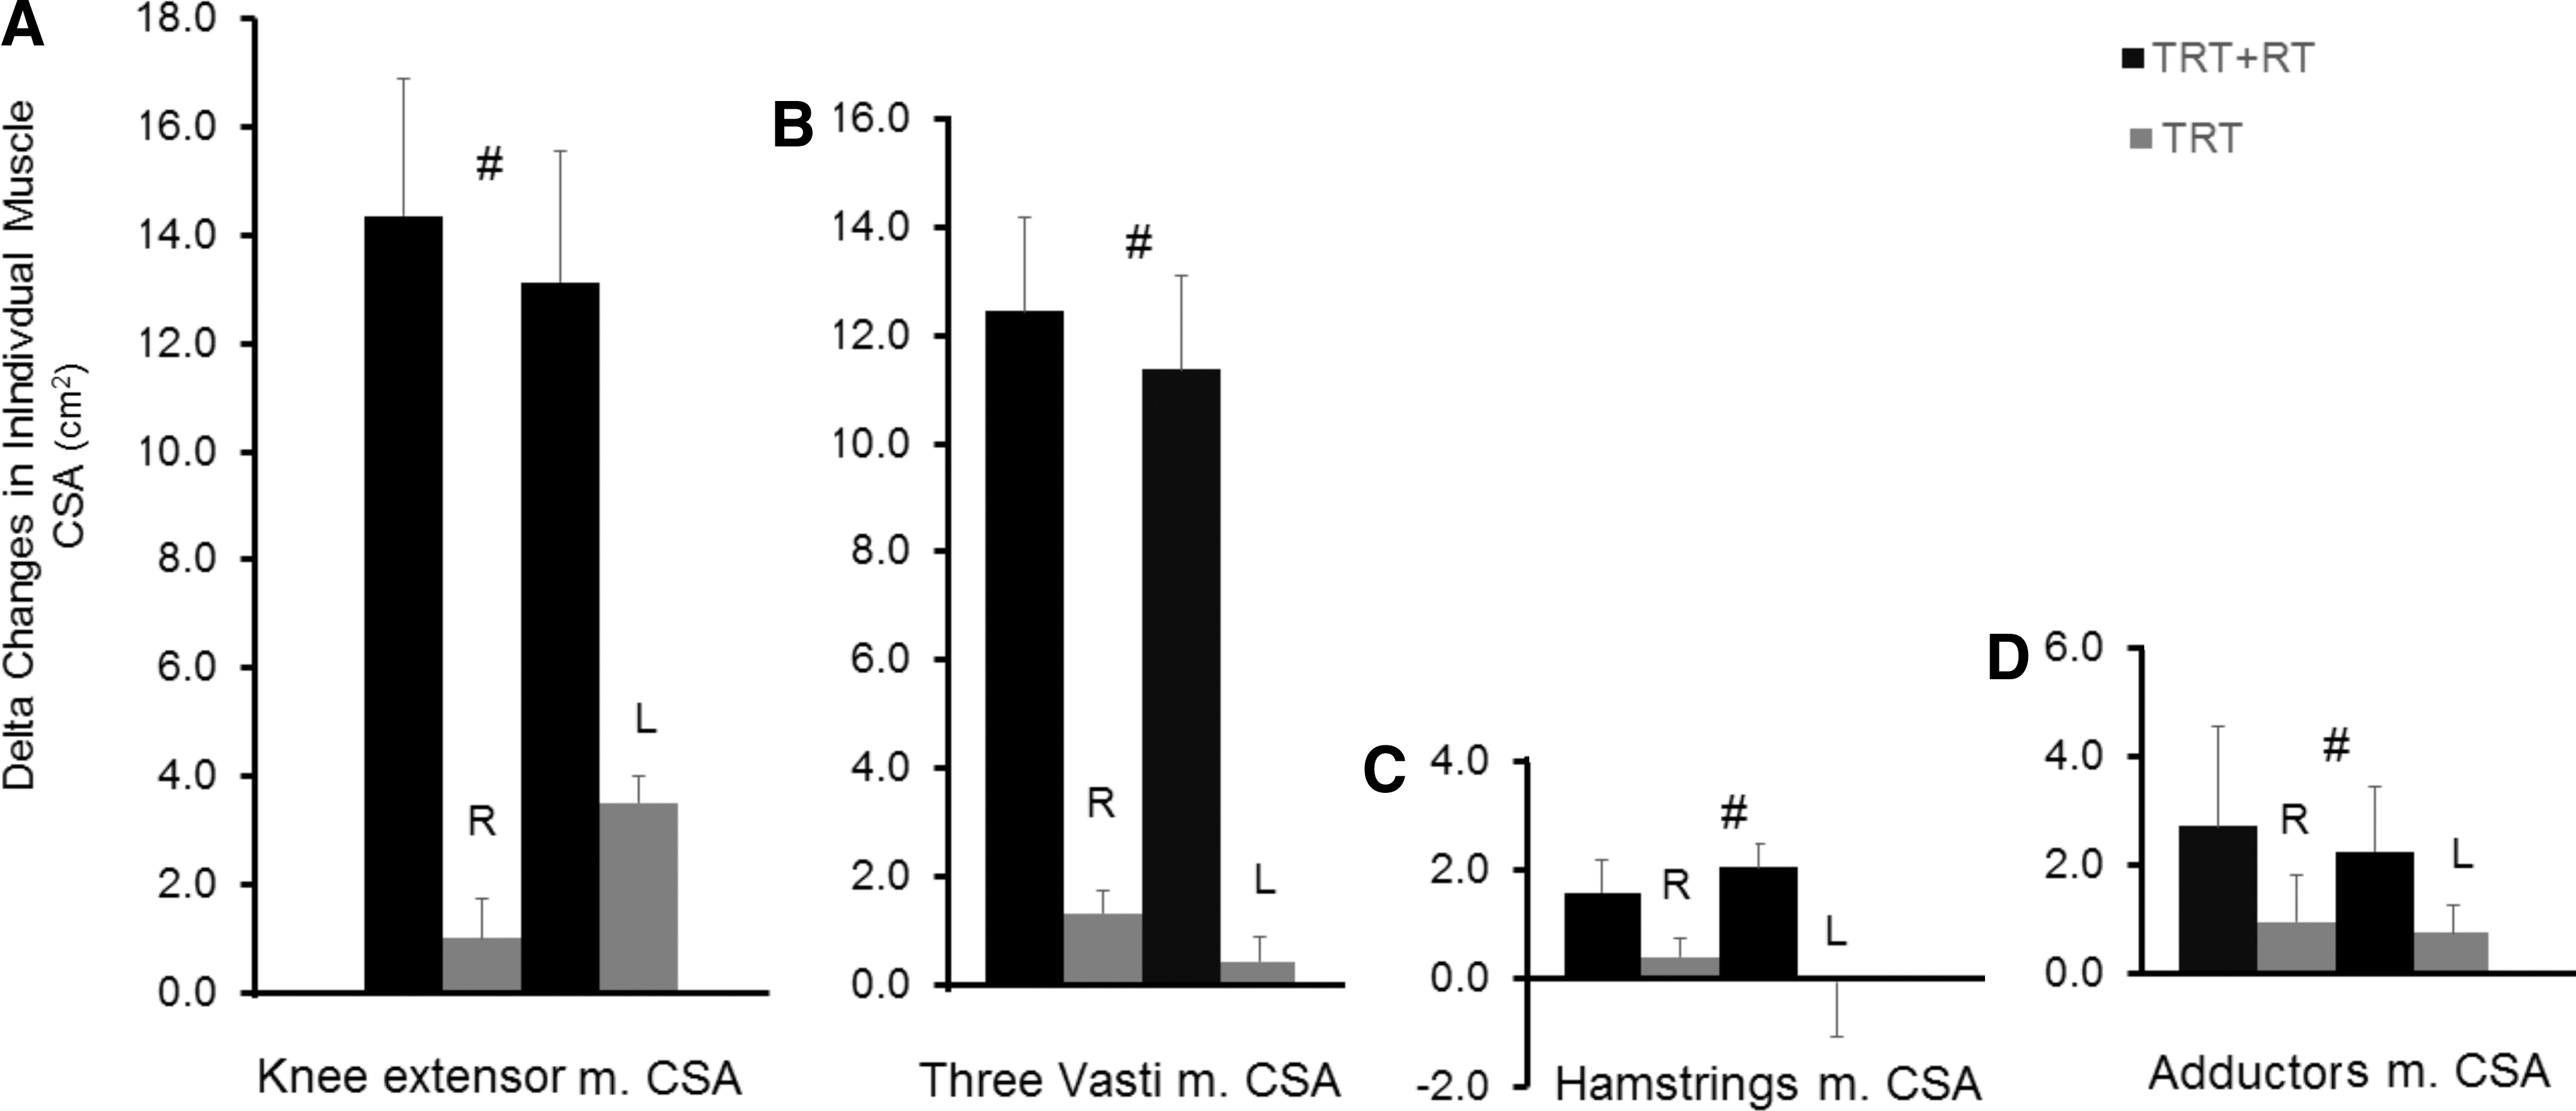
Delta changes in individual muscle cross-sectional area (CSA; post-intervention–baseline 2) following 16 weeks of testosterone replacement therapy (TRT)+ resistance training (RT) or TRT-only interventions. Changes in the
Visceral and subcutaneous adiposity
VATL-k decreased (p = 0.027) in the TRT+RT group (5%; p = 0.07) but not in the TRT group (5%; p = 0.17). VATK-U decreased (p = 0.01) in the TRT group (11%; p = 0.014) and not in the TRT+RT group (14%; p = 0.1). VAT IC-FH decreased (14.5%; p = 0.032) in the TRT+RT group (p = 0.05) but did not change in the TRT group (3%; p = 0.47). VATtotal decreased (p = 0.01) in both groups. In the TRT group, pairwise comparisons showed a decrease (7%; 91.5 ± 49.5 to 84.5 ± 49.0 cm2; p = 0.049) with a trend towards decrease in the TRT+RT group (14%; 101 ± 71 to 88 ± 55 cm2; p = 0.07). Delta differences (PI-B2) in VAT IC-FH were different (p = 0.026) between the TRT+RT (n = 7; −20.5 ± 16.0 cm2) and TRT only (n = 9; −4 ± 10 cm2) groups (Fig. 3).
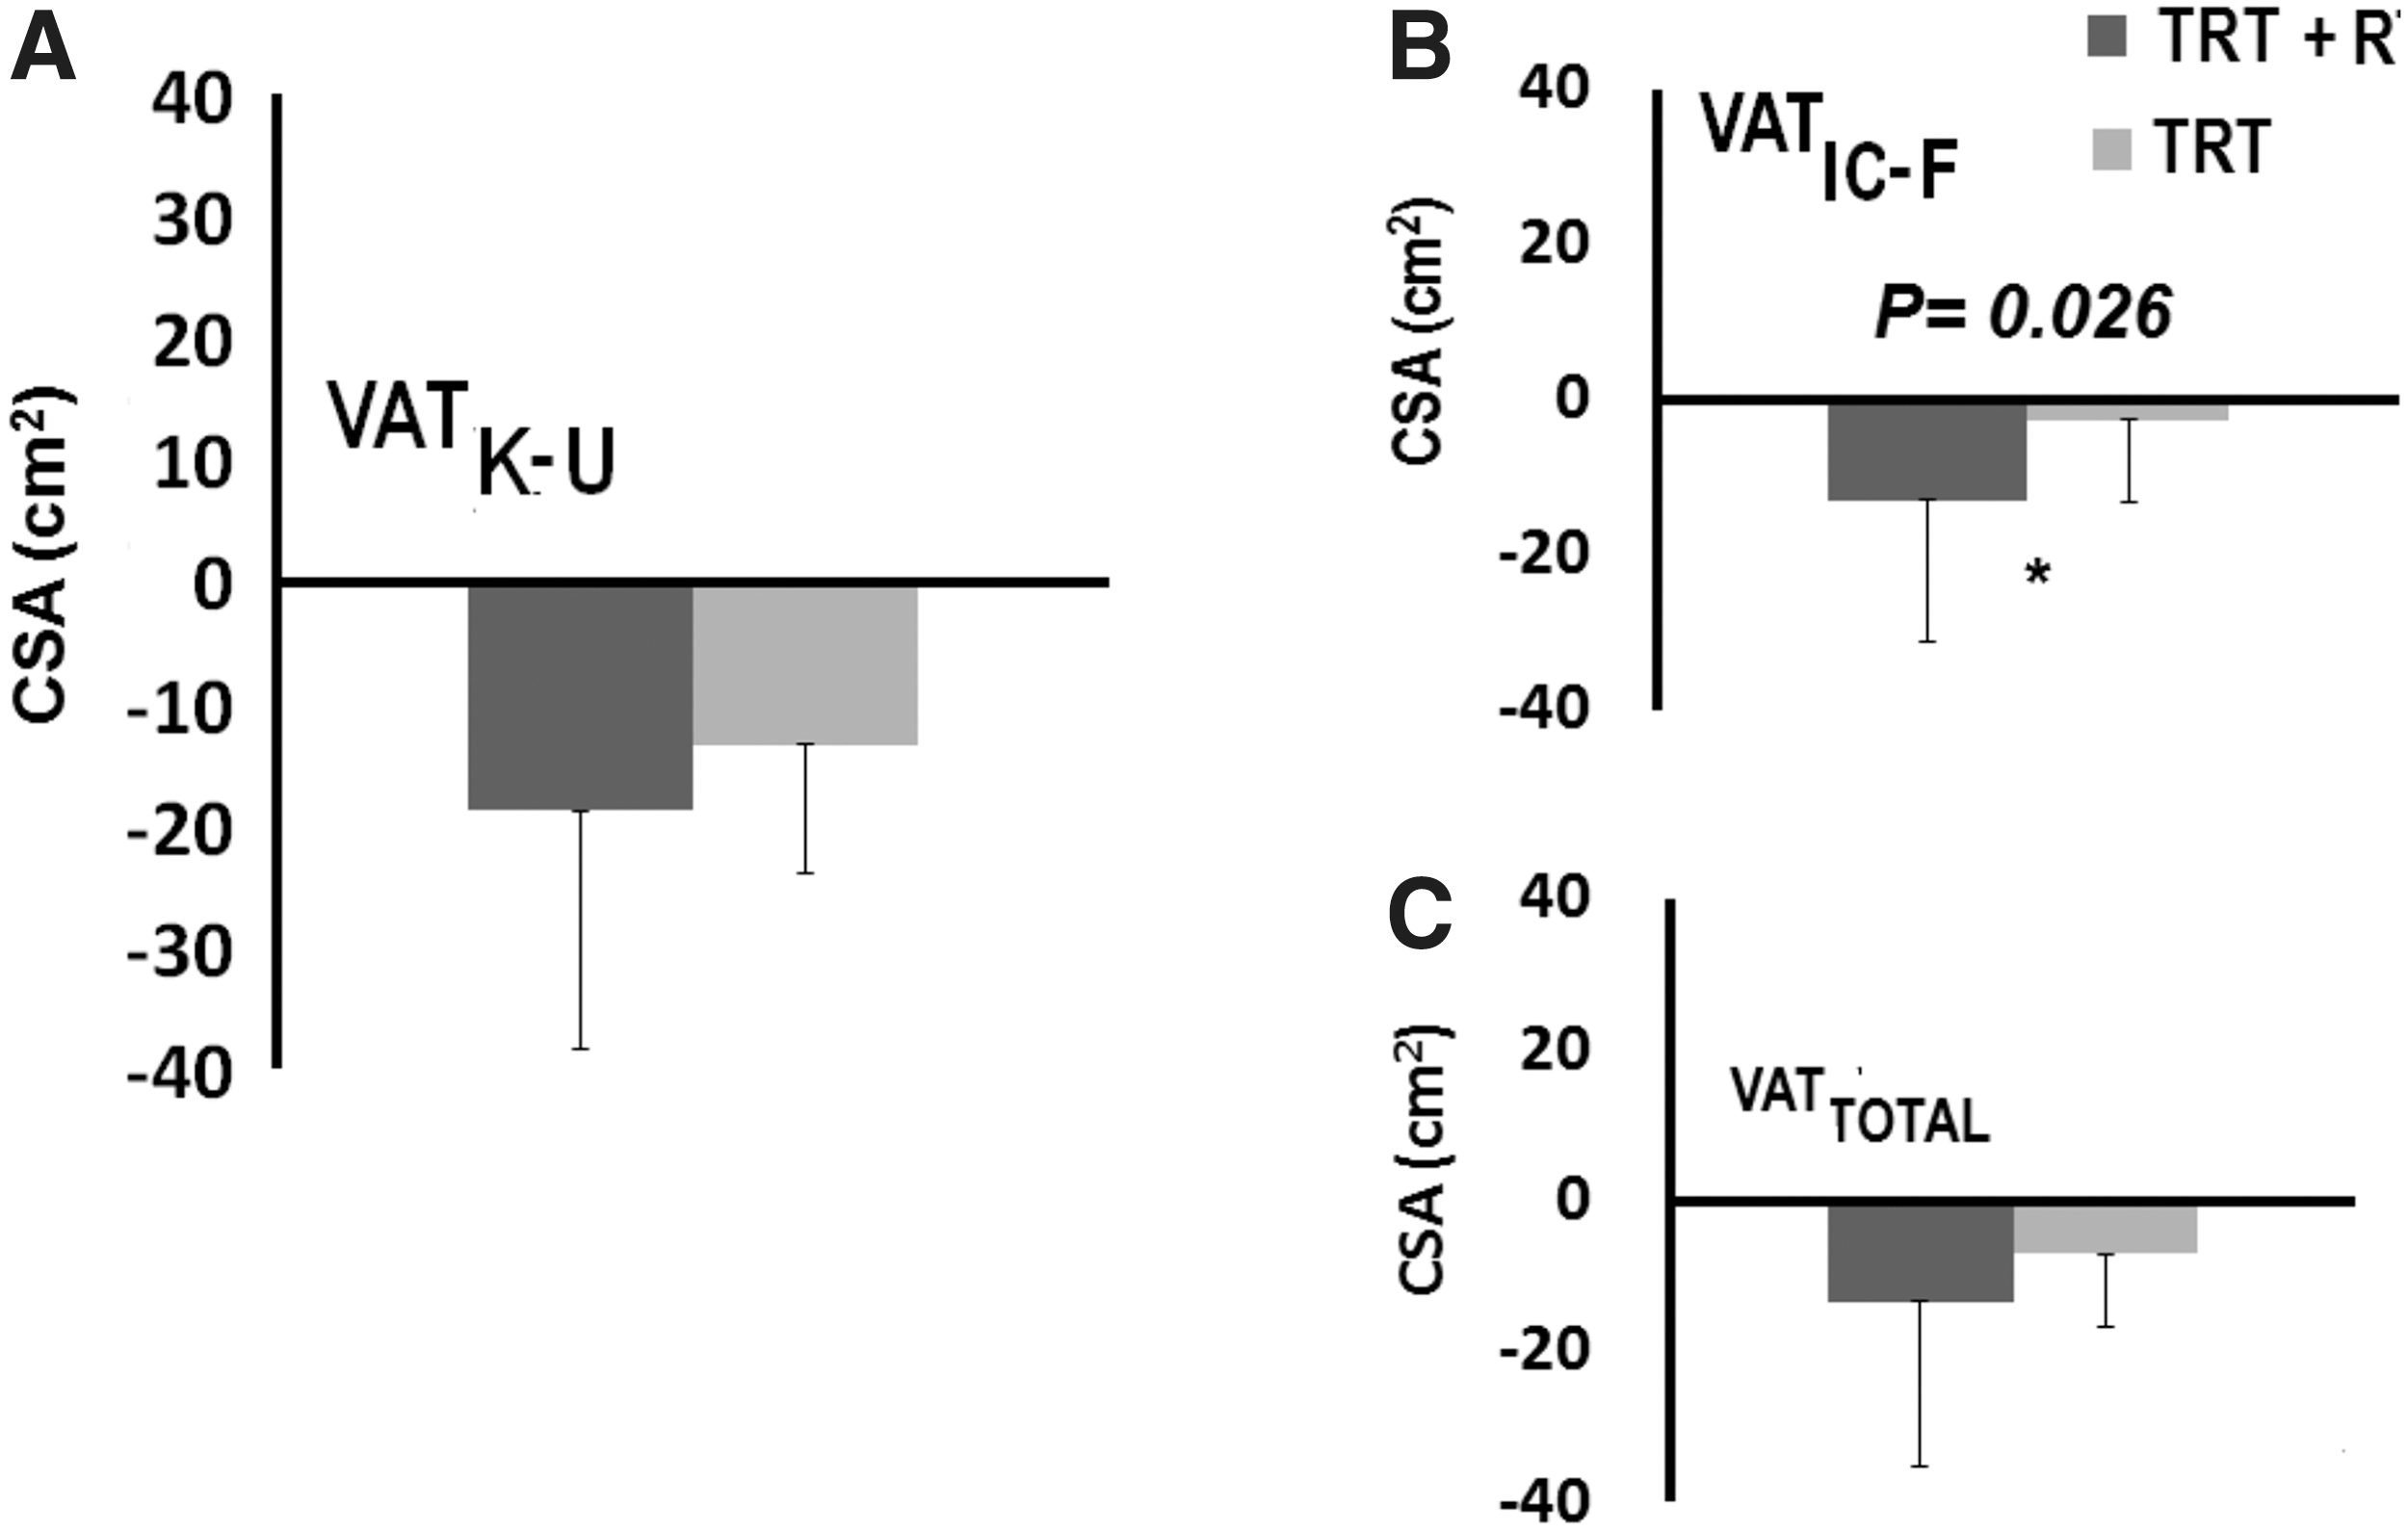
Delta changes (post-intervention–baseline 2) in visceral adipose tissue (VAT) following 16 weeks of testosterone replacement therapy (TRT)+ resistance training (RT) or TRT-only interventions.
VAT: SATK-U decreased (p = 0.01) in both the TRT+RT (0.71 ± 0.53 to 0.65 ± 44 cm2) group and the TRT (0.75 ± 0.42 to 0.69 ± 0.43) group. VAT:SATtotal showed a trend towards a decrease in both the TRT+RT (0.63 ± 0.38 to 0.59 ± 0.33 cm2; p = 0.06) and in the TRT-only (0.66 ± 0.31 to 0.64 ± 0.31; p = 0.06) groups. Serum T-level at B2 was negatively related to VATtotal (B2: r = -0.52, p = 0.012 and PI: r = -0.53, p = 0.016) and VAT: SATtotal (r = -0.49, p = 0.026 and PI: r = -0.46, p = 0.043).
Metabolic profile
Basal metabolic rate (BMR).
There was a nonsignificant 121–127 kcal/day increase (∼8%) in BMR following TRT+RT (p = 0.3) with no changes in the TRT-only group. BMR adjusted to body weight showed a similar trend (p = 0.57) following TRT+RT (n = 11; B2: 19.7 ± 5.6; PI: 20.8 ± 5.8) and TRT only (n = 11; B2: 19.8 ± 3.0; PI: 19.5 ± 3.5).
Based on normal Q-Q plots, three data points in each group (n = 8/group) were excluded. BMR showed a trend (p = 0.050) of an increase of 211–250 kcal/day following TRT+RT (B1: 1443 ± 231, B2: 1481.5 ± 270.5, PI: 1693 ± 236 kcal/day) with no changes in the TRT group (B1: 1518.5 ± 311.0; B2: 1491 ± 177; PI: 1502 ± 327 kcal/day). Moreover, there was a difference (p = 0.037) between the TRT+RT and TRT groups.
There was negative relationship (r = -0.65, p = 0.002) between BMR and IMF CSA (n = 20) but not with muscle CSAs at B2. For PI, whole thigh muscle (r = 0.54, p = 0.01), absolute muscle (r = 0.67, p = 0.001), and knee extensor (r = 0.61, p = 0.004) CSAs were positively related to BMR (n = 20).
Carbohydrate metabolism.
Si [TRT+RT: 0.8 ± 0.2 to 0.8 ± 0.4 min−1(μU/mL)−1 and TRT: 1.1 ± 0.5 to 1.1 ± 0.7 min−1(μU/mL)−1; p = 0.9] did not change following either intervention. There was a trend (p = 0.07) of improvement in Sg following both TRT+RT (n = 9; B2: 0.019 ± 0.009 to PI: 0.025 ± 0.012 min−1) and TRT (n = 10; B2: 0.021 ± 0.009 to PI: 0.027 ± 0.015 min−1).
Whole thigh muscle CSA (FG: r = -0.48, p = 0.03 and FI: r = -0.65, p = 0.002) and absolute muscle CSA (FG: r = -0.57, p = 0.01 and FI: r = -0.65, p = 0.002) were negatively related to fasting plasma glucose (FG) and fasting plasma insulin (FI) at B2 (n = 20).
Lipid metabolism and inflammatory biomarkers
Neither intervention appeared to influence any parameters of the lipid panel, CRP, TNF-α, or FFA. IL-6 decreased (p = 0.039) in TRT+RT (n = 8; B1: 5.7 ± 8; B2:5.5 ± 5.6 to PI: 2.9 ± 5.4 pg/mL) and TRT (n = 10; B1: 6.0 ± 7.5; B2:5.9 ± 6.0 to PI: 3.9 ± 4.4 pg/mL) groups. TNF-α (r = 0.50, p = 0.025) and IL-6 (r = 0.62, p = 0.02) were positively related to %IMF-B2.
Growth factors
IGF-1 showed a significant decrease (p = 0.008) in both the TRT+RT (n = 11; B2: 169.5 ± 96.5 to PI: 101.5 ± 28.0 ng/mL) and TRT-only (n = 11; B2: 136 ± 74 to PI: 99 ± 36 ng/mL) groups. IGFBP-3 increased significantly (p = 0.0001) in both TRT+RT (n = 11; B2: 1764 ± 665 to PI: 2548.5 ± 853.0 ng/mL) and TRT (n = 11; B2: 1918.5 ± 587.0 to PI: 2778 ± 967 ng/mL).
Adiponectin
A significant interaction was noted in the circulating adiponectin between TRT+RT (n = 8) and TRT (n = 10) groups for both absolute (p = 0.024) and adjusted (adiponectin adjusted to body weight: p = 0.022 and adiponectin adjusted to LM: p = 0.036; Table 2).
Discussion
The primary body composition changes were increases in BMI (∼1.6 kg/m2) and supine thigh circumference (6%) after TRT+RT, but not TRT. Total body and legs LM increased by 2.7 and 1.85 kg in the TRT+RT group compared with only 0.6 and 0.4 kg in the TRT group. There was a noticeable decrease in %FM (total body and leg) by 1.3% and 2.1% following TRT+RT with no change after TRT, but not in absolute total or regional FM. Whole thigh and absolute (i.e., no IMF) skeletal muscle CSA increased by 17–21% and 22–29.5% in the TRT+RT with no changes in the TRT group. Whole and absolute knee extensor muscle CSA increased by 28–34% and 31–43% in the TRT+RT group with no change in the TRT group. In the upper third of the thigh, absolute IMF decreased by 24–26.5% following TRT+RT. Both TRT+RT (-14%) and TRT (-7%) showed modest effects on VAT CSA, especially in the regions of the kidneys to umbilicus and iliac crests to the umbilicus. The most intriguing metabolic finding was a meaningful trend of increased BMR by 211–250 kcal/day following TRT+RT with no change in the TRT group. There was also a trend of improvement in glucose effectiveness (Sg) following both interventions. Surprisingly, IGF-1 and IGFBP-3 showed a reciprocal pattern of decreases and increases, respectively, in both groups. Finally, IL-6 decreased in both groups with no changes in CRP, TNF-α and FFA. Adiponectin decreased following TRT+RT but not following TRT only.
In the TRT+RT group, 73% had low serum T levels at B1 (243–316 ng/dL) and B2 (215–313 ng/dL) and 64% had low T levels in the TRT-only group at B1 (125–402 ng/dL) and B2 (140–402 ng/dL). Recently, SCI persons with low serum T levels (< 400 ng/dL) were reported to have greater total body %FM, trunk %FM and 72% more VAT than those with normal T levels (T > 555 ng/dL). 40 One participant in the TRT+RT and two in the TRT-only group had a circulating T-level greater than 600 ng/dL; however, the group %FM ranged from 14–45% and 20.0–46.5%, respectively. This may suggest the normal T level does not necessarily reflect greater deposition of %FM, especially in the legs, in men with chronic SCI. Previously, TRT was administered to eugonadal men to increase muscle mass. Ten weeks of intramuscular injections (600 mg) of testosterone enanthate plus exercise showed a 6-kg increase in fat-free mass in healthy eugonadal men. 41 Further, weekly intramuscular injection of 200 mg of TRT in conjunction with RT was shown to increase muscle CSA and LM in 54 eugonadal men with AIDS muscle wasting. 42
Following 16 weeks of daily TRT by patch, there was a 27% nonsignificant increase in the serum T level above the baseline level in TRT+RT group only but not in the TRT-only. Bauman and colleagues showed that 5–10 mg/day of TRT for 12 months resulted in an increase in the serum T level from 251 to 504 ng/dL in hypogonadal men with SCI. 21 Low-dose TRT (2–6 mg/day), compared with 5–10 mg, may have suppressed endogenous production and failed to increase circulating T-level. Moreover, our baseline T level was greater than 400 ng/dL compared with the 251 ng/dL in hypogonadal men, but ∼33% lower than the control group (530 ng/dL) reported in the same study. 21 This may have limited the ability of TRT to increase the serum T level over a short period. A recent mini-review reported that a dose of 6–8 mg/day of topical TRT is necessary to increase LM and decrease FM; which may be sufficient to increase the T level. 19 According to the Endocrine Society Guidelines, it is recommended to measure free T concentration in men who have a condition that alters sex hormone–binding globulin. 43 Bauman and colleagues noted that the concentration of SHBG was elevated in 51% of the subjects, and the serum albumin level was normal in only 70% of the subjects. 44 Free T showed a similar decline to serum T level 4 days after removal of the patches. For most clinical trials, total T is measured, but free T may provide further insights and a more complete assessment of testosterone profile in men with SCI.
TRT and RT on muscle size and IMF
Dudley and colleagues reported that 8 weeks of training can restore knee extensor CSA to 75% of its original size in persons with acute SCI. 45 Two additional studies demonstrated that 12–16 weeks of the same training protocol may evoke a 30–35% increase in muscle CSA. 4,6 A previous trial showed that 12 weeks of NMES-RT elicited muscle hypertrophy and decreased IMF after SCI.2 After accounting for IMF, we noted ∼44% hypertrophy of the trained knee extensors that was accompanied by increases in muscle CSAs of both adductors and knee flexors in the TRT+RT group. This has been clinically translated into a 3-cm increase in thigh circumference and supports our ongoing effort to provide clinicians with valid equations that can accurately evaluate muscle CSA in men with chronic SCI. 33
The TRT+RT group demonstrated an increase of almost 20 cm2 for whole thigh and absolute muscle CSA. TRT may slow the loss in muscle mass via increasing nitrogen retention and the number of muscle satellite cells. 46 Similar to our previous report, 2 we noted a non-remarkable decrease in both absolute and percentage IMF in the TRT+RT group compared with TRT only. Participants enrolled in the current study were younger compared with our initial report with smaller percentage of IMF. Ryan and colleagues noted that %IMF did not change following 16 weeks of NMES-RT. 6 To account for the wide range of variability in IMF CSA, we have to consider the delta changes between PI and B2; this provides a permissible statistical tool to accurately evaluate the effects of interventions on this depot of ectopic adipose tissue. Our results support the association between IMF, impaired glucose tolerance and TNF-α; highlighting the significance of reducing IMF after SCI. Further, 16 weeks of either intervention obliterated the existing relationships among IMF, impaired glucose tolerance, TNF-α, and IL-6 noted at B2.
TRT and RT on body composition and visceral adiposity
The effects of topical TRT on the changes in LM have been summarized. 19 Compared with placebo, transdermal TRT (patches or gel) resulted in gain in lean mass from 0.7–3.5 kg. 19 Changes observed in %FM (Table 3) were primarily due to the increase in lean mass and not due to the decrease in absolute total or regional FM. Bauman and colleagues noted that following a 1-year intervention of using transdermal patches (5–10 mg), LM increased by 3.5 kg compared with a loss of −1.4 kg in the control group. 21 In the TRT+RT versus TRT groups, there were increases in LM of 0.65 versus 0.3, 1.85 versus 0.4, 0.9 versus 0.5, and 2.7 versus 1.2 kg for arms, legs, trunk, and total, respectively. In the TRT group, there was a modest effect on LM, which is divergent from previous findings. A possible explanation is that participants in Bauman and colleagues' study 21 were absolutely hypogonadal (T < 300 ng/dL) and by contrast, close to 70% of the participants had low serum T levels at the beginning of the study. Another explanation is the short intervention (16 weeks) and conservative physiological dose (2–6 mg/day). Adding RT to TRT resulted in a 1.3 kg greater increase in leg lean mass compared with a previous 1-year study intervention. 21
TRT in both groups led to a modest 7–14% decrease in VAT CSA with a more decrease in the TRT+RT group; suggesting a lipolytic effect of this depot of adipose tissue. Kjaer and colleagues noted diminished lipolysis in persons with SCI during 30 min of FES-cycling compared with healthy controls. 47 Persons with SCI have 58% greater VAT than able-bodied controls and VAT associated with impaired glucose tolerance, insulin resistance, dyslipidemia, and cardiovascular diseases after SCI. 15,16,32,34 VAT secretes pro-inflammatory cytokines, including IL-6 and TNF-α as well as stimulating hepatic production of CRP. 15,16,48 Twelve weeks of NMES+RT with weekly dietary feedback resulted in a 25% decrease in VAT CSA compared with dietary feedback only. 2 TRT replacement studies have demonstrated improvement in insulin and a decrease in VAT CSA. Compared with aerobic training, 49,50 the effect of RT on VAT is controversial, with the majority of the studies noting decreases in VAT CSA following 12–16 weeks. 49 A recent study demonstrated a decrease in VAT CSA, with increases in the level of physical activity in persons with SCI. 51
TRT and RT on BMR and metabolic health
TRT+RT increased BMR by 211–250 kcal/day after considering outliers with no changes in the TRT group. Despite the marginal statistical significance, our findings are considered of clinical relevance because the standard error of estimates of repeated measurements using B1 and B2 data did not exceed 45 kcal/day (data not shown). A rise above this level of 211–250 kcal/day highlights the importance of TRT+RT in improving BMR. Persons with SCI have 12–27% depressed BMR compared with able-bodied controls even after adjustment for fat-free mass. 52 BMR rate may range from 1100–1500 kcal/day after SCI 53 and another study noted an increase in BMR of 112 kcal/day following 1 year of TRT in persons with SCI. 21 The 15% increase in BMR following TRT+RT is of clinical significance in combating obesity and impaired glucose tolerance in SCI.
Unlike surface NMES-RT, upper extremity exercise interventions may cause a minimal increase in energy expenditure and are less likely to benefit other cardio-metabolic biomarkers. A previous appraisal of exercise intensity suggested that approximately 448 min/week of moderate intensity exercise was needed to increase energy expenditure by 2000 kcal/week for weight loss purposes. 54 This is not a feasible strategy for persons with tetraplegia (> ∼55% of SCI population) as well as for paraplegic persons, considering the environmental and physical barriers after SCI. The current findings may provide a successful strategy to increase energy expenditure up to 1477–1750 kcal/week, which is 74 to 87.5% of what has been recommended to lose weight. 54
The results do not support improvement in Si or HBA1c. The sample consisted of healthy young participants with SCI who were not diabetic and the administration period of TRT was only 16 weeks. The effects of RT and TRT on Sg and Si are controversial; previous works have shown varying results. 55,56 RT showed improvement in Si without improvement in Sg following 2 years of training in athletes compared with healthy controls and obese. 55 Another study showed a trend of improvement in Si following 16 weeks of RT in elderly individuals. 56 Both groups demonstrated a trend of improvement (28.5–31.5%) in Sg following administration of TRT, suggesting that low dose TRT may be beneficial in improving Sg independent of RT. Previously, we noted a 32% decrease in glucose area under the curve adjusted to muscle CSA with improvement in circulating insulin following 12 weeks of NMES-RT. 2
Mahoney and colleagues noted a trend of improvement in oral glucose tolerance challenge following 12 weeks of NMES-RT. 4 Ryan and colleagues failed to show changes in plasma glucose following 16 weeks of NMES-RT. 6 Eight weeks of FES-cycling improved both plasma glucose and plasma insulin concentrations following oral glucose tolerance challenges. 5 We have performed Sg and Si at 4 days after discontinuing TRT or RT-TRT to avoid any acute effects of the last bout of exercise and to examine whether muscle hypertrophy increased the clearance of the circulating glucose. Possibly, insulin independent improvement in glucose uptake in response to training may have happened earlier before the 4-day window. Improvement in Sg may be accompanied with increase in glucose transporter type 4 concentration that was previously noted following 16 weeks of FES training in persons with SCI. 57
Changes in body composition after SCI may be further exacerbated by reduced anabolic hormones including T, growth hormone, and IGF-1. 17,19,21,40 Both groups demonstrated significant increases in IGFBP-3 following TRT but not in circulating IGF-1. Others have noted a similar decrease in IGF-1 following 12 weeks of RT in renal patients and a decrease in IGF-1 following 15 weeks with no changes in IGFBP. 58,59 One study noted a 20% increase in IGF-1 following 13 weeks of RT but no further increase between Weeks 13 and 25. 60 Six months of RT resulted in no changes in IGF-1 or IGFBP-3 in 62 men and women. 61 In contrast, 12 weeks of NMES-RT resulted in a 35% increase in the circulating IGF-1 associated with a decrease in VAT in persons with SCI. 2 TRT increases IGF-1 and IGFBP-3 in able-bodied men. 62,63 The sudden decrease in the circulating T-level following cessation of TRT may be responsible for the decrease in the circulating IGF-1. Consistent with this interpretation, cell culture studies have shown that androgens directly upregulate expression of the IGF-1 gene in a variety of cells 64 and conversely, reduced androgen expression would be predicted to decrease IGF-1 expression. Alternatively, greater adipose tissue in persons with SCI may have resulted in enhanced aromatization of testosterone to estradiol, which could in turn lead to decreased IGF-1 and increased IGFBP-3. 65 Future studies may consider examining the effects of TRT with aromatase inhibitors on circulating IGF-1, body composition and metabolic parameters.
Persons with SCI may have higher levels of adiponectin, suggested as a result of autonomic dysfunction. 37,66 However, another potential explanation is that low levels of circulating testosterone may be responsible for higher adiponectin levels after SCI. 62 In the current trial, a significant interaction in serum adiponectin levels was noted between TRT+RT and TRT groups. In the rat model, administering supraphysiological doses of TRT suppressed circulating adiponectin levels, whereas administering lower doses partially increased adiponectin to its baseline. 67 TRT+RT increased endogenous T-levels in Weeks 4, 12, and 16 compared with baseline. It is possible to assume that the combined effects of TRT+RT led to greater increases in serum T levels that then suppressed circulating adiponectin. TRT only did not increase the circulating T level to a threshold necessary to suppress adiponectin.
Limitations
Age of the subjects was limited to 50 years old because of reports of possible cardiovascular risk consequences of TRT. 68 –70 Moreover, we only studied men with motor complete SCI (AIS A or B) to ensure a homogenous sample. No women were included because TRT may lead to virilization. We found a decrease-in serum T levels 4 days following cessation of TRT, which may have affected some hormonal and metabolic parameters. In PI, participants were tested completely without TRT patches to mimic B1 and B2 and to avoid any possible acute effects that may result from using TRT. The decrease in serum T levels occurred rapidly: less than 24 h after cessation of the last TRT patch. In addition, the use of TRT patches resulted in temporarily reduction in endogenous production of testosterone, which gradually rebounded to baseline levels within the following 16 weeks (data not shown).
Another limitation is the lack of a placebo control group as well as an NMES-RT–only group. Failure to include a TRT placebo control group may have limited the ability to demonstrate that TRT may attenuate the loss in LM after SCI. By including B1 and B2, each participant served as his own control and allowed a period of stabilization of body weight and dietary habits. MRI and some other metabolic variables (albumin, SHBG, IGF-1, IGFBP-3, adiponectin) were not captured at B1, because of limited resources and budgetary constraints.
We also did not measure luteinizing hormone (LH) and follicular stimulating hormone (FSH). Sullivan and colleagues 71 measured LH and FSH in 58 men with chronic motor complete SCI. They noted a decline in LH in those with T levels less than 300 ng/dL but no changes in FSH, suggesting partial central suppression of the hypothalamic-pituitary-gonadal axis. 72
The study was primarily powered based on the effects of NMES-RT on muscle size, which may explain the lack of statistical significance or barely achieving trends on the metabolic outcome variables. Despite the effort to enroll a homogenous sample of healthy motor complete SCI, there were no clear cut-off points that may distinguish those who at risk of developing cardio-metabolic risk factors. Anthropometric cut-off points were recently developed that can be simply applied to those who are likely to be at high risks. 34 Using these cut-offs may benefit future studies by creating additional homogeneity to the study sample and reduce the need for large sample size. We did not measure prostate serum antigen similar to other studies because we have administered an optimum low physiological dose for a short duration. 19,21
Conclusions
The current study provides insights on the effects of TRT+RT versus TRT on body composition and metabolic outcomes in persons with motor complete SCI. TRT+RT is an effective rehabilitation approach in restoration of LM and muscle size following SCI. The addition of low-dose TRT at 2–6 mg/day modestly contributed to mobilization and reduction in VAT following SCI. The robust increase in LM in the TRT+RT group was associated with an increase in BMR that may inform the approach to combat obesity and other comorbidities. Both groups demonstrated modest improvements in Sg and IL-6; highlighting possible systemic cardiovascular benefits to the use of TRT with and without RT after SCI. The low TRT dose may mediate modest effects on VAT, Sg, IGFBP-3, and IL-6, independent of changes in LM, suggesting that TRT may help those who cannot utilize surface NMES after SCI. TRT and RT helped to nonsignificantly increase circulating T levels above baseline in Weeks 12 and 16, which may lead to suppression of adiponectin. Together with the decrease in IL-6, this may be considered a successful approach to attenuate the low-grade inflammation state following SCI. Future studies should consider greater TRT doses and possibly aromatase inhibitors to further restore LM after SCI.
Footnotes
Acknowledgments
We would like to thank R. Chase Wade, Laura O'Brien, Sakita Sistrun, and Liron Segal for help in data capturing and analysis. We thank the study participants for their time and effort. We would also like to thank Hunter Holmes McGuire Research Institute and Spinal Cord Injury Services and Disorders for providing the environment to conduct clinical human research trials. We appreciate the VAMC Radiology Service for using the magnet for research purposes and the VCU Clinical Research Service for providing space and staff to perform the blood work procedures. We also wish to thank Dr. William A. Bauman for critical review of and discussion regarding the data.
Funding: The work is supported by the Department of Veteran Affairs, Veteran Health Administration, Rehabilitation Research and Development Service (B7867-W (ASG), B9212-C and B2020-C); the clinical trial registration number for this study was NCT01652040.
Author Disclosure Statement
No competing financial interests exist.