
Abstract
Intracranial pressure (ICP), cerebral perfusion pressure (CPP), and the pressure reactivity index (PRx) have been shown to correlate with outcome after traumatic brain injury (TBI), but their temporal evolution is less studied. Optimal CPP (CPPopt; i.e., the CPP with the lowest [optimal] PRx value) has been proposed as a dynamic, individualized CPP target. Our aim was to map the temporal course of these parameters and their relation to outcome, in particular the extent and impact of CPP insults based both on fixed CPP thresholds and on divergence from CPPopt. Data from 362 TBI patients with ICP-monitoring treated at the neurointensive care unit of Uppsala University Hospital, Uppsala, Sweden, between 2008–2016 were retrospectively analyzed for the temporal course of ICP, mean arterial blood pressure, CPP, PRx, PRx55-15 (a variant of PRx), and CPPopt the first 10 days post-injury. PRx and PRx55-15 showed significantly lower/better values for those with favorable outcome, most pronounced on Days 2 to 5. PRx55-15 gave better separation between the two groups. In the univariate analysis, CPP insults (both fixed and CPPopt-thresholds) were significantly correlated with outcome on these days. Multi-variate logistic regression showed that age, Glasgow Coma Score Motor, pupillary abnormality at admission, CPP > CPPopt, and PRx55-15 were significant independent outcome predictors. PRx was significant when PRx55-15 was excluded. High PRx55-15 and high grade of monitoring time with CPP > CPPopt, but not the traditional fixed CPP thresholds, were strong predictors for worse clinical outcome. The study supports the concept that CPPopt is an important parameter in TBI management.
Introduction
Traumatic brain injury (TBI) causes substantial morbidity and mortality. In Europe, TBI incidence and mortality vary from 47 to 694 individuals per 100,000 and 9 to 28 individuals per 100,000 per year. 1 Neurointensive care (NIC) aims to reduce secondary brain insults by optimizing the cerebral environment. The main clinical targets are to avoid intracranial hypertension and to keep cerebral blood flow (CBF) sufficient for cell metabolism, by control of intracranial pressure (ICP) and cerebral perfusion pressure (CPP). 2,3
Cerebral autoregulation is a mechanism to keep CBF adequate in various physiological situations. Autoregulated pressure reactivity keeps CBF constant within a range of CPPs by changing the diameter of the cerebral blood vessels. The pressure reactivity index (PRx) is based on the correlation between changes in mean arterial blood pressure (MAP) and ICP, where a negative correlation implies intact pressure reactivity (e.g., when an increase in MAP leads to vasoconstriction and a reduction of cerebral blood volume and ICP). It has been shown that PRx may be deranged in TBI and that preserved pressure reactivity is associated with favorable outcome. 4 –7 A variation of PRx, PRx55-15, applies a bandpass filter to the ICP and MAP waveforms so that only the slow waves with periods of 55 sec to 15 sec are analyzed. A previous study found that PRx-55-15 improves the temporal stability of the index and the correlation with patient outcome. 8
Since pressure reactivity varies with CPP, the CPP associated with the best pressure reactivity has been proposed as the optimal CPP (CPPopt), computed individually and continuously for each patient over a moving 4-h window.
9
Deviation from this value has been shown to be associated with increased mortality and morbidity.
10,11
Jaeger and colleagues also showed that brain tissue oxygenation reached a plateau at CPPopt, indicating optimal CBF.
12
However, CPPopt-oriented therapy is not sufficiently validated for routine clinical use, and the international recommendations by the Brain Trauma Foundation (BTF) is a fixed CPP range of 60–70 mm Hg to keep CBF adequately high without causing systemic side effects due to hypertension.
13
Currently, the feasibility and safety of CPPopt as a treatment target is investigated in a multi-center randomized controlled trial (CPPOpt Guided Therapy: Assessment of Target Effectiveness [COGNiTATE];
PRx and CPPopt have previously been described primarily as long-term averages (e.g., over the entire time of monitoring). 4,10 However, Adams and colleagues 14 found that there are temporal PRx patterns that differ significantly for those with favorable and fatal outcome, respectively.
In this study, we aimed to map the temporal daily course of neurophysiological parameters and their relation to outcome for TBI patients, to investigate possibly critical pathophysiological phases and potential therapeutic windows. In particular, we were interested in the impact of CPP insults on outcome, based on divergence from the fixed BTF guidelines, and also based on divergence from CPPopt. We also wanted to identify any differences between PRx and PRx55-15 with regard to outcome prediction over the temporal course.
Methods
Patients
The Department of Neurosurgery at the University Hospital in Uppsala, Sweden, provides neurosurgical care for a central part of Sweden, with a population of approximately 2 million people. Most patients are initially managed at local hospitals according to advanced trauma life support principles, then referred to Uppsala (the most distant hospital 382 km away). 15 Since 2008, all patients with TBI admitted to our NIC unit are included in the Uppsala Traumatic Brain Injury (TBI) register. 16
All TBI patients from the register treated at the NIC unit between 2008 and 2016, who were 16 years or older, who were on a respirator, and who underwent ICP monitoring were included in the study. Those patients that developed total brain infarction were excluded. Demographic data are shown in Table 1.
Demographic Data
Diffuse injury was defined as CT Marshall score diffuse injury I-III and focal injury was defined as diffuse injury IV, evacuated mass lesion and non-evacuated mass lesion. Glasgow Coma Score Motor response (GCS M).
SD, standard deviation; CT, computed tomography.
Treatment protocol
All patients were treated in accordance with a standardized ICP-oriented treatment protocol to avoid secondary insults. 17,18 Treatment goals were ICP ≤20 mm Hg, CPP ≥60 mm Hg, systolic blood pressure >100 mm Hg, central venous pressure 0–5 mm Hg, pO2 > 12 kPa, blood glucose 5–10 mmol/L, electrolytes within normal ranges, normovolemia, and body temperature <38°C.
All unconscious patients (Glasgow Coma Score Motor [GCS M] 1–5) patients were intubated and sedated with propofol infusion (Propofol-LipuroB; Braun Medical, Danderyd, Sweden) and morphine (Morfin Media; Media, Sollentuna, Sweden) for analgesia. The intracranial pressure was monitored. Patients were initially hyperventilated (4.0–4.5 kPa), but normoventilated as soon as ICP was normalized. In stable patients, neurological wake-up tests were repeatedly performed. If present, stress was treated with a β1-antagonist infusion (Seloken; AstraZeneca, Södertälje, Sweden) and repeated injections of an α2-agonist (Catapresan; Boehringer Ingelheim, Stockholm, Sweden).
Intracranial lesions with significant mass effect were surgically evacuated. In situations of increased ICP, despite basic treatment and if no mass lesion was present, cerebrospinal fluid was drained. If ICP still remained elevated, a thiopental infusion was started, and finally, if high ICP was still refractory, a decompressive craniectomy was performed.
Physiological analysis
The ICP and arterial blood pressure (ABP) data were recorded with the Odin software developed at Uppsala University and University of Edinburgh. 19 PRx was calculated as a moving 5-min correlation of 10 sec averages of ICP and MAP as described in detail earlier by Howells and colleagues. 8 Also, PRx55-15 was calculated in a similar way as PRx, but with a bandpass filter limiting the analysis to oscillations with periods from 55 to 15 sec. 8 CPPopt was calculated as the CPP with the lowest PRx the last 4 h, as described by Aries and colleagues. 10
For the purposes of statistical analysis MAP, ICP, CPP, PRx, PRx55-15, and CPPopt were analyzed as daily mean values over the first 10 days from the time of injury.
Secondary insults were analyzed over three time periods: the first day following injury, Days 2 to 5, and Days 6 to 10. The burden of secondary insults was quantified by computing the percentage of good monitoring time (GMT) during which the fixed or dynamic thresholds were exceeded. We used the threshold ICP >20 mm Hg in accordance with our treatment protocol. 17,18 For example, a GMT of 50% would mean that ICP was above 20 mm Hg 50% of the monitored time. We also used the BTF recommendations for CPP thresholds, with GMT analysis of CPP insults defined as CPP <60 mm Hg and CPP > 70 mm Hg, and compared with the recommended range of 60–70 mm Hg. 13 Further, we included blood pressure insults defined as percent of GMT with systolic blood pressure (sBP) <100 mm Hg, in accordance with our treatment protocol and similar to the BTF guidelines. 13 We also analyzed mean MAP in these three phases post-injury.
For dynamic CPP insults, we analyzed two insult thresholds for CPP below and above CPPopt: CPP-CPPopt (ΔCPPopt) < −10 mm Hg and ΔCPPopt >10 mm Hg, and compared with ΔCPPopt ±10 mm Hg. 10
The variability of ICP and MAP were computed for every minute of monitoring as the absolute deviation from a 4-h moving average centered on the minute. Then the variability measures were averaged over the time periods studied.
Outcome
Outcome was assessed at 6 months following injury by specially trained personnel with structured telephone interviews using the Extended Glasgow Outcome Scale (GOS-E). 20, 21 The GOS-E contains eight categories of global outcome, from death (GOS-E 1), vegetative state (GOS-E 2), lower/upper severe disability (GOS-E 3/4), lower/upper moderate recovery (GOS-E 5/6) and lower/upper good recovery (GOS-E 7/8). GOS-E scores of 1 to 4 were considered unfavorable outcome, and 5 to 8 favorable.
Ethics
All procedures performed in the studies involving humans were in accordance with the ethical standards of the institutional and national research committee and with the 1964 Helsinki declaration and its later amendments or comparable ethical standards. Informed consent was obtained by the relatives of all participating patients.
Statistical analysis
Parametric data were presented as the mean ± standard deviation. Statistical significance was calculated by means of Student's t-test and chi-squared analysis. Bivariate logistic regression was used for outcome prediction analysis. The dependent variable was favorable versus unfavorable outcome. In the first bivariate analysis, eight demographic parameters (age, sex, GCS M, pupillary abnormality, CT Marshall score, craniotomy, and thiopental and decompressive craniectomy; Table 1) were included in the regression, as well as 13 neurophysiological parameters computed over Days 2 to 5 following injury (Table 2). In the second analysis, PRx55-15 was excluded to determine if PRx would take place as a significant outcome predictor. The analysis was done with SPSS version 25 (IBM Corp, Armonk, NY). A receiver operating characteristic (ROC) figure was made for the logistic regression model in SPSS. A p value < 0.05 was considered statistically significant.
Neurophysiological Parameters during Three Phases after TBI
The rows labeled (%) show percent of good monitoring time (± SD) satisfying the condition during the specified time periods. The MAP row was calculated as mean (± SD). The PRx55-15 and PRx values are mean coefficients (± SD). The variability parameters are calculated as mean absolute deviation from a 4-h moving average in mm Hg (± SD). ΔCPPopt = CPP-CPPopt.
TBI, traumatic brain injury; CPP, cerebral perfusion pressure; CPPopt, optimal CPP; ICP, intracranial pressure; sBP; systolic blood pressure; MAP, mean arterial pressure; PRx, pressure reactivity index.
Results
Demographic data
There were 362 patients, of which 203 had favorable outcome and 159 unfavorable outcome (Table 1). Those with favorable outcome were significantly younger (42 vs. 53 years; p < 0.00001), had significantly better Glasgow Coma Score Motor response (GCS M) at admission (GCS M 1–2 for 3% vs. 14%; p = 0.00012) and a lower rate of pupillary abnormality (anisocoria, fixed pupil: 12% vs. 31%; p = 0.000015). The favorable outcome group also had a lower rate of focal (CT Marshall score; diffuse injury IV, evacuated mass lesion and non-evacuated mass lesion) as opposed to diffuse brain injury (CT Marshall score diffuse injury I-III; 28% vs. 42% with focal injury; p = 0.005). The trend indicated, but was not significant, that those with unfavorable outcome were more often treated with high-intensity treatment such as craniotomy (51% vs. 42%; p = 0.11), thiopental (13% vs. 9%; p = 0.33) and decompressive craniectomy (16% vs. 10%; p = 0.093).
Temporal course of physiological parameters
Mean ICP remained relatively stable, around 10–15 mm Hg, over the temporal course of the first 10 days after TBI and did not significantly differ on any day for those with favorable and unfavorable outcome (Fig. 1). The daily mean CPP was always above 70 mm Hg and increased slightly during the temporal course (Fig. 2). The temporal pattern of CPP was similar for those with favorable and unfavorable outcome but was significantly lower most days for those with favorable outcome. The temporal MAP curve was similar to the CPP trends. Mean daily MAP increased during the first 10 days and was generally significantly higher for those with unfavorable outcome (Fig. 1).
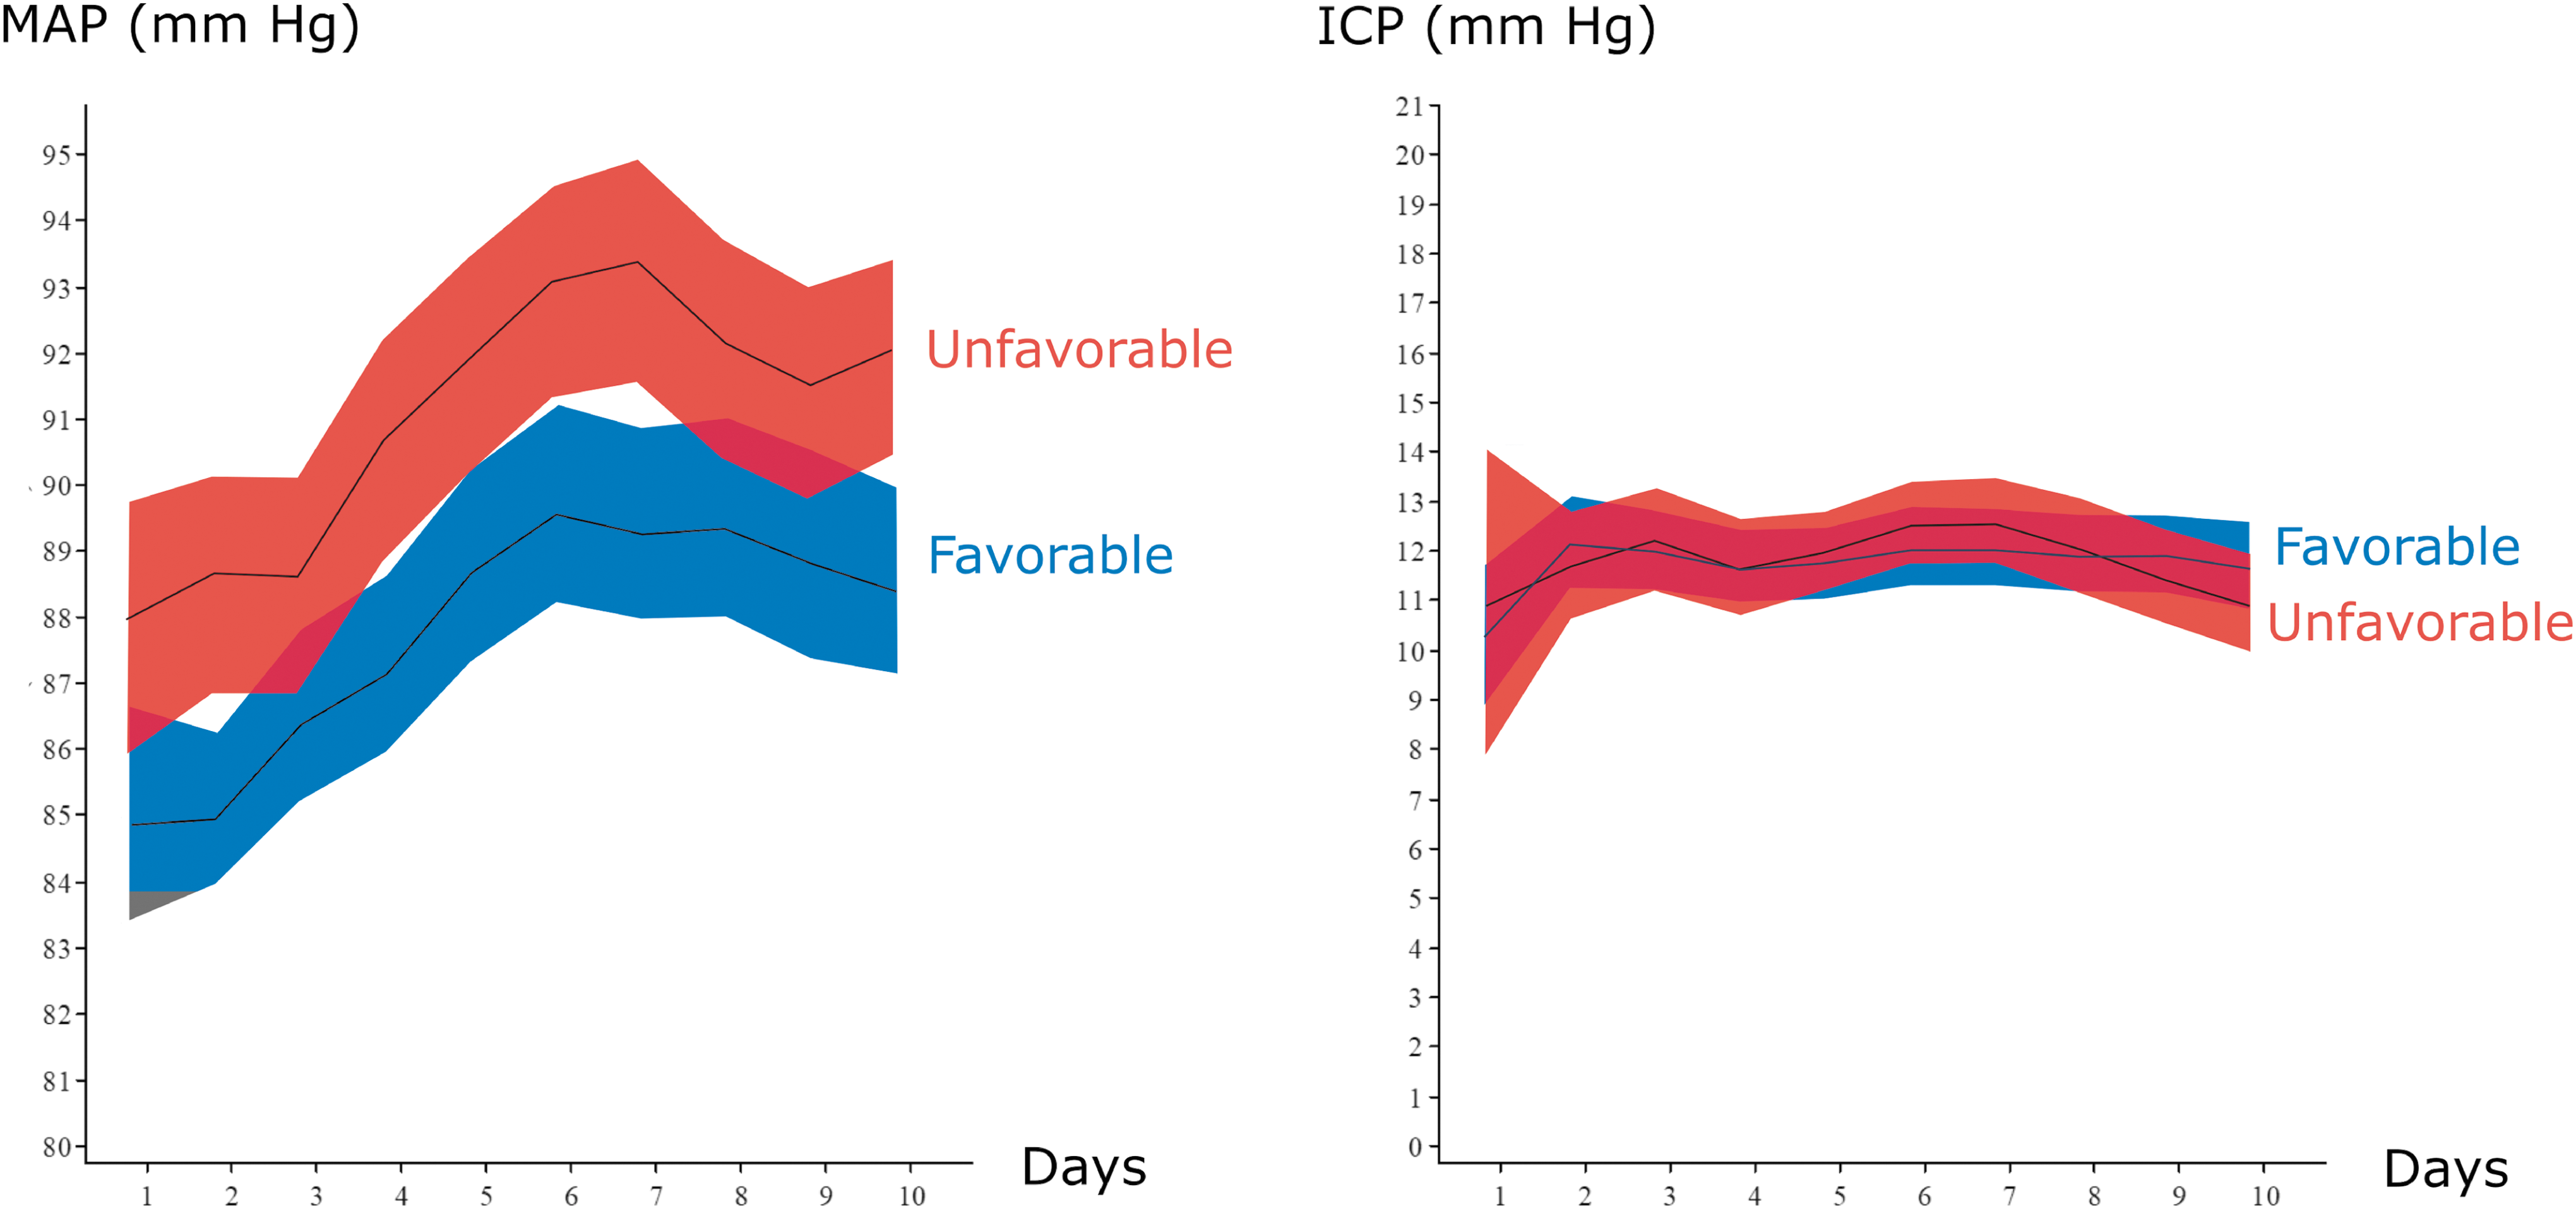
Temporal pattern of mean arterial blood pressure (MAP) and intracranial pressure (ICP)—favorable vs. unfavorable outcome. The graph on the left shows the temporal course of MAP and the graph on the right the temporal course of ICP the first 10 days post-injury. Patients were divided into two groups with favorable (blue) and unfavorable (red) outcome. The lines show mean values and the shaded areas represent the 95% confidence interval. Color image is available online.

Temporal course of cerebral perfusion pressure (CPP) and optimal CPP (CPPopt)—favorable and unfavorable outcome. The graph on the left shows the temporal course of CPP and the graph on the right the temporal course of CPPopt the first 10 days post-injury. Patients were divided into two groups with favorable (blue) and unfavorable (red) outcome. The lines show mean values and the shaded areas represent the 95% confidence interval. Color image is available online.
PRx and PRx55-15 showed initially high values, indicating loss of pressure autoregulation immediately after severe TBI (Fig. 3). Both parameters then decreased on the subsequent days, but to significantly lower levels for those with favorable outcome, indicating better pressure autoregulation recovery in this group. The difference was most significant between Days 2 to 5. After that period, PRx stabilized while PRx55-15 increased slightly for those with favorable outcome.
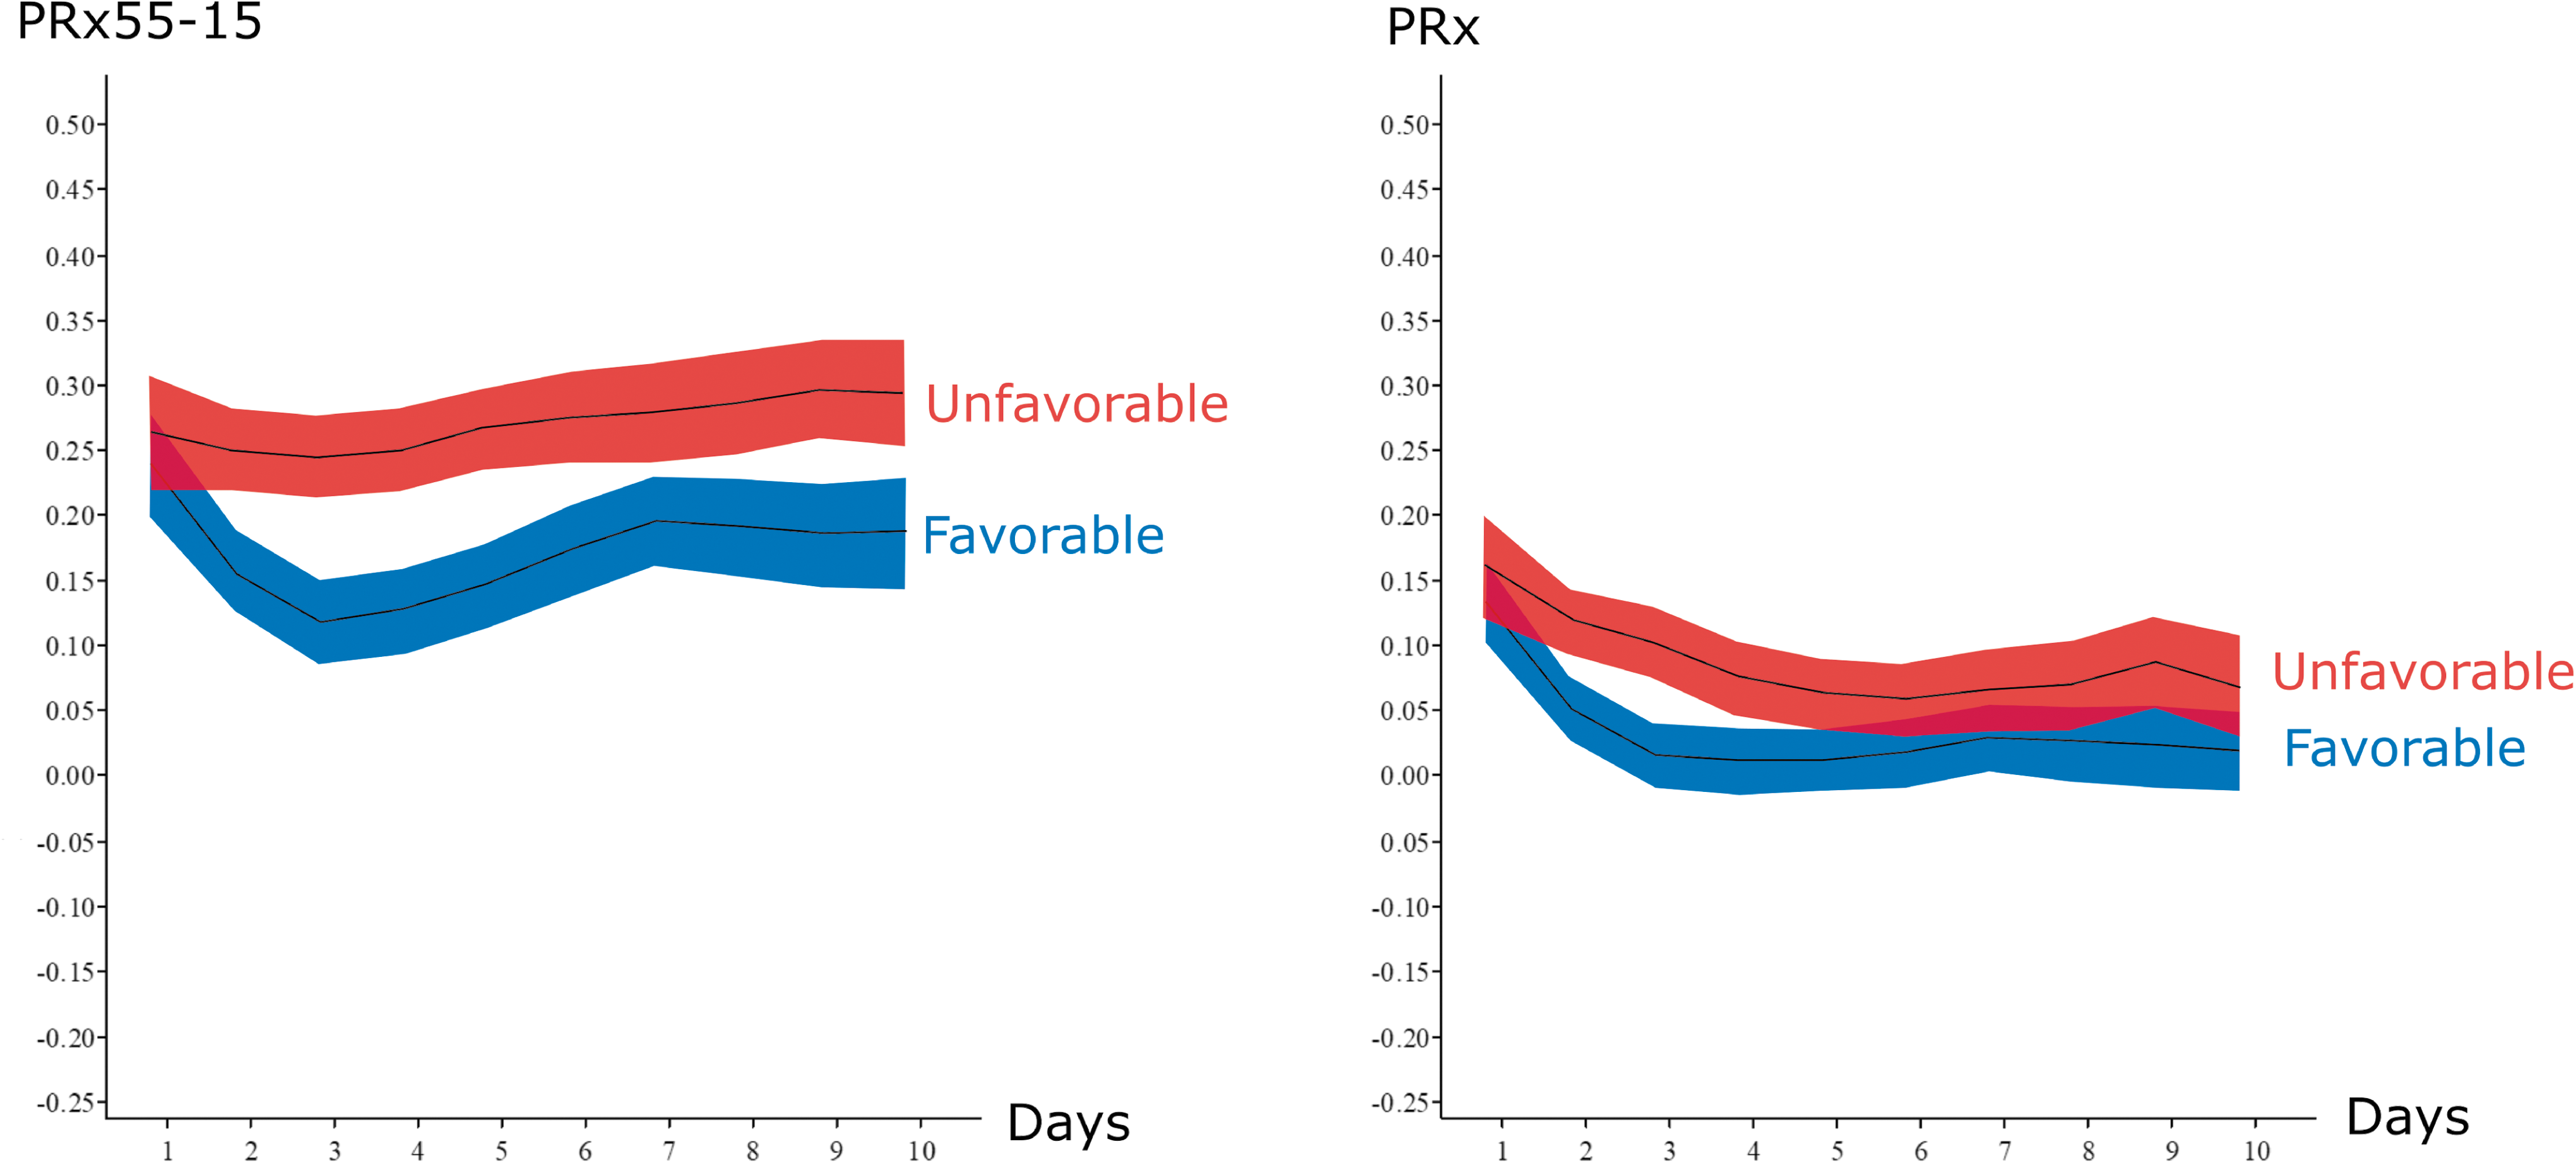
Temporal course of pressure reactivity index (PRx) and PRx55-15—favorable and unfavorable outcome. The graph on the left shows the temporal course of PRx55-15 and the graph on the right shows the temporal course of PRx the first 10 days post-injury. Patients were divided into two groups with favorable (blue) and unfavorable (red) outcome. The lines show mean values and the shaded areas represent the 95% confidence interval. Color image is available online.
CPPopt could be calculated on a daily basis for 84–99% of all patients with ICP and ABP data, depending on the day. The temporal CPPopt curve was similar to the CPP curve (Fig. 2). CPPopt was initially high, decreased on Day 2, then increased again through Day 7. CPPopt was significantly lower for those with favorable outcome for most of the time between Days 2 to 6.
CPPopt over the first 10 days of monitoring was above the BTF upper recommendation at 70 mm Hg during 67% of the time for patients with favorable outcome and 74% for the unfavorable outcome group (p = 0.00012; Fig. 4). Patients with favorable outcome more often had CPPopt below or within the BTF recommendation of 60–70 mm Hg, with GMT (%) CPPopt <60 mm Hg (8 vs. 6%; p = 0.0044) and GMT (%) CPPopt within the BTF's CPP recommendation 60–70 mm Hg (25 vs. 20%; p = 0.00082).
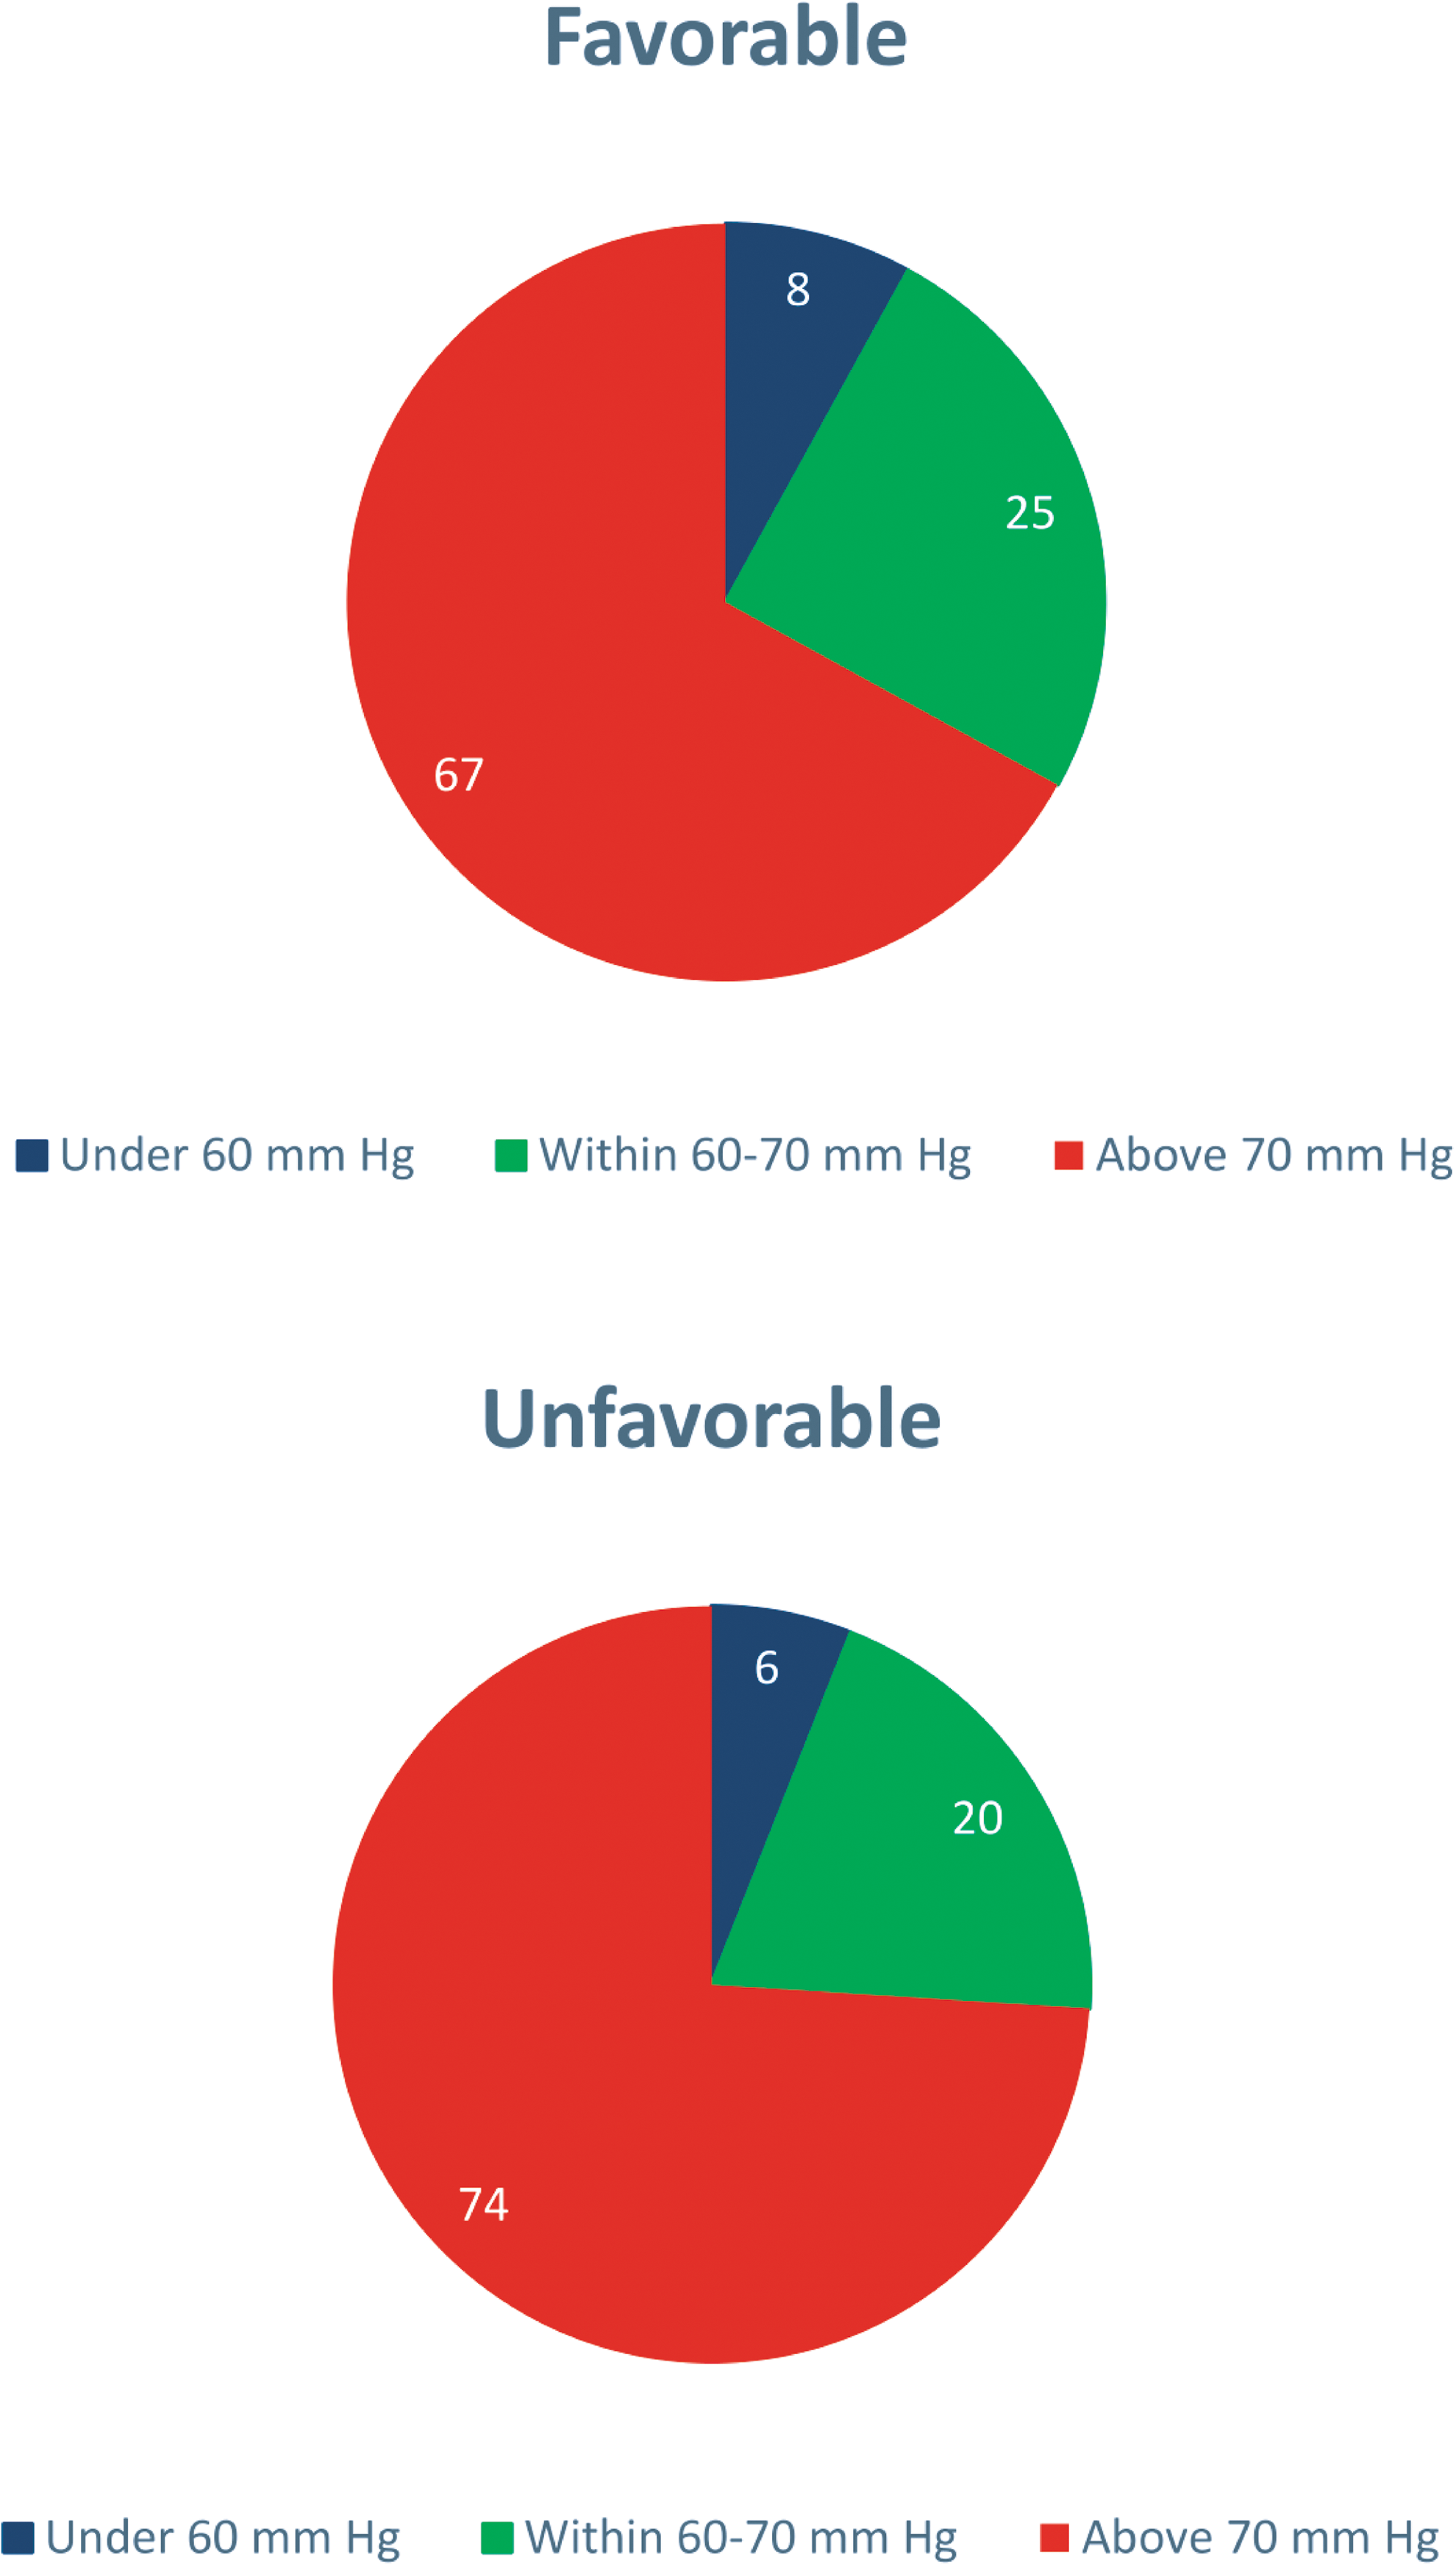
Good monitoring time (GMT) of optimal cerebral perfusion pressure (CPPopt)—favorable and unfavorable outcome. Brain Trauma Foundation recommends a CPP target within the range 60–70 mm Hg after severe TBI. 13 This figure shows the percentage of time of CPPopt below, within, and above 60–70 mm Hg for all the patients the first 10 days post-injury. The differences in GMT CPPopt in each of the three CPP ranges were statistically significant between favorable and unfavorable outcome. Color image is available online.
CPP and ICP insults and PRx55-15 in three phases post-injury
CPP insults based on CPPopt-thresholds showed that those with unfavorable outcome had a significantly higher GMT (%) ΔCPPopt (CPP-CPPopt) >10 mm Hg on Days 2–5 (22% vs. 18%; p = 0.0011) and significantly lower GMT (%) within the optimal interval ΔCPPopt ±10 mm Hg (53% vs. 57%; p = 0.003) Days 2 to 5 (Table 2). On Days 6 to 10, the GMT (%) ΔCPPopt ±10 mm Hg was also significantly lower for those with unfavorable outcome Days 6 to 10 (53% vs. 56%; p = 0.038), but ΔCPPopt >10 mm Hg was no longer significantly correlated with outcome (23% vs. 21%; p = 0.14). There were no correlations between CPP insults in relation to CPPopt-thresholds and outcome on Day 1 and ΔCPPopt < −10 mm Hg had no significant correlation with outcome on any day.
As for the BTF's fixed CPP thresholds, those with favorable outcome had significantly higher GMT (%) with CPP within the BTF's recommended range 60–70 mm Hg and significantly lower GMT (%) CPP >70 mm Hg during all three phases, most pronounced Days 6 to 10. There was no significant difference of GMT (%) CPP <60 mm Hg for those with favorable and unfavorable outcome in any phase. Further, there were no significant differences in ICP insults above 20 mm Hg for those with favorable and unfavorable outcome in any phase.
High PRx55-15 values showed a strong, significant association with unfavorable outcome, most particularly Days 2 to 5 (0.26 vs. 0.14; p < 0.00001), but also Days 6 to 10 (0.29 vs. 0.20; p = 0.00001). However, there was no significant difference in PRx55-15 on Day 1 for those with favorable and unfavorable outcome. PRx showed a similar, but less significant, temporal pattern for those with favorable and unfavorable outcome.
Mean MAP was significantly lower for those with favorable outcome in all three phases, most particularly Day 2 to 5 (86.7 vs. 89,6 mm Hg; p = 0.00071). There was no significant difference in sBP <100 mm Hg insults in any phase for those with favorable and unfavorable outcome.
MAP variability was significantly lower for those with favorable outcome on Day 1 (4.03 vs. 4.73 mm Hg; p = 0.0011) and Days 2 to 5 (4.23 vs. 4.59 mm Hg; p = 0.012), but no significant difference on Days 6 to 10 (4.27 vs. 4.44 mm Hg; p = 0.31). The correlation between GMT (%) ΔCPPopt ± 10 and MAP variability Days 2 to 5 was significantly negative [Spearman (-)0.503; p < 0.0001], indicating that low MAP variability correlated with higher frequency of CPP values close to CPPopt (Fig. 5). ICP variability was significantly higher for those with favorable outcome on Days 2 to 5 (1.89 vs. 1.72 mm Hg; p = 0.0061) and Days 6 to 10 (1.93 vs. 1.75 mm Hg; p = 0.0076), but not significantly on Day 1 (1.86 vs. 1.83 mm Hg; p = 0.80). The correlation between ICP variability and GMT (%) ΔCPPopt ± 10 Days 2 to 5 was not significant [Spearman (-)0.039; p = 0.480].
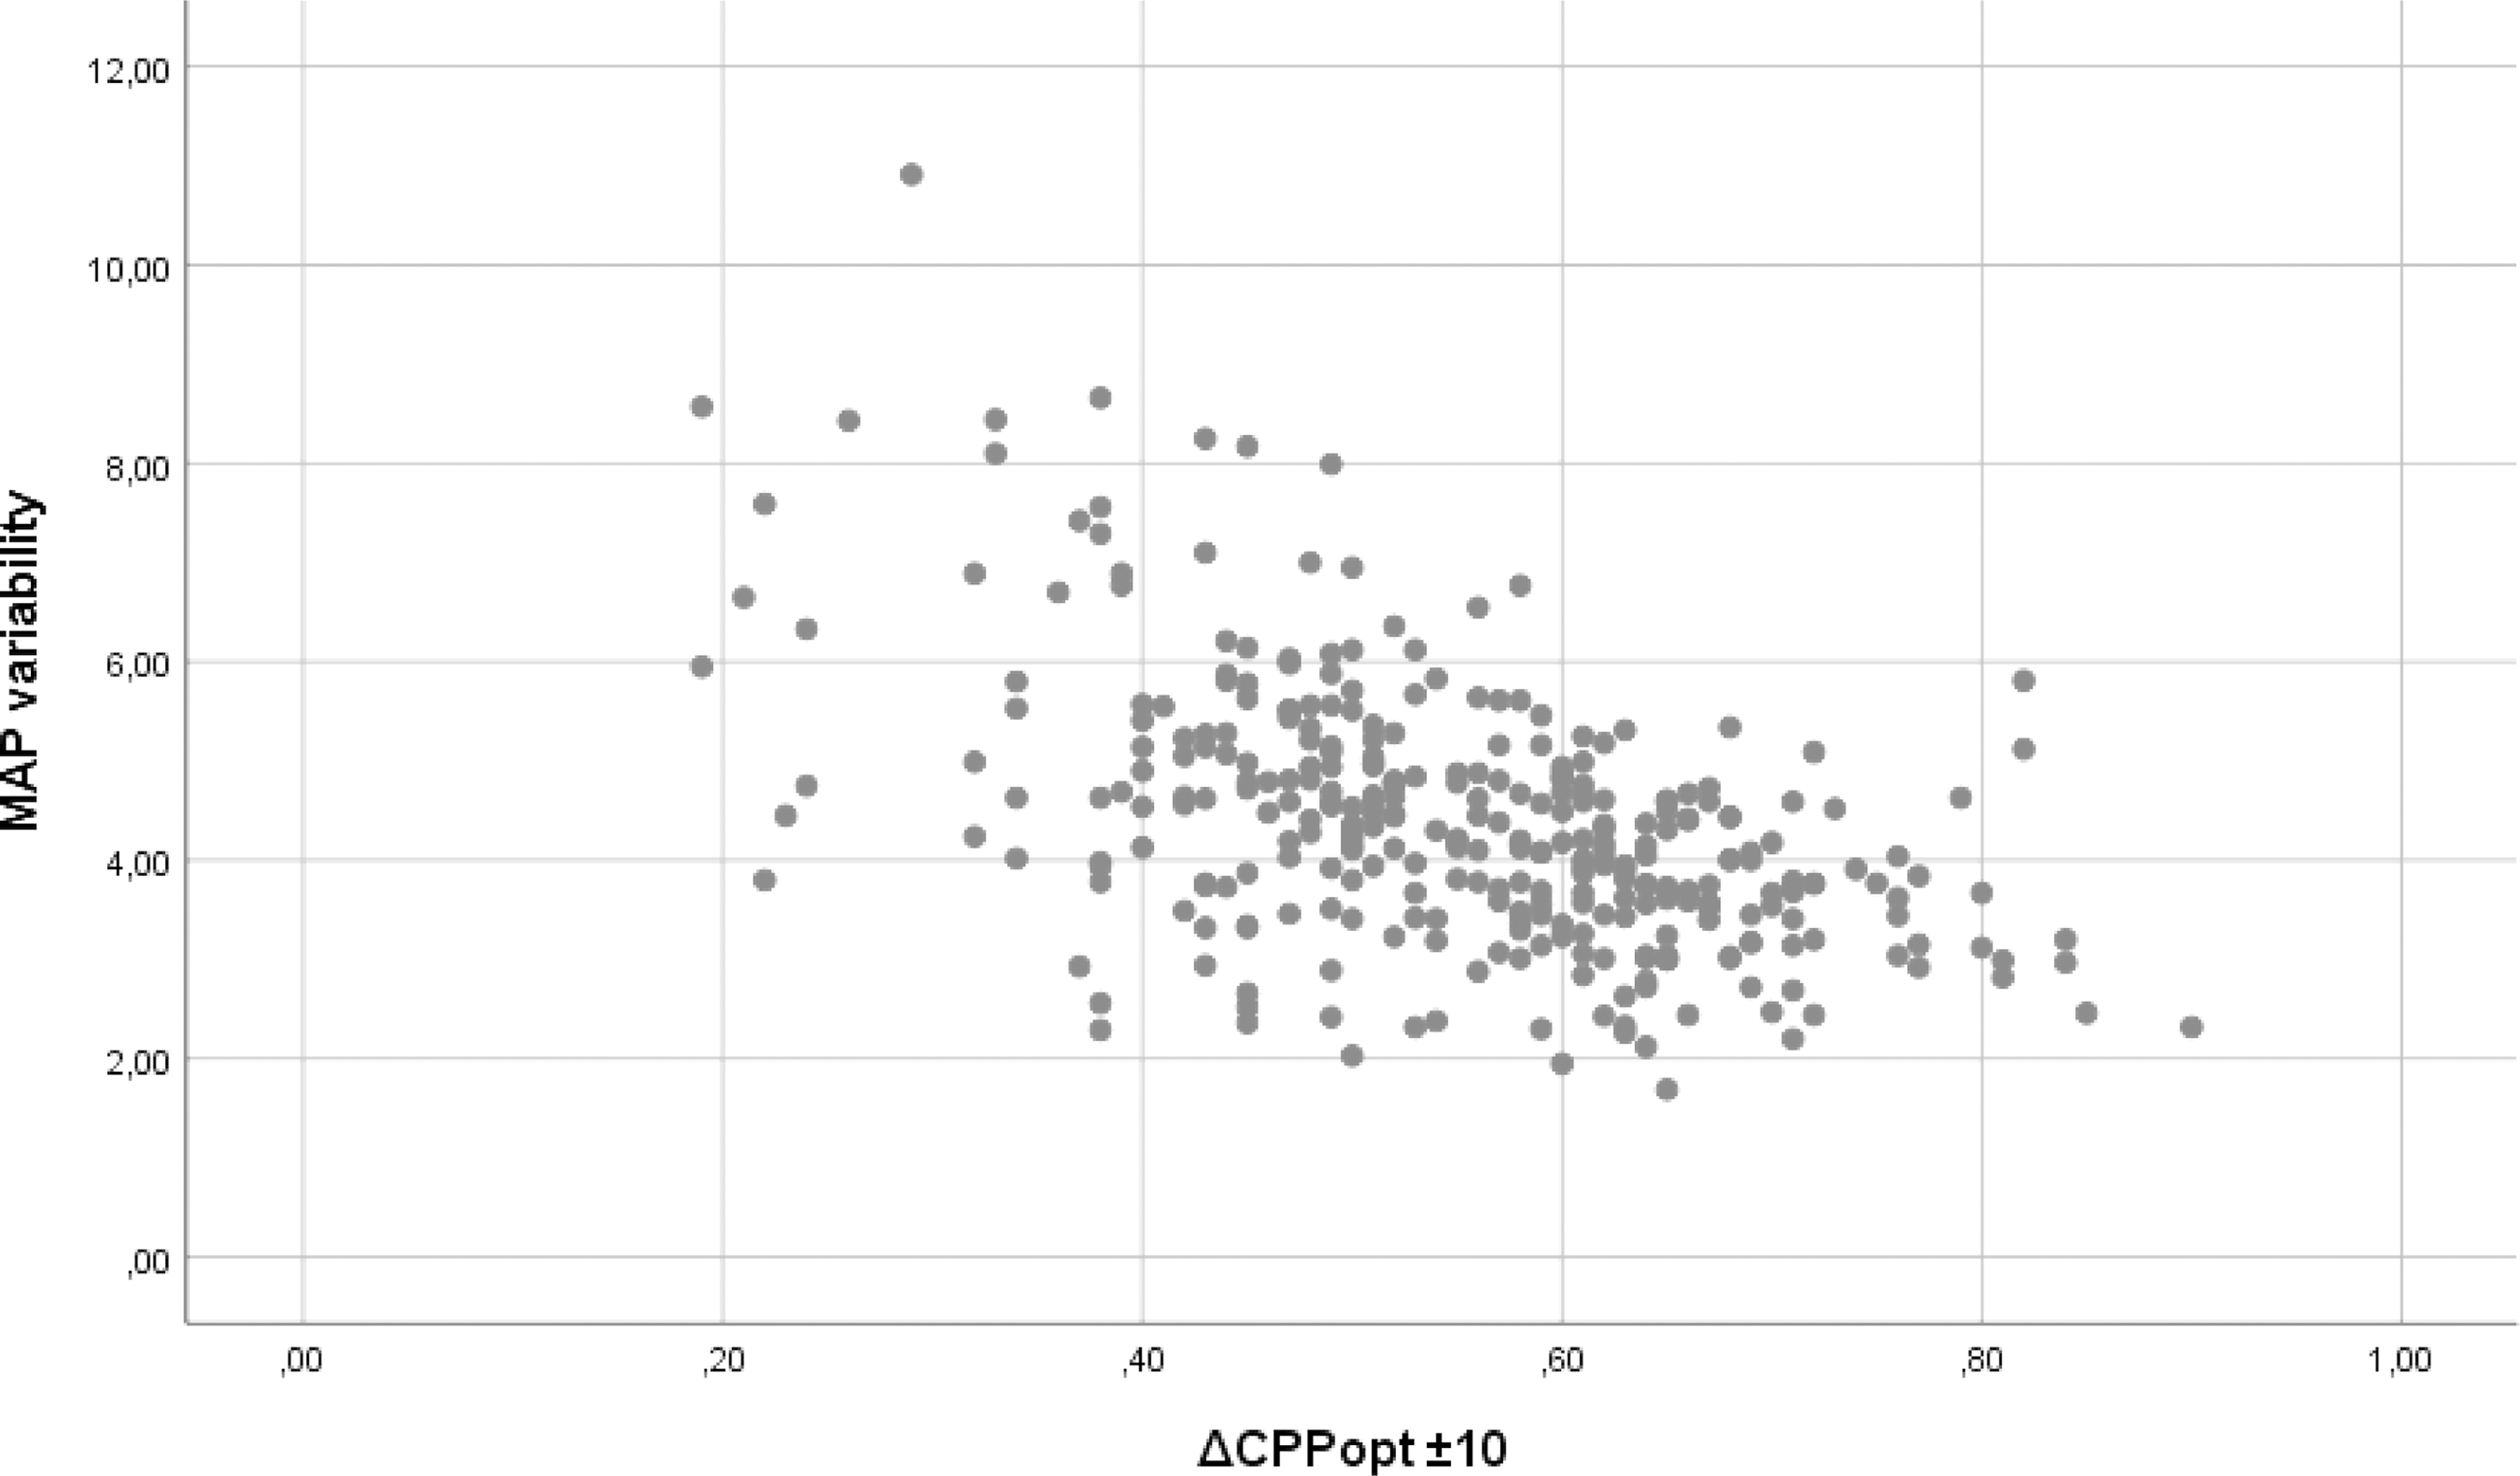
Mean arterial blood pressure (MAP) variability vs. Δ optimal cerebral perfusion pressure (ΔCPPopt) ±10. The figure shows the correlation between MAP variability and good monitoring time (%) ΔCPPopt ±10 Days 2 to 5 post-injury, which was was significantly negative with Spearman correlation (-)0.503, p < 0.0001.
Outcome prediction
All demographic data in Table 1 and selected neurophysiological parameters (GMT (%) CPP <60 mm Hg, GMT (%) CPP within 60–70 mm Hg, GMT (%) CPP >70 mm Hg, GMT (%) ΔCPPopt < −10 mm Hg, GMT (%) ΔCPPopt ±10 mm Hg, GMT (%) ΔCPPopt >10 mm Hg, mean PRx55-15, mean PRx, GMT (%) ICP >20 mm Hg, GMT (%) sBP <100 mm Hg, mean MAP and mean variability in MAP and ICP) for Days 2 to 5 were analyzed in a bivariate logistic regression for unfavorable/favorable outcome. The regression was analyzed with forward and backward selection, which in both cases generated the same significant outcome variables. High age, low GCS M, presence of pupillary abnormality at admission, high PRx55-15, and high GMT of ΔCPPopt >10 mm Hg were all significant predictors for unfavorable outcome (Table 3). The logistic model generated an area under receiver operating characteristic (AUROC) of 0.777 (Fig. 6), indicating good outcome prediction for the model. If PRx55-15 was excluded, but all other variables included from the analysis above, PRx turned out as a significant outcome predictor (Table 3). However, PRx was weaker than PRx55-15 in the former analysis and the AUROC for the regression model was slightly lower at 0.764.
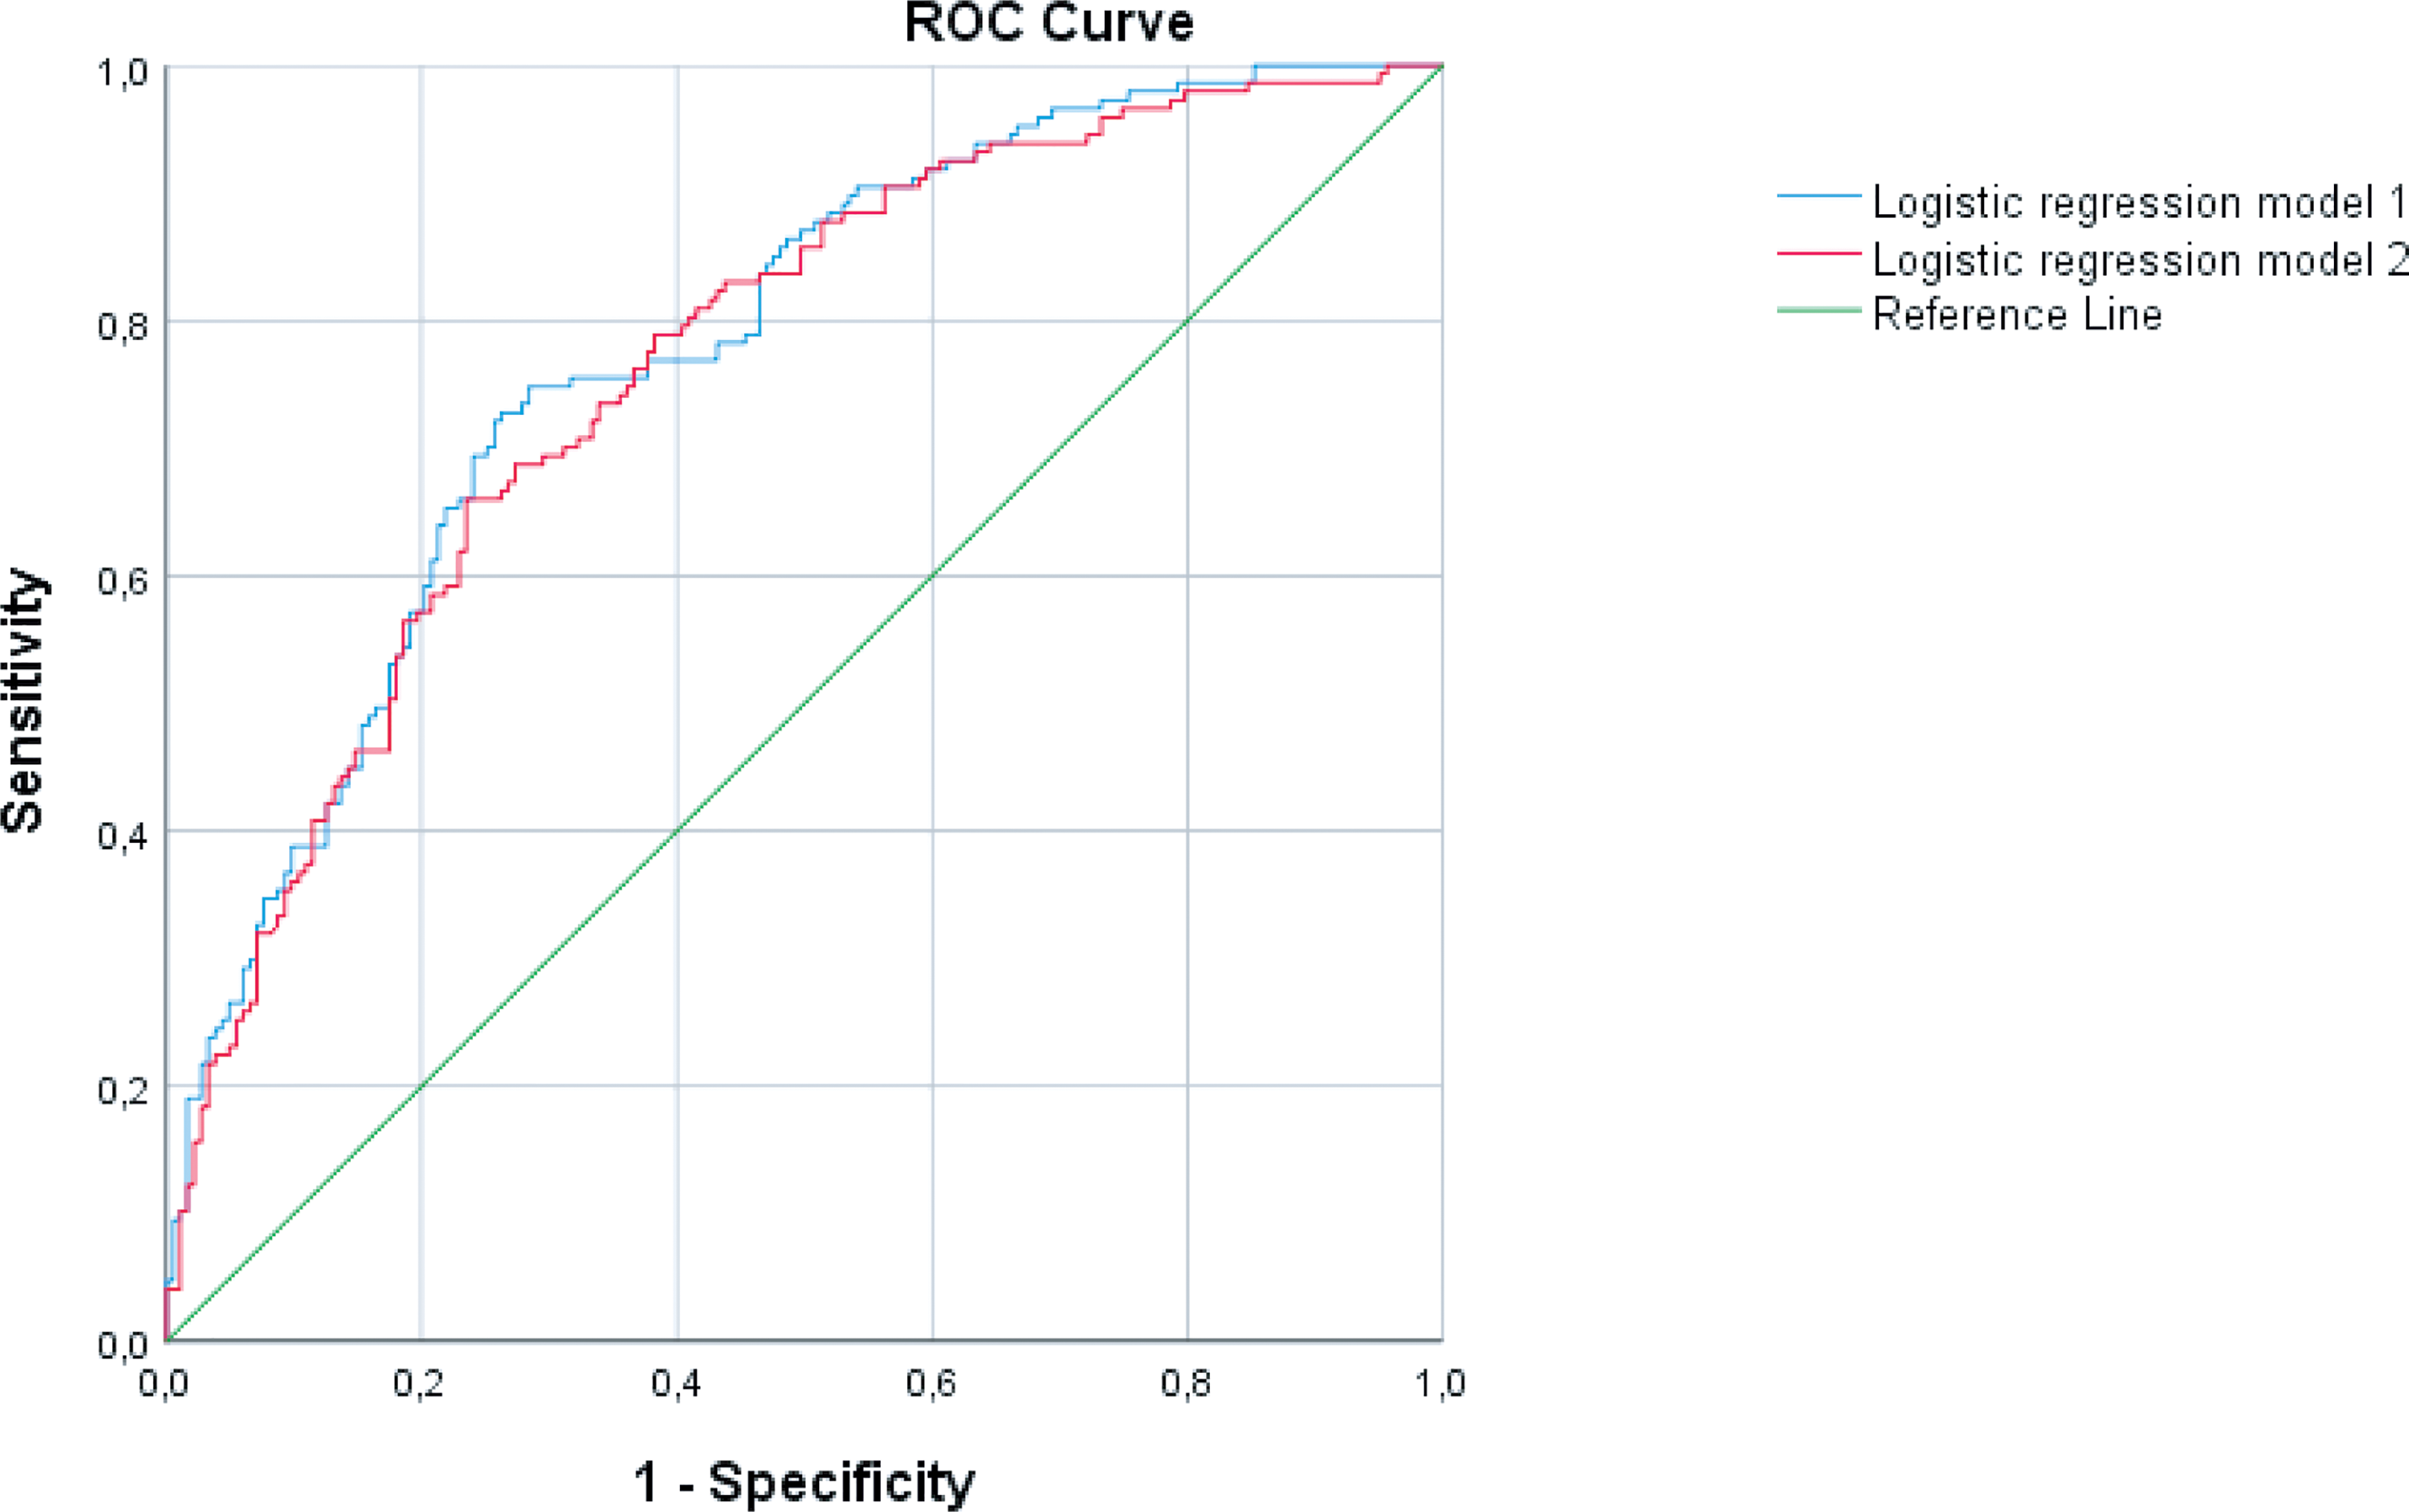
Receiver operating characteristic (ROC) curves for the logistic regression models in Table 3. The logistic regression models in Table 3 produced two ROC curves. The regression model 1 from Table 3, including pressure reactivity index (PRx)55-15 (blue line) had an area under curve at 0.777. The regression model 2 (red line) from Table 3, including PRx instead of PRx55-15, had a slightly lower area under curve at 0.764. Color image is available online.
Multi-variate Logistic Regressions for Outcome Prediction
Regression 1: X2 = 83.761, Nagelkerke = 0.300, area under the receiver operating characteristic (AUROC) = 0.777.
Regression 2: X2 = 72.234, Nagelkerke = 0.263, AUROC = 0.764.
The models predict unfavorable outcome. Model 2 excluded PRx55-15 from the analysis, to determine if PRx would turn out as a significant outcome predictor. Pupillary abnormality was defined as anisocoria or fixed pupil(s). ΔCPPopt = CPP-CPPopt. The time window for the neurophysiological parameters was Days 2 to 5 post-injury.
OR, odds ratio; CI, confidence interval; GCS M, Glasgow Coma Score Motor response; CPP, cerebral perfusion pressure; CPPopt, optimal CPP; PRx, pressure reactivity index.
Further, the five significant variables above (age, GCS M, pupillary status at admission, PRx55-15 and GMT of ΔCPPopt >10 mm Hg) were analyzed in a logistic regression including the decompressive craniectomy (DC) (yes/no) variable. All of the five variables had similar odds ratios and remained significant after DC adjustment.
Discussion
TBI is a heterogenous disease with complex pathophysiology and dynamic temporal course. Mean values of ICP, CPP, and pressure autoregulation as measured with PRx are well-known parameters for outcome prediction, but the day-by-day temporal dynamic is less known. A major finding of our study was a strong temporal association between poor pressure autoregulation and poor outcome, in particular during Days 2–5 post-injury, after initial treatment had stabilized the patient. Despite our ICP-oriented treatment protocol, both CPP and dynamically computed CPPopt were usually above BTF's upper CPP threshold of 70 mm Hg. 13 In addition to age, GCS M and pupillary abnormality, the neurophysiological parameters PRx55-15 values and insults with CPP above CPPopt, rather than BTF's fixed CPP thresholds, had a strong correlation with clinical outcome in the multi-variate logistic regression analysis.
Temporal course of pressure reactivity (PRx and PRx55-15)
PRx-55-15 was used as a variation of PRx that uses a bandpass filter to limit the correlation analysis to oscillations in ICP and MAP with periods of between 55 and 15 seconds. 8 This frequency range was originally determined by adjusting the filter to optimize the correlation of the index with patient outcome (GOS-E). 8
Throughout the temporal course, PRx-55-15 provided better separation between the favorable and unfavorable outcome groups than standard PRx (Fig. 3), and it was also the more significant predictor in the logistic regression model, confirming the results of a previous study. 8 The patterns of the pathophysiological course described by the two indices are quite different. Both show an initial improvement that is more dramatic for the favorable outcome group. From Days 4 to 8, however, PRx-55-15 indicates a steadily worsening status missing in the PRx curves, which instead stabilized around the lower values. The secondary deterioration evident in the PRx55-15 curve may be related to corresponding increases in CPP during the same period (Fig. 2), keeping in mind that in our patients elevated CPP is associated with poor outcome. Based on these results, it appears that the two indices are sensitive to different aspects of cerebral pressure autoregulation, which should be the focus of future work.
Adams and colleagues looked at TBI patients with favorable and fatal outcome (including brain death) and found a similar temporal pattern with high PRx values for all patients on the first day post-injury, but the values remained high for those with fatal outcome, whereas they recovered for those with favorable outcome, in particular from Days 2 to 5. 14 We can also compare the temporal course of PRx/PRx55-15 with CBF studies by Martin and colleagues, who found temporal CBF trends after TBI with hypoperfusion on Day 1, hyperperfusion on Days 2 to 5, and vasospasm on Days 6 to 14. 22 Our PRx55-15 curve showed similarly poor pressure autoregulation on Day 1, a recovery between Days 2 to 4, then a gradual recoil towards poor autoregulation again, which may partly explain the CBF patterns with hyperemia and a later vasospasm period. Although CBF studies in TBI are not easily conducted, especially in the extra sensitive initial phase, it would be interesting to make a more precise correlation of PRx with CBF during these phases.
Temporal course of physiological parameters
We also noticed significant differences between the favorable and unfavorable outcome groups regarding the temporal patterns of MAP, CPP, and CPPopt, but not ICP. In general, patients with unfavorable outcome had higher MAP, CPP, and CPPopt than patients with favorable outcome. For example, in the unfavorable group, mean daily CPP ranged between approximately 75 and 82 mm Hg (Fig. 2), whereas in the favorable group, CPP was still relatively high, but significantly lower (ranging from approximately 72 to 78 mm Hg), compared with the unfavorable group. The findings are in line with earlier studies at our department that showed better outcome with moderately lower CPP values. 18,19,23 Despite the poorer autoregulation in the unfavorable outcome group, we did not see a corresponding effect on ICP variability. This is interesting since young patients tend to have better outcomes, despite the fact that their larger brain volumes and more active cerebral vessels sometimes manifest extreme ICP variability (e.g., plateau waves). Further studies are needed to clarify the exact relationship between pressure autoregulation and ICP variability.
Fixed versus dynamic CPP thresholds
CPP thresholds have been a matter of much debate in the treatment of severe TBI. Some studies have shown benefits in outcome and neurophysiological parameters of a CPP-oriented treatment protocol with a high lower CPP threshold, often at 70 mm Hg, although there is also an increased risk of systemic side effects from hypertension. 3,24 Other studies, for example, based on the Lund Concept have supported the view that low CPP thresholds closer to 50 mm Hg may be well tolerated and lead to better outcome. 18,25 We have previously shown that high CPP thresholds led to better outcome if the patient was pressure active (low PRx), whereas low CPP targets were better if the patient was pressure passive (high PRx). 19 Recently, a continuously dynamic CPP threshold has been suggested, also known as CPPopt, (the CPP with the lowest PRx). 10 Both CPP values below and above CPPopt have been shown to correlate with mortality and morbidity. 10,11 However, it is still unclear whether the dynamic CPPopt or the traditional fixed CPP thresholds lead to better outcome, and the current BTF recommendation is still a fixed CPP range between 60–70 mm Hg. 13
In our univariate analysis, we found an association between both CPP within the BTF's CPP recommendations and ΔCPPopt ±10 mm Hg with favorable outcome. CPP insults defined as GMT (%) with CPP >70 mm Hg, but not CPP <60 mm Hg, were associated with poor outcome. Similarly, CPP insults defined as GMT (%) with ΔCPPopt >10 mm Hg, but not ΔCPPopt < −10 mm Hg, were associated with poor outcome. In the multi-variate logistic regression analysis, only ΔCPPopt >10 mm Hg remained a strong, significant outcome predictor of the CPP thresholds, indicating that CPPopt-oriented thresholds were better at discriminating clinical outcome than BTF's traditional CPP thresholds.
In previous CPPopt studies, univariate analyses have shown poor outcome in patients with CPP values below and above CPPopt. 10,11,26 However, using multi-variate logistic regression, Donnelly and colleagues only found a significant relationship between ΔCPPopt < −10 mm Hg and mortality, but not with unfavorable outcome, whereas the BTF threshold CPP <60 mm Hg was a significant outcome predictor in both cases. 26 CPP above 70 mm Hg and ΔCPPopt >10 mm Hg, respectively, did not improve the outcome prediction. They also showed that CPP values below the lower threshold of reactivity, defined as CPP values below the CPPopt with PRx >0.30, had better outcome prediction for mortality and unfavorable outcome than both ΔCPPopt < −10 mm Hg and CPP <60 mm Hg. CPP values above the upper reactivity threshold did not improve outcome prediction in the regression analysis. Dynamic reactivity thresholds rather than mm Hg-thresholds may better discriminate when it would be safe to deviate from CPPopt to avoid for example systemic hypertension (e.g., when the CPPopt curve is flat, and a change in CPP would not cause PRx to rise to dangerous levels).
In the study by Donnelly and colleagues, the lower pressure reactivity threshold and ΔCPPopt < −10 mm Hg indicating risk of hypoperfusion were more important outcome predictors than the upper thresholds. 26 On the contrary, a ΔCPPopt >10 mm Hg, with the risk of cerebral hyperperfusion and possibly systemic hypertension, was a significant predictor of poor outcome in our study. It is possible that these differences are due to demographic and treatment protocol differences between the centers, as demonstrated in a previous joint study. 27
Blood pressure variability
It previously has been shown that deviation from CPPopt correlated with MAP variability. 27 In the present study, we investigated this relationship to determine if MAP variability rather than deviation from CPPopt could be the primary cause of poor outcome. As in the earlier study, we found a strong, significant correlation between ΔCPPopt ±10 mm Hg and MAP variability. Interestingly, MAP variability was a significant predictor of favorable or unfavorable outcome already in the first day post-injury, but, unlike CPPopt, it was not a significant outcome predictor in the multi-variate regression model. This indicates that divergence from CPPopt rather than unstable blood pressure in itself was the critical factor affecting patient outcome.
Outcome prediction
In addition to the impact of the CPP insults discussed above, the logistic regression analysis showed that the background variables age, GCS M, and pupillary abnormalities at admission were very significant outcome predictors, consistent with the results from the IMPACT studies. 28 Intracranial hypertension has been shown as a predictor for unfavorable outcome in many studies, 29,30 but ICP insults were uncommon and not associated with outcome in our results. These findings are similar to an earlier study, where we showed no correlation between ICP insults and outcome. 18 We believe that this reflects the fact that ICP is usually properly controlled with an active ICP-oriented treatment protocol, rather than that ICP has no effect on outcome. Further, PRx55-15 had a strong, significant association with outcome in our multi-variate regression, indicating the role of poor pressure autoregulation on poor outcome in severe TBI. 4,8 When PRx55-15 was excluded from the multi-variate model, PRx displayed a similar but somewhat weaker association with outcome.
Study limitations
Some limitations of the study could be discussed. Twelve percent of our TBI population underwent decompressive craniectomy, which could have had impact on PRx/PRx55-15. There are a few small studies on PRx post-DC with equivocal results, including both improved 31,32 and worsened 33 pressure autoregulation. Moreover, open external ventricular drainage (EVD) and DC share similar mechanism to increase ICP compliance, and we have earlier found that PRx and PRx55-15 were both valid and improved by EVD opening in patients with subarachnoid hemorrhage and intracranial hypertension. 34 In this study, adjustment for DC (yes/no) had no impact on PRx55-15 nor ΔCPPopt as outcome predictors in our regression model. However, further studies are needed to fully validate PRx/PRx55-15 post-DC in TBI.
Although CPPopt-oriented thresholds seem promising to improve outcome, this was a retrospective study from a single center. Prospective usage of CPPopt has been questioned, due to frequent absences of the U-shaped CPPopt-curves. 10 However, the ongoing randomized controlled trial COGNITATE will give further insights into the feasibility and safety of CPPopt in clinical practice.
Conclusions
This study supports previous work indicating that a CPP of about 60 mm Hg is needed to optimize CBF, while CPP >70 mm Hg may possibly lead to adverse effects (e.g., hyperemia and edema formation). We also found, however, that typically for our patients, even those with favorable outcome, CPP was in fact above the BTF recommended upper limit of 70 mm Hg, and as a consequence, CPPopt was also generally high, above the BTF's CPP recommendations.
CPP insults in relation to CPPopt, rather than the BTF recommendation between 60–70 mm Hg, proved to be the better predictors of outcome in the multi-variate analysis. However, before implementation, there is a need for further studies on CPPopt-oriented thresholds (both with ± mm Hg and PRx thresholds in relation to CPPopt) compared with traditional fixed values.
Our findings indicate that pressure reactivity as measured with PRx and PRx55-15 is strongly associated with clinical outcome and displays temporal dynamic patterns that are significantly different for those with favorable and unfavorable outcome. PRx55-15 appears to be a better index, providing better separation between the favorable and unfavorable outcome groups, and holding up better as an independent predictor in the multi-variate analysis.
Footnotes
Acknowledgments
We express our gratitude to the personnel at the neurointensive-care unit, Uppsala University Hospital, for meticulous patient care and gathering of outcome data.
Author Disclosure Statement
No competing financial interests exist.