
Abstract
Traditional measurement of somatosensory evoked potentials (SEPs) depends on averaging of many recordings, which introduces loss of dynamic variability. Single trial extraction provides a new measurement of SEP latency variability for evaluation of the neurodynamic status of the somatosensory pathway. The aim of this study was to apply a single trial SEP to diagnose the severity of demyelination in a chronical spinal cord injury model. The severity of demyelination was measured by myelin area and staining intensity at the ventral column (VC), lateral column (LC), and dorsal column (DC) by histological examination with Luxol fast blue staining. Results showed that there was a strong negative correlation of the latency variability of trial-to-trial SEP with the myelin area in three columns (DC: r=-0.90, p<0.05; VC: r=-0.91, p<0.05; LC: r=-0.89, p<0.05), and the staining intensity in three columns (DC: r=-0.95, p<0.05; VC: r=-0.94, p<0.05; LC: r=-0.93, p<0.05). These data suggest that single trial SEP can provide a dynamic indicator of spinal cord demyelination.
Introduction
Cervical spondylotic myelopathy (CSM) is a common neurodegenerative disorder and is a leading cause of chronic compression of the cervical spinal cord or nerve roots in subjects older than 55 years of age, with resulting neurological dysfunction. 1 Clinically, diagnosis of CSM is based mainly on clinical manifestations and the score on Japanese Orthopaedic Association Scores (JOA) to evaluate spinal cord function and prognosis. The onset of CSM is insidious, however, with varying clinical symptoms and signs, and the traditional detection methods have a low sensitivity and are prone to subjective bias. Thus, new objective evaluation methods are required for early diagnosis and precise prognosis of CSM. 2
Somatosensory evoked potentials (SEPs) are correlated strongly with disability and post-operative recovery in patients with CSM. 3 –5 The SEPs reflect brain activity in response to external electrical stimulation of peripheral nerves and can provide more accurate quantitative analysis of spinal cord function. The SEPs are low cost, easy to use, non-invasive, and have higher success rates, and are widely used to detect functional integrity along the somatosensory pathway. 2,6 It is difficult to obtain the features of SEP signals, however, in clinical measurement because of the weak signal amplitude and high noise background. 7,8
Ensemble averaging (EA) is a popular method used for clinical measurement of SEPs. 2,9 In practical application, the amplitude and latency of an observable SEP waveform are the main two measures used to assess potential neurological deficits involving changes in nerve conductivity along the spinal cord. 10 The EA method, however, requires a large number of trials for averaging to obtain an interpretable SEP waveform, with a long detection time. As such, deficits may have already occurred before acquiring sufficient trials, especially for intraoperative monitoring. 11
The EA method also obscures the variations in response amplitude, latency, or phase characteristics with time, but the variations contain non-stationary and dynamical neurological characteristics inside SEP signals from trial-to-trial. 6,12 As such, the traditional EA method cannot accurately detect SEP features from a large number of across-trials. Thus, a desired approach would involve the extraction of the real SEP features from the real cases.
Several promising blind source separation algorithms, in which the uncorrelated sources can be separated, have been reported recently to provide fast detection and an enhanced signal-to-noise ratio of SEP signals. 13,14 Of these, the second order blind identification (SOBI) is the most appropriate for separating EPs, with advantages of simplicity, reliability, robustness, and applicable to Gaussian signals, especially to short serial signals. 13 To improve the performance efficiency of SOBI, a constrained SOBI algorithm, termed one-unit SOBI with reference algorithm (SOBI-R), was proposed recently. 15
We previously demonstrated effectiveness of SOBI-R for fast SEP extraction with a few channels, 16 and that single trial SEP obtained using SOBI-R can identify early stages after spinal cord injury (SCI). 16 Further, we evaluated the electrophysiological prognostic value of trial-to-trial variability of SEP in patients with cervical myelopathy 16 and found that the latency variability of trial-to-trial SEP reflects the recovery ratio of patients with CSM after surgery, suggesting that changes in latency are more sensitive to spinal cord deficits. 12,16 –18
The SEP latency is a measure of signal transmission time along the somatosensory pathway (from peripheral nerves to the brain), while the latency of SEP was suggested to reflect the severity of myelopathy in the spinal cord. 16 Thus, abnormal trial-to-trial SEP latency variability (TTSEP-LV) is correlated closely with the severity of demyelination in CSM. 16 The mechanism of how the TTSEP-LV changes according to cervical myelopathy remains unclear, however.
Based on these findings, and that the major deficits in CSM are axonal lesions with demyelination and axon loss, the overall aim of this study was to evaluate the changes in TTSEP-LV during progressive demyelination after SCI induced by chronical compression. Further, we hypothesize that TTSEP-LV is an indication of spinal cord demyelination in CSM.
Methods
Animal model of chronic compressive SCI
A total of 36 healthy adult Sprague Dawley rats of both sexes (weight, 250–330g) were divided equally into a sham control group (without any injury to the cervical spinal cord; Group 1, n=12) and two compressive SCI groups that received chronic compression of the C5 cervical segment (Groups 2 and 3, n=12 per group). All experimental procedures were approved by the Committee on the Use of Live Animals in Teaching and Research of our local institution.
For surgical procedures, all rats received general anesthesia with intraperitoneal injection of ketamine-xylazine mixture (60/10mg/kg), and with additional doses to maintain adequate intraoperative anesthesia. Chronic compression for SCI with CSM was performed by implantation of water-absorbing materials (3 × 1 × 1mm size), 2,9 and this material did not elicit any inflammatory reaction or tissue granulation after implantation in previous studies. 2,9,19,20
After posterior incision of the spine, a small space between the adjacent laminae near the facet at the C5 level was opened and enlarged with natural flexion of the spine, and the underlying dura was separated carefully from the laminae. The water-absorbing material was inserted carefully into the right posterolateral side of the rat spinal canal at the C5 level. This material expands over time, with a maximal expansion of 7 × volume within 24h after implantation, to produce chronic cord compression that is maintained for >6 months. 2
After the operation, rats were returned to separate cages. For tissue collection, rats in the sham control group were euthanized at four weeks, while SCI animals were euthanized at two weeks (Group 2) or four weeks (Group 3), by an overdose of 20% pentobarbital.
Histopathological detection
After perfusion, the rat spinal cords were harvested carefully to be fixed with 4% phosphate buffer liquid in formaldehyde solution. The cord was immersed in 10% formalin for 12h and then embedded in paraffin. The cord was continuously cut into 5μm-thick sections using a microtome. Sections were stained by Luxol fast blue and analyzed by light microscopy (Nikon H600L microscope, Nikon, Tokyo, Japan). Luxol fast blue was used to stain the myelin in white matter of the lateral cord, with a blue color reflecting the myelin content.
The area and intensity of the myelin were measured at the ventral column (VC), lateral column (LC) and dorsal column (DC) as shown in Figure 1A. In each column (Fig. 1B), we separated the areas into many small regions of interest (ROI) with an area of 0.05 × 0.05mm2 in the full column. In each ROI, the area and intensity of the myelin were measured using ImageJ software (Version 1.47v; National Institutes of Health, Bethesda, MD). 21 Measurements of the intensity of staining were performed by two different investigators independently, and the average results were calculated. 21 The mean value of all ROIs was used as the result of each animal. In the injured cord, the severity of demyelination was evaluated by myelin area and staining intensity.
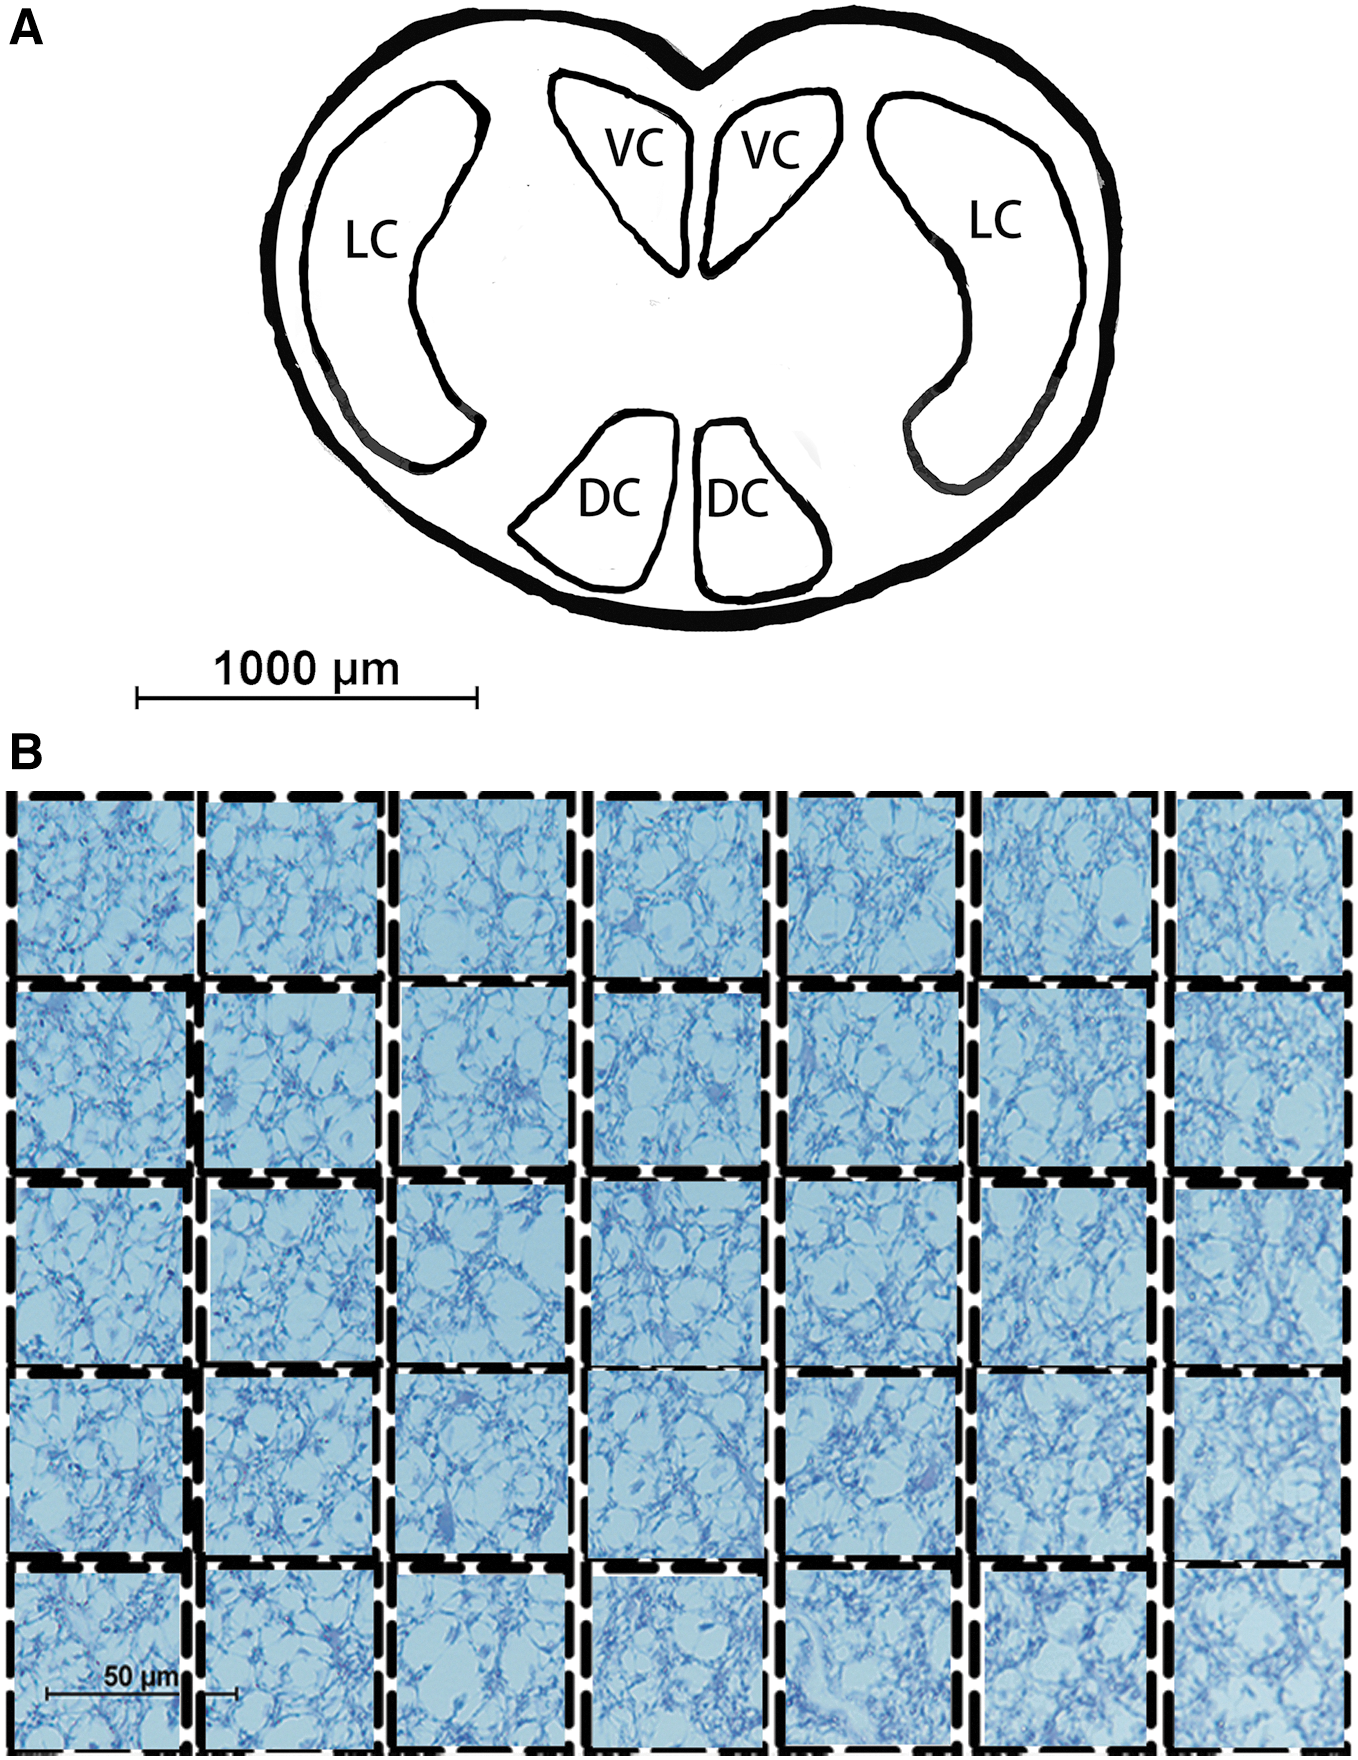
White matter segmentation of cord (
SEP collection
To evaluate the functional integrity of the spinal cord, the upper limb SEP signals were longitudinally collected in all animals before and after compressive SCI. A constant current stimulation (square wave of 3.4Hz stimulation rate, 0.2msec duration, and time interval 0.3msec) was delivered to the stimulation electrodes on the median nerve at the forepaw. Cortical SEPs from four channels were recorded by screw electrodes placed on the skull over the sensorimotor cortex at F3, F4, Fz, and Cz versus Fpz, according to the 10–20 international system (Fig. 2). The raw recorded surface SEPs were amplified 2000 × at a sampling rate of 10kHz and bandpass filtered from 20 to 2000Hz (Zhuhai Yiruikeji Co., Ltd., Zhuhai, China). One hundred trials of raw SEP were recorded before and two weeks after the surgery from each rat, and 4 weeks after the surgery from rats in Group 1 and Group 3.

Positions of the recording electrodes overlying the cerebral cortex.
Single trial extraction of SEP
To detect precisely the single-trial SEP waveforms from a few channels, we used the SOBI-R spatial filtering algorithm,
22
which can isolate signals related to a reference signal from a multi-input signal S(t) as follows:
where
where G(y) is the objective function, E(*) denotes the covariance matrix, y is the estimated output signal
The Lagrange multipliers method was then used for optimal solution, and the Newton-like learning algorithm was performed to determine the optimal unmixing vector V as:
where
Statistical analysis
All statistical analyses were performed with statistical software (SPSS version 16.0 software; SPSS Inc., Chicago, IL). Data are presented as the mean±standard deviation. Differences in TTSEP-LV and histological results between the three groups were analyzed by one-way analysis of variance (ANOVA) with Tukey post hoc tests, with a significance level a=0.05 at p<0.05. Pearson correlation coefficients between TTSEP-LV and histological results were also calculated using a bilateral test (two-tailed), with p<0.05 and an absolute correlation coefficient ≥0.50 considered a significant linear correlation.
Results
Figure 3 shows the averaged SEPs before and after the SCI from a sample rat. The SEP wave before injury (purple line) shows a similar onset latency to SEP after injury (blue line), but after injury, the peak amplitude obviously appears to be lower with a wider shape, and it indicates that the latency is more stable than the amplitude but the averaged SEPs did not reflect exactly the variation of the latency.

Averaged somatosensory evoked potentials of 100 trials from the intact and injured spinal cord.
The SEP waveforms of 100 single trials extracted by SOBI-R from one rat before and after SCI are shown in Figure 4. The 100 single trial SEPs from the intact spinal cord showed a similar distribution, and the SEP waveforms were distinctly observed, although showed an irregular distribution compared with the injured spinal cord (even though the waveforms could not be distinguished). By contrast, single trial SEP latency showed a higher variability after SCI compared with the uninjured cord. In addition, the single trial SEP was lower after SCI.
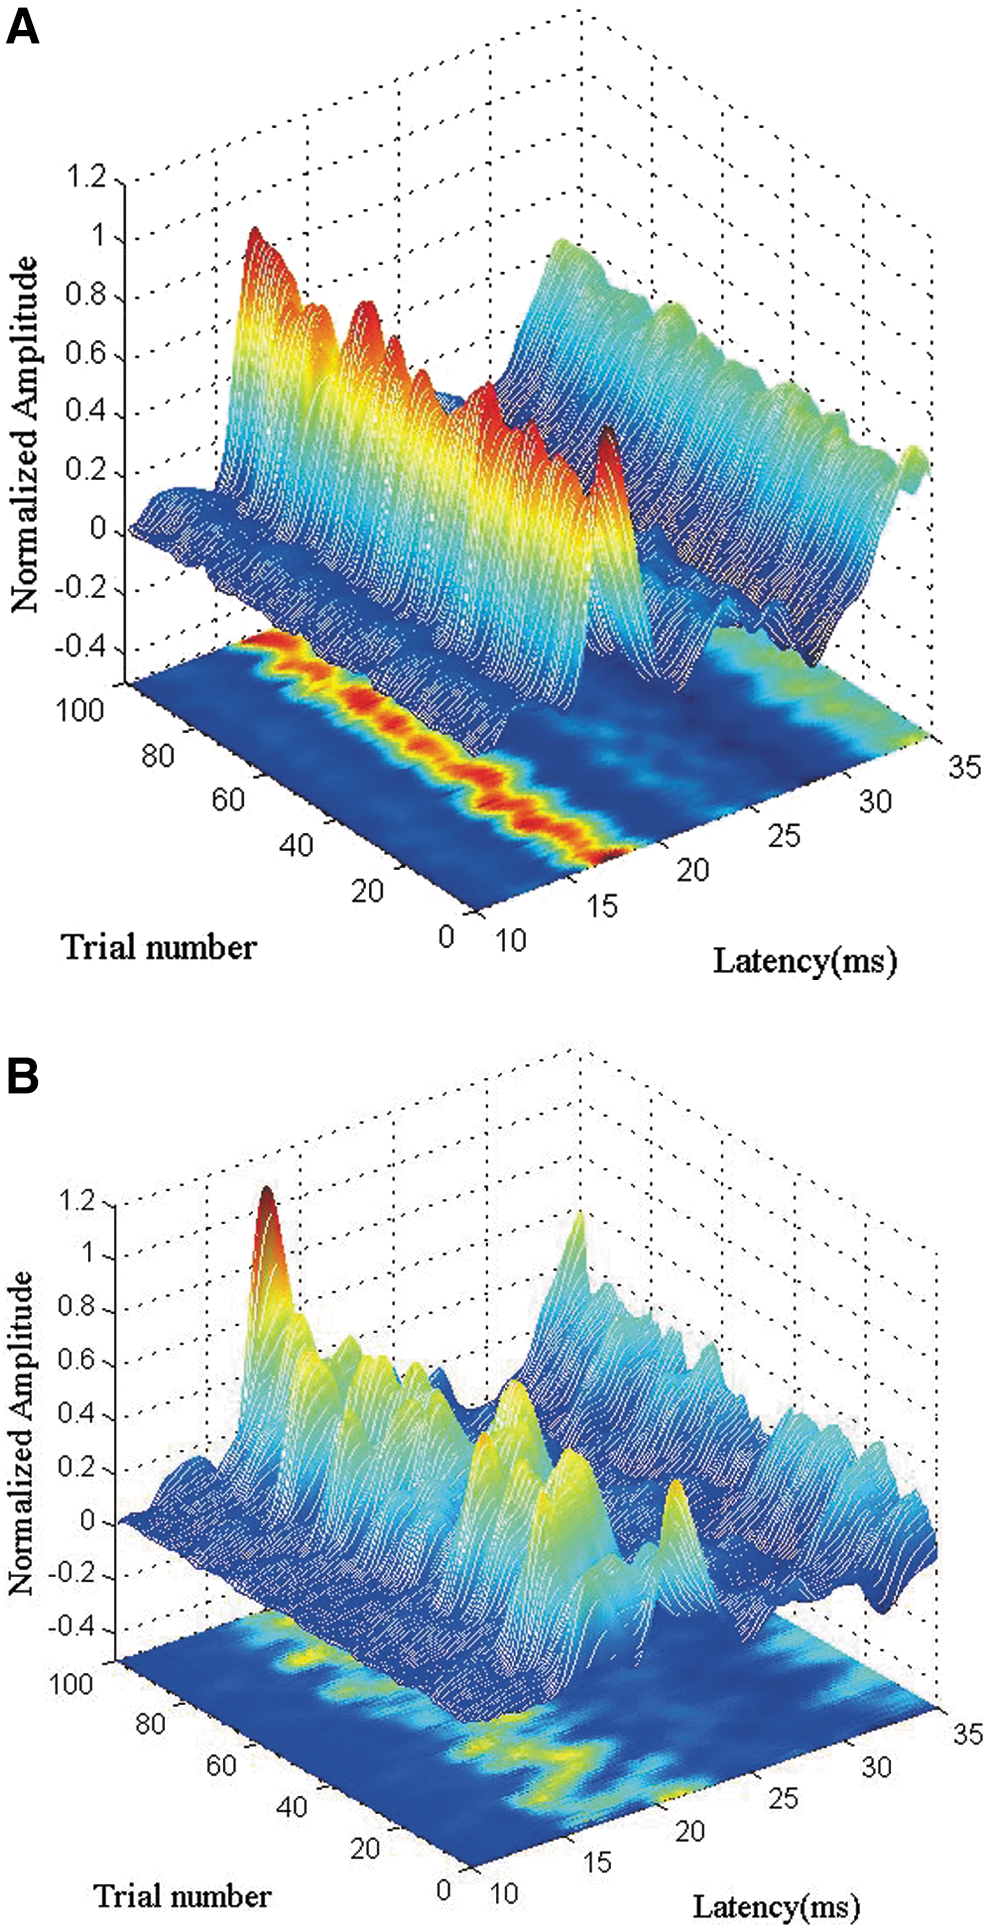
Trial-to-trial somatosensory evoked potentials. (
There was a significant differences (p<0.05, ANOVA; Table 1) in TTSEP-LV among the sham surgical control group (15.7±0.86), SCI group at two weeks (22.4±0.99) and four weeks (26.2±0.65) after chronic compression, and the longer duration of compression after the spinal cord injury, the higher TTSEP-LV. Consistent with these findings, there was a significant decrease (p<0.05, ANOVA) in the myelin area of sham controls compared with SCI rats at two weeks and four weeks in three columns after SCI. Further, there was a significant difference (p<0.05, ANOVA) in myelin staining intensity in three columns among the sham control group, the SCI group at two weeks and four weeks after chronic compression. Moreover, the longer duration of chronic compression after the SCI, the smaller the myelin area and the lower staining intensity.
Parameters Variability of the Three Groups
ANOVA, analysis of variance; SEP, somatosendory evoked potentials; LC, lateral column; VC, ventral column; DC, dorsal column.
Finally, there was a strong negative correlation of TTSEP-LV with the myelin area in DC columns (r=-0.90, p<0.05) and staining intensity in DC columns (r=-0.95, p<0.05), suggesting that latency variability of the trial-to-trial SEP was correlated with histological outcomes of DC columns. The same findings of correlation were found between TTSEP-LV and VC column (myelin area: r=-0.91, p<0.05; staining intensity: r=-0.94, p<0.05), as well as TTSEP-LV and LC column (myelin area: r=-0.89, p<0.05; staining intensity: r=-0.93, p<0.05).
Discussion
The pathogenesis of CSM does not explain fully the clinical characteristics. 23 Further, because of a lack of accurate and reliable indicators of neuropathological changes in the spinal cord, the optimal timing and methods for surgical management of SCI remain controversial. 24 Neuroelectrophysiological examination can provide a relatively objective quantitative evaluation of nerve function. For example, SEP can predict the course of CSM and the prognosis of decompression surgery. 22,25,26 Compared with magnetic resonance imaging, SEP has the advantages of low cost, ease of use, and a similar sensitivity but better specificity, allowing accurate assessment of the degree of SCI, the nature of the functional loss, the innate nervous system response to injury, and the regeneration of spinal cord neurons.
The standard method for SEP analysis measures the waveform amplitude and latency of the main wave based on time-domain detection to quantify any changes and detect injury. The SEP signals, however, are usually accompanied by noise, which makes peak identification difficult, even with undetectable latency and amplitude. In fact, EP signals are usually polyphasic waveforms that reflect different activation and conduction velocities within the spinal cord. 27 Therefore, present measurements cannot represent the precise characteristics of EP signals.
Many of the past studies used correlation-based metrics to quantify the morphological similarity between two SEP signals in time-domain—e.g., spectral coherence analysis, 28 phase space analysis, 29 dynamic time warping algorithm, 30 adaptive signed correlation index, 31 sparse reconstruction. 32 The main weakness of these methods is that they are very susceptible to random noise introduced during the acquiring of SEP signals.
A previous study used a novel measure based entropy to compute the similarity of the distribution of the SEP amplitude histograms, and it reported thereby providing a more robust assessment of the demyelination in SCI. 33 Deficits in spinal cord function, however, cause localized changes occurring (at various time instances or delays) in the morphology and therefore in the spectrum of the SEP waveform, 34 and time-frequency analysis provides simultaneous representation of both temporal and spectral information from the whole of the EP waveform, rather than arbitrarily selected features. 34
For clinical application purposes, time-frequency distribution of SEP was suggested to be an additional monitoring method besides the conventional amplitude/latency measurement because of more reproducible and prompt response to the potential injury in the spinal cord. 35 It is, however, often associated with other problems such as cross-term interference, and cannot provide high resolution at the same time in both time and frequency domains.
All these above methods basically depend on the changes in SEP waveform morphology in either the time domain or the frequency domain or a combination of the two. Agrawal and associates 36 proposed a new slope analysis method for SEPs, and the method has been demonstrated as possible to identify analyzing slope changes over the entire SEP waveform to improve reliability in conjunction with traditional amplitude/latency measurements.
Unfortunately, the methods of SEP measurements above are based mainly on the EA technique to extract the SEP signal from background brain activity and other noise. In clinical detection, the SEP is the averaging of 100–300 or more trials, which removes the dynamic characteristics of the neural pathway. The CSM, however, often involves partial axonal demyelination or degeneration, resulting in a dynamic variation in SEP characteristics, which are not detected by an averaged SEP.
In the present study, it also demonstrated that latency is more stable than the amplitude, but the averaged SEPs did not exactly reflect the variation of the latency. On the other hand, the reliability of SEPs measurements may be questioned because of the inherent variability of baseline potentials during different stages of surgery. The effectiveness of SEP application has been affected by the lack of consensus regarding reference baselines, 37,38 so EA cannot extract the SEP signal separately, which overlaps in some frequency range with the noises. In our recently study, the novel one-unit SOBI with reference algorithm achieved single trial SEP detection from four channels recordings, which can provide more dynamic features of SEP signals varied from trial-to-trial. 22
The main early pathological feature of CSM involves demyelination in the conducting tract of the spinal cord, which leads to axonal loss and neuronal apoptosis. 39 Pre-operative SEPs can be used to non-invasively and quantitatively assess the function and pathological changes in the sensory conduction tract in the cervical spinal cord in patients with CSM. Indeed, there is a more strict locking time relationship between the EP latency and stimulus, which is not affected by subjective factors; it provides a direct and sensitive indication of demyelinating lesions 40 and directly reflects the nerve conduction velocity related to the integrity and connectivity of the axon myelin sheath.
Neural EPs sometimes have an abnormal amplitude, 41 because they are affected by many factors. Previous clinical studies have found that even if there is a normal amplitude, an abnormal latency can predict poor prognosis 25,26 and better reflects prognosis than an abnormal amplitude. The SEP latency provides a measure of signal transmission time along the somatosensory pathway, from the peripheral nerves to the brain. Previous studies have reported that an abnormal latency would reflect the severity of myelopathy in the spinal cord, 16,17,25 indicating that a delayed SEP latency is closely correlated to the severity of demyelination in cervical myelopathy.
A previous study used a single SEP extraction technique to extract a single trial SEP, 22 which can measure the latency variation rate of the spinal cord nerve conduction process. This single trial estimation of SEP allows assessment of the dynamic properties of nerve conductivity along the somatosensory tracts in the spinal cord and can be used to detect local axonal injury more effectively and with a higher sensitivity than averaged SEPs, which is useful for predicting the potential for neural functional recovery. 12,15
In the present study, we examined the underlying neurophysiological changes of TTSEP-LV in a rat model of chronic cervical spinal cord compression 42 and compared the changes in SEPs with histological examination. Our main findings from analysis of the SEP signal waves were that the trial-to-trial SEPs were changed after SCI, indicating dynamic changes in the nerve pathway. From the results of electrophysiological detection of latency variability in trial-to-trial SEPs, we found a progressive increase in TTSEP-LV with chronic SCI. By histology, we also found a progressive reduction in myelin area and myelin staining intensity in dorsal, lateral, and ventral columns after SCI. Further, there was a strong negative correlation of changes in TTSEP-LV with the severity of demyelination in dorsal, lateral, and ventral columns after SCI.
In principle, SEP mainly reflects the demyelination status of DCs, supporting the significant correlation between TTSEP-LV and histology findings in the DC. Reduction in myelin area and myelin staining intensity of lateral and ventral columns, however, were the same as that in DCs. Similarly, changes of TTSEP-LV are correlated with severity of demyelination in lateral and ventral columns in terms of myelin area and myelin staining intensity.
When the cord was injured with a mild chronic compression, the compression was applied to the entire cord so that the pressure evenly distributed to dorsal, lateral, and ventral columns. It suggests that increasing TTSEP-LV indicates the progressive demyelination in DC, as well as demyelination in other columns of white matter under chronic compression. These data suggest that TTSEP-LV may be a useful electrophysiological tool for clinical assessment of the severity of demyelination after SCI.
The SEP mainly reflects the structure and functional status of the conducting fibers in the sensory ascending pathway of the posterior spinal cord (including the ganglion, nucleus cuneiformis, and dorsal thalamus). The SCI can cause damage to the fibers of the sensory ascending pathway, resulting in a decreased number of nerve impulses conducted along the ascending fibers and decreased synchronous excitation of the cortical sensory nerves. Neurons can also die after SCI, which slows the conduction velocity of nerve impulses, leading to a prolonged latency and decreased amplitude of SEPs.
The main purpose of the present study was to confirm whether there is a correlation between the spinal cord demyelination and trial-to-trial latency variability of SEPs. There are still some limitations to the present study. First, the present histological analysis was based on the whole spinal cord, and it also does not determine the myelin thickness and the relative proportion of demyelination; more precise analysis with electronical microscope and immunohistochemical techniques would provide information about axons and for central myelin to understand the injury severity and recovery state.
In addition, this study utilized the animal model with mild compressive SCI and short duration. In rats with severe injury, SEP waveforms are sometimes obscured by noise and may even vanish, which makes it impossible to extract single trial waveform for evaluation of trial-to-trial latency variability. It implies that the present study only demonstrates the possible use for mild injury detection in a clinically relevant early stage of cervical myelopathy. The present study is a preliminary new discovery and observation, and it needs further investigation to discover more evidence. Despite these limitations, the present study and the trial-to-trial latency variability of the SEP method can be used as a basis for future related investigations.
Conclusions
The TTSEP-LV is a new technique for measurement of SEPs based on a single trial. Our data suggest that TTSEP-LV provides accurate in vivo assessment of spinal cord demyelination, which may be useful for early and precise diagnosis of myelopathy in the clinic, thus aiding in determining the most appropriate surgical intervention.
Footnotes
Acknowledgments
This work was supported by the Chinese Academy of Medical Sciences Initiative for Innovative Medicine under grant 2016-I2M-2-006, the National Natural Science Foundation of China under grant 81572193, and the Natural Science Foundation of Tianjin under 18JCYBJC29600.
Author Disclosure Statement
No competing financial interests exist.