
Abstract
Given the worldwide adverse impact of traumatic brain injury (TBI) on the human population, its diagnosis and prediction are of utmost importance. Historically, many studies have focused on associating head kinematics to brain injury risk. Recently, there has been a push toward using computationally expensive finite element (FE) models of the brain to create tissue deformation metrics of brain injury. Here, we develop a new brain injury metric, the brain angle metric (BAM), based on the dynamics of a 3 degree-of-freedom lumped parameter brain model. The brain model is built based on the measured natural frequencies of an FE brain model simulated with live human impact data. We show that it can be used to rapidly estimate peak brain strains experienced during head rotational accelerations that cause mild TBI. In our data set, the simplified model correlates with peak principal FE strain (R2 = 0.82). Further, coronal and axial brain model displacement correlated with fiber-oriented peak strain in the corpus callosum (R2 = 0.77). Our proposed injury metric BAM uses the maximum angle predicted by our brain model and is compared against a number of existing rotational and translational kinematic injury metrics on a data set of head kinematics from 27 clinically diagnosed injuries and 887 non-injuries. We found that BAM performed comparably to peak angular acceleration, translational acceleration, and angular velocity in classifying injury and non-injury events. Metrics that separated time traces into their directional components had improved model deviance compare with those that combined components into a single time trace magnitude. Our brain model can be used in future work to rapidly approximate the peak strain resulting from mild to moderate head impacts and to quickly assess brain injury risk.
Introduction
Mild traumatic brain injury (mTBI), or concussion, has received heightened awareness because of its adverse effects not only on professional athletes and military personnel, but more broadly, on the general public. Aside from acute neurocognitive deficits, mounting evidence suggests increased risk of chronic neurodegeneration with repeated mTBI. 1 There have been multiple reports of contact athletes and service veterans experiencing memory loss, behavioral changes, and motor function abnormalities later in life. 2 In severe cases, retired professional football players in their middle years have shown extreme changes in personality and suicidal tendencies. 3 Return to play guidelines and legislations have been introduced to protect athletes from repeat trauma and to reduce the risk of long-term brain damage. 4 However, there is low compliance because of under-reporting of injuries. 5 –7 Despite increased awareness of mTBI, timely diagnosis and prevention of this injury is difficult because of a lack of understanding of injury mechanisms.
In the mid-twentieth century, rising motor vehicle and sporting deaths led to the establishment of safety standards that targeted reduction of forces that deform or fracture the skull. In the 1960s, the Wayne State University tolerance threshold 8 was developed, motivating two translational acceleration standards: the Gadd Severity Index (SI) 9 and Head Injury Criterion (HIC). 10 The two biggest regulating bodies for enforcing safety standards, the National Highway Traffic Safety Administration (NHTSA) and the National Operating Committee on Standards for Athletic Equipment (NOCSAE), still evaluate injury risk based on translational acceleration. NHTSA uses a metric based on the time history of translational head acceleration as the only federally mandated brain injury metric in automobile safety regulation, 10 whereas NOCSAE uses a maximum resultant translational acceleration criterion to evaluate helmet design. 11 Despite widespread use of translation-based metrics to predict brain injury, some question whether they are suitable for assessing all types of brain injury. 12
Diffuse brain injury, which can occur through purely inertial head acceleration even in the absence of skull deformation, has become better understood since the development of HIC and SI. Rapid head rotations can shear and deform the white matter of the brain causing diffuse axonal injury (DAI), 13 a fundamentally different injury than focal injuries caused by skull deformation, which are primarily caused by translational motions, 12,14 Indeed, although head translational acceleration is an important factor for focal trauma such as skull fracture, rotational acceleration causes time-dependent inertial loading of the brain and better correlates with brain trauma severity in animal experiments. 15 –17 More recently, NHTSA developed the brain injury criterion (BrIC) to predict TBI risk by relating head rotational velocity to critical brain strains, and this criterion has been proposed to be used in the New Car Assessment Programs rating. 18 Realizing that both translational and rotational head kinematics may factor into injury risk, some 6 degree-of-freedom (DOF) criteria, such as head impact power (HIP) 19 and generalized acceleration model for brain injury threshold (GAMBIT), 20 have also been developed, which include both translational and rotational components of acceleration. Brain tissue deformation metrics calculated from finite element (FE) simulations are another category of frequently investigated injury criteria. Using these FE models, researchers simulate metrics such as tissue strain and strain rate to predict injury risk. Morphologically based metrics such as fiber tract-oriented strain, which better accounts for anisotropy in brain tissue, have also been found to correlate with injury. 21,22 Although FE model-derived criteria provide more physical intuition behind injury risk prediction than skull-kinematics-based criteria, they are severely limited by long computational running time and may not be practical options as federal standards (Table 1). 23 –29
Kinematics Expressed in Mean and Standard Deviation Values from Different Data Sources
Simplified mechanical models of the brain have been developed and used to gain insight into brain tissue deformation since the 1950s, when Kornhauser first investigated the sensitivity of mass-spring systems to transient accelerations in the context of brain injury. 30,31 Since then, both rotational and translational lumped-parameter brain models have been developed to enable better understanding of how the brain deforms under head acceleration; however, many of these models were not effectively validated because of lack of experimental data. 32 –34 More recently, with the development of validated FE brain models, there have been efforts toward developing simplified, linear mechanical analogs of these brain FE models. Gabler and coworkers developed a mass-spring-damper lumped model of the brain, fitting parameters to match mass displacement to maximum principal strain from brain FE models over a range of idealized force profiles applied to the skull. 35 Gabler and coworkers found that the peak principal strain from FE models can be adequately reproduced using simple mechanical systems.
To identify promising injury criteria for predicting human injury risks, the ideal approach is to compare the performance of all candidate injury criteria with a large human injury and non-injury data set. However, only a small number of studies have compared different injury criteria using a common data set. In our previous study, 24 injury criteria were evaluated using a 6 DOF human injury data set containing two injuries. These results helped provide insight into promising injury criteria, showing the importance of rotational measurements for predicting injury. However, the scarcity of full 6 DOF human injury data has hindered the ability to make statistically significant comparisons of all injury criteria. In addition, because of the relative infrequency of concussions compared with non-concussive impacts, existing data sets are typically biased and injury functions are developed using similar numbers of injuries and non-injuries, 36 with few studies considering injury risk variations with sampling variability and sampling bias. 37
In this article, we developed a 3 DOF, mass-spring-damper model of the brain, with parameters based on modal analysis of brain displacements caused by real-world impacts, 38 contrary to previous approaches of fitting lumped model parameters to FE simulation results using idealized pulses. 35,39 Using our lumped parameter model, we present the brain angle metric (BAM), a metric for classifying between injurious and non-injurious impacts. We compare BAM to several existing injury criteria, using a combined 6 DOF human head kinematics data set from multiple loading regimes.
Methods
Head kinematics data sets
In this study, we included human male injury and non-injury data sets from multiple loading regimes, as listed in Table 1. We adopted an inclusion criterion in which for each data point either (1) all 6 DOF head kinematics were available, or (2) the head motion protocol was mainly constrained to a single plane and the kinematical measurements in that plane were available. For case 2, all head motion outside of the single recorded plane was set to random noise with magnitude <10% of the peak value in the recorded plane of motion to account for small out of plane movements. Using these criteria, we included data from the following experiments. Wu and coworkers measured head impact kinematics during football practice and game events with instrumented mouthguards (ninjury = 0, nnoninjury = 139). 23 Hernandez and coworkers measured head impact kinematics during athletic events using instrumented mouthguards (ninjury = 2, nnoninjury = 535). 24 More recently, a single concussive impact was recorded using the Stanford Mouthguard (MG)in high school football using the same measurement protocols as described by Hernandez and coworkers 24 (ninjury = 1, nnoninjury = 0). Together, these three data sets constitute the Stanford MG. Hernandez and coworkers measured head kinematics during rapid voluntary head rotations using instrumented mouthguards (ninjury = 0, nnoninjury = 29). 28 O'Keeffe and coworkers measured head kinematics from four mixed martial arts (MMA) fighters who received clinically diagnosed concussions (ninjury = 4, nnoninjury = 0). 29 Pellman and coworkers reconstructed injury and non-injury National Football League (NFL) head impacts by video analysis and dummy models. 36 However, the data from this original publication were found to be erroneous because of a faulty accelerometer, and have since been reanalyzed and corrected by Sanchez and coworkers (ninjury = 20, nnoninjury = 33). 25 All the 6 DOF measurements for the head kinematic data mentioned so far were available. In addition, we included the following three studies, in which the head motion was mainly constrained to a single plane. Ewing and coworkers performed non-injury sled tests on Navy volunteers in the coronal and sagittal directions (ninjury = 0, nnoninjury = 151). 26,27,40 In total, we have 27 injury data points and 887 non-injury data points. Injury cases were defined to be cases in which there was a clinical diagnosis of concussion from a physician. For more information on head kinematics measurements, refer to Supplementary Materials.
All the previously described data sets contain measurements of translational acceleration and rotational velocity. The Wu and Hernandez athletic data were recorded at 1000 Hz for a duration of 100 ms. The Hernandez voluntary motion data were recorded at 1000 Hz for 500 ms. The O'Keefe data were recorded at 1000 Hz for a duration of 200 ms. The sampling frequency of the Navy volunteer data and NFL reconstruction data were not reported, and the duration varied between 50 and 300 ms. All the data were projected to the center of gravity of the head and rotated to anatomical axes (x - anterior/posterior translation and coronal rotation, y - left/right translation and sagittal rotation, z - inferior/superior translation and axial rotation). The translational acceleration data were filtered at the CFC180 filter of 300 Hz, and the angular velocity data were filtered at the lowest sensor bandwidth of 184 Hz. 41
Brain FE modeling
To calculate local brain tissue deformations resulting from head impacts, we simulated head impacts using a validated FE head model developed at the KTH Royal Institute of Technology (Stockholm, Sweden), which represents an average adult male human head 42 (Fig. 1A). Because of the computational cost of running FE simulations, we only simulated a subset of the American football head impacts with higher kinematics. All impacts from the NFL data set were simulated. Within the Stanford MG data set, we simulated a total of 188 cases using our FE model, including all the impacts resulting in a clinically diagnosed concussion. Further, all impacts in which the peak value of at least one translational or rotational component exceeded that of any of the three clinically diagnosed concussions recorded by the Stanford MG were simulated, along with a random sample of 10% of the remaining impacts. The FE-simulated impacts were thus biased toward higher severity impacts that would be most difficult to classify for a machine learning classifier. For these simulations, we used the measurements of skull translational accelerations and rotational velocities as input to the model and simulated the entire duration of the impact. From the simulations, we computed two commonly used deformation metrics: peak principal strain in the brain and 15% cumulative strain damage metric (CSDM). Peak principal strain is the maximum strain among any element over the entire time trace. CSDM represents the cumulative volume of the brain matter experiencing strains over a critical level of 15%. Lastly, we calculated the peak axonal strain in the corpus callosum, as it has been suggested that the strain along the axonal fiber tracts may correlate well with injury risk (Fig. 1B). 43 To do this, we projected the tissue strain in the brain along the fiber tract directions, 43 and took the maximum value experienced within the corpus callosum.

Lumped parameter brain model
Although brain tissue and the brain–skull interface exhibit non-linear viscoelastic behavior,
21,42,44
–46
many studies have simplified this complex relationship through linear mechanical elements.
31
–35,39,47,48
Here, we developed a new lumped parameter brain model by creating a 3 DOF mechanical analog of the brain as follows: we assumed a rigid-body behavior for the brain's motion
47,48
in three anatomical directions and therefore used three separate spring-damper systems attached to the mass of the brain (Fig. 1C). This mechanical mass-spring-damper system models the rotational deformation of the brain from skull loading. To model accelerations of the skull, an input was applied as an excitation to the base of the system. The equations of motion for this system are as follows:
where I is the moment of inertia of the mass, k and c are the stiffness and damping values of the system, and
Table 2 lists model parameters in each anatomical direction. We simulated each impact using the lumped parameter model by applying the angular skull kinematics to the base of the mass spring damper system. For each impact, measured time traces in each anatomical direction were applied to the corresponding mass-spring-damper model. This resulted in a vector of the three peak relative brain angle values in each direction (
Parameters Used in Mass-Spring-Damper Brain Model
With the tissue deformation metrics calculated from the FE simulations of the KTH model brain, we ran a linear regression between the maximum resultant brain angle (
Statistical analyses
Having shown the correlation of the brain angle measures with local tissue and axon deformations, we used the maximum brain angle (
Because the injury and non-injury data likely fall in a binomial distribution, we fit a logistical regression model for each kinematic injury criteria on our full data set of injuries and non-injuries. In order to understand the ability of the BAM metric to predict injuries compared with the FE results, we also fit a logistical regression model on a smaller subset of just the football head impacts for strain-based criteria. We fit the logistical model to each injury criterion using the following equation,
In classifying rare events, in which the rate of incidence in a certain class is disproportionally smaller than the other class or classes, the maximum likelihood estimation of the logistical model suffers from small sample bias. The degree of bias is strongly dependent on the number of cases in the less frequent of the two categories. Reported concussions in sports occur at a rate of close to 5.5 cases per 1000 head impacts, 52 which is by definition a rare event. This needs to be taken into account when performing statistical analysis such as logistical regression. In addition, a majority of previously published injury criteria from injury and non-injury events have been based on severely skewed data sources, meaning that in such analysis, the percentage of injury-inducing head impacts is much greater than the actual incidence rate. 52 We used a formal approach to address these two challenges. We applied prior correction and bias correction methods proposed by King and Zeng for logistical regression analysis, using the ReLogit package in R. 53
Results
We included a total of 914 head kinematics including 27 clinically diagnosed brain injuries, from American football, boxing, MMA, sled tests, and rapid voluntary head motions. The translational and rotational accelerations as well as rotational velocities are shown in Figure 2A–C. We also present the incidence of each kinematic measure in the histogram plots in Figure 3.
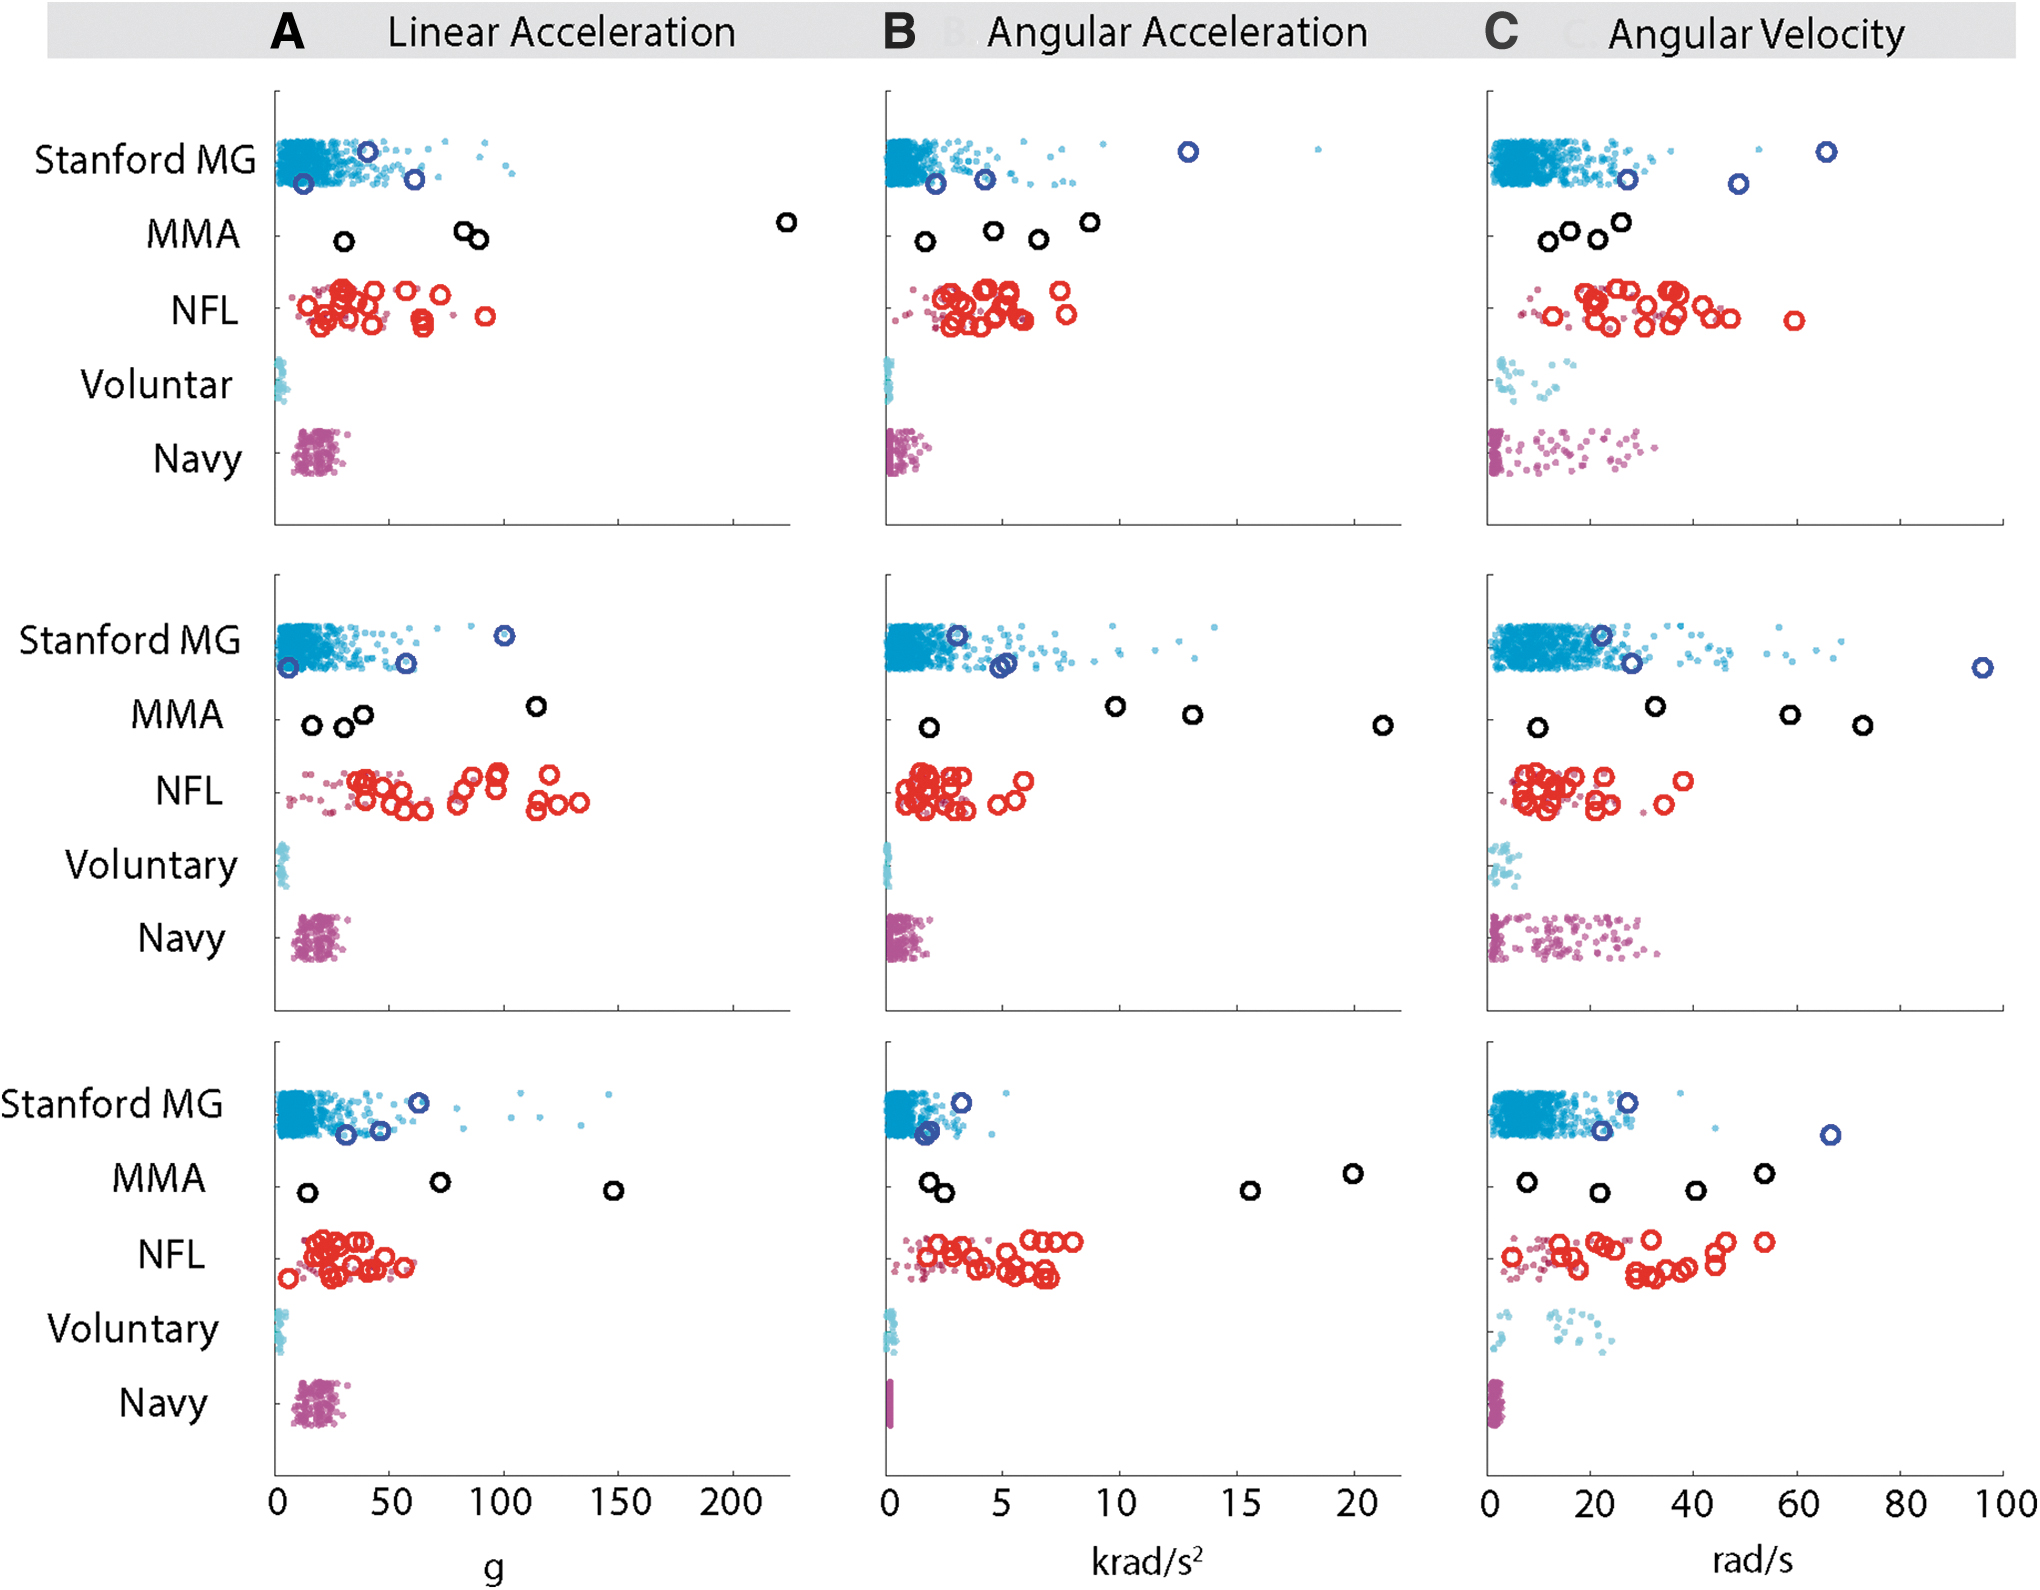
Loading regimes: distribution linear and rotational kinematics in each anatomical plane. The filled circles represent non-concussive events whereas open circles represent concussive events. Color image is available online.

Loading regimes: histogram distribution of head kinematics and comparison of directional kinematics in
We used three strain-based FE metrics to compare against the output of our lumped-parameter model,
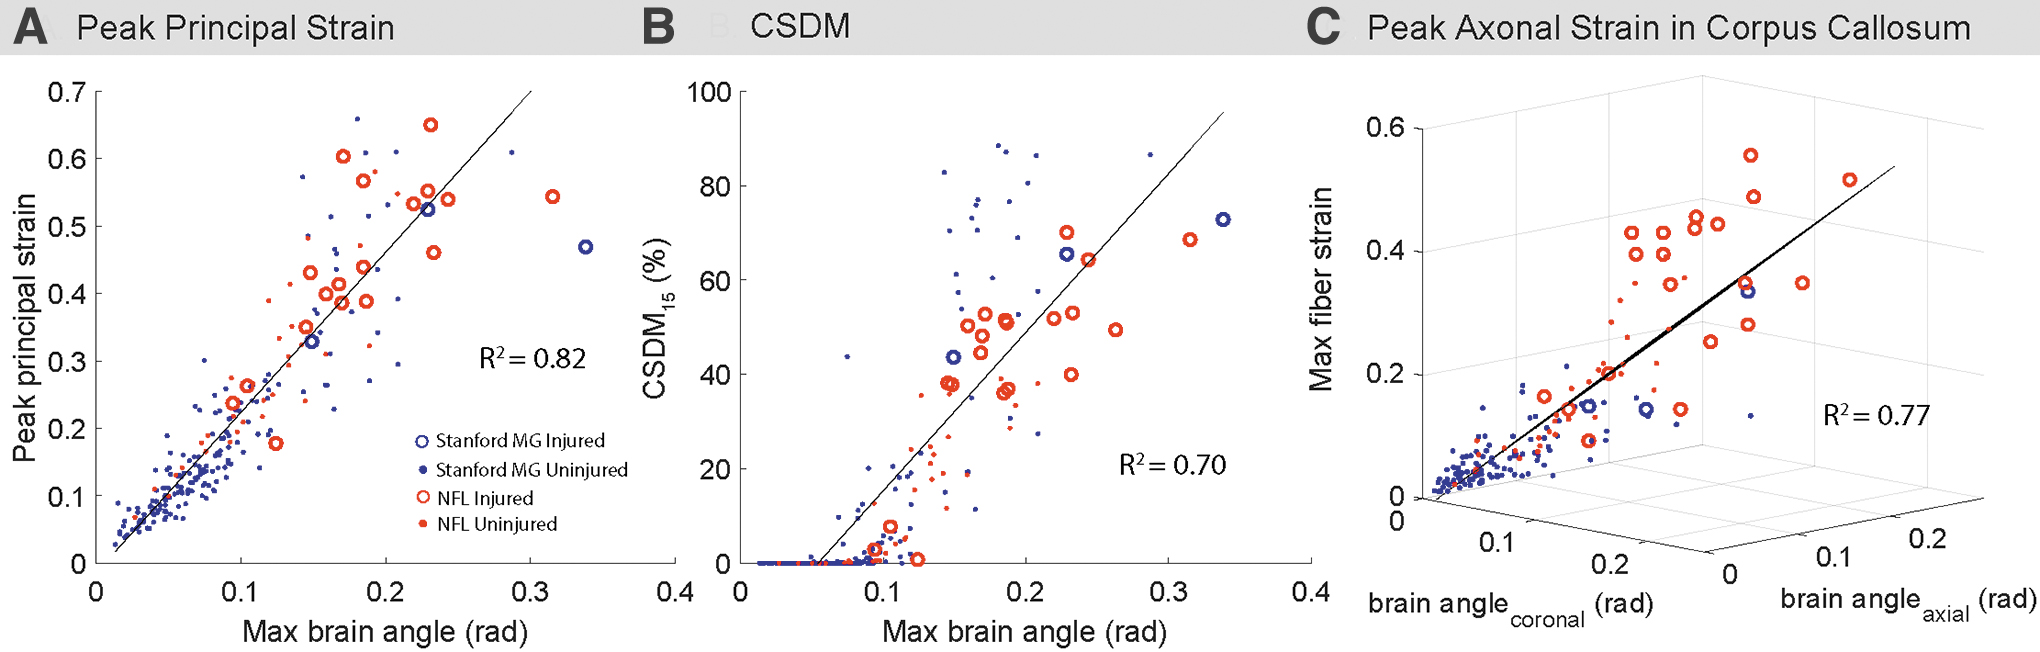
Performance of the rigid brain model: comparison of the maximum relative brain displacements (
Next, we compared the performance of the kinematic injury metrics with that of BAM, our metric based on the
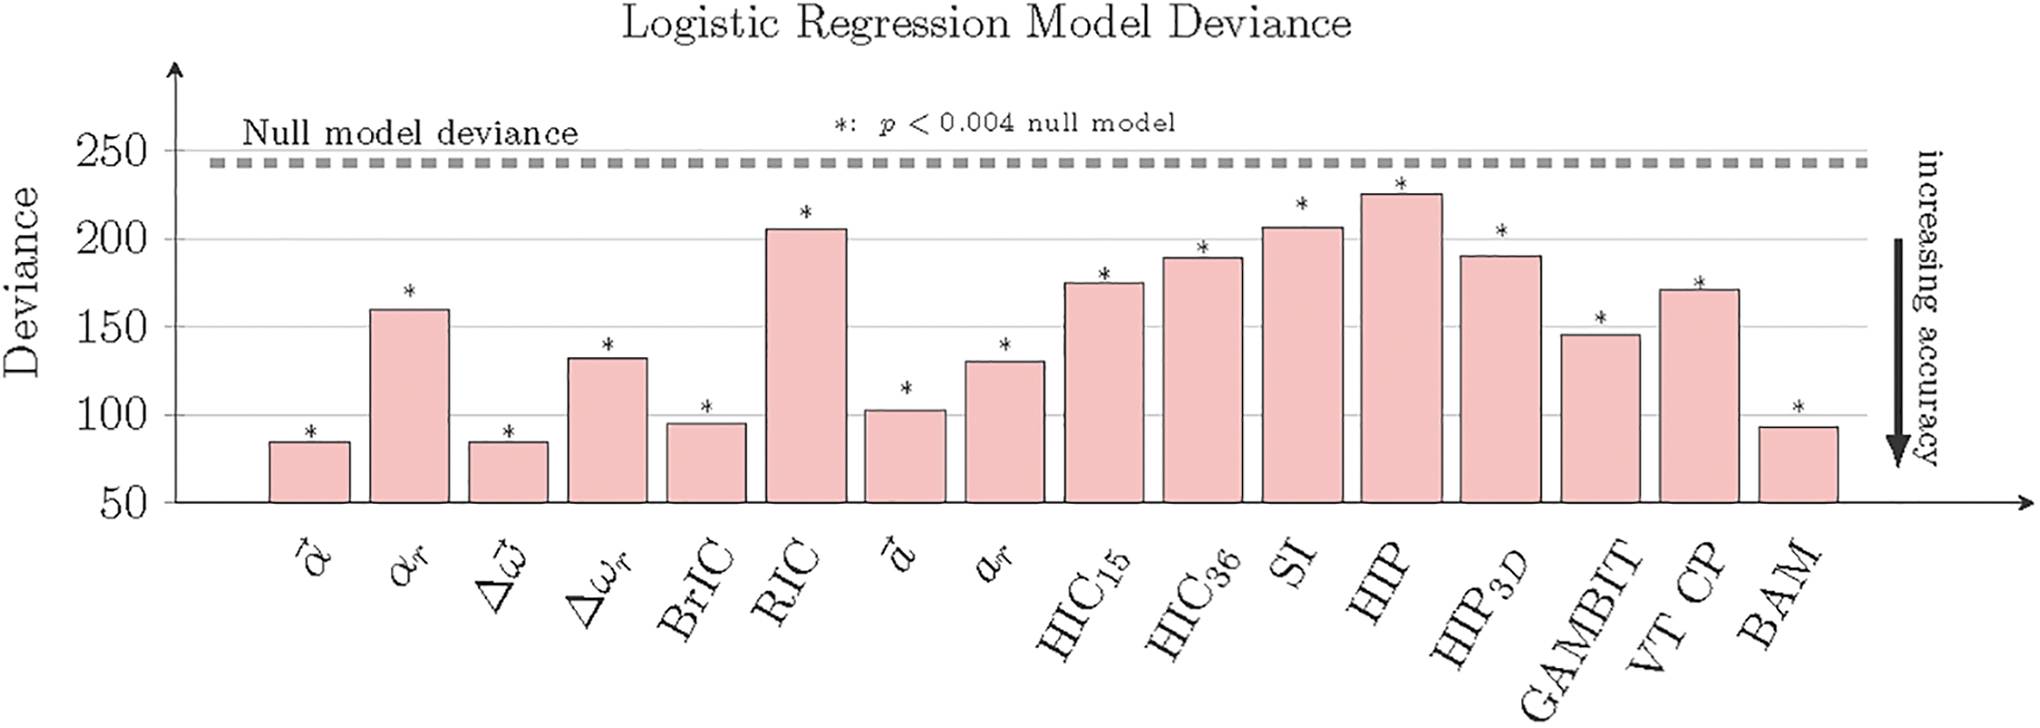
Deviance is a statistical measure that quantifies the “goodness-of-fit” of each logistical regression, with lower values indicating a better fit. Brain angle metric (BAM) is among the metrics with the lowest deviance. All models were statistically significant when compared against the null model, as denoted by an asterisk. Logistical regression coefficients for each metric are listed in Table S1 in Supplementary Materials. Color image is available online.
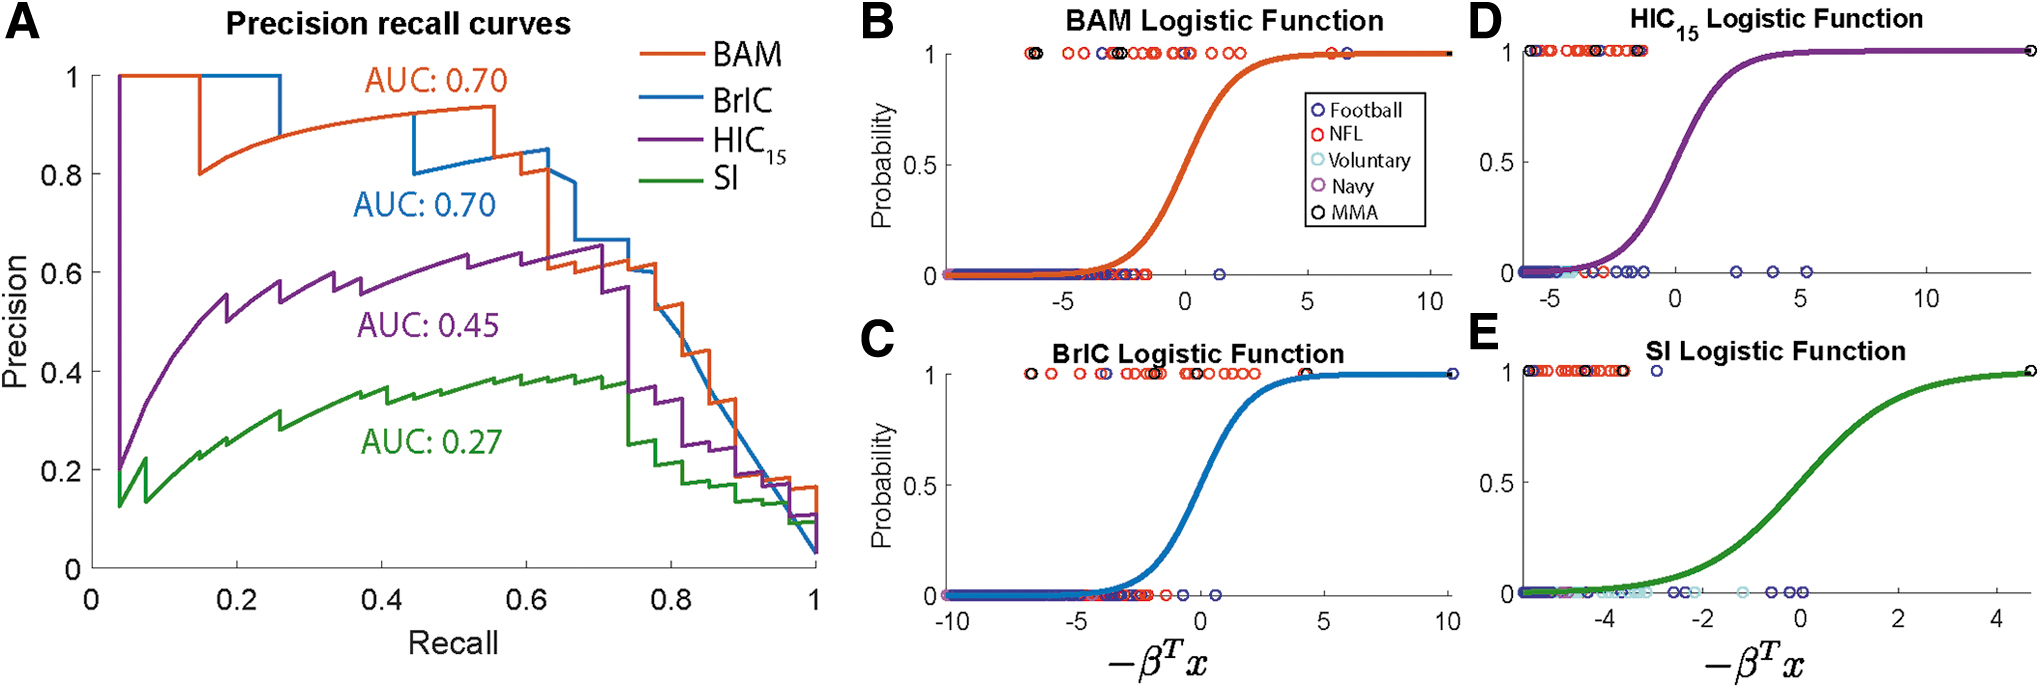
Logistical regression results comparing brain angle metric (BAM) with three different commonly used metrics: brain injury criterion (BrIC), head injury criterion (HIC)
15
, and severity index (SI).
To understand how our proposed metric compared with FE metrics, we compared its performance to
Note that prior correction and bias correction have been applied to adjust for the sample proportion bias in consideration of real-world concussion incidence rates. We found that these analyses made a difference in the fitted logistical parameters. For example, in the case of BAM, the beta coefficients in the logistical regression change from βoriginal = (8.288, −29.59, −10.35, −39.38) to βcorrected = (9.845, −28.86, −10.23, −37.94). Beta coefficients for all model logistic regression fits are shown in the Supplementary Materials in Table S1.
Using BAM, we developed a risk curve to classify the injury and non-injury events. The results are given in Figure 7, where 50% risk of concussion is signified by the green plane. Critical brain angle values (axes intercept) for 50% injury risk correspond to 0.34 rad in the coronal direction, 0.26 rad in the axial direction, and 0.96 rad in the sagittal direction, although there were not enough injury data in the sagittal direction for this critical value to be statistically significant. In the case of classifying concussions, a high sensitivity classifier is desirable to minimize the number of false negatives. The classifier hyper-plane can be tuned to different sensitivity levels by adjusting the classification threshold. To obtain 50% sensitivity with the BAM, coronal, sagittal, and axial critical values are 0.29, 0.83, and 0.22; to obtain 90% sensitivity, the critical values are 0.17, 0.49, and 0.13. Risk curves for
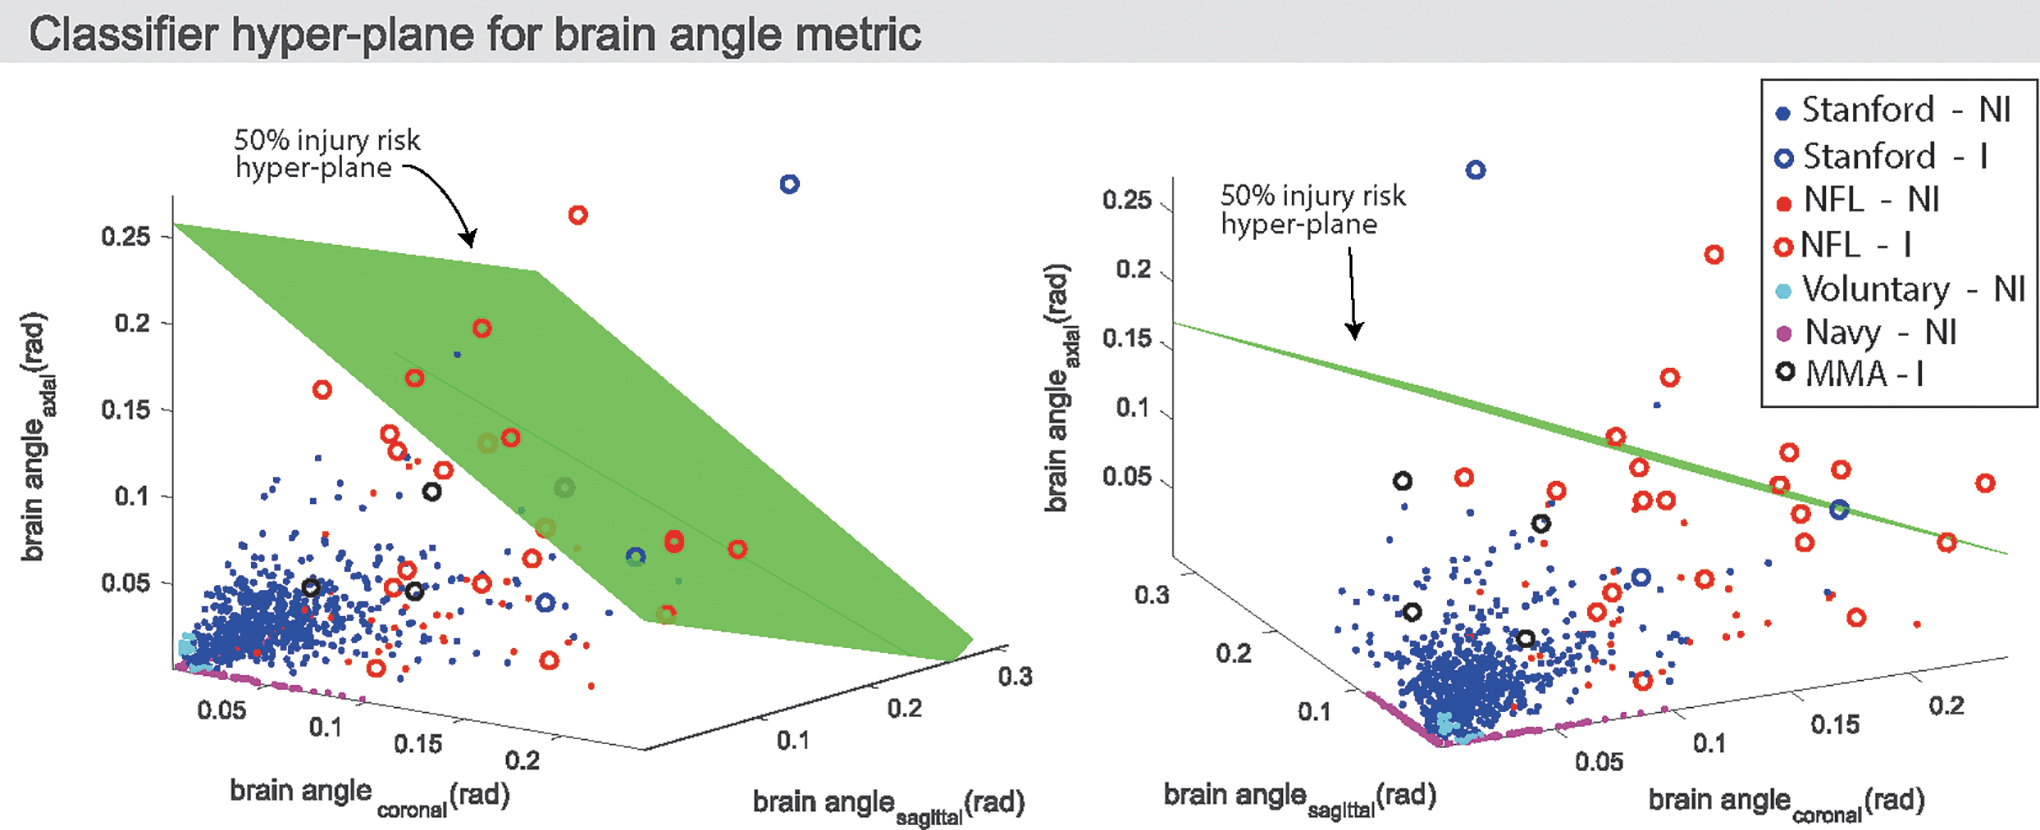
Logistical regression results: classifier planes based on brain angle metric (BAM), separating injured from non-injured data points. For illustration purposes, we show a 50% risk injury plane. Critical brain angle values for 50% injury risk correspond to 0.34 rad in the coronal direction, 0.96 rad in the sagittal direction, and 0.26 rad in the axial direction. It is of note that there were not enough injury data in the sagittal direction to determine a statistically significant critical brain angle in the sagittal direction, and with further data this critical value would be expected to be lower. The 50% injury risk plane, if used as a classifier, would have a sensitivity of 29.6%, a specificity of 99.9%, an accuracy of 97.8%, and precision of 88.9%. The classifier hyper-plane can be tuned to different sensitivity levels by adjusting the classification threshold. The coronal, sagittal, and axial critical values that correspond to a 50% sensitivity value are 0.29, 0.83, and 0.22; those that correspond to a 90% sensitivity value are 0.17, 0.49, and 0.13. Color image is available online.
Discussion
In pursuit of brain injury mitigation technology, national safety standards are being researched and evaluated to obtain new insights into the mechanisms of brain injury. However, standards have yet to converge to an injury criterion that encompasses understanding of both the kinematics of head motion and the dynamics of the brain. We hypothesized that there is a need to understand and incorporate the dynamic response of the skull-brain system into a chosen injury predictor. Brain deformation-based criteria calculated from finite element models have been found to provide more physical insight into brain injury than do kinematics criteria, but they are not practical for rapid injury prediction because of the computational complexity. Further, promising injury criterion may necessitate sensitivities to different anatomical planes.
In this article, we tested a number of different injury predictors on a large data set of 6 DOF human injury and non-injury head kinematic data from different loading regimes. We presented an injury predictor based on a multi-directional, mechanical model of brain deformation, taking into account the dynamics of the brain (time history of loading). We found that our proposed metric, BAM, performed similarly to peak angular acceleration (
Peak translational acceleration (
The
We hypothesized that simulating the dynamics of the brain would improve brain injury classification. However, on our data set, BAM showed no statistically significant differences from peak angular acceleration (

Comparing injury and non-injury regimes for different metrics: probability of injury is plotted for
In developing our mechanical brain model, we have modeled the complex dynamics of brain-skull motion into an injury predictor, which correlates to peak principal tissue strain as well as axonal strains in the corpus callosum in mild to moderate impacts. Although FE models are computationally expensive, we showed our metric to be an effective and easy-to-implement injury criterion that requires few inputs and low computational power. In future work, this classifier has potential to be used in real time in conjunction with wearable sensors to help inform players and coaches of the injury risk resulting from an on-field head impact. The brain model could also be used with simplified rigid-body models of the head and cervical spine 62 to give rapid mapping between input force to output brain displacement.
Recent previous work has also focused on the development of similar reduced order spring-damper models of the brain to estimate brain deformation from rotational skull kinematics. 35 In this article, the authors fit stiffness and viscosity parameters to match the maximum principal strain resulting from applying a series of idealized rotational pulses to the Global Human Body Models Consortium (GHBMC) brain finite element model. Conversely, we obtained model parameters by characterizing the dominant frequencies and decay rate of a brain finite element model excited by real-world injury and non-injury pulses. 38 The model presented by Gabler and coworkers correlates with the peak principal strain, simulated on the GHBMC FE brain model, with an R2 value of 0.95. There may be differences in the ability of the KTH model and the GHBMC model to be correlated with simple mechanical systems. Further, whereas the Gabler and coworkers model shows high correlation to the GHBMC peak principal strain, we show that our mechanical model can classify injuries from real-world data more effectively than many existing kinematic criteria, which have not been previously tested using simple mechanical brain models.
One limitation to this study is the scope of the data set. As mentioned previously, the ideal approach is to compare the performance of all candidate injury criteria with a large human injury and non-injury data set. Although head impact monitoring technology has advanced over the past years, there is still a lack of available, quality 6 DOF injury data in literature. Further, because of a lack of injury data in which head rotation was primarily in the sagittal plane, logistical regression coefficients for many of the metrics in the sagittal plane were not statistically significant. More injury and non-injury data, within different loading regimes, would allow for more extensive validation of the correlation between
Footnotes
Funding Information
This study was supported by the Child Health Research Institute, Lucile Packard Foundation for Children's Health, and Stanford Clinical and Translational Science Award Program (CTSA) (UL1 TR001085). The study was also partially supported by the National Institutes of Health (NIH) National Institute of Biomedical Imaging and Bioengineering (NIBIB) 3R21EB01761101S1; the David and Lucile Packard Foundation 38454; Child Health Research Institute – Transdisciplinary Initiatives Program, National Science Foundation (NSF) Graduate Research Fellowship Program, and NIH UL1 TR000093 for biostatistics consultation. We thank the Ford Motor Company for supporting this study through the Ford–Stanford research alliance.
Author Disclosure Statement
No competing financial interests exist.
Supplementary Material
Supplementary Materials
References
Supplementary Material
Please find the following supplemental material available below.
For Open Access articles published under a Creative Commons License, all supplemental material carries the same license as the article it is associated with.
For non-Open Access articles published, all supplemental material carries a non-exclusive license, and permission requests for re-use of supplemental material or any part of supplemental material shall be sent directly to the copyright owner as specified in the copyright notice associated with the article.