




Abstract
Spinal cord injury (SCI) has devastating consequences, with limited therapeutic options; therefore, improving its functional outcome is a major goal. The outcome of SCI is contributed to by neuroinflammation, which may be a target for improved recovery and quality of life after injury. Macrophage inhibitory cytokine-1/growth differentiation factor 15 (MIC-1/GDF15) has been identified as a potential novel therapy for central nervous system (CNS) injury because it is an immune regulatory cytokine with neurotrophic properties. Here we used MIC-1/GDF15 knockout (KO) and overexpressing/transgenic (Tg) and wild type (WT) animals to explore its putative therapeutic benefits in a mouse model of contusive SCI. MIC-1/GDF15 Tg mice had superior locomotor recovery and reduced secondary tissue loss at 28 days compared with their KO and WT counterparts. Overexpression of MIC-1/GDF15 coincided with increased expression of monocyte chemoattractant protein-1 (MCP-1)/C-C Motif Chemokine Ligand 2 (CCL2) at the lesion site (28 days post-SCI) and enhanced recruitment of inflammatory cells to the injured spinal cord. This inflammatory cellular infiltrate included an increased frequency of macrophages and dendritic cells (DCs) that mostly preceded recruitment of cluster of differentiation (CD)4+ and CD8+ T cells. Collectively, our findings suggest hat MIC-1/GDF15 is associated with beneficial changes in the clinical course of SCI that are characterized by altered post-injury inflammation and improved functional outcome. Further investigation of MIC-1/GDF15 as a novel therapeutic target for traumatic SCI appears warranted.
Introduction
Spinal cord injury (SCI) has devastating consequences and few efficacious treatment options. The development of strategies that can improve the functional outcome from SCI are therefore a major therapeutic aim. Current therapeutic approaches focus on limiting the loss of, or enhancing the replacement of, spinal cord neurons. 1 –4 As inflammation may retard or perhaps enhance neuronal loss, 5 –9 it has long been seen as a therapeutic target for intervention in SCI. 10 Several immune-modulatory therapeutics including methylprednisolone, dexamethasone, ibuprofen, indomethacin, cyclosporine A, and minocycline have been used, but their efficacy appears limited. 11 –18 One potential reason for this is that these approaches target both harmful and potentially beneficial immune responses in SCI. As inflammatory cells can also produce growth and neurotrophic factors that are associated with favourable outcomes in SCI, 19 –21 a molecule that supports neuronal survival, while beneficially modulating the inflammatory response, might enhance recovery from SCI.
Macrophage inhibitory cytokine-1/growth differentiation factor 15 (MIC-1/GDF15) is a transforming growth factor (TGF)-β superfamily cytokine that acts through a recently identified distant member of the glial cell line-derived neurotrophic factor (GDNF) receptor-α family called “GDNF family receptor α-like” (GFRAL). 22 The biology of this cytokine has been extensively reviewed elsewhere, 23,24 including its multiple roles in cancer, cardiovascular diseases, and obesity, 25,26 where it is mostly anti-inflammatory in animal models. In atherosclerosis, MIC-1/GDF15 regulates macrophage chemotaxis and accumulation via modulation of C-C motif chemokine receptor 2 (CCR2) and intercellular adhesion molecule 1 (ICAM-1). 27,28 It also can reduce pathology by regulating interleukin (IL)-6-dependent inflammatory responses to vascular injury. 29 The anti-inflammatory effects of MIC-1/GDF15 in rheumatoid arthritis 25 and myocardial infarction 30 include modulation of neutrophil accumulation, associated with poorer outcomes in SCI, 31 such that it would be predicted to reduce neutrophil accumulation and potentially benefit recovery from SCI.
Consistent with its anti-inflammatory and/or neuroprotective roles, MIC-1/GDF15 is beneficial in models of central nervous system (CNS) injury. Specifically, it is neuroprotective in low potassium-induced cerebellar granular cell apoptosis in vitro by enhancing the phosphatidylinositol 3-kinase (PI3K)/Akt pathway 32 and inhibiting c-Jun phosphorylation, is a trophic factor in neuronal development, 33 –36 and it plays a possible role in remyelination. 37,38 Increased expression of MIC-1/GDF15 mRNA has been reported following cryoinjury of the cortex in rats, 39 while MIC-1/GDF15 overexpressing mice had less clinical disease and reduced dopaminergic cell loss in a mouse model of Parkinson's disease (6-hydroxydopamine [OHDA] injections). 40 Additionally, local MIC-1/GDF15 treatment accelerates sensory neuron recovery in rats following peripheral nerve injury. 37 The mechanisms behind these effects of MIC-1/GDF15 are not clear; however, a beneficial modulation of the inflammatory response by MIC-1/GDF15 is thought to be a key contributor to these effects.
Considering the effects of MIC-1/GDF15 in CNS injury and other inflammatory diseases, we here sought to characterize its actions on inflammation and injury in traumatic SCI. Our data suggest that MIC-1/GDF15 is associated with enhanced resolution of SCI characterized by altered post-injury inflammation and improved functional recovery.
Methods
Animals
All mice used in this project were bred at Australian BioResources Pty Ltd (ABR), in Moss Vale, NSW, Australia; and then transferred and housed in the Biological Testing Facility (BTF) of the Garvan Institute of Medical Research until the commencement of study. Post-operative animals were placed on a purified soft diet with a nutrient fortified water gel (DietGel Recovery; ClearH2O, Portland, ME). All mice used in this study were females and age-/genotype-matched for surgeries and experiments for each time point. Also, at each day of surgery or experiment a mixed number of different genotypes were used to compensate for any possible sequence variation among groups during experimental procedures for the duration of the study. Investigators assessing mice were blinded to all experimental conditions and data analysis during the study.
Three mouse genotypes, all on a C57Bl/6 background, were studied at 8–9 weeks of age; C57Bl/6 wild type (WT) mice, mice with a germline deletion of the MIC-1/GDF15 gene (MIC-1 KO), and mice overexpressing MIC-1/GDF15 under control of the myeloid cell specific c-fms promoter (MIC-1 Tg) such that they have ∼200-400-fold higher serum levels of MIC-1/GDF15 than WT (p < 0.0001; Fig. S1A). A total number of 93 mice (38, 4 WT; 20, 4 MIC-1 Tg; 22, 5 MIC-1 KO; for flow cytometry, immunohistochemistry [IHC], respectively) were included in the final analysis. Animals were randomly selected for each genotype for IHC. Animals with a deviation of > ± 5 kd from the mean force or > ± 100 μm from the mean tissue displacement were excluded from the experiments at the beginning. Animals that reached ethical end-points during the experiments caused by extended weight loss (i.e. >20%) were also culled at the time and excluded from the experiments: 4 WT, 3 MIC-1 Tg, and 5 MIC-1 KO. An additional 27 (17 WT and 10 MIC-1 Tg) and 29 (8 WT and 21 MIC-1 Tg) animals were used for cytokine estimation and MIC-1/GDF15 serum level analysis, respectively. All animals with SCI that were used for flow cytometry, IHC, and cytokines were included in behavioral assessment. The exact number of animals used for behavioral assessment at days 1/7, 14, 21, and 28 post-injury, respectively were 32, 27, 22, and 16 for MIC-1 KO; 46, 40, 31, and 25 for WT; and 27, 22, 17, and 12 for MIC-1 Tg.
MIC-1/GDF15 serum level
Serum level of MIC-1/GDF15 was measured with R&D System's mouse GDF15 ELISA kit (DuoSet ELISA, Catalog Number: DY6385) as per the manufacturers instructions.
Surgical procedure
Mice were anesthetized by ip injection of a 50/50 mixture of xylazine (10 mg/kg, Troy laboratories Pty limited, Smithfield, Australia) and Zoletil (Tiletamine/Zolazepam; 50 mg/kg, Virbac Australia Pty limited, Milperra, Australia) and subjected to severe traumatic SCI (70 kd) as described previously. 41 In brief, the thoracic vertebra number 10 (T10) was identified based on anatomical landmarks, 42 and then a full T10 dorsal laminectomy was performed to expose the T12 spinal cord segment. Using the Infinite Horizon Impactor (Precision Systems and Instrumentation, LLC, USA), a 70 kd controlled force was applied to the T12 exposed spinal cord segment. The surgery site was rinsed with sterile saline, and paravertebral muscles and superficial fascia on both sides of the incision were sutured with absorbable 5-0 Coated Vicryl sutures (Ethicon) to cover the injury site, the wound was cleaned with saline, and the skin was closed using 9 mm autoclip staples (BD Biosciences). For the sham operations, the mice received all surgical procedures except the application of SCI.
The mean delivered force was: MIC-1 KO mice, 72.1 ± 0.4 kd; WT mice, 72.9 ± 0.2 kd; and MIC-1 Tg mice, 72.8 ± 0.3 kd; with an average spinal cord tissue displacement of 532 ± 10 μm, 529 ± 10 μm, and 541 ± 8 μm respectively, which was not statistically significant among genotypes (p ≥ 0.5; Fig. S1B). These data show that any differences in SCI outcomes among genotypes did not result from variation in injury force or displacement among mice.
Pre and post-operative care
Post-operative care included subcutaneous (SC) administration of a single dose of Hartmann's solution (25 μL/g, Baxter Australia) prior to surgery for possible dehydration during surgery, prophylactic SC dose of gentamycin (1 mg/kg, Troy laboratories Pty limited, Smithfield, Australia) prior to and post-surgery for 5 days, and SC buprenorphine (0.1 mg/kg, Symbion pharmacy) twice daily for 72 h following surgery. The bladder was manually expressed twice daily until the end of the experiment. All mice that had SCI had manipulation of the tail excluded from handling procedures.
Behavioral assessment
We used the Basso Mouse Scale (BMS) scoring system to assess locomotor recovery after spinal cord injury. 43 For locomotor functional analysis we also used sham-operated mice as controls, to exclude the possible incidental effects caused by incisional trauma during laminectomy or vertebrate fixation. To assess the effects of injury, mice were scored independently by two blinded assessors prior to surgery and at 1, 7, 14, 21, and 28 days post-injury/surgery (dpi).
Antibodies
Antibodies used in this study are detailed in Tables 1 and 2. All flow cytometry antibodies were used at 1 μL/106 cells/100 μL concentration.
List of Antibodies Used for Flow Cytometry
RRID, research resource identifier.
List of Antibodies Used for Immunohistochemistry
RRID, research resource identifier.
Tissue collection
Mice were euthanized at days 7, 14, 21, and 28 dpi. The mice were perfused with either phosphate-buffered saline (PBS) alone or PBS followed by 4% paraformaldehyde (PFA) for flow cytometry and immunohistochemistry, respectively, and the entire spinal cord tissue was collected.
Isolation of spinal cord cells
The entire spinal cord, from the base of the conus medularis, was dissected and the tissue was cut in small pieces and digested with DNAase and collagenase at 37°C for 30–45 min. The tissue then was homogenized by passing through 70 μm sieves, and mononuclear cells were separated in 30% and 60% Percoll gradients. The lipid/cellular layer on the top was discarded and the interface containing the mononuclear cells was collected. After manual enumeration using a hemocytometer, the cells were stained with different antibodies (Table 1) and labelling characteristics were quantified using an LSR II flow cytometric instrument with appropriate control samples. These events were analyzed using FACSDiva software (BD Biosciences). This experiment was repeated at least three times for each time point. The exact numbers of animals used here were MIC-1 KO: 6 for days 7, 14, and 21, and 4 for day 28; WT: 8 for day 7, 11 for day 14, 8 for day 21, and 11 for day 28; MIC-1 Tg: 4 for day 7, 5 for days 14 and 21, and 6 for day 28.
Phenotyping cells by flow cytometry
The flow cytometric data was analysed with FlowJo (v887) and different cell populations were characterized based on the gating strategies in Figure 1. The spinal cord mononuclear cell phenotyping was performed to determine the proportion of microglia (CD45intCD11b+), CD11c+ microglia (CD45intCD11b+CD11c+), total infiltrated leucocytes (CD45hi), macrophages (CD45hiCD3–CD11c−CD11b+ B220–), B cells (CD45hiCD3–CD11c−CD11b−B220+), T cells (CD45hiCD3+), CD4+ T cells (CD45hiCD3+CD4+CD8-), CD8+ T cells (CD45hiCD3+CD4–CD8+), DCs (CD45hiCD3–CD11c+), pDCs (CD45hiCD3–CD11b−B220+CD11c+/dimmPDCA-1+), mDCs (CD45hiCD3–CD11c+CD11b+), CD8α DCs (CD45hiCD3–CD11c+CD11b−CD8α+), and CD11c+B220+ cells (CD45hiCD3–CD11c+CD11b−CD8α-mPDCA-1-B220+).
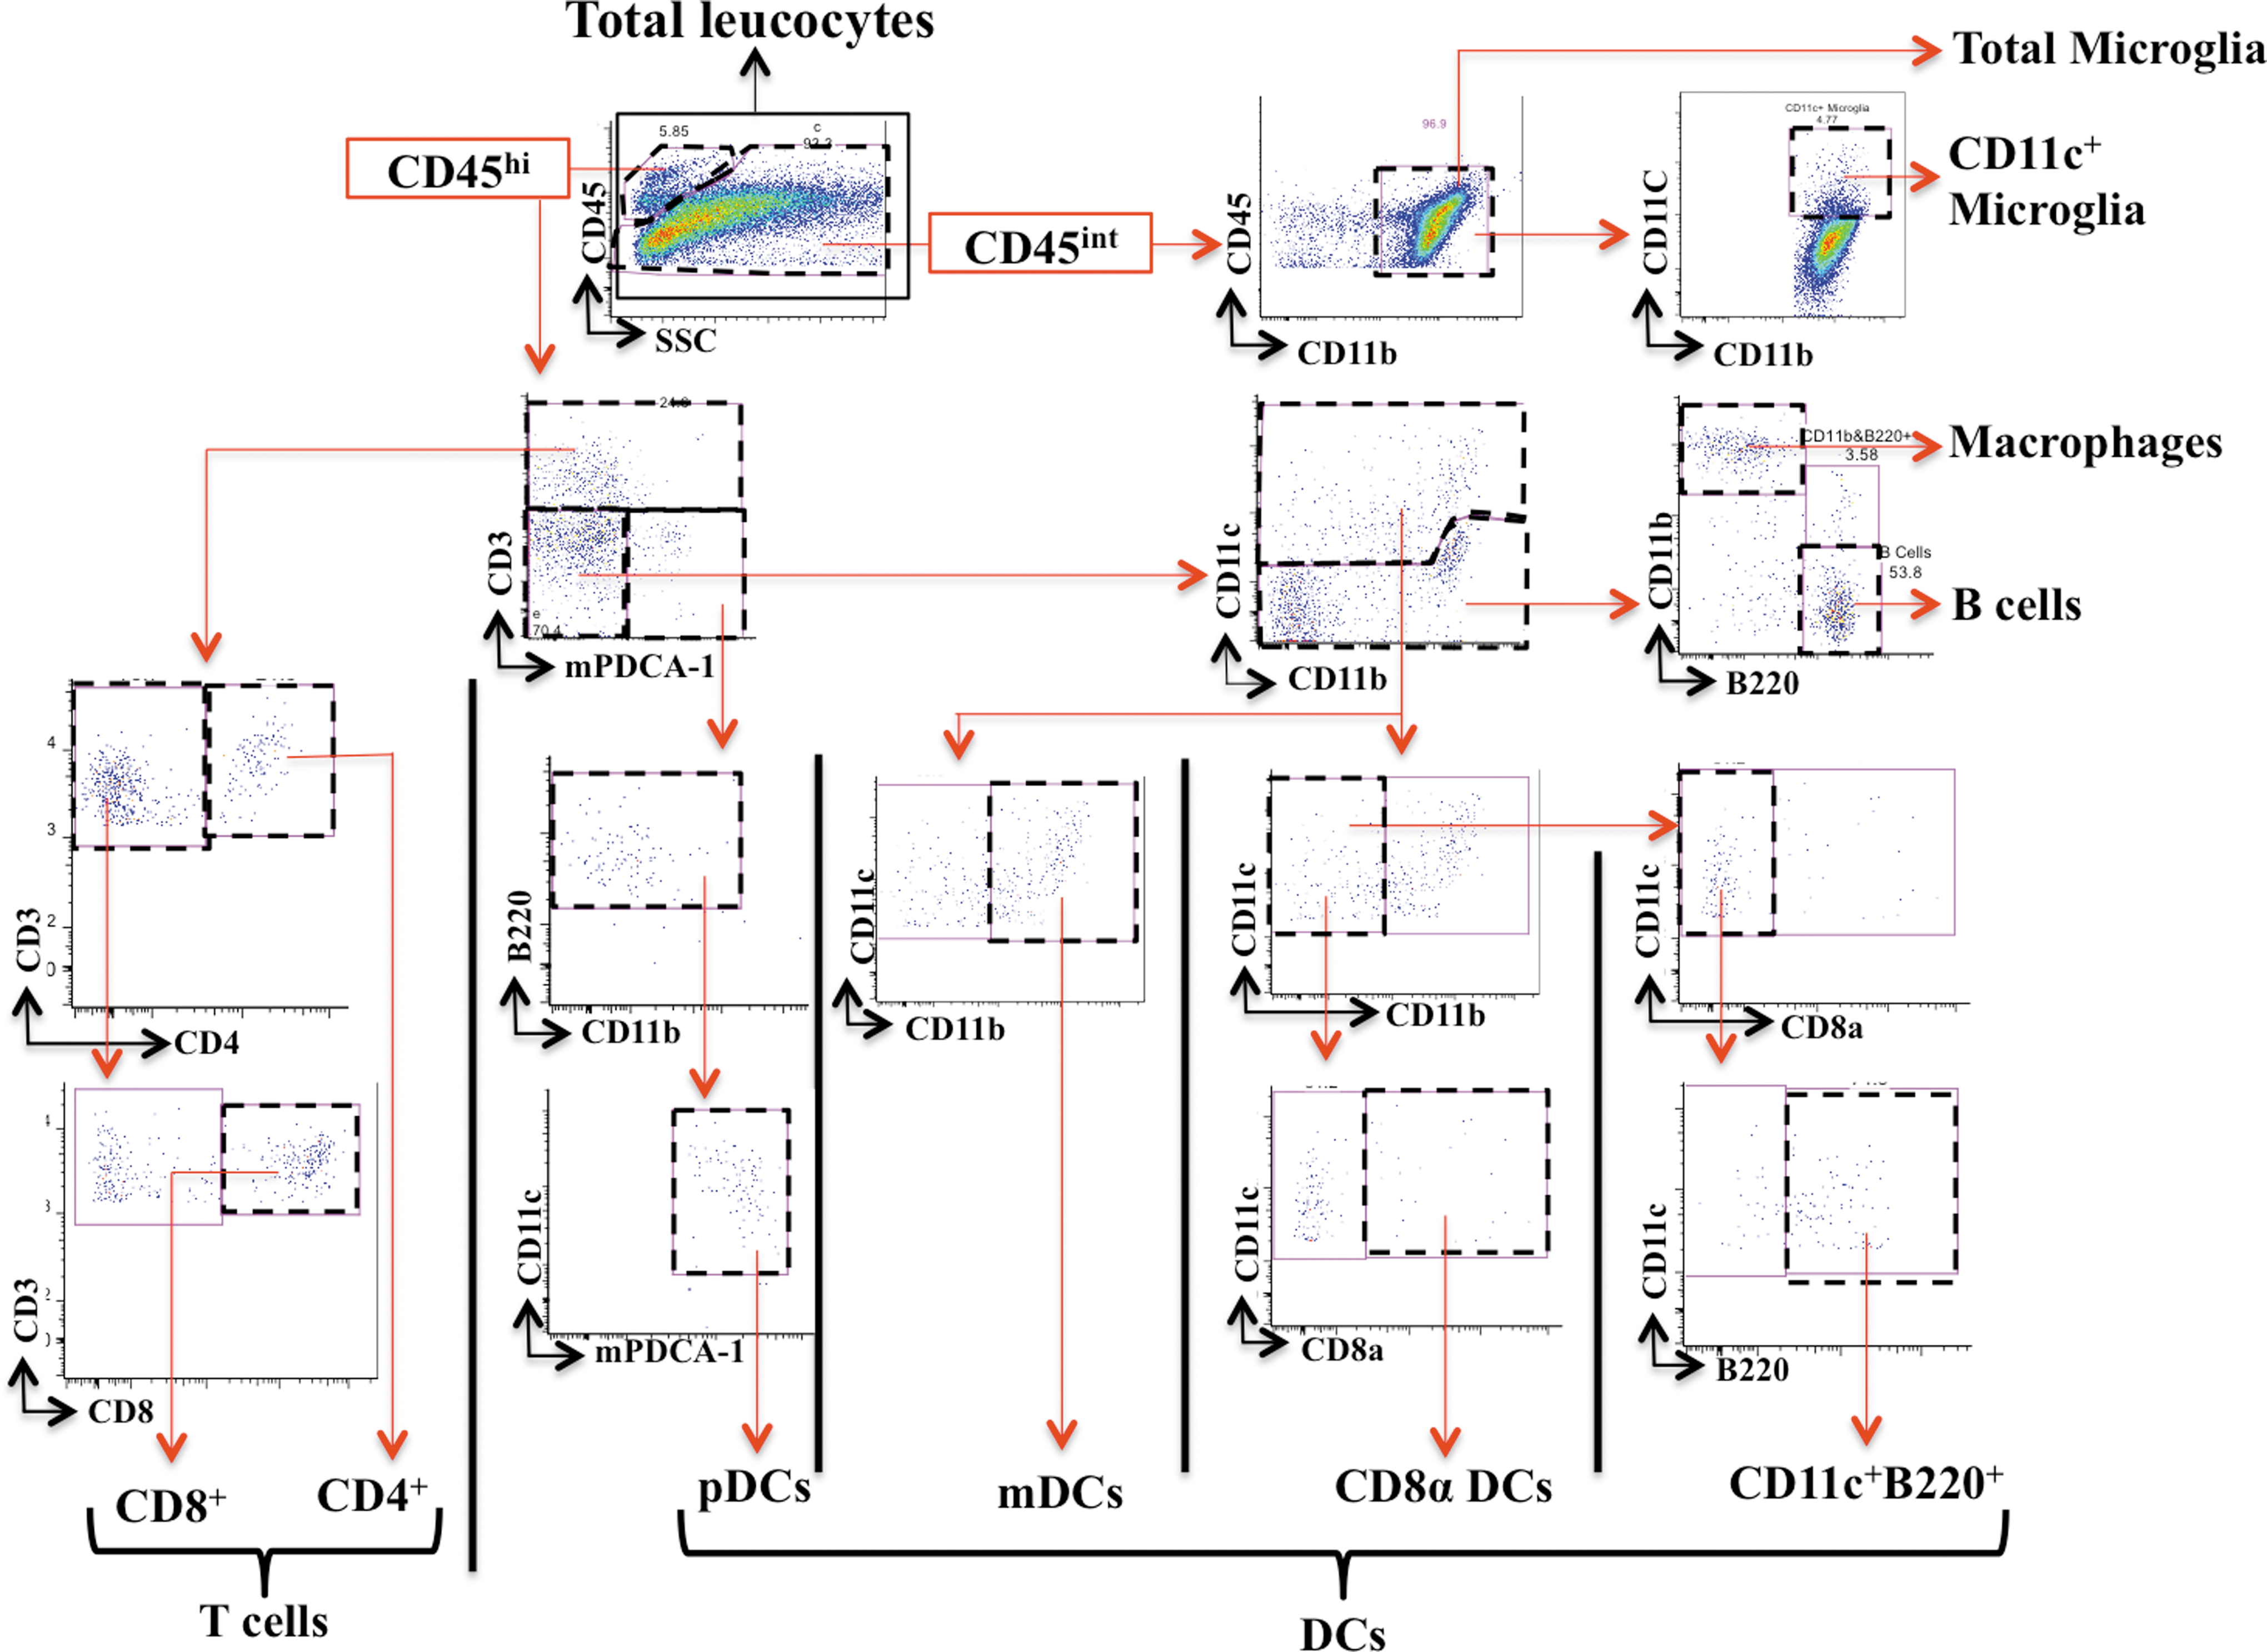
Gating strategy for the cells extracted from the whole spinal cord. Color image is available online.
Because the infiltrating inflammatory cells (e.g. CD3+ and CD11c+ cells) were mainly localized in or around the injury site, it was difficult to control for variation in isolation of cells of interest. Therefore, we used the entire spinal cord for flow cytometry analysis and used microglia as a measure of cell isolation efficiency (discussed subsequently). Inflammatory cell populations that were isolated from the entire spinal cord were characterized by flow cytometry, and their absolute numbers and proportions were determined. We first determined the percentage of each population in proportion to total spinal cord leucocytes (Fig. 1). As we had already manually counted number of total isolated leucocytes using a hemocytometer (absolute numbers), we determined the absolute number of each population using the percentage equation. Based on this, we first determined the absolute number of microglia. To account for variable cell loss during isolation procedures, the absolute number of each infiltrating cell population was normalized to microglia numbers (as microglia were the most abundant cell isolated, were largely equally distributed across the entire spinal cord, and their absolute numbers in the entire spinal cord did not vary in relation to injury severity). The normalization to microglia was performed for each cell population and for each genotype separately, to account for possible genotype to genotype variation in microglial frequency. For normalization to microglia, we determined the normalization factor by comparing the absolute number of microglia of each sample to the highest number of microglia in that genotype group. We then multiplied the absolute number of each cell type in that sample by this normalizing factor. For example, if we had 100,000 microglia in sample A (the highest number of microglia for that genotype) and 50,000 in sample B, the scaling factor for sample B would be 100,000/50,000; that is, 2. Here, if there were 20,000 DCs in sample A and 10,000 in sample B, the absolute normalized DC number for sample B would be 10,000 × 2 = 20,000, which in this case would be the same as the DC number in sample A (20,000 × 100,000/100,000 = 20,000).
Cryosectioning
The injured section of the spinal cord tissue was dissected and post-fixed in fresh 4% PFA for 24 h. The tissue was then placed in 15% sucrose and kept overnight, snap-frozen, with dry ice, in OCT compound (ProSciTech, Thuringowa Central, QLD, Australia), and kept at -80° until sectioning. Twenty μm thick transverse serial sections in 1:5 series were cut in Leica CM1950 cryostat (Leica Biosystems) and immediately mounted on superfrost plus slides (Thermo Fisher Scientific, Scoresby, VIC, Australia). Slides were dried at room temperature for 2 h and stored at -80° until further analysis.
IHC
The slides were kept at room temperature for 1 h to dry. The sections were quenched in 10% methanol/2% H2O2 (Sigma-Aldrich) for 30 min followed by incubation in sodium borohydride (Sigma-Aldrich) for 7 min. Sections were incubated with 2% normal serum from the species that the secondary antibody was generated in for 1 h, in combination with 0.3% Triton X-100 (Sigma-Aldrich). Slides were then incubated with primary antibodies in a humidified chamber overnight. The following day, slides were washed and then treated with biotin conjugated secondary antibody for 1.5 h followed by incubation with avidin-biotin complex formation using Vectastain Elite ABC Kit (Cat no: PK-6100, Abacus ALS Australia) for 1 h at room temperature. The reaction was developed in 3,3-diaminobenzidine (DAB; Cat No: D5637-5G, Sigma-Aldrich Pty Ltd, Australia) and nickel ammonium sulphate (Cat No: A1827, Sigma-Aldrich Pty Ltd, Australia). When the desired development was achieved, the reaction was stopped in sodium acetate (Sigma-Aldrich) and the slides were washed and dehydrated in an ascending alcohol gradient and, finally, xylene, prior to cover-slipping.
Imaging
IHC-stained sections were imaged with a Leica DM 4000 microscope equipped with DFC450 camera and Leica Application Suite (LAS) software (Leica Microsystems). All images were analyzed with ImageJ/Fiji software.
Tissue sparing analysis
Serial sections of the injury area were labelled for glial fibrillary acidic protein (GFAP) and this was used to determine the injury core/lesion (GFAP negative) and spared tissue (GFAP positive) as described previously. 44 This analysis was performed for the rostral and caudal extent of the injury at 0, 200, 400, 600, 800, and 1000 μm from the injury epicenter, which was determined by the largest GFAP negative area. The percentage of spared tissue was calculated in relation to the total cord area in each section/image, using area measurement analysis function in ImageJ.
CD3+ cells quantification
The number of CD3+ cells in the injury epicenter was quantified in IHC images. Using ImageJ, the injury epicenter was determined based on GFAP negative stain (section 2.12) and the epicenter area was outlined and measured. The number of CD3+ cells within the injury epicenter for each data point was manually counted by three blinded examiners, and the average was considered to be the final CD3+ cell count (expressed as number of CD3+ cells/mm2).
CD11c+ cells analysis
CD11c+ cell density in the injury epicenter was measured using ImageJ software (Fiji). The images were acquired from CD11c stained serial sections (20 μm thick) of the SCI site at 200 μm intervals from the epicenter, as was performed for tissue sparing analysis. The images were first converted to 8 bit (gray scale) and auto-adjusted for brightness and contrast. Both the injury core and the lateroventral area (surrounding the core) were selected separately using the polygon selection tool as the area of interest. Both of these areas were thresholded in ImageJ separately and the percentage of threshold area in proportion to the total region of interest (core or lateroventral areas respectively) was calculated using ImageJ threshold function.
Cytokines quantification
Mice underwent SCI and were euthanized with overdose of anesthetics (Zoletil and xylazine 50/50 mixture) at 28 dpi. The spinal cord was immediately dissected at one segment above and one segment below the injury area (T11–13) and snap-frozen in liquid nitrogen and kept at -80° until homogenized.
For homogenization, the frozen samples were first weighed and then ground to fine powder using a pre-cooled mortar on dry ice. The tissue powder was then dissolved in 200 μL of NP-40 lysis buffer (Invitrogen) containing 1 mM phenylmethylsulfonyl fluoride (PMSF) reconstituted in DMSO (Sigma-Aldrich), 92.6 μM FUT175 (BD Bioscience), and 5 μL of protease inhibitor cocktail (Sigma-Aldrich) that was prepared earlier at room temperature. Samples were vortexed for 1 min and then incubated at 4°C for 1 h. They were centrifuged at 13,000g for 30 min at 4°C to split the sample into cell lysate on the top layer, and cell membrane debris on the bottom layer. The supernatant from the top of the sample was pipetted and stored as 20 μL aliquots in the -80°C freezer. The protein content of the spinal cord homogenate was determined using a BCA assay (Thermo Fisher Scientific,Catalog Number 23227) according to the manufacturer's instructions. Mouse inflammation kit (Cytometric Bead Array, BD Biosciences, Catalog Number 552364) was used to determine levels of IL-12p70, tumor necrosis factor (TNF)α, interferon (IFN)γ, monocyte chemoattractant protein-1 (MCP-1), IL-10, and IL-6 as per the manufacturer's instructions. Samples were diluted such that they were detected within the linear aspect of the standard curves. Samples were analysed on an LSRII flow cytometer (BD Biosciences), and concentrations were computed using FCAP array version 3.0 software. Cytokine concentration was normalized to the total protein content of each sample.
Statistical analysis
All analysis was performed with GraphPad Prism software (versions 6 and 7, La Jolla, CA). One-way analysis of variance (ANOVA) with non-parametric Kruskal–Wallis test, two-way ANOVA with Tukey test, and Mann–Whitney U test were used to determine statistical significance. All data are presented as mean ± standard error of the mean (SEM) and the statistical significance was defined as p < 0.05.
Results
Overexpression of MIC-1/GDF15 improved functional recovery from SCI
Hindlimb function and overall locomotor ability for MIC-1 KO, WT, and MIC-1 Tg mice were assessed in an open field as a measure of neurological recovery (BMS scores) following traumatic SCI. 43 All mice were fully ambulant prior to surgery, with each animal receiving a maximum BMS score of 9 (data not shown). Near complete hindlimb paralysis (BMS scores: 0–1) was observed for all mice irrespective of their genotype at 1 day post SCI. MIC-1 Tg mice regained substantially more hindlimb locomotor function during the subacute phase of SCI, achieving significantly higher BMS scores than both WT and MIC-1 KO mice from 7 days post-injury onwards (p < 0.05; Fig. 2 A, B). Loss of MIC-1 itself did not affect the neurological outcome from SCI (p > 0.05) relative to WT mice. We performed a two way ANOVA with repeated measures of only the mice that survived to 28 dpi, which also showed significantly higher BMS scores for MIC-1 Tg than for WT and MIC-1 KO at all time points of 7, 14, 21, and 28 dpi (p ≤ 0.0001). Sham-operated mice (i.e., laminectomy only) retained full locomotor abilities in the open field (BMS scores: 8.96 ± 0.04 at 1 dpi, and 9 thereafter; data not shown). Key biomechanical parameters of SCI severity were not different among groups (see Methods, Surgical procedure; Fig. S1B), and, therefore, were not a confounding factor in relation to differences in outcomes among genotypes.

Macrophage inhibitory cytokine-1 (MIC-1) transgenic (Tg) mice have superior functional recovery and reduced injury after spinal cord injury (SCI).
MIC-1/GDF15 overexpression attenuates secondary tissue loss after SCI
We next quantified the extent of spinal cord tissue loss among strains, at and around the lesion site, at 28 dpi. Consistent with their improved neurological outcome, MIC-1 Tg mice showed significantly greater tissue preservation across the injured segment of the spinal cord than WT and KO mice (p < 0.05; Fig. 2 C,D). No such differences were observed between WT and MIC-1 KO mice. Together, these results demonstrate that overexpression, but not loss, of MIC-1/GDF15 improved tissue sparing and locomotor recovery after SCI.
Overexpression of MIC-1/GDF15 coincides with increased leukocyte presence in the injured spinal cord
To determine the effect of MIC-1/GDF15 on leukocyte recruitment after SCI, whole spinal cords were isolated and processed for flow cytometry. We first determined the frequency of microglia (CD45intCD11b+) and total peripherally derived (i.e. CD45hi) immune cells (Fig. 1), defining this as 100% of CD45+ cells. Although the proportion of microglia decreased slightly, over time, there was no significant difference in the percentage of microglia among WT, MIC-1 KO, and MIC-1 Tg groups at any time points investigated (i.e., 7, 14, 21, and 28 dpi; Fig. 3A). On the other hand, the percentage of CD11c+ microglia significantly increased in all genotypes from 7 to 28 dpi (p ≤ 0.0003); however, there was no significant difference in its proportions among MIC-1 KO, WT, and MIC-1 Tg mice (Fig. S2A).
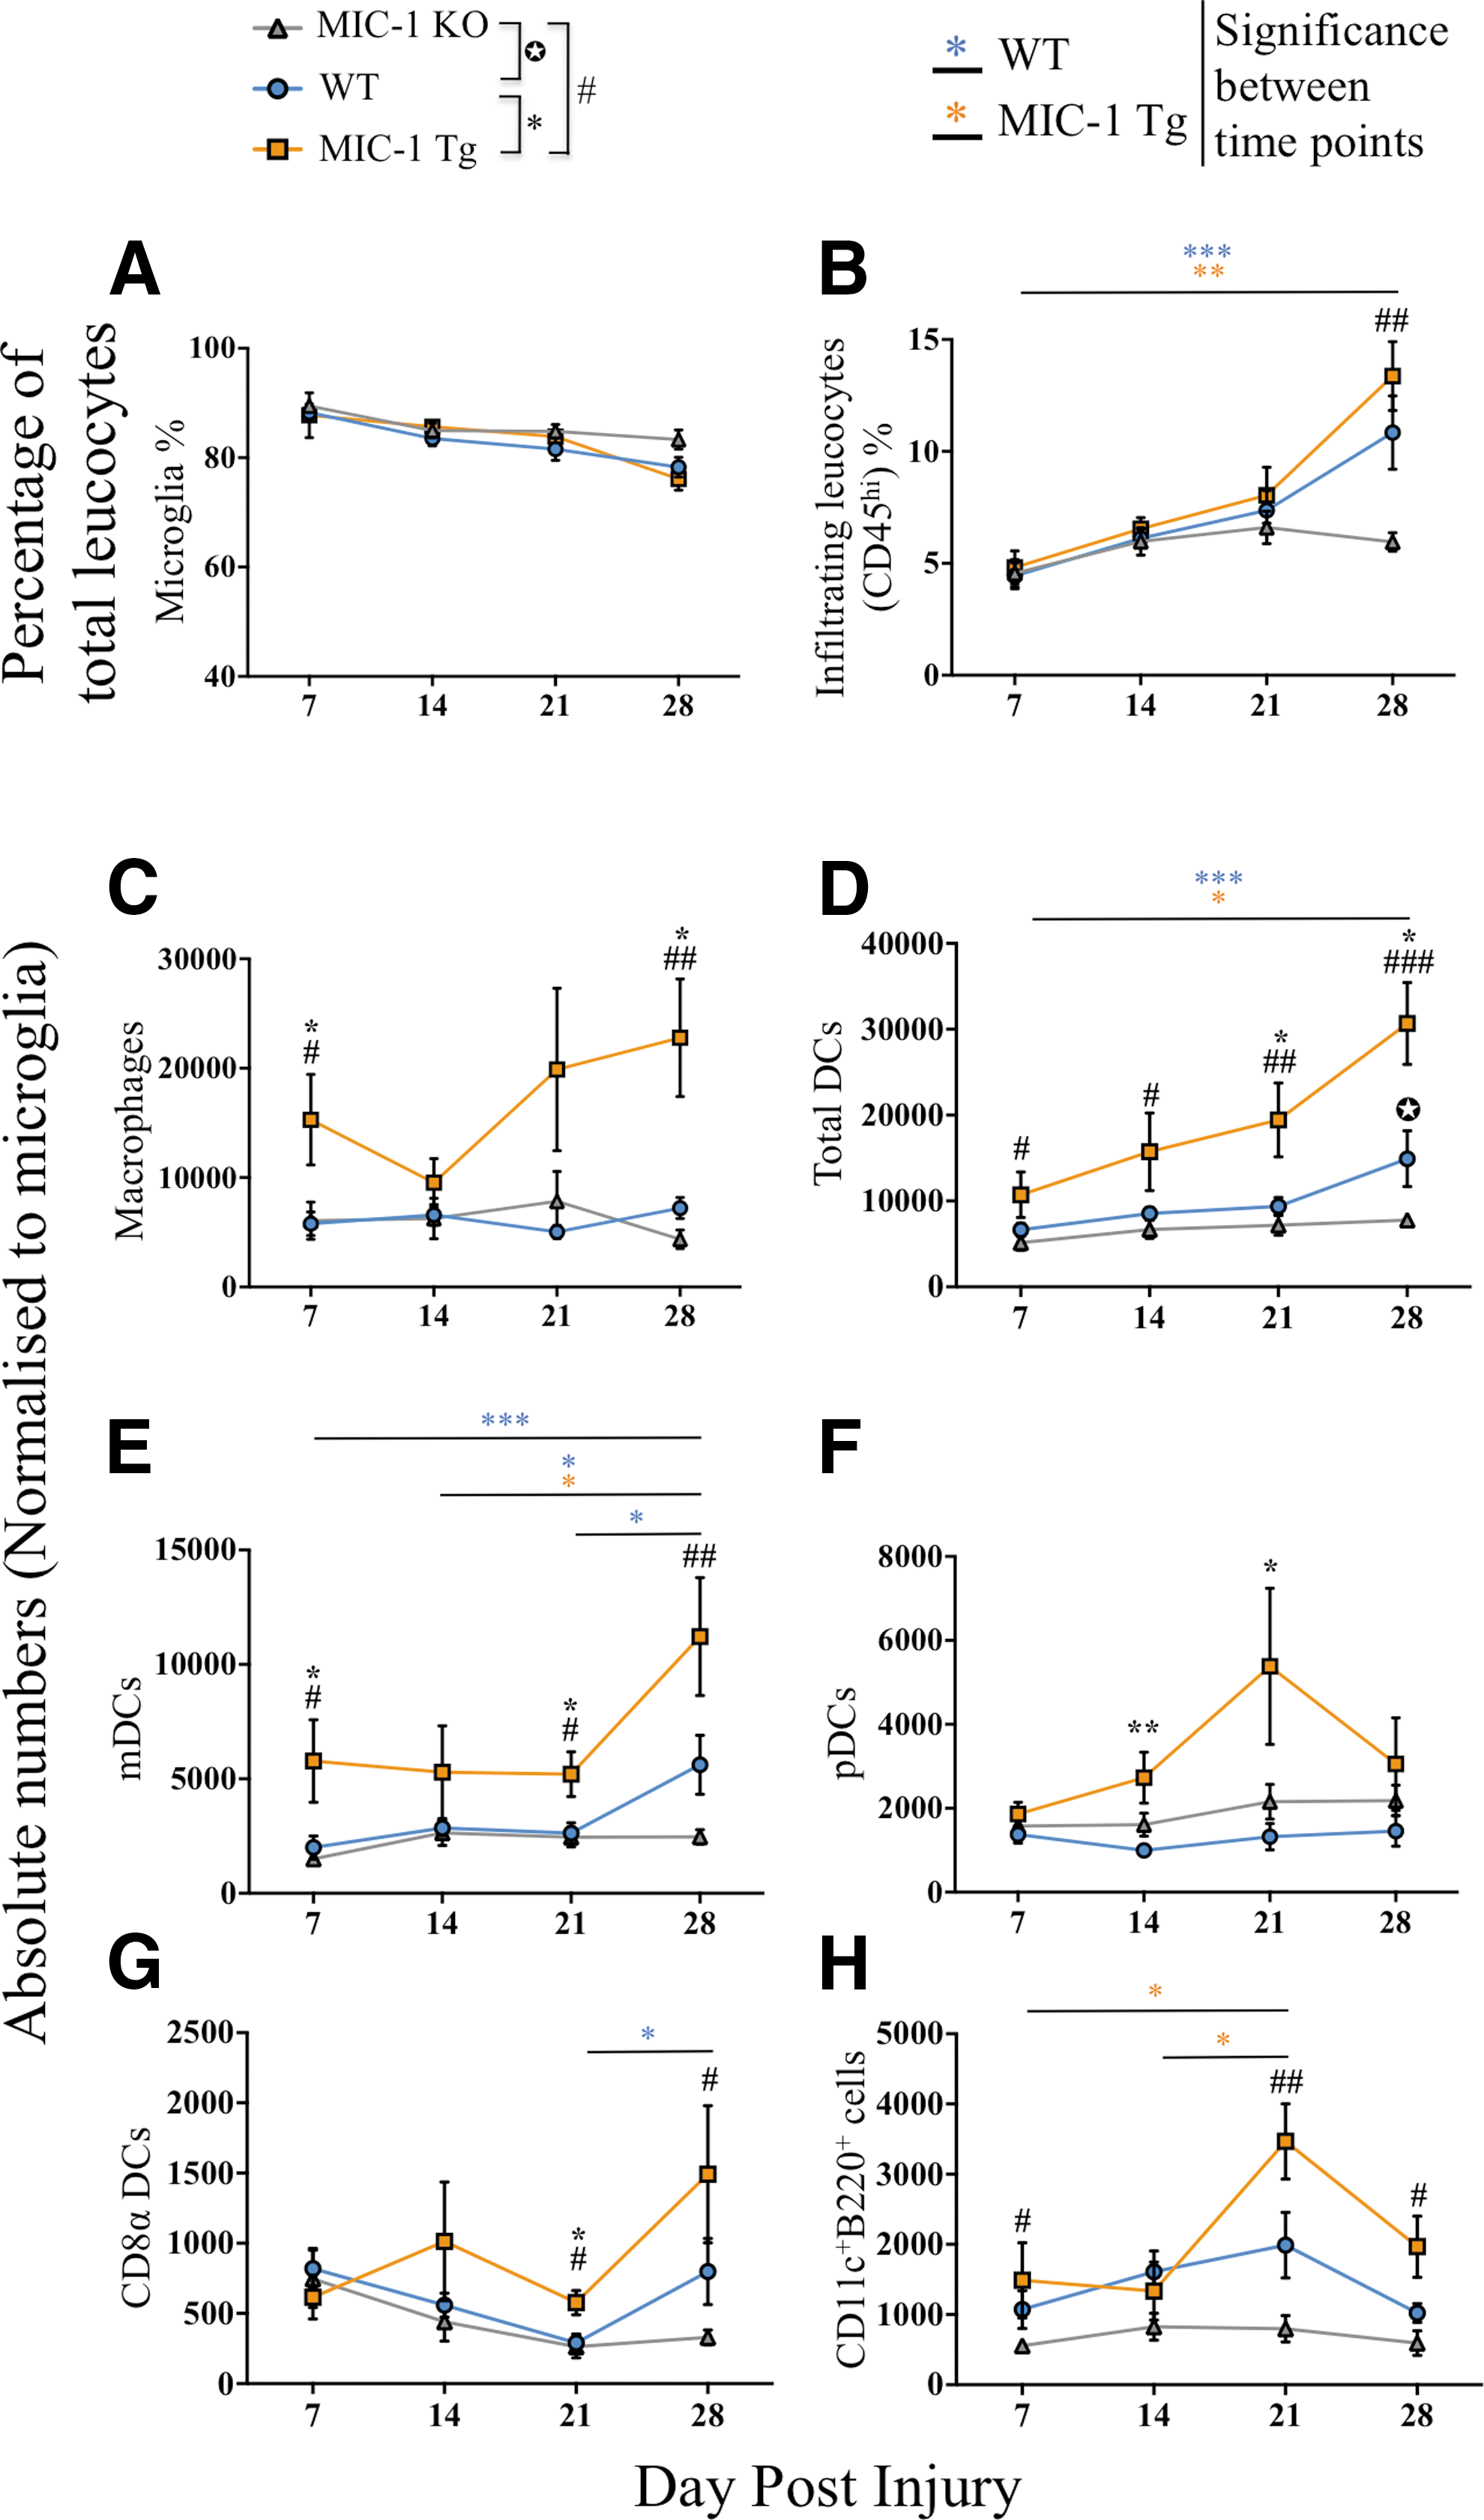
Macrophage inhibitory cytokine-1/growth differentiation factor 15 (MIC-1/GDF15) overexpression is associated with increased infiltration of peripheral leucocytes including macrophages and dendritic cells (DCs) after spinal cord injury (SCI).
The relative proportion of infiltrating immune cells, defined as CD45hi, increased between 7 and 28 dpi by 143% in WT, by 177% in MIC-1 Tg, and by 30% in MIC-1 KO mice. Although a lack of MIC-1/GDF15 did not alter neurological or histopathological outcome measures as compared with WT following SCI, the relative increase in the proportion of infiltrating leukocytes was significantly attenuated in MIC-1 KO mice during the more chronic phase of SCI (28 dpi) compared with MIC-1 Tg mice (p = 0.006, Fig. 3B).
Overexpression of MIC-1/GDF15 increased the number of infiltrating macrophages and CD11c+ DCs after SCI
We next performed a flow cytometric analysis of the myeloid cell infiltrate between strains, at 7, 14, 21, and 28 dpi, focusing in particular on cells phenotyped as macrophages (CD45hiCD3–CD11c−CD11b+B220–), the DC population as a whole (i.e., CD45hiCD3–CD11c+ cells), and then also mDC, pDC, and CD8α+ DC subsets. Overall, MIC-1 Tg mice had an increase in macrophages and DC spinal cord content compared with both WT and MIC-1 KO mice (Fig. 3C,D; p < 0.05). No such temporal increase was seen in MIC-1 KO mice. In fact, the total number of DCs in MIC-1 KO mice was significantly below that of their WT (p = 0.03) and MIC-1 Tg (p = 0.0002) counterparts at 28 dpi (Fig. 3D).
Macrophages in MIC-1 Tg mice increased at 7, dropped at 14, and then increased at 21 and 28 dpi, whereas in WT and KO mice, their numbers did not significantly change from 7 to 28 dpi (Fig. 3C). Macrophage numbers were significantly higher in MIC-1 Tg than in WT and KO mice at 7 and 28 dpi (p ≤ 0.02, Fig. 3C). Further, the CD11c median fluorescence intensity (MFI) on CD45hiCD11b+CD11c+ cells (possibly CD11c+ macrophages or DC) was higher in MIC-1 Tg mice than in WT at 14, 21, and 28 dpi, but this was not statistically significant (p > 0.05; Fig. S2B).
For DC subset analysis, mDCs were defined as CD45hiCD3–CD11c+CD11b+ cells, pDCs were defined as CD45hiCD3–CD11b−B220+CD11c+/dimmPDCA-1+ cells, and CD8α+ DCs were defined as CD45hiCD3–CD11c+CD11b−CD8α+ cells. We also looked at the CD11c+B220+ population that was made up of CD45hiCD3–CD11c+CD11b−CD8α-mPDCA-1-B220+ cells and had also been previously characterized as pDCs. 45
The number of mDCs in the injured spinal cord was higher in MIC-1 Tg mice at all time points (Fig. 3E), and significantly above that of WT mice at 7 and 21 dpi (p ≤ 0.03). mDCs were also significantly higher in MIC-1 Tg than in KO at 7, 21, and 28 dpi (p ≤ 0.03). They also increased over the course of SCI in WT and MIC-1 Tg mice over the course of injury (p < 0.05; 14 vs. 28 dpi), whereas they did not change in frequency in MIC-1 KO mice over the same time period. The pDC frequency in the injured spinal cord differed from that of mDCs in that their numbers were similar among genotypes and did not change over time, except in MIC-1 Tg, in which a spike in pDC numbers was observed at 21 dpi that was not statistically significant (p < 0.09 compared with 7 dpi; Fig. 3F). pDC numbers were significantly higher in MIC-1 Tg than in WT at 14 (p = 0.006) and 21 dpi (p = 0.01). The presence of CD8α+ DCs over the experimental time course was more akin to that of mDCs, in that it was significantly increased in MIC-1 Tg animals compared with both WT and KO at 21 dpi (p ≤ 0.04), and in MIC-1 Tg compared with KO at 28 dpi (p = 0.02; Fig. 3G). Within each group, the number of CD8α+ DCs did not change significantly over time, except in WT mice, in which an increase was seen between 21 and 28 dpi (p = 0.03; Fig. 3G). Lastly, the temporal changes in CD11c+B220+ DC frequency in the injured spinal cord was similar to that of pDCs, in that a significant spike in their numbers was observed at 21 dpi in MIC-1 Tg compared with 7 and 14 dpi (p < 0.05; Fig. 3H); no such difference was seen in WT and MIC-1 KO mice. The number of CD11c+B220+ DCs was significantly greater in MIC-1 Tg mice than in MIC-1 KO at 7 (p = 0.02), 21 (p = 0.001), and 28 dpi (p = 0.02), whereas MIC-1 KO mice had fewer of these cells than WT (Fig. 3H).
Taken together, these results indicated that increased expression of MIC-1/GDF15 is associated with a substantial increase in the number of macrophages and DCs that infiltrated the lesioned spinal cord, particularly during the more chronic phase of injury, and that this difference was contributed to by increased mDCs, pDCs (including CD11c+B220+ cells), and CD8α+ DCs during the subacute and intermediate phase of SCI. On the other hand, a lack of MIC-1/GDF15 appeared to be associated with attenuated recruitment of macrophages and DC.
Transgenic expression of MIC-1/GDF15 leads to an increase in CD11c+ cell density in and around the spinal cord lesion site
To confirm the anatomical distribution and flow cytometry results, we next determined CD11c+ cell density in the injured spinal cord by IHC. CD11c-expressing cells were readily identified within the lesion core as well as the spared ventrolateral white matter surrounding it (Fig. 4A,B). Spatial quantification of CD11c+ cell density across the injured segment of the spinal cord further confirmed an increased presence of CD11c+ density in the lesion core of MIC-1 Tg mice (p < 0.05; Fig. 4C), and immediately surrounding tissue (p < 0.05; Fig. 4D), compared with both WT and KO mice (Fig. 4E,F). Together, these results confirm that transgenic expression of MIC-1/GDF15 is associated with an increased density of CD11c+ in the spinal cord at 28 dpi, and provide an anatomical context as to the location of these cells.
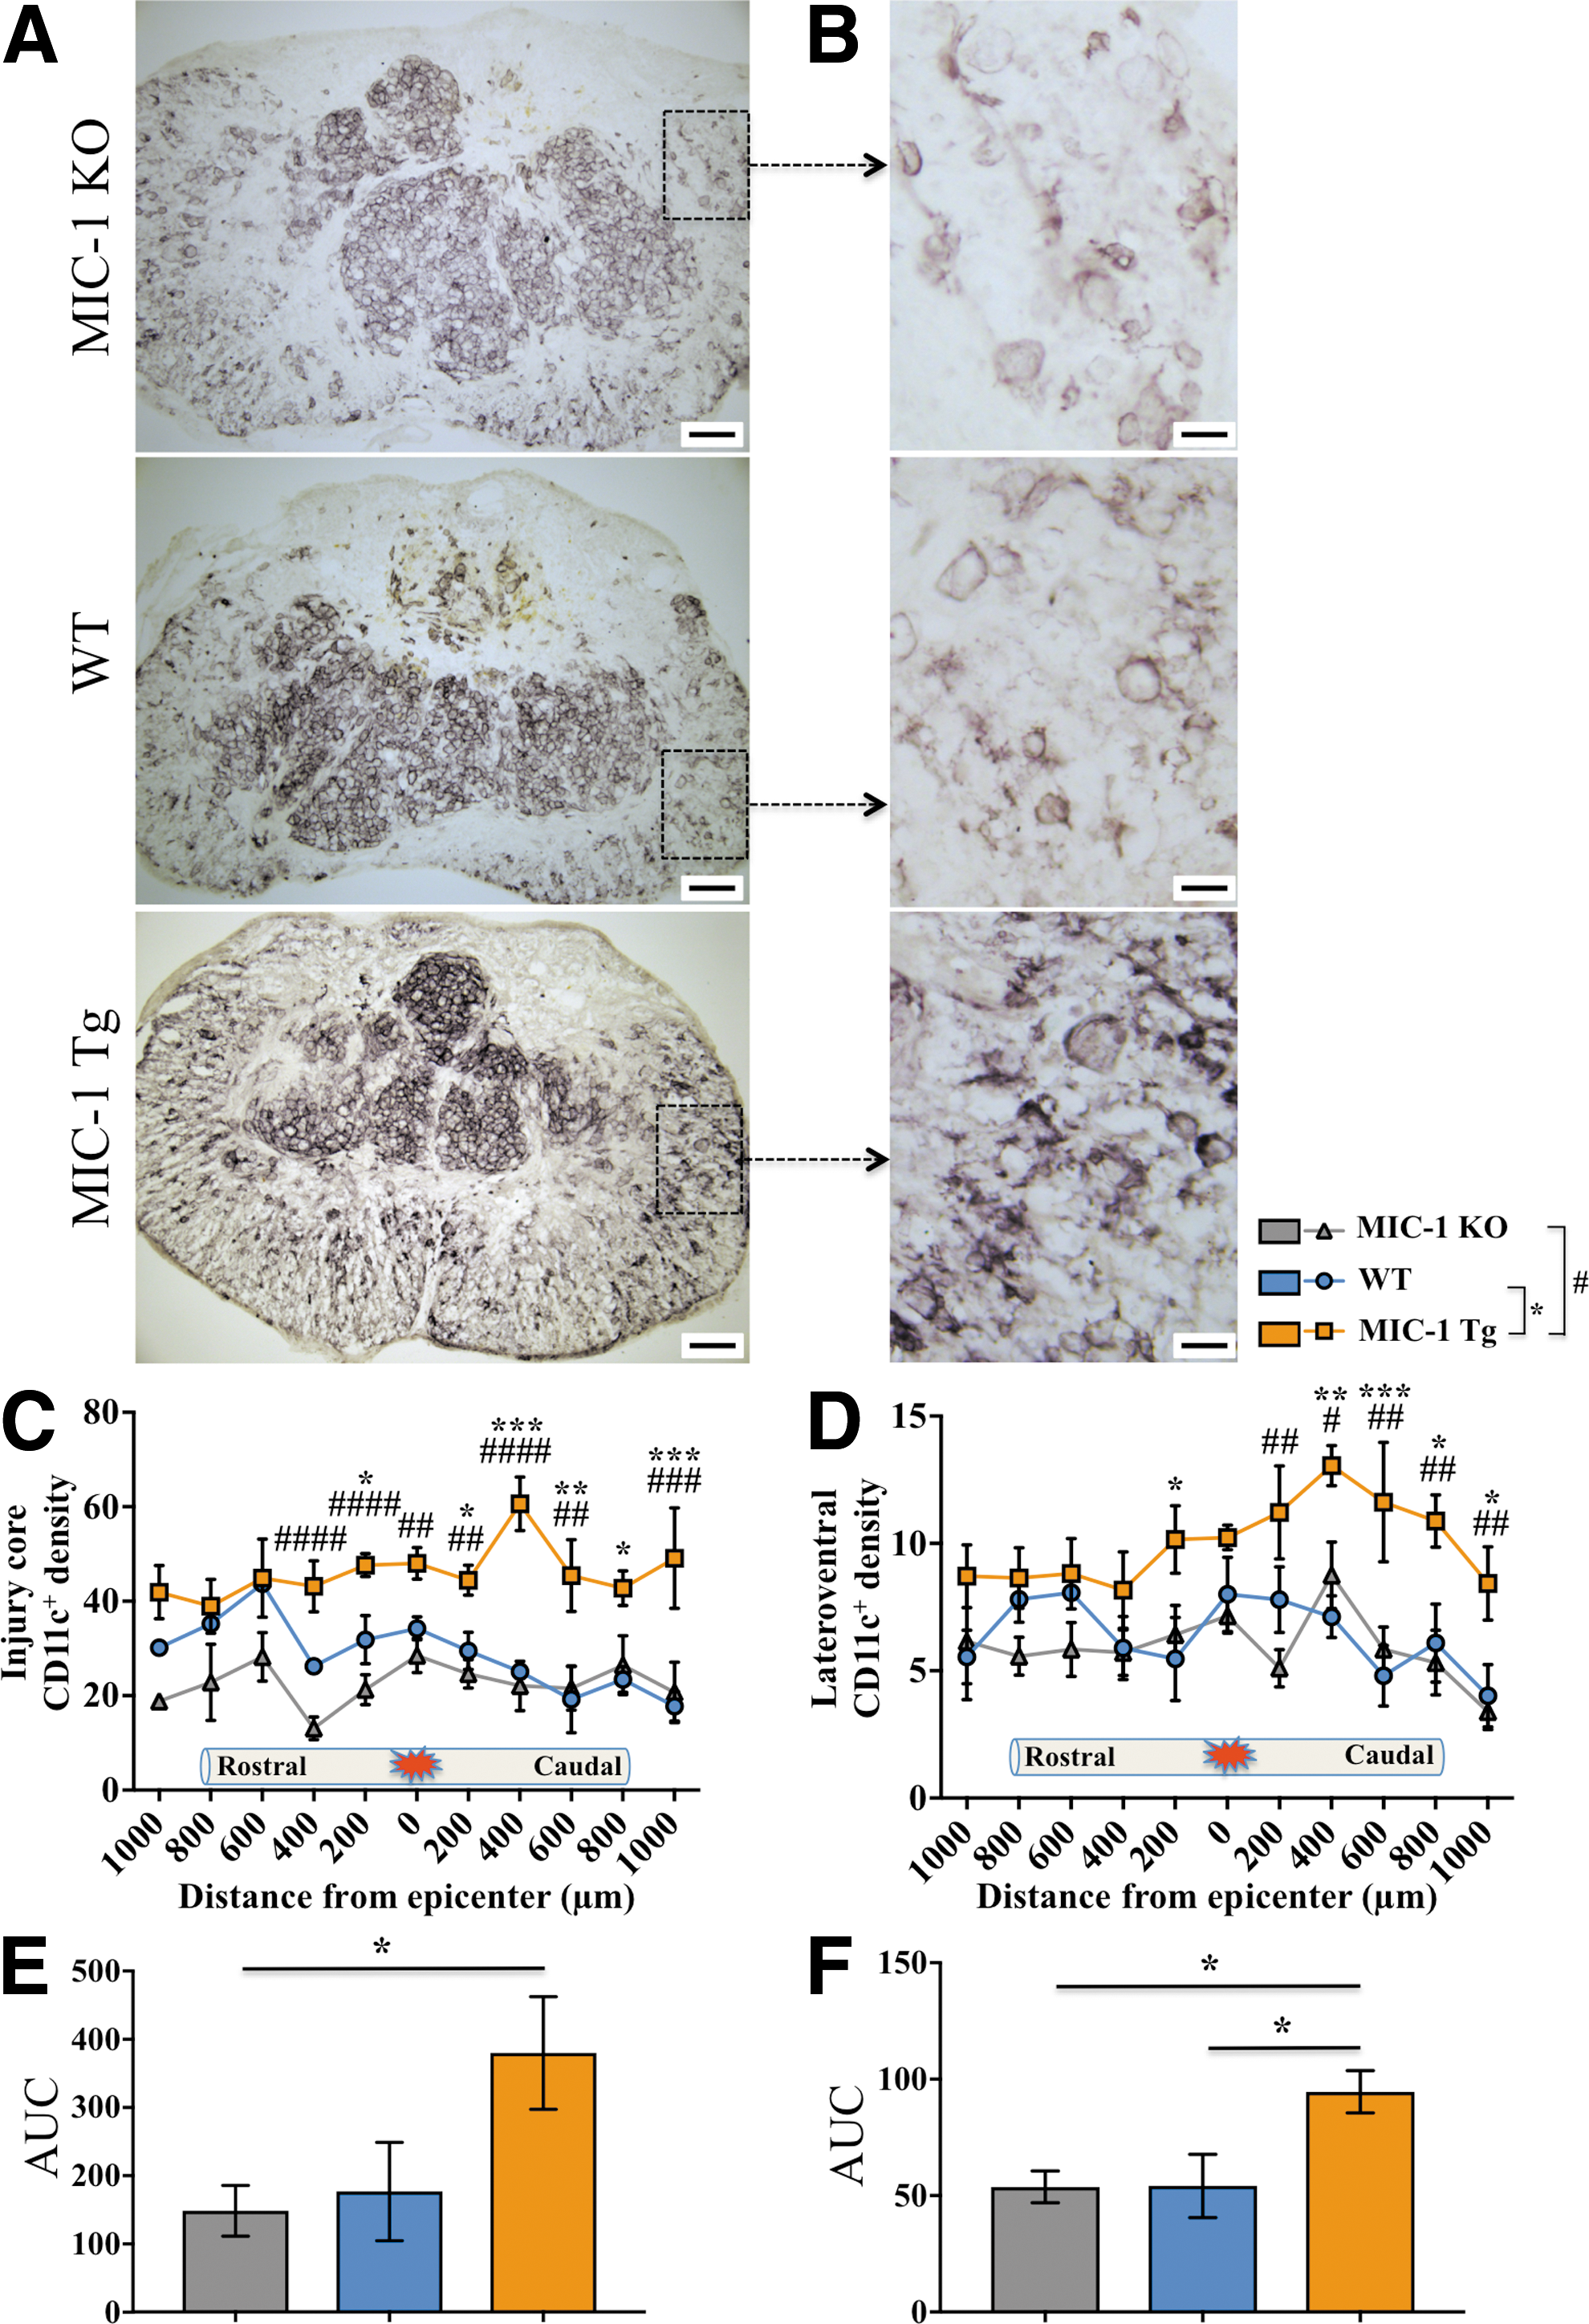
Macrophage inhibitory cytokine-1/growth differentiation factor 15 (MIC-1/GDF15) overexpression increased the CD11c+ labeling density at the spinal cord injury area at 28 days post-injury (dpi).
MIC-1/GDF15 overexpression correlates with T cell presence during the chronic phase of SCI
Because transgenic overexpression of MIC-1/GDF15 enhanced DC presence in the injured spinal cord, we also sought to determine whether T cell numbers were similarly affected. The numbers of CD3+ T cells were significantly increased in MIC-1 Tg at 28 dpi compared with MIC-1 KO mice (p = 0.001), and also between WT and MIC-1 KO mice (p = 0.04; Fig. 5A). CD3+ T cell number was also significantly higher in MIC-1 Tg at 7 dpi than in both WT (p = 0.005) and MIC-1 KO mice (p = 0.01). In agreement with previous literature, 46 greater T cell accumulation was observed during the more chronic phase (28 dpi) compared with the subacute phase (7 dpi) of SCI for both MIC-Tg and WT mice (p ≤ 0.004), but not MIC-1 KO mice. The T cell infiltrate in MIC-1 Tg mice at 28 dpi was predominantly CD8+ T cells (Fig. 5B,C). In contrast, MIC-1 KO mice had significantly less recruitment of T cells than both WT and MIC-1 Tg mice (p ≤ 0.04).
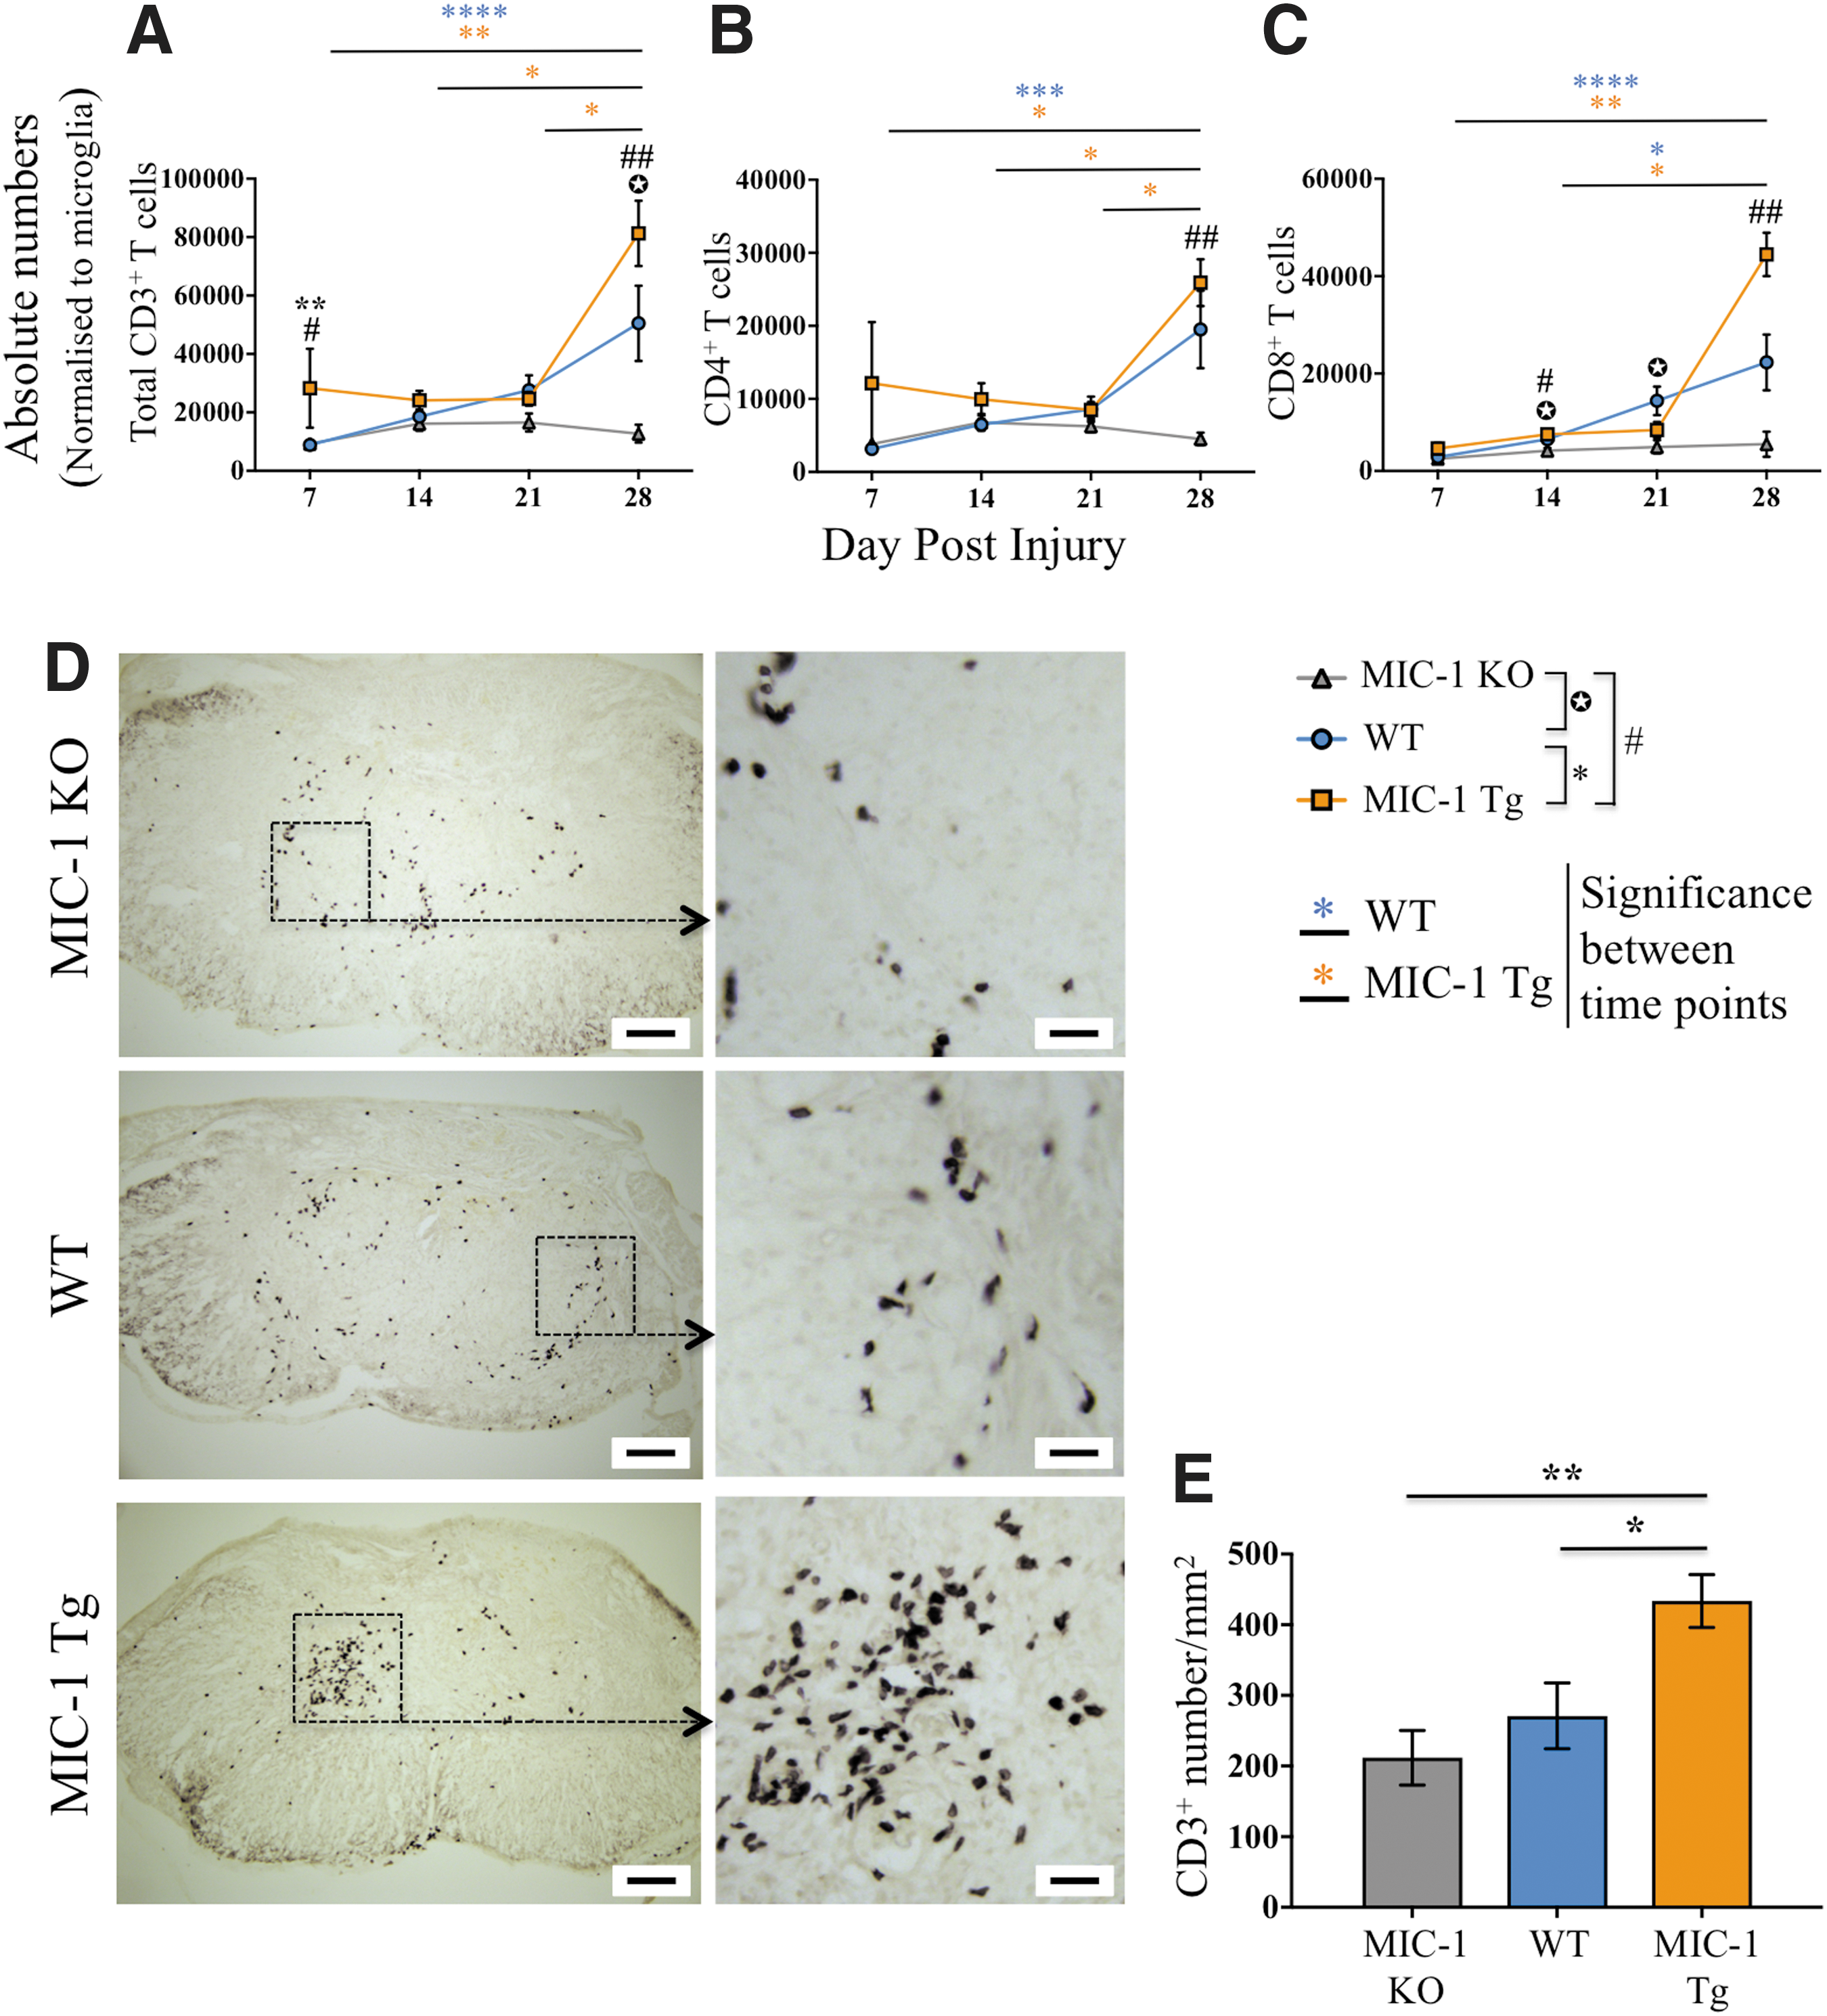
CD3+ T cells were increased with macrophage inhibitory cytokine-1/growth differentiation factor 15 (MIC-1/GDF15) overexpression.
IHC staining again confirmed an increased presence of CD3+ T cells at the lesion epicentre of MIC-1 Tg mice compared with both WT (p < 0.05) and MIC-1 KO mice (p < 0.01) (Fig. 5D,E). Overall, these results show that transgenic expression of MIC-1/GDF15 is associated with an increased presence of CD3+ T cells in the spinal cord at 28 dpi. No such effect was observed for B lymphocytes (CD45hiCD3–CD11c−CD11b−B220+ cells) (Fig. S2C).
The transgenic expression of MIC-1/GDF15 is associated with increased MCP-1/CCL2 levels in the injured spinal cord at 28 dpi
We lastly sought to determine what was driving the increased presence of peripherally derived immune cells in the injured spinal cord of MIC-1 Tg mice. Cytokine profiling revealed significantly higher levels of MCP-1/CCL2 within the injured spinal cord of MIC-1 Tg animals compared with WT controls at 28 dpi (p = 0.02; Fig. 6). This finding is consistent with terminally differentiated macrophages and DCs being the main contributors to the overall increase in immune cell presence in MIC-1 Tg mice during the more chronic phase of SCI. IL-6 was detected at low levels, with higher expression in MIC-1 Tg mice however, this was not significant. IL-12p70, TNFα, IFNγ, and IL-10 were all below the detection threshold at 28 dpi.
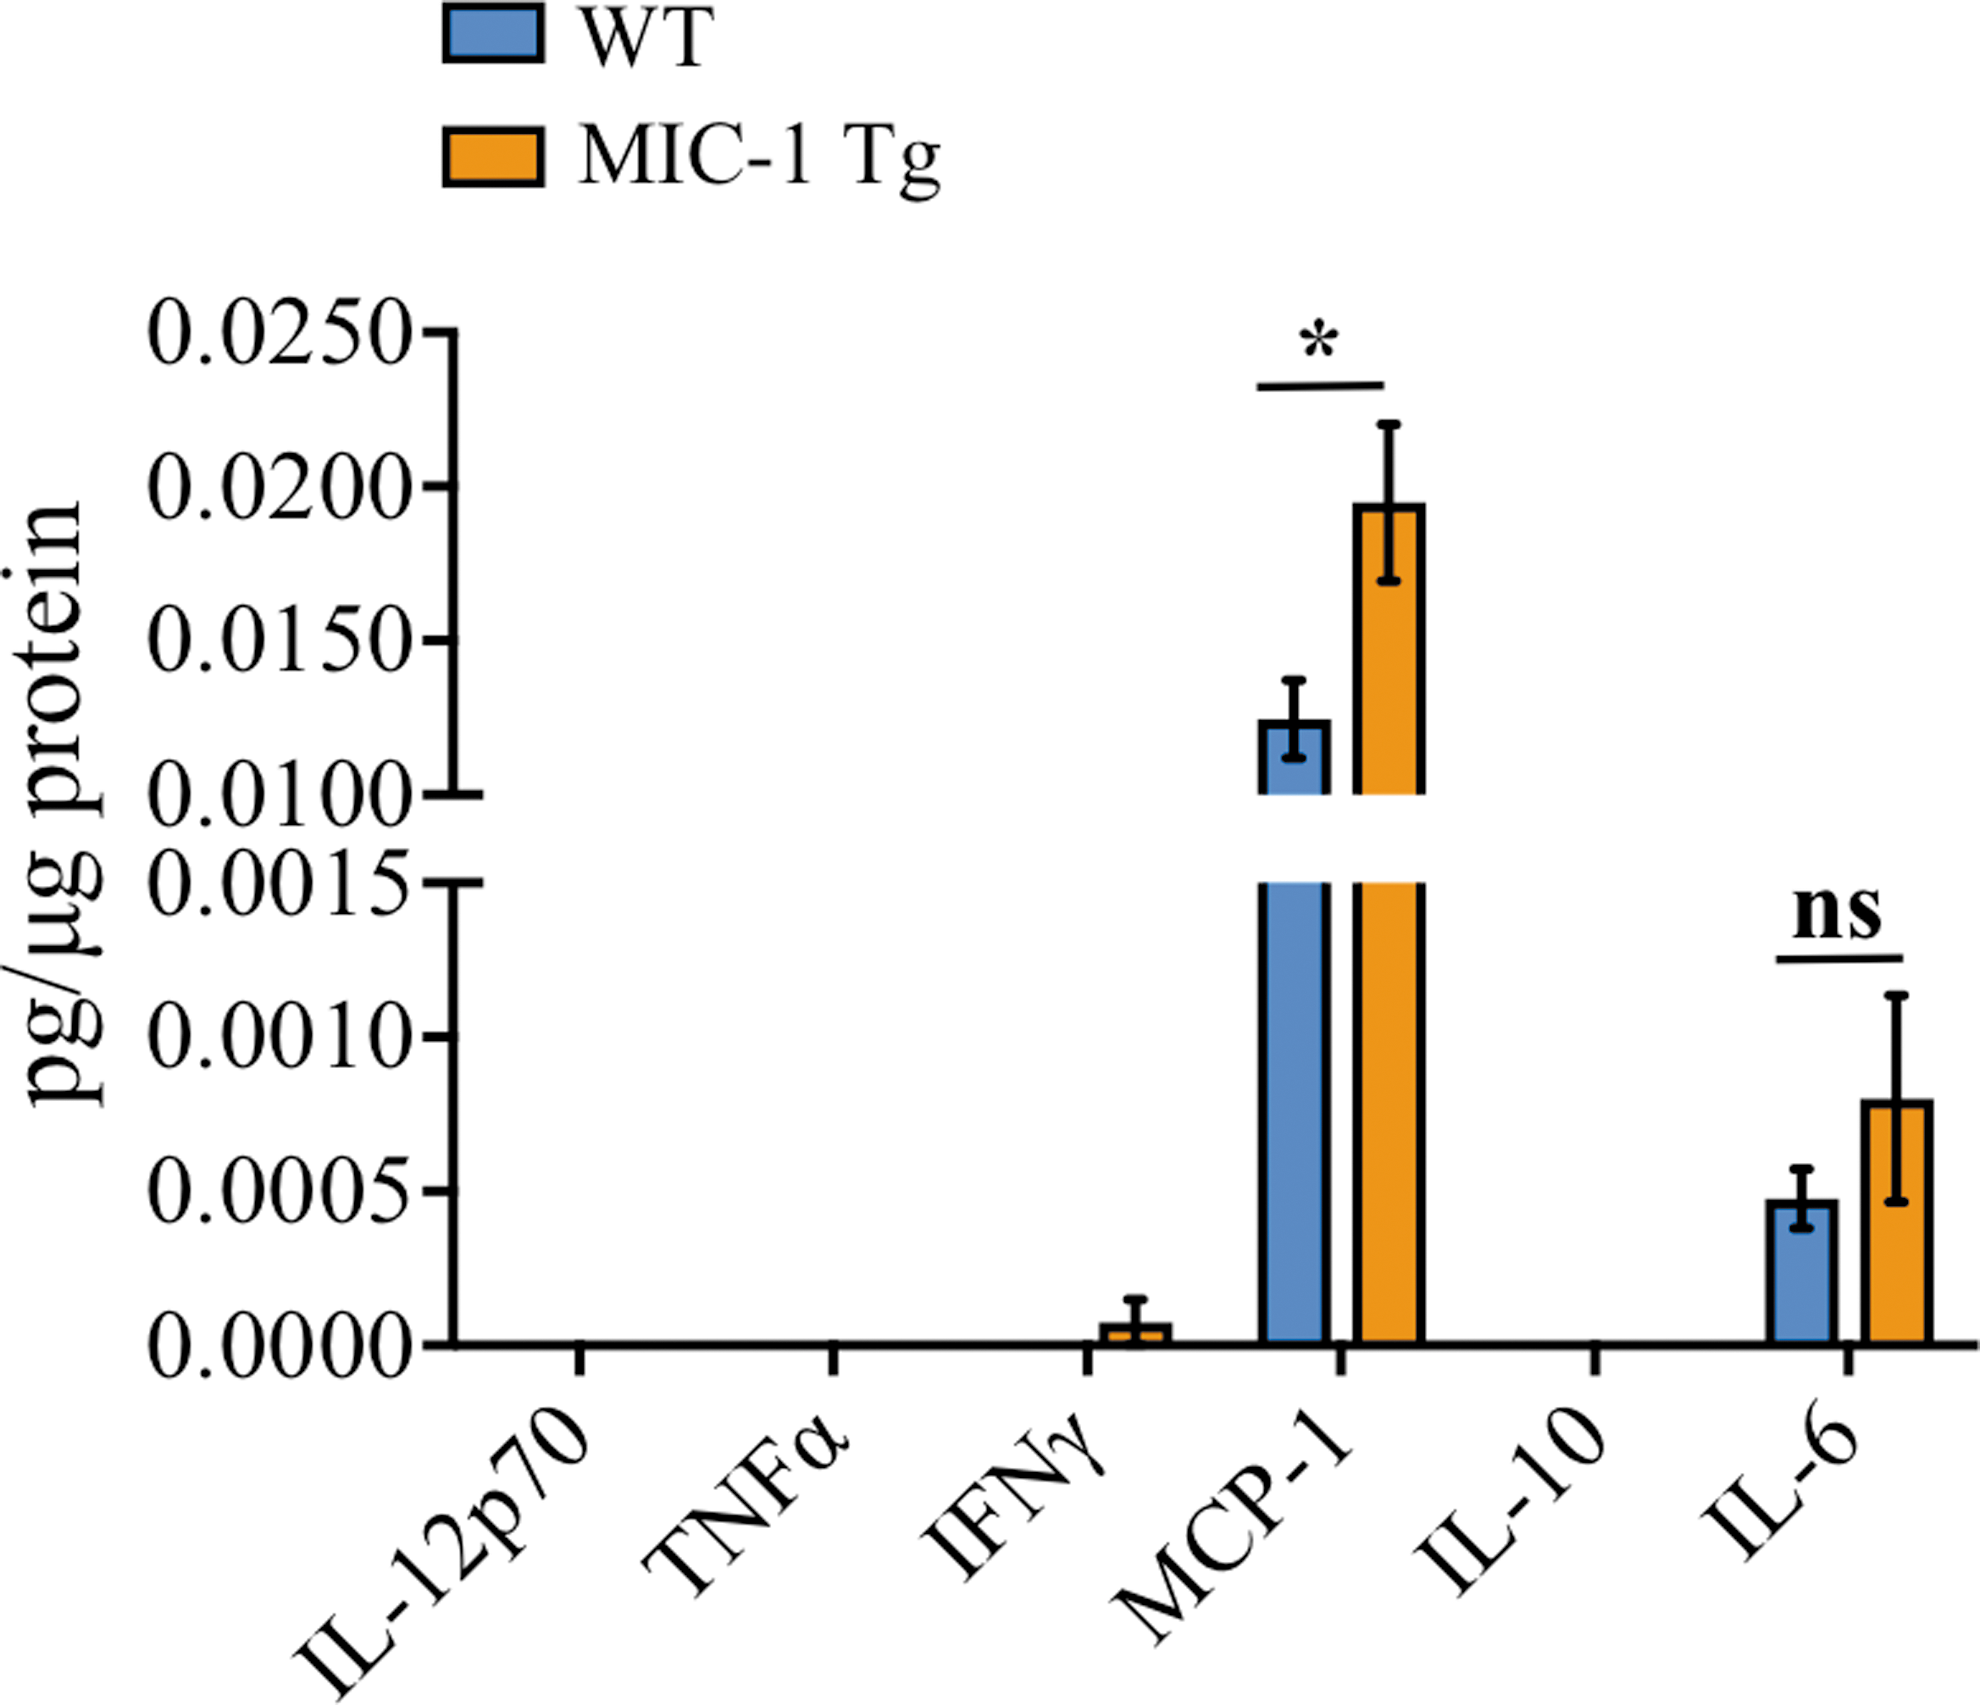
Macrophage inhibitory cytokine-1/growth differentiation factor 15 (MIC-1/GDF15) overexpression was associated with increased monocyte chemoattractant protein-1 (MCP-1)/C-C Motif Chemokine Ligand 2 (CCL2) in the injured spinal cord tissue at 28 days post-injury (dpi). Interleukin (IL)-12p70, tumor necrosis factor (TNF)α, interferon (IFN)γ, MCP-1, IL-10, and IL-6 levels in the injured section of spinal cord at 28 dpi in wild type (WT) and MIC-1 transgenic (Tg) mice. *p = 0.02, Mann–Whitney U test. Data are presented as mean ± standard error of the mean (SEM). WT, n = 17; MIC-1 Tg, n = 10. Color image is available online.
Discussion
Here we show, for the first time, that MIC-1/GDF15 seems to convey neuroprotection in a mouse model of contusive SCI and is therefore a target for therapeutic intervention. Mice that transgenically express this cytokine (>150-fold increase relative to WT; Fig. S1A) had enhanced locomotor recovery and displayed less tissue loss at and around the lesion site. Somewhat counterintuitively, these improved outcomes in MIC-1/GDF15 Tg mice coincided with elevated MCP-1/CCL2 tissue levels and an increased infiltration of immune cells into the injured spinal cord. Recruitment of macrophages, DCs, and T cell subsets appeared to be correlated to the level of MIC-1/GDF15 expression, with the lowest frequency of these cells in the injured spinal cords of MIC-1/GDF15 KO mice. Further, there was no improvement in recovery of WT mice, which recruited significantly more inflammatory cells, compared with MIC-1/GDF15 KO mice. Because overexpression, but not a loss of MIC-1/GDF15, improved recovery, our findings may suggest that MIC-1/GDF15 has immunomodulatory effects on recruited inflammatory cells as well as being associated with their increased frequency, leading to benefits in SCI resolution. Recently, MIC-1/GDF15 Fc-fusion proteins have been structured that show extended half-life and potent treatment in obese monkeys, making it a potential therapeutic in humans. 47 Additionally, therapeutic studies are close to being underway as indicated by NGM Biologicals web site.
The present findings add to previous studies that have reported beneficial roles for MIC-1/GDF15 in promoting functional recovery in a model of Parkinson's disease 34,35 and sciatic nerve injury. 37,48 MIC-1/GDF15 is also upregulated by macrophages/microglia in cold and ischemic CNS injury, 39,49 although our study clearly suggests that this endogenous response is not enough to confer measurable changes in motor outcome in SCI. Although the exact mechanisms of action of MIC-1/GDF15 remain to be elucidated, our results suggest that this cytokine can protect vulnerable tissue from secondary damage if expressed at sufficiently high levels. One contributing factor may be our observed increase in MCP-1/CCL2, which is consistent with the increased frequency of macrophages within the injured spinal cord. 50 –52 Consistent with this view, accelerated sensory neuron recovery in peripheral nerve injury with MIC-1/GDF15 treatment is thought to be related to its role in regulating macrophage activation. 37 Although our study suggests an association between MIC-1/GDF15 and chemokine expression with inflammatory cell recruitment and enhanced recovery from SCI, further studies are required to precisely delineate the mechanisms and pathways targeted by MIC-1/GDF15 in SCI. These studies would seem better directed at determining whether MIC-1/GDF15 alters macrophage function. 53 –55 in the context of SCI, including its putative role in the regulation of macrophage polarization (M2 vs. M1). 56
In addition to macrophages, our combined flow cytometry and histological analyses showed an increase in CD11c+ cells as well as CD3+ T cells in MIC-1/GDF15 Tg animals, with most of these cells present in the injury core. There was also an increase in CD11c+ cells in the adjacent spared ventrolateral white matter. Although yet to be determined, these are likely CD11c+ microglia. Others have shown that CD11c+ microglia may be protective. 57 –62 However, our flow results examining the entire spinal cord showed no differences in the number of these cells among genotypes (Fig. S2A). In the injury core, the majority of CD11c+ cells are likely to be peripherally derived macrophages and/or DCs, 63 which is in line with our flow results suggesting higher CD11c MFI of these cells, although it did not reach significance (Fig. S2B). Certainly this possible increase in CD11c expression as indicated by our flow examination might be amplified in IHC. Considered as a single entity, it has been proposed that DCs may serve beneficial roles at late stages post-SCI through the removal of myelin debris and production of neurotrophic factors. 64 Although the actions of MIC-1/GDF15 on DCs in the context of SCI are not yet clear, in other models of inflammatory disease, recombinant MIC-1/GDF15 is largely immunomodulatory. It suppresses the expression of maturation/costimulatory molecules such as CD86, CD83, and CD25 in antigen presenting cells, 65 which in turn changes the outcome of T cell activation that is associated with altered tolerance in CNS immunity. 66,67 Further, MIC-1/GDF15 induces the expression of indoleamine 2,3-dioxygenase (IDO) in DCs, 65 a pathway that activates T regulatory cells, 68,69 all of which may be relevant to SCI. Additionally, considered separately, DC subsets may have differing functions.
The early recruitment of mDCs and macrophages that we observed may facilitate better outcomes by clearing debris in the injured spinal cord, 57,58 particularly so because peripherally derived mDCs present myelin peptides more efficiently than other DC subsets. 66 It has also been reported, however, that myelin protein pulsed mDCs transferred into experimental autoimmune encephalomyelitis (EAE) mice can enhance the recruitment of forkhead box P3 (FOXP3)+ regulatory T cells to the spinal cord and increase IL-10 production by splenocytes, which suppresses EAE progression. 70 Although yet to be determined, this latter scenario may be promoted in SCI because of the large amount of myelin released from the injury site. In other DC subtypes, pDCs are capable of producing IFNα that promotes the differentiation of IL-10-producing T cells via modification of mDC-T-cell activation, with mDCs being modified to a more protective phenotype. 45,71 Although speculative and requiring further study, these data might indicate that the regulation of both innate and adaptive components of the immune response to SCI, in the context of increased MIC-1/GDF15 expression, may facilitate improved recovery.
Conclusion
In summary, the transgenic expression of MIC-1/GDF15 significantly improved locomotor recovery after SCI, which was associated with more tissue preservation at the injury site. The level of MIC-1/GDF15 expression was broadly related to the extent to which macrophages and DCs, as well as CD4+ and CD8+ T cells infiltrated the spinal cord, particularly during the intermediate/chronic phase of SCI. Further studies are required to confirm this. Also, studies are yet to determine the precise mechanisms underlying the immunomodulatory effects of MIC-1/GDF15 in SCI. This may include determining cytokine levels at more acute phase. Future studies will also explore whether administration of this cytokine in its recombinant form has therapeutic potential.
Footnotes
Acknowledgments
This work was funded by a National Health and Medical Research Council Project Grant (GNT1048921), SpinalCure Australia, an Australian Postgraduate Award (APA), a Brain Science UNSW award, and St Vincent's Centre for Applied Medical Research (AMR) scholarship. All animal studies were approved by Garvan/St Vincent's Animal Ethics Committee (AEC #12_18 and 16_04), and all the experiments were conducted as per the Australian code for the care and use of animals for scientific purposes, and the Animal Research: Reporting of In Vivo Experiments (ARRIVE) guidelines. 72
Author Disclosure Statement
Drs. Brown and Breit are named inventors of MIC-1/GDF15 intellectual property owned by St Vincent's Hospital Sydney. The other authors have nothing to disclose.
Supplementary Material
Supplementary Figure S1
Supplementary Figure S2
References
Supplementary Material
Please find the following supplemental material available below.
For Open Access articles published under a Creative Commons License, all supplemental material carries the same license as the article it is associated with.
For non-Open Access articles published, all supplemental material carries a non-exclusive license, and permission requests for re-use of supplemental material or any part of supplemental material shall be sent directly to the copyright owner as specified in the copyright notice associated with the article.
