




Abstract
Comparisons of white matter (WM) fractional anisotropy (FA) values between mild traumatic brain injury (mTBI) patients and controls have revealed inconsistencies in the directions of the resulting FA changes. To address these discrepancies, we examined hemispheric FA symmetry levels across WM tracts in 150 mTBI patients relative to 96 military controls. Automated fiber quantification was used to extract 18 WM tracts with 100 FA values, which were used to compute correlation strengths between the nine bilateral tract pairs. The Fisher z-transformed Pearson's r values were entered into an analysis of covariance examining the effects of group (mTBI and controls) and age on symmetry levels within each tract pair. The mTBI group displayed lower symmetry levels in the corticospinal tract and the inferior longitudinal fasciculus. Interactions between age and group were detected in the inferior fronto-occipital (IFOF), uncinate (UF), and superior longitudinal fasciculi (SLF). A similar pattern emerged in the IFOF and the UF, revealing age-related symmetry decreases in the mTBI patients despite stable levels of symmetry across ages in controls. In contrast, although the control group's symmetry levels actually increased with age in the SLF, no age-related symmetry changes were detected across the mTBI participants. Here, we proposed WM symmetry measures as a potential means of circumventing directional inconsistencies of trauma-related FA changes, as well as capturing more within-tract and within-subject variances of diffusion tensor imaging (DTI) metrics. Further, we demonstrated the method's utility in detecting mTBI-specific effects and their associated interactions with age.
Introduction
Although improvements in protective equipment have increased the overall survival rates of deployed United States military personnel, they also inadvertently resulted in more frequent impairments, such as mild traumatic brain injury (mTBI), 1 which has become the signature injury in United States armed service members. 2,3 Given that mTBI likely produces damage to the neuronal cytoskeleton on a microscopic level, 4 –6 conventional magnetic resonance imaging (MRI), such as T1- and T2-weighted sequences, as well as computed tomography scans are often read as normal during radiological examinations. 7 –9 Analyses of diffusion tensor imaging (DTI) data, on the other hand, can offer increased levels of sensitivity to mTBI-related abnormalities in the white matter (WM). 10,11 Specifically, DTI-derived estimates of WM integrity levels, such as fractional anisotropy (FA), 12 have been used to reveal microstructural disturbances in WM cytoarchitecture following head trauma in region of interest (ROI)-based, 13,14 tractwise, 15,16 and whole-brain analyses. 17 Despite numerous reports of aberrant mTBI-related DTI findings, 18 however, no consensus has been reached regarding specific microstructural WM markers that are indicative of mild injury.
The challenge to establishing clinically applicable mTBI diagnostic criteria based on DTI measures is partially due to the directional inconsistencies of FA changes following trauma. Although multiple studies have supported the intuition that damaged axonal myelin sheaths would result in decreased FA levels in the axonal bundles that they form, 14,19 –21 several reports of post-injury FA increases exist as well. 16,17,22 –24 This discrepancy has been at least partially elucidated by addressing post-trauma latencies, 25 with mTBI patients in the acute or semi-acute stages (< 2 weeks post-injury) displaying FA increases, and those in the chronic stage (> 2 weeks post-injury) having persistently decreased FA levels that may not recover to normal levels. 24
A way to circumvent the discrepancy in the directions of FA changes after mTBI is to examine hemispheric FA symmetry levels in lieu of raw FA values. Despite a certain degree of WM laterality, 26 –28 the brain tends to exhibit relatively high levels of symmetry. Bilateral regions deviating from symmetry levels observed in healthy individuals may therefore be indicative of pathology. Indeed, this approach has previously been utilized in detecting mTBI via an ROI-based analysis, 16 reporting elevated hemispheric laterality indices ([left - right] / [left + right]) in the uncinate fasciculus (UF) and superior corona radiata in a semi-acute (12 days post-injury) mTBI cohort. Here, we sought to further investigate this concept's utility by using correlation-based symmetry levels between bilateral WM tracts as prospective markers of neurological pathologies, with a specific application to mTBI. Specifically, rather than using means across all voxels within ROIs, we obtained FA values from 100 slices along known WM fiber bundles and assessed the correlation strengths for nine such pairs of bilateral tracts using the resulting FA “profiles.”
In contrast to laterality indices, the correlation-based approach described herein is not optimized to detect broad differences in FA magnitudes across hemispheres, but rather to quantify the consistencies of FA fluctuations along homologous bilateral tract pairs. Given its slicewise granularity and within-subject nature, the proposed symmetry measure may improve spatial correspondence between left and right tract locations being compared, capture more variance than ROI-based approaches, and reduce data dimensions for fewer comparisons between patients and controls. In its application to scans obtained from an mTBI cohort, we expected this method to reveal significant deviations in the patients' WM tract symmetry levels relative to “normal” symmetries observed in controls without histories of head trauma.
Methods
Two hundred and forty-six participants were recruited via the War Related Illness and Injury Study Center (WRIISC) at the Veterans Affairs (VA) Hospital in Palo Alto, California, all of whom provided written informed consent in accordance with the Declaration of Helsinki. The study protocol was approved by the Stanford University and VA Internal Review Boards. The study groups consisted of 150 right-handed United States veterans who had sustained at least one mTBI (mean age = 46.0 years old, standard deviation [SD] = 11.8 years; 135 males) and 96 right-handed United States military controls with no histories of head trauma (mean age = 46.0 years old, SD = 9.5 years; 80 males, 16 females). The gender ratios across the two participant groups did not differ significantly (X 2 (1, n = 246) = 2.36, p = 0.124). The mTBI diagnoses were based on the reviews of patients' medical records in accordance with the VA and Department of Defense Clinical Practice Guidelines for Management of Concussion and mTBI. 29 Specifically, the loss of consciousness was limited to 0–30 min, and alteration of consciousness as well as post-traumatic amnesia was limited to 0–24 h. Given that most of the reported brain injuries occurred during deployments to remote and often hostile locations where immediate medical attention was unavailable, the Glasgow Coma Scale was rarely administered and therefore not used for determining trauma severity levels in the present study.
Inclusion in the study was contingent on a lack of serious neurological and psychiatric disorders such as multiple sclerosis, Parkinson's disease, epilepsy, stroke, and schizophrenia. Given the high prevalence of post-traumatic stress disorder (PTSD) in the post-deployment United States veteran population, it was not used as a study exclusionary criterion. In light of recent findings that PTSD and mTBI may affect different WM pathways, 30 however, we compared the PTSD prevalence rates of 68.7% and 63.5% in the mTBI and control groups, respectively, and found them not to differ significantly (X 2 [1, n = 246] = 0.69, p = 0.406).
MRI data were collected at the Palo Alto VA using a 3 T GE Discovery MR750 scanner with an eight-channel head coil. For each participant, a high-resolution T1-weighted volume was obtained using a three-dimensional spoiled-gradient recalled (3D-SPGR) acquisition with the following parameters: 136 sagittal slices, repetition time (TR) = 7.3 ms, echo time (TE) = 3.0 ms; flip angle = 11°, field of view = 250 mm, slice thickness = 1.2 mm, slice gap = 0.6 mm, matrix size = 256 × 256, voxel size = 1.05 × 1.05 × 0.60 mm3. Additionally, every subject underwent a diffusion-weighted imaging (DWI) sequence using a two-dimensional (2D) single-shot echo-planar imaging with the following settings: 57 axial slices scanned in 60 sensitization directions, TR = 6600 ms, TE = 84.1 ms, b = 1000s/mm2, and voxel size = 1 x 1 x 2.5 mm3. Prior to any processing, the data were completely de-identified.
Eight volumes without diffusion gradients (b = 0) were acquired throughout the scan for the removal of baseline signal as well as motion and eddy current artifacts. Participant motion, susceptibility, and eddy current artifacts were removed by using Rhode 14-parameter expected deformation estimates to unwarp the diffusion-weighted data,
31
which were then resampled to 2 mm isotropic voxel resolution. In every participant's native DWI volume space, diffusion tensors were subsequently fit using 50 iterative steps of the Robust Estimation of Tensors by Outlier Rejection method (RESTORE).
32
Extraction of WM tracts from the resulting DTI data was performed using the Automated Fiber Quantification (AFQ) pipeline developed at Stanford University (
Individual streamlines were preliminarily classified as constituents of specific fiber bundles if they traversed waypoint ROIs, which were placed along known tract trajectories in Montreal Neurological Institute (MNI) space and non-linearly transformed to native spaces. 27 Although the resulting streamlines possessed correct termini, their shapes could still deviate from the expected, anatomically known paths of the sought WM tracts. To mediate this, the preliminarily classified streamlines were compared with tract probability maps, which were defined based on 28 healthy adults and transformed to native spaces for the identification and removal of streamlines travelling through low-probability areas. 35 Finally, the isolated fiber bundles were cleaned by excluding streamlines with lengths >4 SD above the mean length, as well as those projecting beyond 5 SD of the fiber bundle core. The resulting fiber bundles were segmented into 100 segments, or slices, producing a profile of FA values for each tract. Nine pairs of homologous bilateral tracts were isolated, producing a data set of 18 left and right WM bundles for each participant: anterior thalamic radiation (ATR), cortico-spinal tract (CST), cingulum (CNG), and cingulum-hippocampal bundle (CHB), as well as inferior fronto-occipital (IFOF), inferior longitudinal (ILF), superior longitudinal (SLF), UF, and arcuate fasciculi (AF).
Within every subject, hemispheric symmetry levels were assessed via cross-correlations of slicewise left and right FA values for each pair of bilateral WM tracts. Given that each tract was segmented into 100 slices and the potential for slight differences in bilateral tracts' lengths, it is possible that slice n in a particular tract would not correspond perfectly to slice n in its homologous contralateral tract. We addressed these potential spatial incongruencies by examining the cross-hemispheric correlations at different levels of spatial shift between left and right tracts. The shift distances, measured in slices, at which maximum correlation coefficients occurred were determined for all subjects, and the SD of such distances was calculated for every tract. Each subject's maximum correlation coefficient within 1 SD around the mean shift distance was subsequently used for all further analyses. Data from participants whose maximum cross-hemispheric correlation coefficients for a particular tract pair were shifted more than 1 SD in either direction were not included. For each tract, the resulting set of within-subject coefficients was Fisher z-transformed and entered as a dependent variable into an analysis of covariance (ANCOVA) examining the effects of mTBI and age, as well as the interaction of the two.
In order to provide a contextual reference for the novel approach aiming to detect WM damage using symmetry assessments, we also performed a parallel analysis of raw FA measures that represented a traditional, commonly utilized DTI analysis. Within each of the 18 isolated tracts, FA values were averaged across the 100 slices to produce a mean FA measure for every participant. The resulting metrics were entered into an ANCOVA that was analogous to the design utilized for the examination of symmetry levels, assessing the effects of mTBI, age, and the interaction of the two variables on mean FA within each tract.
Results
Nine pairs of bilateral WM tracts were extracted from every participant's data, and are presented in Figure 1 from a representative 46-year-old male control subject. The resulting tract cores were visually inspected and followed the expected known trajectories for the respective fiber bundles. 26,33 All tract pairs' cross-correlation coefficients were maximal at low levels of spatial shift (< 10 slices) on a group level. Prior to our stringent exclusion of participants with excessive left–right spatial shifts (tractwise exclusion counts summarized in Table 1), the ATR, CST, ILF, and the UF already possessed low variances in their cross-correlational shifts (SD <10 slices; Table 1). These stood in contrast to the elevated shifts observed in the CNG (SD = 19 slices), CHB (SD = 18 slices), IFOF (SD = 15 slices), SLF (SD = 33 slices), and AF (SD = 29 slices; Table 1). After the removal of outliers, however, all pairs' shift variances fell below 10 slices, with the single exception of the SLF (SD = 17 slices). To address the possibility that group differences in symmetry levels were confounded by the variability in left–right spatial shifts, we conducted a series of t tests comparing the offsets at which the correlational maxima were detected between the mTBI and control groups for every tract pair. No significant group differences in spatial shifts were detected in any tract pairs. Importantly, this was the case both prior to and after the exclusion of participants with low left–right spatial correspondence levels.

Pairs of bilateral white matter (WM) tracts used in the analysis. Nine bilateral WM tracts are presented from a representative 46-year-old male control participant. Slices of the individual's b0 diffusion-weighted images are included for spatial reference purposes, with the y and z values referring to the respective native-space planes that are shown. Individual streamlines are rendered with lowered opacities relative to the tube-like tract cores that encompass them. For each tract, these cores summarized the streamlines' aggregate fractional anisotropy (FA) data, and were subsequently used for hemispheric symmetry calculations. For demonstration purposes, the resulting FA values are plotted onto the tract cores in accordance with the shown color maps (1 = high, 0 = low WM integrity). In this example, elevated cross-hemispheric asymmetry in FA is especially apparent in the corticospinal tract, whereas the FA values in the inferior fronto-occipital fasciculus appear to be relatively symmetrical.
Summary of White Matter Tract Characteristics and Effects
Summary of left (l-), right (r-), and tract symmetry (l/r) information and statistical analyses is shown for the anterior thalamic radiation (ATR), corticospinal tract (CST), cingulum (CNG), cingulum-hippocampal bundle (CHB), inferior fronto-occipital fasciculus (IFOF), inferior longitudinal fasciculus (ILF), superior longitudinal fasciculus (SLF), uncinate fasciculus (UF), and arcuate fasciculus (AF). Results from the analysis of covariance (ANCOVA) for individual left and right tracts' fractional anisotropy (FA) values as well as tract pairs' symmetry levels (left/right Pearson r ) are summarized for the main effects of age and group (mild traumatic brain injury [mTBI] and controls) along with the interactions between the two variables. In addition to the F-values and raw p-values, false discovery rate (FDR) adjusted p-values are shown as well. In the rows summarizing symmetry analyses (l/r), mean spatial left–right shifts are shown in slice counts for every bilateral tract pair both before and after the exclusions using the criteria described in the Methods section, with the number of participants excluded presented in parentheses. Fractional anisotropy (FA) values averaged across the entire tracts and all retained participants are presented for left and right tracts for both the control (CTR) and mTBI groups. Both groups' mean Pearson's correlation r-values are also shown, summarizing the average symmetry levels observed in each tract pair. Trauma-specific main effects on symmetry levels were detected in the CST and the ILF. Further, interactions between mTBI and age effects on symmetry levels were observed in the IFOF, the SLF, and the UF. Although traditional FA analyses are presented as well, any comparisons between them and the novel symmetry approach are not intuitive, because of fundamental differences in the two metrics, and should therefore be interpreted with caution.
The following summarizes all effects with p < 0.05 that were uncorrected for multiple comparisons. Out of all such effects, those that passed the Benjamin–Hochberg false discovery rate (FDR) adjustments are from this point cited as statistically significant, whereas those that failed to do so are referred to as approaching significance. Although only unadjusted p values are presented in the text body, Table 1 presents the results of all tracts' statistical analyses with both FDR-adjusted and uncorrected thresholds. Main effects of group (mTBI vs. controls) on hemispheric symmetry levels approached significance in the CST (F [1, 239] = 3.94, p = 0.048) and the ILF (F [1, 212] = 4.34, p = 0.038). As shown in Figure 2A and C, the mTBI group displayed decreased symmetry levels relative to controls in both tracts. In the case of the CST, the main effect of age on symmetry also approached significance (F [1, 239] = 4.62, p = 0.033). Specifically, aging was associated with decreasing left–right symmetry levels (Fig. 2B). The interaction of age and group reached statistical significance in the IFOF (F [1, 226] = 10.11, p = 0.002), and approached significance in the UF (F [1, 207] = 5.63, p = 0.019) and the SLF (F [1, 169] = 4.37, p = 0.038).
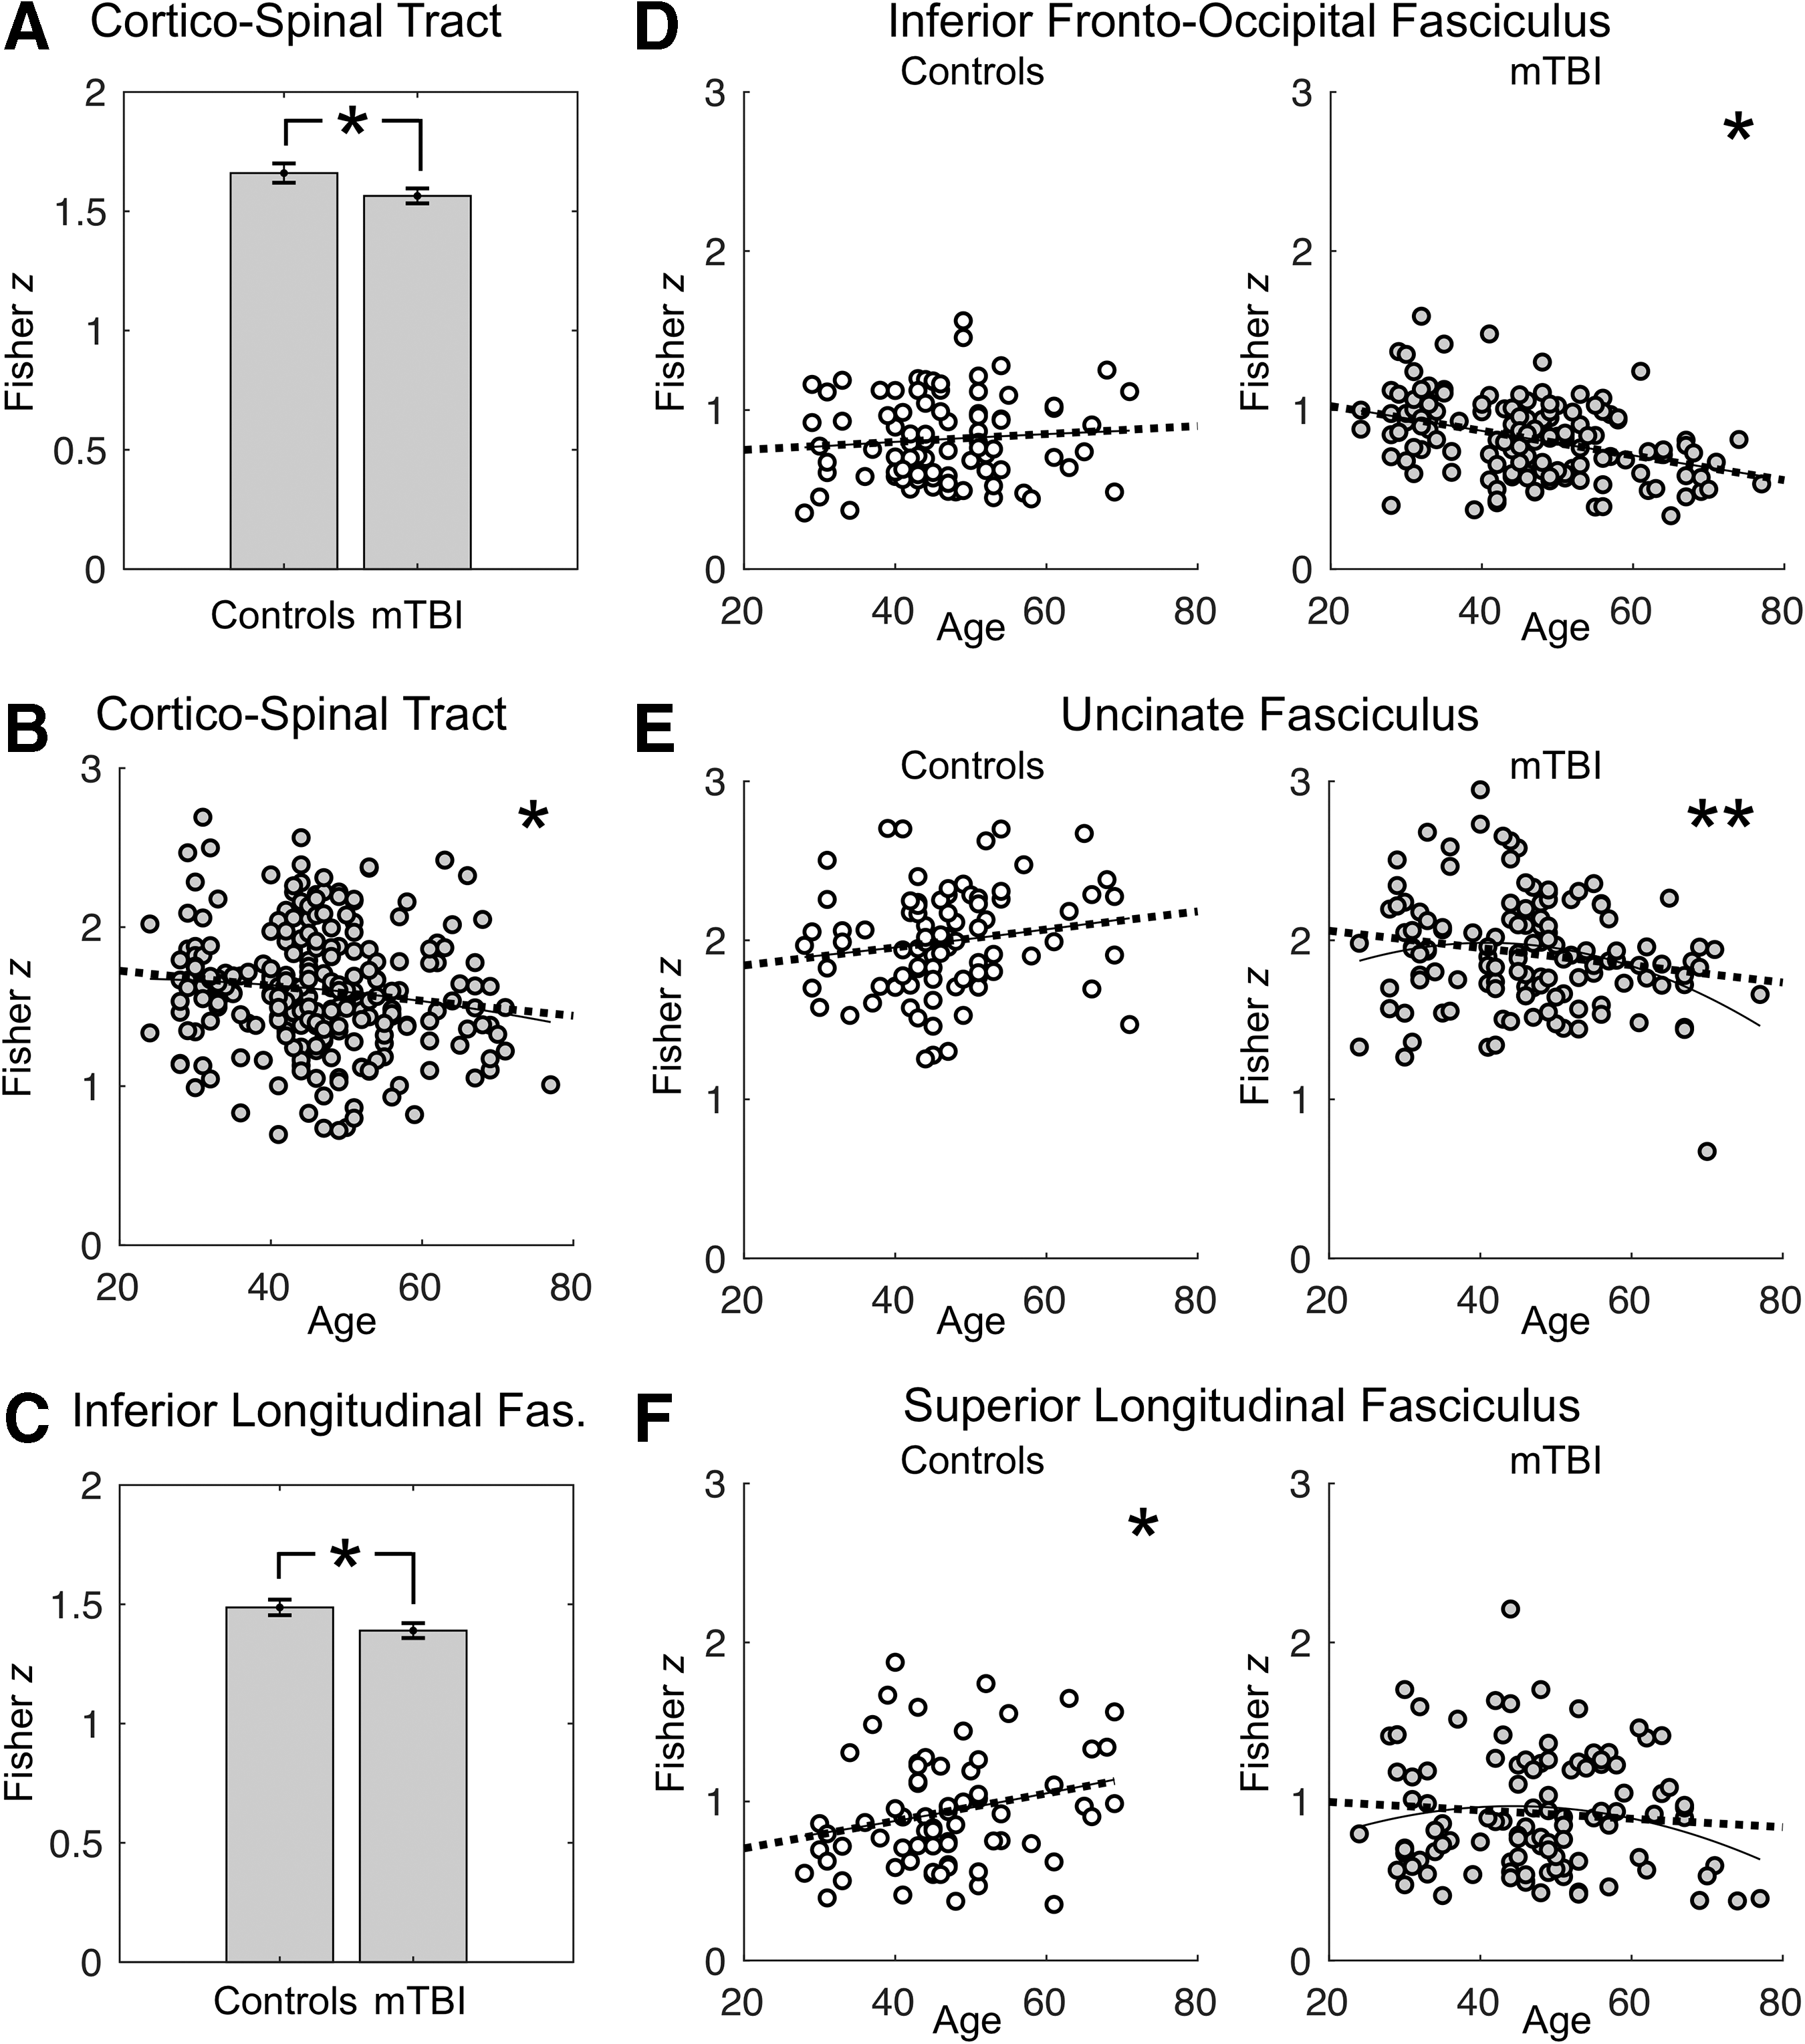
Summary of main effects and interactions on tract symmetry levels.
The interactions were explored further via simple effects of age on symmetry levels within the mTBI and control groups separately. Although no significant relationship between age and symmetry levels was detected in the IFOF in the control group (r [87] = 0.09, p = 0.413), symmetry levels dropped significantly with increasing age across the mTBI patients (r [139] = -0.39, p = 2.363e-6; Fig. 2D). A similar pattern was observed in the UF, with no significant changes in symmetry levels in either direction across age in the control cohort (r [82] = 0.16, p = 0.138), but the presence of a significant association between aging and symmetry decreased in the mTBI group (r [125] = -0.18, p = 0.041; Fig. 2E). In contrast to the IFOF and the UF, the control group displayed age-related symmetry increases in the SLF (r [67] = 0.24, p = 0.050), whereas no significant age-related symmetry changes were detected across the mTBI participants (r [102] = -0.084, p = 0.399; Fig. 2F).
To examine any parallels and discrepancies between the symmetry measure and a traditional raw FA-based approach, we performed an analogous analysis with mean FA values from the 18 tracts as the dependent variables. The results are summarized in Table 1 alongside the findings from the symmetry analysis. Specifically, main effects of group (mTBI vs. controls) approached significance in the left CHB (F [1, 204] = 7.77, p = 0.006), the right IFOF (F [1, 226] = 3.96, p = 0.048), and the right ILF (F [1, 212] = 4.56, p = 0.034), with none of the FDR-corrected group effects reaching significance. The effect of age was significant in the left CNG (F [1, 205] = 18.48, p < 0.001), left IFOF (F [1, 226] = 33.81, p < 0.001), right IFOF (F [1, 226] = 30.37, p < 0.001), and right ILF (F [1, 212] = 14.28, p < 0.001), as well as the left AF (F [1, 169] = 12.92, p < 0.001), and approached significance in the left CST (F [1, 239] = 6.59, p = 0.012), left ILF (F [1, 212] = 4.50, p = 0.035), left SLF (F [1, 169] = 6.21, p = 0.014), right SLF (F [1, 169] = 5.21, p = 0.024), and right UF (F [1, 207] = 5.93, p = 0.016), as well as the right AF (F [1, 169] = 5.79, p = 0.016). Finally, the raw FA analysis did not detect significant interactions between age and group in any of the 18 tracts examined.
Discussion
We have identified two tracts (CST and ILF) that exhibited diminished levels of hemispheric symmetry levels in the mTBI group relative to military controls. Additionally, we have described a potential confluence of head trauma history and aging in symmetry reductions within the IFOF, the UF, and the SLF-tracts to which trauma-specific impairments have previously been ascribed. 36,37 This may be caused by trauma-related structural shifts toward the dominant hemisphere with age or, conversely, mTBI-facilitated WM deterioration within the non-dominant hemisphere. The combination of the two scenarios is yet another possibility. The age-related declines in symmetry levels were specific to the mTBI group, with seemingly symmetrical FA changes observed across age in controls. Specifically, the controls' left-right correlation coefficients in the IFOF and the UF were trending upward with increasing age and displayed a significantly positive relationship with age in the SLF. This finding is particularly interesting, demonstrating the potential role of mTBI as a factor that may compound, exacerbate, and possibly disrupt normal trajectories of structural changes in the white matter long after trauma itself. Although this finding reflects previous reports of asymmetric rates of gray matter atrophies across several neurodegenerative disorders, 38 we note that elevated asymmetry is not necessarily a ubiquitous sequela across neurological and psychiatric disorders. For example, similar examinations of microstructural WM symmetries in children with autism spectrum disorder have revealed tract-specific elevations in symmetry levels relative to controls. 39 Rather, we advance directionally non-specific deviations in symmetry levels that are deemed aberrant in the context of demographically matched controls as indicative of neuropathology.
Our findings of mTBI effects on symmetry in the IFOF, ILF, SLF, and UF, whether in the presence of interactions with age or not, are consistent with previous reports of trauma affecting these particular tracts. 40 –42 Bilateral UF and IFOF have previously been implicated in mTBI, 40 and impairments in the UF have furthermore shown sensitivity to trauma that was comorbid with depression. 36 The current findings of aberrant symmetry profiles in the UF and the IFOF suggest that, despite both hemispheres' tracts being potentially vulnerable to aging and mTBI, they may not be affected in a symmetrical fashion and may sustain WM changes in different locations along the left and right tracts. Our examination of raw FA measures in individual tracts supports this notion, as all observed mTBI effects that were significant or approached significance, namely in the left cingulum-hippocampal bundle, the right IFOF, and the right ILF, were hemispherically lateralized.
It is noteworthy that lateralized mTBI-related decreases of raw FA in the right IFOF and the right ILF were indeed reflected in the diminished hemispheric symmetry levels of these tracts. Age effects on FA in the left CST and bilateral IFOF were also coupled with age-related effects on symmetry. This was not the observed pattern in the trauma effects in the cingulum-hippocampal bundles, however, with no significant symmetry changes despite lower FA in the left tract. Likewise, age effects in the left CNG and right UF, as well as the bilateral ILF, SLF, and AF were not complemented by age-related symmetry changes in these bundles. These discrepancies underline the fact that direct comparisons of traditional analyses of DTI metrics, such as mean FA, with hemispheric symmetry measures are not intuitive and may fail to provide additional inferential insight into symmetry-based findings. Given that the hemispheric symmetry assessments capture tract-specific slicewise variances within each subject that are ignored in traditional examinations of tractwise FA averages, the novel approach differs fundamentally from commonly utilized DTI methods. Although the specific intricacies of the relationship between these two measures can only be determined via computational simulations of trauma with known parameters, 43 the symmetry assessment did appear to offer more information pertinent to mTBI than the traditional FA analysis, particularly in its ability to detect the interactions between age and mTBI in three tract pairs that were missed by the examination of raw FA.
The aberrant deviations of WM tracts' symmetry levels may serve as useful indicators of other neurological pathologies that produce heterogeneous patterns of white and gray matter damage, such as multiple sclerosis, 44 mild cognitive impairment, 45 Alzheimer's disease, 46 brain tumors, 47 and stroke. 48 As we have demonstrated, the approach may be of particular utility for detecting mTBI, which has been shown to produce both decreases and increases of FA levels in WM tracts. Despite the several implications of post-injury latency as a mediator of this discrepancy, no clear temporal thresholds or explanations for this phenomenon have been established. Given that our approach is blind to the directions of FA alterations, it may be useful in applications to data sets in which precise post-injury latencies are not available, as is commonly the case in military mTBI. Added to the ambiguities of precise injury times are the large variances of post-injury periods that are often found in mTBI groups used in imaging studies. To emphasize this, we approximated injury dates for our patients using individual medical records, revealing the mean of the estimated post-trauma latencies to be 214 months, with an SD of 154 months. In the context of these long post-injury periods, the aberrant hemispheric symmetries of FA described herein support previous notions that trauma-related WM changes may in fact never revert to pre-injury levels. 24
Although any inferences regarding the direction of symmetry changes following mTBI are convoluted and merit further investigations, the protracted latencies in the present cohort raise the possibility that the observed symmetry decreases represent adaptive, compensatory post-injury lateralization processes that may be functionally advantageous. As such, it would be of particular interest to examine the relationship between such laterality measures and long-term symptomatic and cognitive outcome measures. A limitation of our study, however, was that we did not have access to such outcome measures that were consistent across individuals. Because of the clinical nature of our study center, each patient was administered a battery of neuropsychological tests tailored for assessment of specific and individual faculties of concern.
In addition to potentially circumventing the post-trauma latency effects on FA directionality, the described analyses also address the fact that direct comparisons of FA between groups fail to capture the variability in baseline microstructural integrity levels between individuals. By computing inter-hemispheric correlation strengths within each participant, the resulting symmetry values are implicitly normalized on a within-subject basis. As such, hemispheric symmetry may explain more within-subject variance than conventional FA comparisons. To further capitalize on this aspect, we suggest including within-brain inter-hemispheric attributes in future iterations of the described approach. A specific example would be the inclusion of individual subjects' corpus callosum FA values as covariates.
The usefulness of the presented analysis pipeline is bolstered by its potential for complete automation. Coupled with VISTASOFT and automated fiber quantification pre-processing, the post-processing extension for the extraction of tract symmetry levels can be readily automated. Minimal human intervention in such a pipeline can thus eliminate the inherent bias of manual tractography and make it particularly desirable in clinical applications that require expedient data processing timelines.
Although they were not a priori dependent variables of interest in the described study, we examined cross-hemispheric spatial correspondence levels and found them to possess surprisingly elevated variances within some tracts (Table 1). To avoid the possible contamination of symmetry measures with excessive spatial shifts, we employed a rather conservative threshold for acceptable cross-correlational lag with regard to retaining individual data in the analysis. Despite the lack of group differences in spatial shifts between mTBI and control groups both before and after the exclusion, this measure is possibly related to hemispheric symmetry levels and should be further addressed in future investigations.
Here, we utilized the tract parcellation feature for within-subject and within-tract hemispheric correspondence. Although this is an appropriate use of the granular spatial information produced by AFQ, it did not permit for precise localization of aberrant FA symmetry, but rather identified entire tracts that were affected. As such, future analyses using AFQ should focus on fitting group statistical models on a slicewise basis, encompassing within-tract variances. To achieve this, however, we suggest using tract cleaning procedures that are more conservative than the ones described herein. Specifically, a suitable candidate for this may be the adaptive methodology that uses a varying number of cleaning iterations, depending on the tract, which are repeated until no streamlines are excluded with the following repetition. 33
Although the described methodology is inherently blind to FA directionality, we do not advance it as a replacement for traditional FA-based approaches, and emphasize that no comparisons between raw FA and symmetry were conducted in this study. Rather, its main utility is in preliminary identification of “red flag” deviations from the norm, which in turn can be elaborated upon via traditional analyses. While here we present the usefulness of asymmetry measures in a between-group comparison, they can be utilized in a single-case versus group scenario: one that would be of particular usefulness in clinical settings. Such applications would, however, necessitate adaptive normative cohorts that would fit each individual patient's demographic profile–an endeavor that is realistic given the large imaging repositories that already exist currently in many neuroscience study centers.
Combining the two points outlined above represents the next step to advance the utility of symmetry assessment in clinical settings. Specifically, a single patient's 18 FA profiles would be reduced to nine symmetry profiles by computing a measure of laterality at each of the 100 slices along each tract pair. Fractional anisotropy data from a demographically matched normative cohort would subsequently be transformed in a similar fashion, producing profiles of symmetry means and variances that tract pairs should presumably exhibit in healthy individuals. Comparing the single-subject and group-derived symmetry profiles would thus indicate the location and the extent of any aberrant cross-hemispheric inconsistencies of FA values in the patient's WM tracts. This in turn would warrant a more spatially constrained interrogation of the diffusion-weighted data in the individual to elaborate on any possible abnormalities. Importantly, focused radiological assessments of the flagged areas across different available imaging sequences can reveal yet even more information about any subtle abnormalities that may otherwise be read as unremarkable. We are currently exploring the potential utility of this approach in clinical applications at our center.
Footnotes
Acknowledgments
The authors thank all veterans for volunteering to participate in this project. Without their generous support, this research would not have been possible. We thank the War Related Illness and Injury Study Center (WRIISC) staff, particularly Stacy Moeder for her continued support of our research work. We also extend gratitude to our head MRI technician Patricia Craig, as well as to the Stanford Center for Cognitive and Neurobiological Imaging (CNI) group (Brian Wandell, Hua Wu, Adam Kerr, Michael Perry, and Laima Baltusis) for their help in developing and implementing our neuroimaging protocol.
Funding Information
This work was funded by the WRIISC of the Palo Alto VA Health Care System and the Department of Veterans Affairs Office of Academic Affiliations. The views expressed here are of the authors and do not necessarily represent the views of the Department of Veterans Affairs.
Author Disclosure Statement
No competing financial interests exist.