
Abstract
Clinical methods for determining the severity of traumatic spinal cord injury (SCI) and long-term functional outcome in the acute setting are limited in their prognostic accuracy because of the heterogeneity of injury and dynamic injury progression. The aim of this study was to evaluate the time course and sensitivity of advanced magnetic resonance imaging (MRI) methods to neurological function after SCI in a rat contusion model. Rats received a graded contusion injury at T10 using a weight-drop apparatus. MRI consisted of morphological measures from T2-weighted imaging, quantitative T2 imaging, and diffusion-weighted imaging (DWI) at 1, 30, and 90 days post-injury (dpi). The derived metrics were compared with neurological function assessed using weekly Basso, Beattie, and Bresnahan (BBB) locomotor scoring and return of reflexive micturition function. At the acute time point (1 dpi), diffusion metrics sensitive to axonal injury at the injury epicenter had the strongest correlation with time-matched BBB scores and best predicted 90-dpi BBB scores. At 30 dpi, axonal water fraction derived from DWI and T2 values were both correlated with time-matched locomotor scores. At the chronic time point (90 dpi), cross-sectional area was most closely correlated to BBB. Overall, the results demonstrate differential sensitivity of MRI metrics at different time points after injury, but the metrics follow the expected pathology of acute axonal injury followed by continued degeneration and finally a terminal level of atrophy. Specificity of DWI in the acute setting may make it impactful as a prognostic tool while T2 imaging provided the most information about injury severity in chronic injury.
Introduction
Spinal cord injury (SCI) is a debilitating neurological event that impacts approximately 17,000 patients in the United States per year. 1,2 SCIs substantially alter an individual's quality of life, affecting locomotor abilities, bladder control, and sexual function 2 throughout the life span. Despite the prevalence of SCI, effective diagnostic and prognostic techniques are lacking. The International Standards for Neurological Classification of Spinal Cord Injury is the most commonly accepted neurological tool to assess the severity of SCI. However, its prognostic ability is limited and presents challenges to both individual patient management and outcome prediction, and the American Spinal Injury Association (ASIA) Impairment Scale (AIS) grade has limited clinical trial efficiency given the high degree of variability in outcomes. Further, significant comorbidities of SCI, including fractures, pain, brain trauma, and sedative medications, often preclude complete functional evaluations. Although non-invasive imaging, including magnetic resonance imaging (MRI) or computed tomography, have a role in surgical planning and management, these imaging modalities used in their typical clinical role have limited prognostic value with regard to long-term functional outcomes. A recent survey showed that <40% of practitioners use MRI as a planning tool given these limitations. 3 –5
The primary clinical MRI technique for SCI is T2-weighted sagittal imaging to visualize compression of the spinal cord and associated edema observed as T2 hyperintensities. 4,6 –8 However, the quantitative measures derived from these images, such as edema length or compression ratio, are poor or only modest predictors of long-term outcome. Recently, axial T2-weighted images have been used to develop a diagnostic system referred to as the Brain and Spinal Injury Center (BASIC) score, which assesses hyper- and hypointensity on axial T2-weighted images to grade injury severity on a 4-point scale. BASIC scoring has been shown to have strong diagnostic and prognostic value in patients with SCI, although the non-specific nature of hyperintensity in T2 imaging may lead to some heterogeneity between patients. 3,7 The most severe grade in BASIC scoring indicates the presence of intramedullary hemorrhage, which is related to a more severe SCI compared to SCI without hemorrhage. 9,10 Similarly, it has been shown that patients with intermedullary hemorrhage have a lower rate of AIS grade conversion than those without, further indicating that hemorrhage has a strong connection to functional outcome in humans. 11,12
Diffusion-weighted imaging (DWI) as a tool for SCI assessment has also been studied at length in pre-clinical models, but has seen limited adoption to clinical settings for routine SCI diagnosis. 4,13 –16 DWI measures the diffusion of water in tissue to infer information about the microstructure of the damaged spinal cord. Fractional anisotropy (FA), derived from diffusion tensor imaging (DTI), 17 is consistently decreased after SCI with strong correlations with functional outcome. 17 –19 Diffusion-measured parallel to white matter fibers in the spinal cord, known as axial diffusivity, correlates with axonal damage 18 and has shown sensitivity to injury and outcomes in both animal and human SCI studies. 9,20 Advanced modeling of DTI signal can also estimate axonal or neurite density, 20,21 more aptly termed the axonal water fraction (AWF). However, edema, hemorrhage, and inflammation present early after SCI potentially interfere with sensitivity to axonal injury. 4,19 Recently, we optimized a DWI method to minimize signals from non-axonal features in the spinal cord, known as double-diffusion encoding (DDE), which is a strong correlate of injury severity and functional outcome in a rodent model of SCI. 13,14,22 The specificity exhibited by both DTI and DDE shows promise to aid in the diagnosis and prognosis of SCI; however, these measures have not been adequately investigated in SCI.
Subsequent to the acute period of SCI that is dominated by axonal injury, edema, and hemorrhage, the subacute and chronic periods are characterized by evolving and ongoing axonal degeneration, demyelination and myelin degeneration, glial reactivity, and inflammation in which damaged tissue is cleared from the injury site. 23,24 In the chronic setting, the injury site is typically composed of a cystic cavity surrounded by a glial scar. These dynamic and intertwined pathologies make it challenging to visualize and monitor the extent of injury and may complicate interpretation of microstructural MRI metrics. A battery of advanced MRI methods, including T2 and multi-exponential T2 relaxation along with cross-sectional area (CSA) taken from T2 images, have been shown to correlate with functional outcome in the subacute to chronic setting. 6,25 –27
The aims of this study were to correlate the sensitivity of diffusion and T2 MRI metrics to neurological function during evolution from acute to chronic SCI in a rat spinal cord contusion model. Our hypothesis was that in the acute setting, DDE would be a better predictor of functional outcome than T2 because of its specificity for axonal injury. We also predicted that hemorrhage in the acute setting would be a contributing factor to long-term outcomes. In the subacute setting, we predicted that AWF derived from DTI would be strongly correlated with severity of injury given that it has a better specificity for uninjured axons compared to T2. Finally, it was hypothesized that T2 measures of atrophy (CSA) in the chronic setting, along with AWF, would be strongly correlated with neurological function. In addition to locomotor outcomes, micturition was also examined as a representation of neurological functional outcome; we predicted that the return of reflexive micturition and locomotor scores would be closely related, and that MRI metrics would show similar sensitivities to both micturition and locomotor function.
Methods
Animal model
All procedures were approved by the Institutional Care and Use Committees of the Clemet J. Zablocki VA Medical Center and the Medical College of Wisconsin (Milwaukee, WI). Forty 8-week old female Sprague–Dawley rats received graded thoracic spinal cord contusion injuries. Rats were anesthetized with 4% isoflurane induction and 2.5% maintenance during the surgical procedure. Corneal reflex and leg-flexion withdrawal were ensured before and periodically during the procedure. Animals' backs were shaved and sterilized with a betadine solution. Using an aseptic technique, the surgical site was incised, and the muscle was separated from the thoracic spinal column. A dorsal laminectomy was performed at T10, exposing the spinal cord but keeping the dura matter intact. An NYU impactor was used to induce a contusion injury of varying severities. A 10-g rod was dropped from heights of 50, 25, or 12.5 mm, producing severe, moderate, and mild injuries (n = 10 each). Velocity, trajectory, cord compression distance, time, and rate were recorded and compared to expected values for each injury severity. 28,29 Ten sham animals underwent a laminectomy, but did not receive a weight drop. Once the contusion injury was completed, the surgical site was sutured closed.
Animals were monitored and given fluid therapy and carprofen for up to 3 days post-injury (dpi). Animals without bladder function underwent bladder expression twice-daily until micturition reflexes returned. Several animals died or were euthanized before the chronic time point based on humane endpoints. Acute data from these animals was included in analysis, and the animals that survived the full experimental paradigm were: n = 7 severe, n = 8 moderate, n = 9 mild, and n = 10 sham.
Animals underwent locomotor assessments 48 h post-injury and weekly for 12 weeks. Basso, Beattie, and Bresnahan (BBB) scoring was used to determine hindlimb mobility. Animals were placed in an open field and were observed for up to 4 min or for three complete passes of the open field; subjects were scored (non-blinded) during the procedure. 30 Latency (days) to return of reflexive micturition was also recorded as a measure of neurological function.
Magnetic resonance imaging
Animals underwent MRI in a 9.4 Tesla small animal system (Bruker Biospin, Billerica, MA) at 24 h, 30 days, and 90 days post-injury. Animals were anesthetized with 4% isoflurane and maintained between 1.5% and 2.5% during the scan. Animals were placed supine with the T10 vertebral segment centered over a commercially available four-channel surface coil for signal reception and within a 72-mm-diameter volume coil for signal transmission. Respiratory rate, core temperature, and expiration oxygen percentage were measured and recorded every 10 min during scans to ensure animals' well-being. T1-weighted sagittal images were used to localize the injury site at the center of the T10 laminectomy for later scans.
Axial, multi-echo T2-weighted rapid acquisition with relaxation enhancement images were centered on the injury site with 1-mm slice thickness, 30 × 30 mm field of view (FOV), 256 × 256 matrix, and with a repetition time (TR) of 6 sec and echo times (TEs) of 17, 50, and 80 ms. DWI consisted of axial slices matching the locations of T2-weighted images and were obtained with reduced FOV (rFOV) excitation and a four-segment echo planar imaging readout with 30 × 30 mm FOV, 96 × 96 matrix (6/8 partial Fourier), number of excitations (NEX) of 4, TR of 3 sec, and TE of 42 ms. DWI and spectroscopy were acquired with diffusion directions tailored to the long axis of the spinal cord, as previously described, 15 and were measured parallel to the spinal cord with nine b-values (0–2000 s/mm2) combined with a high, constant b-value (2000 s/mm2) perpendicular to the cord (Supplementary Table S1). The acquisition was respiratory gated, and total acquisition time was approximately 20 min, varying slightly because of respiratory rate. For diffusion-weighted spectroscopy, a conventional point-resolved single-voxel spectroscopy (PRESS) was modified to include two pairs of diffusion-encoding gradients across each of the refocusing pulses. A single 10 × 10 × 6 mm voxel was centered at the injury site with sweep width = 4960 Hz, number of points = 256, NEX of 1, TR = 3 sec, and TE = 37 ms. Diffusion-encoding directions were identical to those of the DWI acquisition, except that only parallel diffusivity measurements were included (Supplementary Table S2). Joint respiratory and cardiac gating were used with a total acquisition time of approximately 2 min, varying slightly depending on respiratory rate.
Data analysis
T2 maps were derived by fitting the log-transformed T2-weighted signal intensity to a monoexponential decay using linear least squares. For DWI, maps of the parallel and perpendicular diffusivities were derived using linear least squares by fitting the log-transformed signal to a monoexponential decay to derive perpendicular (ADC⊥) and “filtered” parallel diffusivity from imaged-based DDE (fADC||). For qualitative visualization, color-coded maps were derived by combining and scaling fADC|| (0.0–1.2) and perpendicular-weighted signal-to-noise ratio (SNR) maps (0–30) as red and green channels, respectively. AWF was derived by fitting the voxel-wise diffusion-weighted images according to a biexponential “stick” model assuming a zero radius cylinder Si = S 0 (1 - AWF) exp (- bDF) + S 0 AWF where Si and S0 are the diffusion-weighted and non-diffusion-weighted signal intensities, respectively, DF is the fast diffusivity, and AWF is the restricted or “axonal” water fraction. 31,32 Given that the diffusion-encoding directions were oriented with respect to the spinal cord axis, only the images with perpendicular diffusion-weighted images were included having b-values between 0 and 2000 s/mm2. A non-linear fitting routine was implemented in Matlab (The MathWorks, Inc., Natick, MA) and for each voxel S0 , DF and AWF were estimated with a maximum value of DF of 3.1 μm2/ms and AWF between 0 and 1. The DDE-PRESS value of fADC|| was quantified, as previously described, 15 by integrating the signal from the water peak magnitude spectra (±400 Hz) and fitting to a monoexponential decay.
A single slice centered at the injury epicenter was used for MRI analysis. A region of interest (ROI) analysis was conducted using a semiautomated procedure to derive metrics of spinal cord CSA (mm2), T2 (ms), hemorrhagic area (mm2), and fADC|| (μm2/ms). First, the spinal cord was manually outlined in the T2-weighted images along its outermost contour. To exclude voxels with high cerebrospinal fluid (CSF) partial volume, voxels with T2 values >130 ms were thresholded and excluded based on empirical measurements in pure CSF. Similarly, voxels with hemorrhage were thresholded at T2 values <30 ms based on measurements of the healthy whole-cord T2. Hemorrhagic area was defined as tissue with T2 values <30 ms. DWI used a separate set of ROIs based on previous implementation 13 in which the cord contour was manually placed and only voxels in the perpendicular-weighted images with SNRs >15 were included in the mask. The DDE-PRESS whole-cord analysis was fully automated.
To perform voxel-wise statistical analysis, single-slice images at the lesion epicenter were spatially registered to a common space. Only images from the acute time point (1 dpi) were used because of substantial atrophy at later time points providing a poor basis for accurate registration. A study-specific template was first derived by aligning the spinal cord masks using three iterations of rigid-body translations. Subsequently, quantitative maps (T2 or fADC||) were aligned to the initial templates using three iterations of rigid-body and one iteration of non-linear warping. Maps were resampled using a single interpolation step using the final transformation.
Histological analysis
At 90 dpi, all animals were euthanized with phenobarbital followed by transcardial perfusion with phosphate-buffered saline and 10% formalin. Spinal columns were excised and fixed for an additional 48 h in 10% formalin, and cords were removed from spinal columns before processing. The injury epicenter of each cord was embedded in paraffin and sliced on a microtome in 5-μm sections. Tissue samples were stained with phosphorylated anti–neurofilament H (SMI-31; BioLegend, San Diego, CA) for healthy axons, followed by an Alexa 488 fluorescent secondary antibody (Abcam, Cambridge, MA).
Histological analysis was based on the techniques described in previous works. 15 A single 5-μm slice was analyzed from the injury epicenter for each animal at the 90-dpi time point. Fluorescent images of each section were acquired using a 10 × objective with a resolution of 567 nm/pixel. Image analysis was completed with ImageJ software (v38; National Institutes of Health, Bethesda, MD), using the analyze particles plugin. For each sample, an ROI was manually placed around the entire spinal cord cross-section to derive tissue volume. Background staining was removed using an intensity-based percentile cutoff (ranging from 95% to 98%), and positively stained cells were identified with a minimum size threshold of 1100 μm and circularity constraints >0.1. Percentile cutoffs and thresholds were manually defined to visually include stained axons and exclude background staining. Total counts of positively stained cells for SMI-31 were then used for analysis. 15
Statistical analysis
A Pearson's product moment correlation was used to compare MRI metrics with BBB scores. Separate analyses were performed by correlating MRI metrics with BBB scores at the same time point and final BBB score at 90 dpi. Metrics with significant pair-wise correlations (p < 0.05) with BBB scores were evaluated in a multiple linear regression, including BBB score and time-matched significant MRI metrics. The best performing metrics were compared for strength of correlation with functional outcome with Steiger's test. 33 Voxel-wise correlations between T2 or fADC|| maps and either BBB or micturition utilized the randomize command of FSL to perform a linear regression using non-parametric permutation-based corrections for multiple comparisons.
Results
Magnetic resonance imaging changes of the injured spinal cord
Representative images of a severe-injured and sham spinal cord (Fig. 1) reveal the temporal progression and qualitative changes associated with SCI. At 1 dpi, T2 images from the injured cord exhibited clear hyper- and hypointensities reflecting edema and hemorrhage, respectively. Imaged-based fADC|| also exhibited decreased parallel diffusion in the severely injured animal at the early time point as compared with the sham injury. At this early time point, there was minimal loss of tissue and little evidence of changes in AWF derived from DTI, as expected. At 30 dpi, T2 images showed evidence of spinal cord atrophy reflected as a decrease in visible tissue volume, with the residual tissue having elevated T2 values compared to the sham cord at the same time point. AWF and fADC|| both also exhibited spinal cord abnormalities, with AWF decreased slightly compared to the acute time point. fADC|| appeared to renormalize compared with the acute time point. At 90 dpi, T2 images showed more substantial spinal cord atrophy, with qualitative evidence of T2 hyperintensity in the cord compared to the sham injury. AWF showed a clear reduction in the residual spinal cord tissue whereas fADC|| was comparatively normal in the residual tissue. The descriptive measures for BBB score and MRI metrics are shown in Table 1 for the 1-, 30-, and 90-day time points.

Representative MRIs. Comparison of a severe-injured rat (left) with a sham-injured rat (right) shows the evolution of cord degeneration over time after a contusion injury as measured with multiple imaging modalities. fADC|| images derived from DDE demonstrate color-coded estimates of axonal density (green) and axonal injury (red), with more axonal injury observed acutely followed by degeneration of these injured axons over time. Axonal water fraction (AWF) showed an overall decrease over time after injury and reduction compared to sham animals. Finally, T2-weighted images showed areas of increased signal in the cord with the development of fluid collections in areas of axonal degeneration. fADC|| “filtered” parallel diffusivity from imaged-based DDE; DDE, double-diffusion encoding; SNR, signal-to-noise ratio. Color image is available online.
Mean Values Grouped by Injury Severity at 1, 28, and 90 DPI
Values indicate mean (SD), and all MRI metrics are from a single slice at the lesion epicenter. Units are: ADC|| = μm2/ms; AWF = fraction; area = mm2.
dpi, days post-injury; BBB, Basso, Beattie, and Bresnahan; ADC||, parallel diffusivity from imaged-based DDE; AWF, axonal water fraction; CSA, cross-sectional area; SD, standard deviation; MRI, magnetic resonance imaging;
Relationships between magnetic resonance imaging and neurological function
At each of the time points of MRI examination, the resulting whole-cord MRI metrics were compared with the BBB score at the same time point (Table 2), both with and without sham animals included in analysis. Sham animals were excluded from regressions to avoid a ceiling effect given that BBB score has a non-normal distribution. At 1 dpi, fADC|| derived from single-voxel DDE-PRESS exhibited the strongest correlation with BBB score (R 2 = 0.461; p < 0.001). Image-based fADC|| was also significantly correlated with BBB (R 2 = 0.145; p = 0.042), but to a lesser extent than the spectroscopic acquisition (z = 2.139; p = 0.032). T2 was correlated with BBB score (R 2 = 0.176; p = 0.021) whereas hemorrhagic area was not (R 2 = 0.063; p = 0.179). As expected, neither AWF (R 2 = 0.005; p = 0.728) nor T2- derived CSA (R 2 = 0.005; p = 0.173) were correlated with BBB score at the acute time point. At 30 dpi, AWF was a strong correlate of BBB score (R 2 = 0.574; p = 0.001) at the same time point, CSA at this time point was also correlated with BBB scores (R 2 = 0.366; p = 0.006). There was no statistical difference between the relationships AWF and CSA have with 30-dpi BBB scores (z = 0.896; p = 0.37039). fADC|| from DDE-PRESS had a significant, but relatively modest, correlation with BBB score (R 2 = 0.177; p = 0.051). At 90 dpi, spinal cord CSA measured with T2 had the strongest correlation with BBB (R 2 = 0.392; p = 0.002) whereas hemorrhagic area (R 2 = 0.257; p = 0.013) also had a significant correlation (Fig. 2). T2-derived CSA did not have a significantly stronger correlation with 90-dpi BBB score than hemorrhagic area (z = 0.502; p = 0.615).
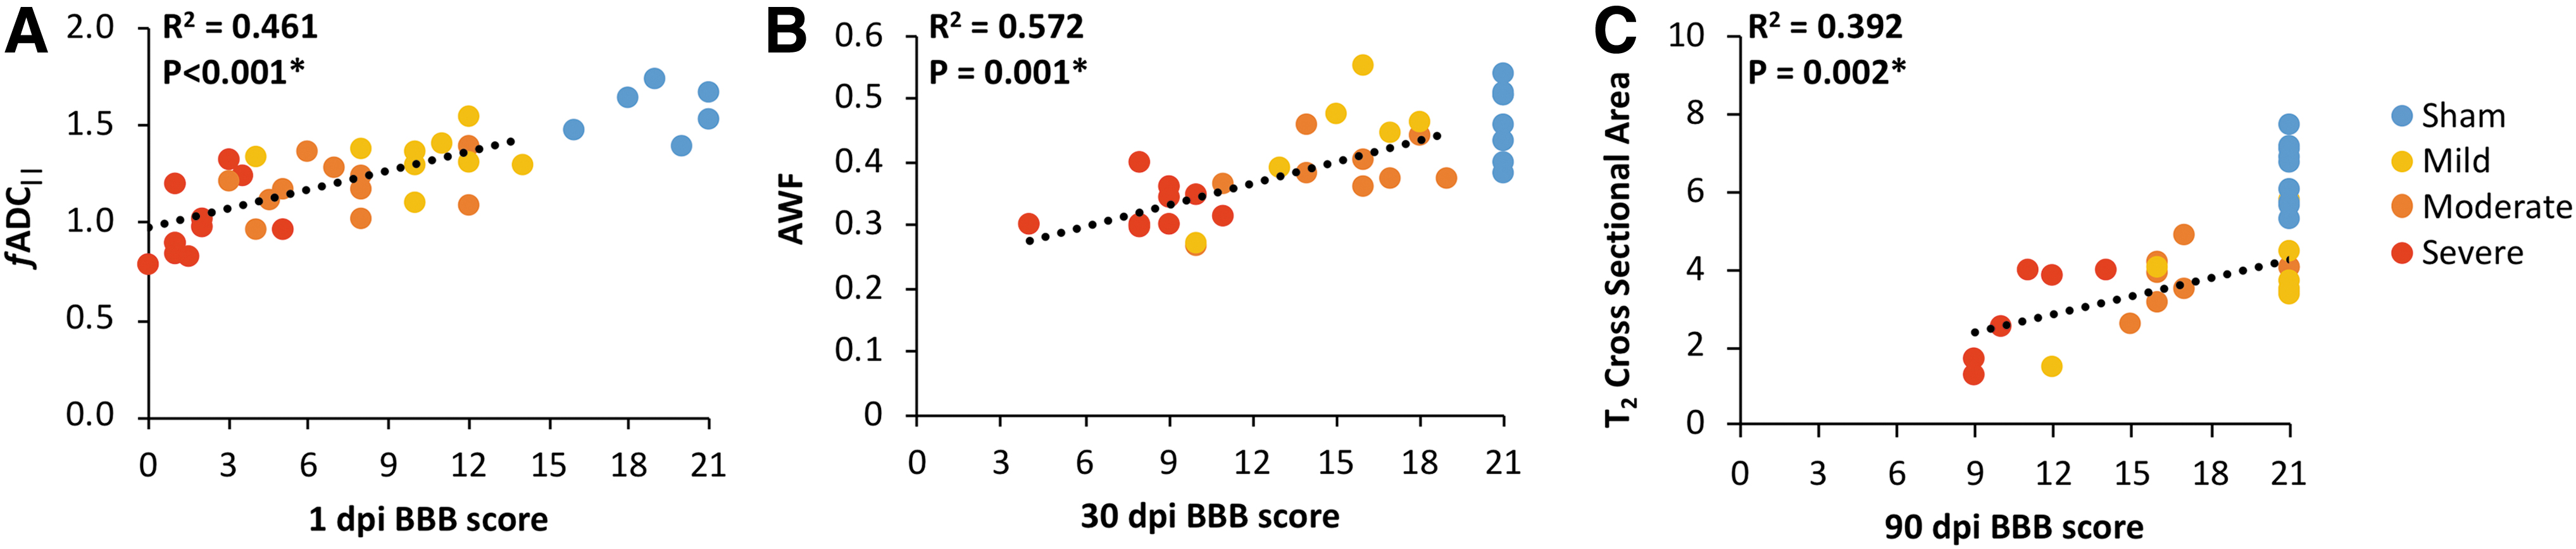
Significant time-matched correlations. Scatterplots depicting the statistically significant correlations between 1-dpi BBB score and 1-dpi DDE-PRESS (
Time-Matched Correlations between MRI Metrics and BBB Score
Indicates significance of p < 0.05.
MRI, magnetic resonance imaging; BBB, Basso, Beattie, and Bresnahan; dpi, days post-injury; fADC||, “filtered” parallel diffusivity from imaged-based DDE; DDE, double-diffusion encoding; PRESS, point-resolved single-voxel spectroscopy; AWF, axonal water fraction; CSA, cross-sectional area;
Acute and subacute MRI metrics were also evaluated in their accuracy in predicting long-term outcomes (Table 3). Of the metrics derived at 1 dpi, fADC|| from DDE-PRESS was the strongest predictor (R 2 = 0.436; p = 0.001) of the 90 dpi BBB score, with T2 also having a moderately strong relationship with outcome (R 2 = 0.210; p = 0.032). In a multiple linear regression including all acute MRI metrics with significant correlations with outcome (Table 4), fADC|| derived from DDE-PRESS was an independent predictor of chronic BBB score (β = 0.599; p = 0.001) whereas T2 was also a significant, albeit weaker, predictor of 90-dpi BBB score (β = −0.380; p = 0.022). One-day post-injury fADC|| derived from DDE-PRESS and T2 taken from the injury epicenter were found to have a poor correlation (R 2 = 0.098; p = 0.091) with one another. Steiger's test revealed that fADC|| was a significantly stronger predictor than T2 (z = 3.776; p < 0.001). At 30 dpi, both AWF (R 2 = 0.533; p = 0.003) and CSA (R 2 = 0.291; p = 0.031) exhibited the strongest correlations with 90-dpi BBB score. Image-based fADC|| (R 2 = 0.270; p = 0.047) also had a significant correlation. In the multiple regression analysis, AWF (β = 0.706; p = 0.006) was an independent predictor of outcome, with CSA (β = 0.635; p = 0.001) having a slightly reduced, but significant, relationship with 90-day BBB score. AWF was not found to be a statistically stronger predictor of 90-dpi BBB than CSA (z = 0.953; p = 0.341).
1-DPI and 30-DPI MRI Metrics as Predictors for 90-DPI BBB Score
Indicates significance of p < 0.05.
dpi, days post-injury; MRI, magnetic resonance imaging; BBB, Basso, Beattie, and Bresnahan; fADC||, “filtered” parallel diffusivity from imaged-based DDE; DDE, double-diffusion encoding; PRESS, point-resolved single-voxel spectroscopy; AWF, axonal water fraction; CSA, cross-sectional area;
Multiple Regression for Predictive MRI Metrics
Indicates significance of p < 0.05.
MRI, magnetic resonance imaging; dpi, days post-injury; DDE, double-diffusion encoding; PRESS, point-resolved single-voxel spectroscopy; AWF, axonal water fraction; CSA, cross-sectional area; BBB, Basso, Beattie, and Bresnahan.
Relationships with bladder function
Days required to regain micturition reflex was not significantly related to 1-dpi BBB score (R 2 = 0.059; p = 0.243; Fig. 3) or to T2 volume at 90 dpi (R 2 = 0.111; p = 0.130). No significant relationships emerged between time to recovery of micturition reflex and any of the whole-cord MR metrics. The voxel-wise analysis between acute MRI metrics and either BBB or micturition showed regional correlations indicative of the underlying tracts (Fig. 4). There was no clear relationship between fADC|| and recovery of micturition reflex, but correlations between T2 and micturition revealed focal regions, predominantly in the lateral white matter tracts.
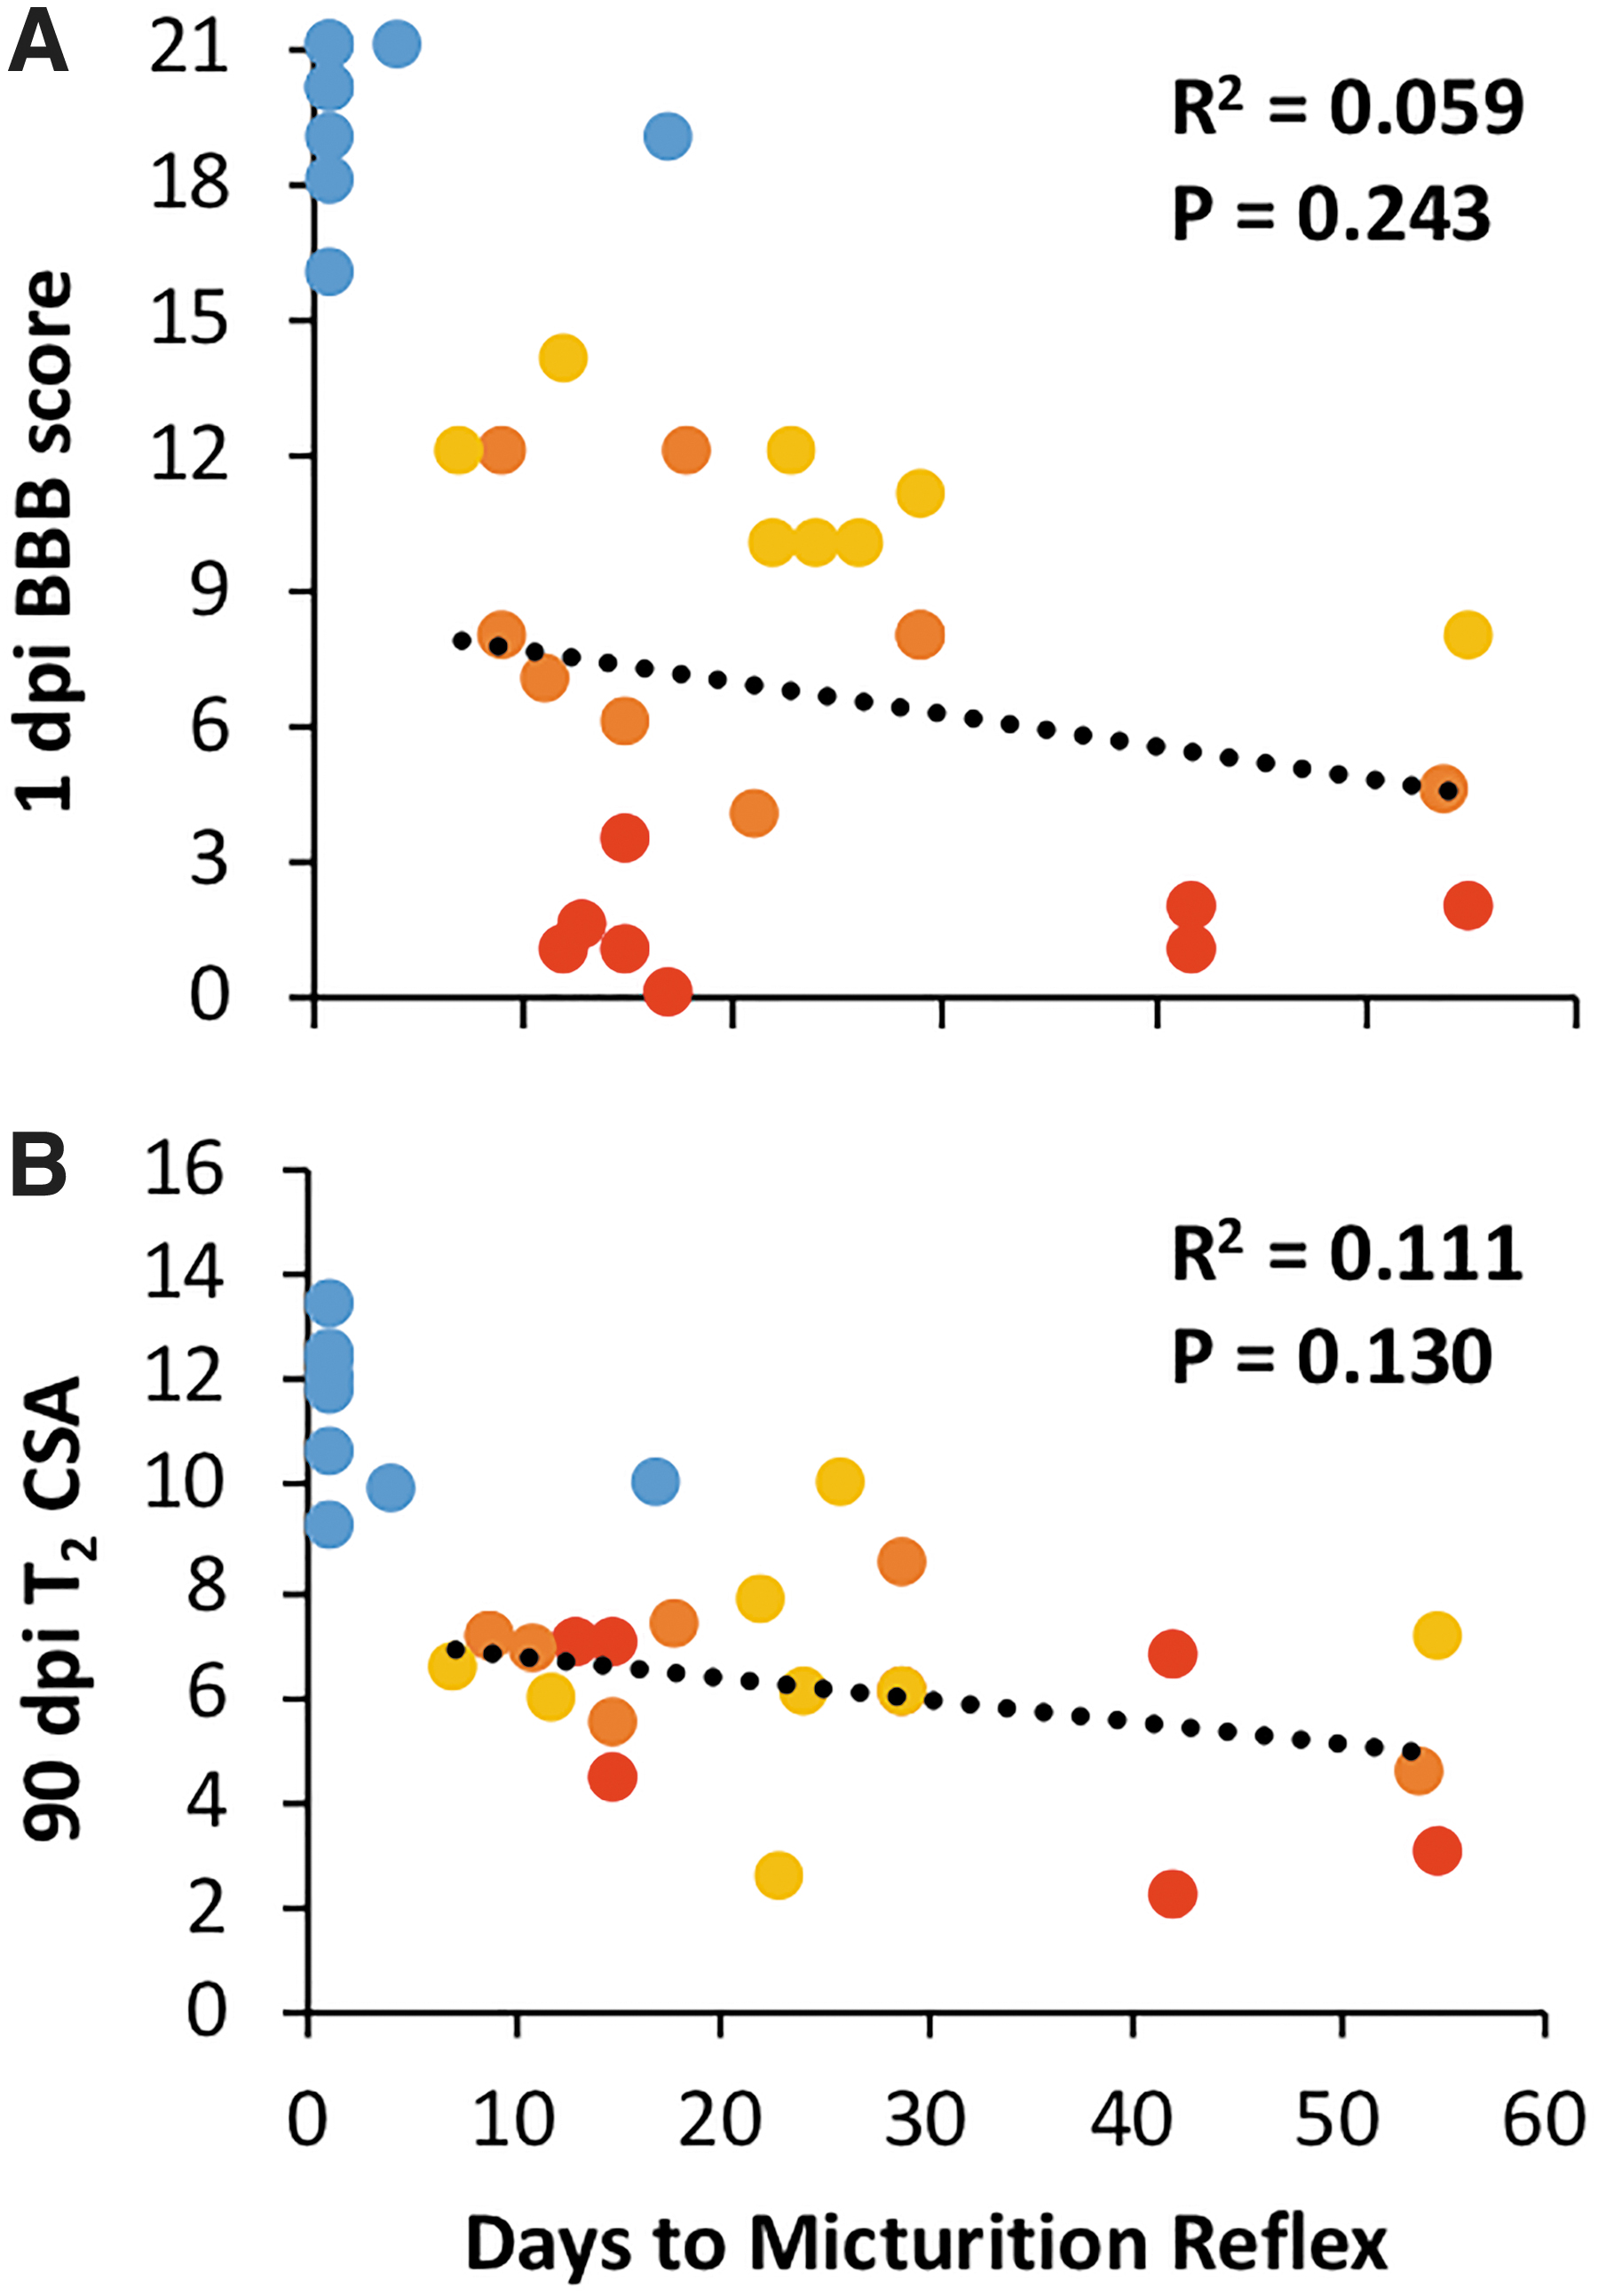
Micturition correlations. Scatterplots depicting the correlation between latency to micturition reflex recovery and 1-dpi BBB score (

Voxel-wise statistics. Maps of fADC|| and T2 at the epicenter from the acute time point were spatially registered to a common study-specific template space. Voxel-wise correlations between each of the MRI metrics and either BBB or days to micturition were performed. Both fADC|| and T2 had strong correlations with BBB throughout much of the spinal cord white matter. Correlations between T2 and micturition revealed relationships localized to the lateral white matter tracts. BBB, Basso, Beattie, and Bresnahan; fADC|| “filtered” parallel diffusivity from imaged-based DDE; MRI, magnetic resonance imaging. Color image is available online.
Histology
Representative images of histological sections obtained from animals at 90 dpi at the injury epicenter are shown in Figure 5. Specimens showed increasing tissue loss at the injury site related to injury severity. Sham specimens all appeared intact, without obvious atrophy or gray matter damage. Quantitatively, SMI-31 staining for intact axons revealed more labeled axons in sham animals than injured animals, with intact axons decreasing as injury severity increased.

Histology. Representative histological samples stained with SMI-31 of injury severities with matched T2 images; both images and histology are at the chronic time point, 90 dpi. (
As expected, both tissue volume and axonal counts measured on histological sections at the injury epicenter inversely correlated with functional outcome. Axonal counts and 90-dpi BBB had a significant correlation (R 2 = 0.232; p = 0.027) whereas histological tissue volume did not have a significant correlation with 90-dpi BBB (R 2 = 0.150; p = 0.083). Sham animals were included in comparisons between histological and MRI measures given that both metrics are continuous variables with approximately normal distributions. T2 CSA was significantly related to histology-derived tissue area (R 2 = 0.585; p < 0.001). Axonal counts and AWF were also significantly correlated (R 2 = 0.207; p = 0.011).
Discussion
Magnetic resonance imaging metrics as correlates and predictors of neurological function
Quantitative whole-cord MRI metrics from DWI and T2 exhibited differential sensitivity to injury severity during evolution of recovery from contusion SCI. In the acute post-injury period, DWI had the strongest relationship with injury severity both at the same acute time point and as a predictor of chronic functional outcome. Immediately after injury, the primary vascular and neuronal shearing that likely occurs manifests as hemorrhage, edema, and axonal swelling. 18,24,34,35 Diffusivity measured parallel to the spinal cord, often measured as axial diffusivity from DTI but as filtered ADC|| (fADC||) in this study, has been found to be a strong indicator of changes in axonal structure after injury. fADC|| was designed to detect microscopic changes that manifest as axonal beading, which are observed through in vivo microscopy of the traumatically injured cord, 35 whereas specificity is improved by suppressing the contribution of edema presumed to be extracellular water. Beyond this acute time point, the residual spinal cord tissue at the site of injury is composed of a mixture of spared axons, degenerating axons, and glial and inflammatory remnants. Both T2-derived CSA and AWF (axonal sparing) were strongly correlated to injury at this subacute time point, with a minor, but still significant, association with fADC|| that is believed to represent ongoing degeneration. Finally, as the injury progressed into the chronic stage, a persistent level of residual tissue remained. Although gliosis never completely resolves, the spared tissue at the injury site is a clear indicator of the extent of injury. At this stage, atrophy as measured by CSA was the strongest correlate of neurological severity, again confirming the strong characteristic relationship between spared tissue and long-term neurological function in the contusion model. 36,37
The major goal of investigating biomarkers for SCI is to predict injury severity in the acute setting as a marker of eventual outcome. 6,10,25,27,34,38 –41 Biomarkers with high prognostic value would provide both the patient and medical team knowledge about the likelihood of neurological improvement and potentially aid in stratification in clinical trials. Although T2-weighted imaging in the sagittal plane is often used clinically for visualization of injury, it is a poor predictor of outcome given that the longitudinal extent of edema does not directly relate to the extent of cord damage and it tends to change rapidly over the early injury period. 4,7,10 On the other hand, axial T2-weighted imaging, along with classification of the lesion extent using the BASIC criteria, have shown stronger predictive power than the longitudinal extent of edema. 4,7 Indeed, quantitative T2 measures in the acute time point demonstrate a significant relationship with both acute and chronic BBB scores, supporting the relationship between edema and injury severity. However, our results also show the greater predictive power of DWI in the same cohort in a direct comparison. DWI is typically not obtained nor used clinically in acute SCI patients, largely because of technical difficulty and lack of clear visualization of injury. Across multiple cohorts in this and prievious studies, 4,14,15,18,19,21,22 DWI parameters tailored to the spinal cord have strong relationships with injury severity and are predictive of outcomes. These results warrant applications to SCI patient studies to identify the predictive power in humans.
Extent of hemorrhage in the acutely injured human spinal cord has also been shown to be related to severity and the possibility of recovery in ASIA grade. 42 –45 However, our results did not show a strong association between acute hemorrhage and severity as measured with the BBB scale. Unlike the BASIC score in which hemorrhage is identified as the more severe case, hemorrhage in this thoracic contusion rodent model is variable and evident in the cord at all severity levels, not just in the most severely injured animals. Hemorrhage was only mildly predictive of severity at the subacute and chronic time points. As expected and as shown in other studies, CSA (atrophy) was also only correlated with injury severity at the subacute and chronic time points. For instance, Freund and colleagues demonstrated that atrophy is the strongest correlate of chronic injury severity 6,26,27 and continues to progress throughout the neuroaxis in the months to years after the initial insult. Given that both hemorrhage and CSA are metrics reliably obtained by T2-weighted sequences traditionally used in clinical diagnosis, it suggests that T2-weighted imaging at the site of injury may provide the most information about injury severity and outcome beyond the acute time point. Given the evolution of SCI in the early acute to subacute stages, the MRI metrics of interest will need to depend on the underlying pathophysiology to have maximal sensitivity to injury severity.
We have previously shown that a single-voxel DDE acquisition at the lesion site is a strong predictor of outcome in this same animal model. 13,14 Notably, the diffusion “filter” was consistently and purposefully applied in the left to right direction. Curvature of the spinal cord is more prominent along the dorsal to ventral axis, and the left-right axis is likely to be more closely aligned with the magnetic field and therefore facilitates setup of the voxel and imaging slices, but noting this may be a practical concern to be addressed in translational settings. The current work also conducted a direct comparison between the imaging and spectroscopic voxel readouts in the same animals at the same locations. Whereas these two techniques derive similar measurements of whole-cord fADC||, the DDE-PRESS technique trades spatial information for a faster acquisition, fewer artifacts, and fully automated analysis. Results revealed that DDE-PRESS in the acute setting was a better predictor compared to imaging, but with important caveats. The SNR of PRESS is substantially greater than that of imaging, but is unable to resolve individual tracts throughout the white matter; more discrete evaluation of functional outcomes, such as micturition, requires this spatial analysis (Fig. 4). The lateral funiculi of the spinal cord are known to play a role in bladder control, and during a contusion injury, the funiculi are only partially damaged resulting in impaired bladder function. 46 –49 Thus, these two techniques complement one another, and ongoing studies in human SCI will compare their relative merits for clinical translation.
Limitations and caveats
BBB is considered the gold standard for measuring locomotor function in rodent models of SCI. Despite its widespread use, it is subjective and has been shown to have satisfactory sensitivity and reproducibility with mild injuries, but lower reproducibility and sensitivity with animals at the lower (i.e., more severe) end of the scale, 50 which can result in difficulties distinguishing between severe and moderate injuries. In addition, BBB scoring in this study was not blinded, leading to an increased risk of bias. A second limitation in this study is that micturition was quantified as latency to recover bladder reflex, which was suboptimal compared to objective and more standard measures such as urine volume. 38,47 –49,51 Additionally, ROIs for MRI analysis and histological analysis were semiautomated; however, in some instances, ROIs needed to be manually modified, which could potentially lead to an increased risk of bias. Automated methods to segment the spinal cord have been developed, 52,53 but these tools have not been refined for pre-clinical studies and do not perform adequately with severe morphological disruption such as in trauma. Additionally, the investigation of solely the site of injury is a limitation, given that measurements that extend beyond the injury site have been shown to relate more strongly to outcomes. 54 Finally, only female rats were used in this study because of increased risk for urinary tract infection in male rats. Although no sex differences in SCI severity or locomotion have been shown, the sex differences in the relationships between imaging biomarkers and functional outcomes, such has urination, have been inadequately examined. 55
Conclusion
In a rat model of SCI, diffusion parallel to the spinal cord (fADC||) measured in the acute setting was found to determine injury severity and predict long-term outcome better than quantitative T2 MRI features. The increased specificity may make these techniques impactful diagnostic tools at the acute time point. Although T2-weighted imaging is commonly used acutely in the clinical setting, quantitative T2 measurements of the spinal cord in this study provided the most information about injury severity only at the chronic time points given that atrophy is known to be a strong correlate of functional outcome. The predictive power of DDE in a rodent model shows that there is strong potential for these sequences to be further investigated in clinical studies.
Footnotes
Acknowledgments
The authors acknowledge the Bryon Riesch Paralysis Foundation for their continuing support.
Funding Information
This project was partially funded by Merit Review Award I01 RX001497 from the U.S. Department of Veterans Affairs Rehabilitation Research and Development Service (to S.K.) and support by the National Institute of Neurological Disease and Stroke of the National Institutes of Health under award number R01NS109090. The content is solely the responsibility of the authors and does not necessarily represent the official views of the National Institutes of Health.
Author Disclosure Statement
No competing financial interests exist.
Supplementary Material
Supplementary Table S1
Supplementary Table S2
References
Supplementary Material
Please find the following supplemental material available below.
For Open Access articles published under a Creative Commons License, all supplemental material carries the same license as the article it is associated with.
For non-Open Access articles published, all supplemental material carries a non-exclusive license, and permission requests for re-use of supplemental material or any part of supplemental material shall be sent directly to the copyright owner as specified in the copyright notice associated with the article.