
Abstract
Prognostic biomarkers for post-injury outcome are necessary for the development of neuroprotective and antiepileptogenic treatments for traumatic brain injury (TBI). We hypothesized that T2 relaxation magnetic resonance imaging (MRI) predicts the progression of perilesional cortical pathology and epileptogenesis. The EPITARGET animal cohort used for MRI analysis included 120 adult male Sprague-Dawley rats with TBI induced by lateral fluid-percussion injury and 24 sham-operated controls. T2 MRI was performed at days 2, 7, and 21 post-TBI. The lesioned cortex was outlined, and the T2 value of each imaging voxel within the lesion area was scored using a five-grade pathology classification. Analysis of 1-month video-electroencephalography recordings initiated 5 months post-TBI indicated that 27% (31 of 114) of the animals with TBI developed epilepsy. Multiple linear regression analysis indicated that T2-based classification of lesion volume at day 2 and day 7 post-TBI explained the necrotic lesion volume with greatly increased T2 (>102 ms) at day 21 post-TBI (F (13,103) = 52.5; p < 0.001; R 2 = 0.87; adjusted R 2 = 0.85). The volume of moderately increased (78–102 ms) T2 at day 7 post-TBI predicted the evolution of large (>12 mm3) cortical lesions (area under the curve, 0.92; p < 0.001; cutoff, 1.9 mm3; false positive rate, 0.10; true positive rate, 0.62). Logistic regression analysis, however, showed that the different severities of T2 lesion volumes at days 2, 7, and 21 post-TBI did not explain the development of epilepsy (χ2 (18,95) = 18.4; p = 0.427). In addition, the location of the T2 abnormality within the cortex did not correlate with epileptogenesis. A single measurement of T2 relaxation MRI in the acute post-TBI phase is useful for identifying post-TBI subjects at highest risk of developing large cortical lesions, and thus, in the greatest need of neuroprotective therapies after TBI, but not the development of post-traumatic epilepsy.
Introduction
Around 5 million people are diagnosed with epilepsy each year. 1 In 60% of cases, epileptogenesis is initiated by structural causes such as traumatic brain injury (TBI) or intracerebral hemorrhage. 2 Over 10 hypothesis-driven monotherapy approaches have demonstrated some disease-modifying effects in models of post-traumatic epileptogenesis (i.e., development of epilepsy and progression after the condition is established). 3,4 However, no antiepileptogenic treatments are available in clinic, and their development remains a major unmet medical need and a research priority in both Europe and the United States. 5 –7 One major obstacle in the way of therapy development is the lack of prognostic biomarkers for epileptogenesis that could be used to stratify patient populations for antiepileptogenesis trials and reduce study costs, making sufficiently powered clinical trials affordable. 8,9
Months-long video-electroencephalography (vEEG) monitoring data from several laboratories indicate that lateral fluid-percussion injury (FPI)-induced TBI triggers epileptogenesis in ∼25–50% of rats that progresses over time. 10 –15 As demonstrated in humans with epilepsy that developed after TBI, recent analyses in the lateral FPI model, using functional magnetic resonance imaging (fMRI) and intracortical electrophysiological recordings, indicate that the perilesional cortex is an epileptogenic region. 13,16,17 The post-injury molecular and cellular ecosystem in the lesioned cortex is highly plastic and its composition varies, depending on the sampling location and time. Edema, neurodegeneration, gliosis, vascular damage, reorganization of axons, and dendrites, as well as accumulation of iron deposits indicating hemorrhage, are associated with the pathophysiology of acquired epileptogenesis and could serve as sources for biomarker discovery. 9 We and others have shown that the progression of cortical lesions can continue for weeks to months after an insult, and the molecular and cellular components vary among animals, 18 –21 leading to the hypothesis that a particular lesion type could be associated with epileptogenesis.
The spatiotemporal evolution of cortical pathology can be monitored in vivo in animal models of TBI with magnetic resonance imaging (MRI), which is non-invasive, safe, and translatable to clinical epileptogenesis studies. Several studies have demonstrated the feasibility of this approach in both animal models and humans, including those with TBI. 9 Frey and colleagues 22 reported that the greater the blood–brain barrier disruption, edema-related interhemispheric volume difference, or apparent diffusion coefficient at 72 h post-injury, the higher the susceptibility to kainate-induced seizures at 3 months after injury. Immonen and colleagues 23 found that the greater the T1ρ relaxation time at 9 or 23 days after lateral FPI and the mean diffusivity measured at 2 months after lateral FPI, the higher the seizure susceptibility at 12 months post-injury. Clinical studies suggest that the accumulation of hemosiderin deposits and the leakiness of glial scar tissue around the TBI-induced cortical lesion core are associated with the development post-traumatic epilepsy (PTE). 24 Another study suggested that blood–brain barrier leakiness, rather than lesion volume, is associated with post-traumatic epileptogenesis. 25
Findings of previous experimental and clinical studies led us to focus on T2 relaxation to probe the post-injury edema, which increases T2, and post-impact hemorrhage, which lowers T2, as candidate pathologies for biomarker discovery. We hypothesized that the extent and severity of acute cortical abnormalities in T2 relaxation MRI will predict the progression of perilesional cortical pathology and, consequently, epileptogenesis. We analyzed the EPITARGET cohort, which is the largest animal cohort imaged and extensively vEEG monitored to date and includes 120 injured and 24 sham-operated experimental controls (
Methods
The study design is shown in Figure 1. Data were collected using common data elements and case report forms, and stored in the electronic RedCap database (
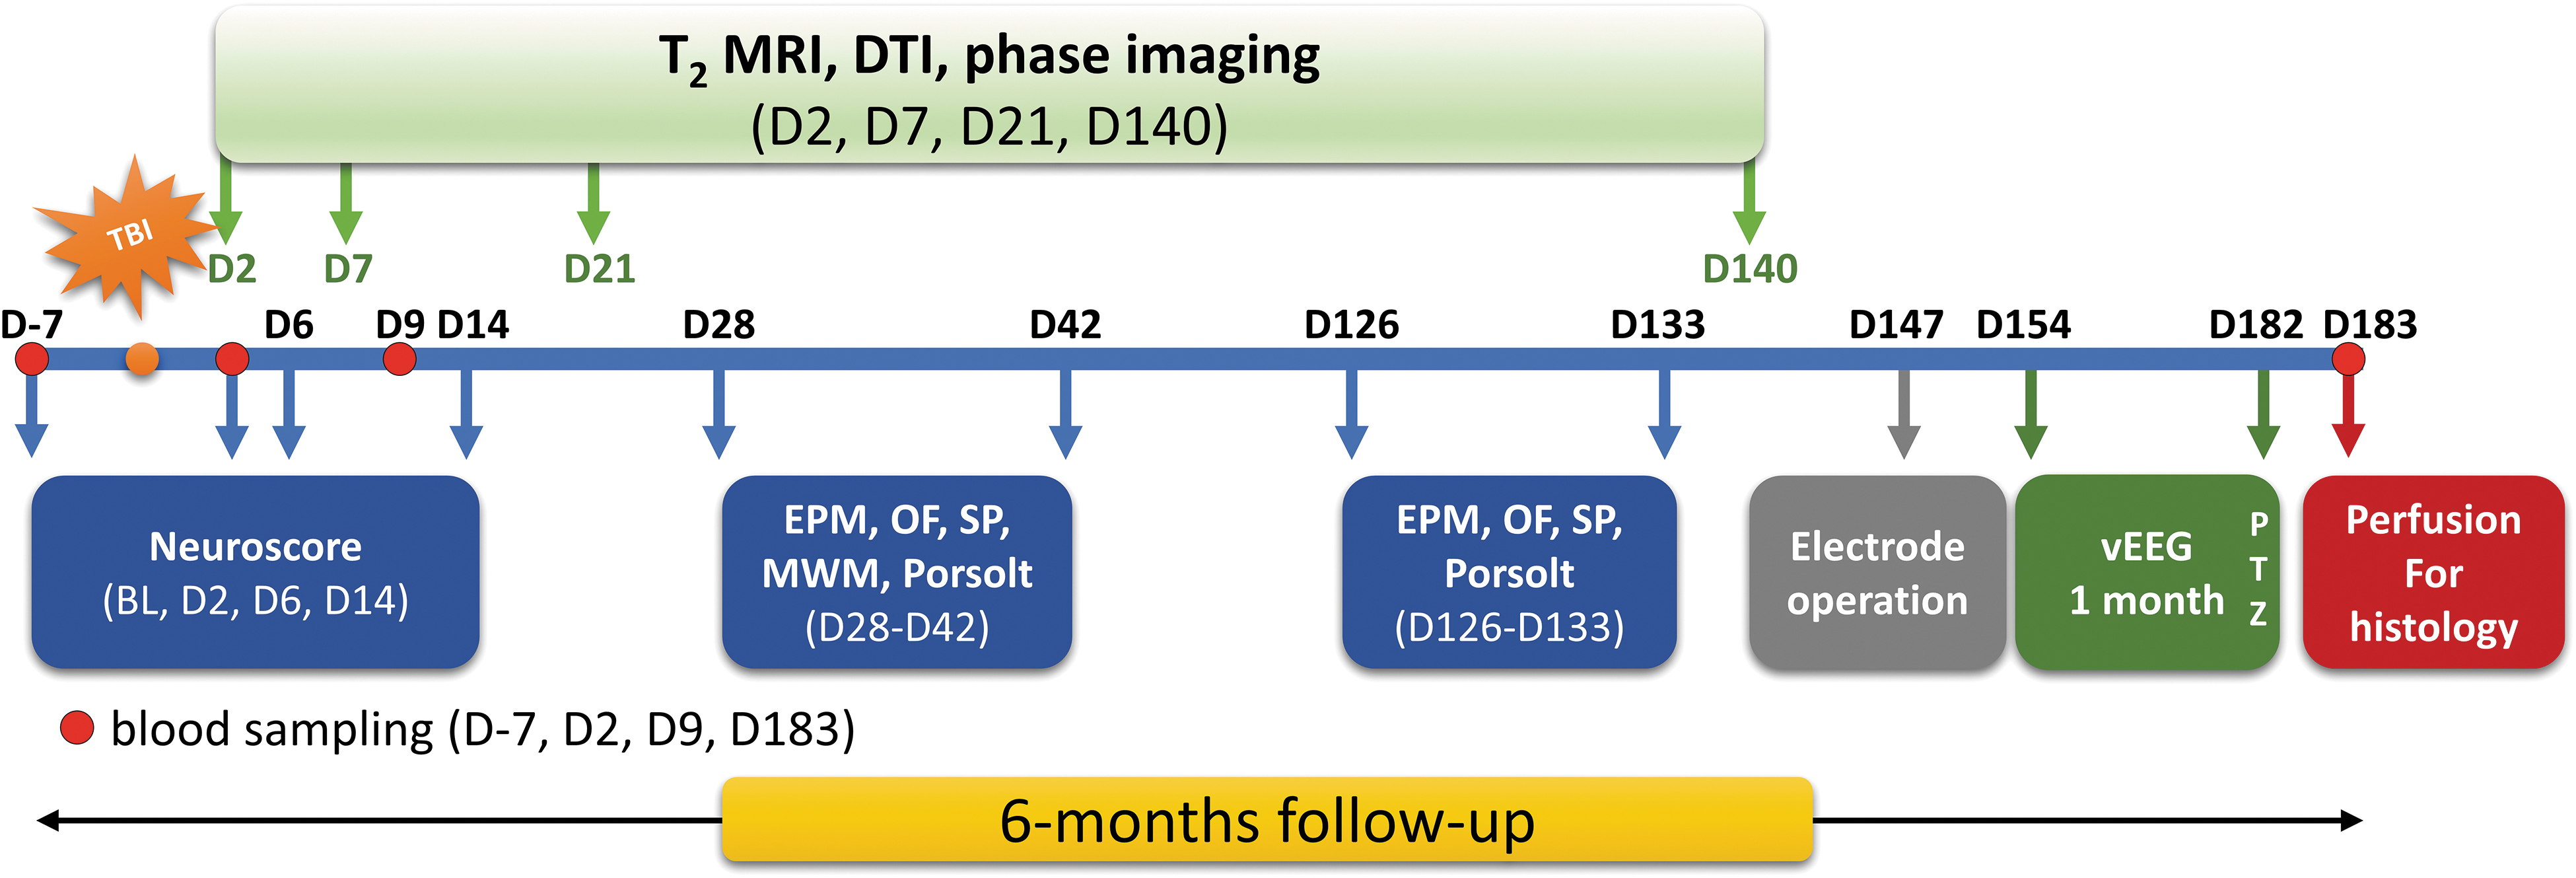
Study design. The EPITARGET animal cohort was followed up for 6 months after lateral fluid-percussion–induced traumatic brain injury (TBI). Rats underwent extensive magnetic resonance imaging (MRI) follow-up, including T2 mapping, diffusion tensor imaging (DTI), and phase imaging. Plasma was sampled on day 7 before TBI (D-7) and on days 2, 9, and 183 after TBI. Behavioral monitoring included the composite neuroscore test at baseline (BL) and on days 2, 6, and 14 post-TBI as well as the elevated plus-maze (EPM), open-field (OF), sucrose preference (SP), Morris water maze (MWM), and Porsolt forced swim tests. During the sixth month, animals were continuously monitored with video electroencephalography (vEEG) to detect spontaneous seizures. At the end of the vEEG monitoring, animals underwent seizure-susceptibility testing by injecting pentylenetetrazol (PTZ). Rats were then perfused for histology. The current study reports the data of the T2 MRI analysis on days (D) 2, 7, and 21. Color image is available online.
Animals
Adult male Sprague-Dawley rats (n = 144; mean body weight, 356 g; standard deviation [SD], 13; median, 356; range, 331–419; Envigo Laboratories S.r.l., Udine, Italy), followed up for 6 months and phenotyped for epilepsy diagnosis, were included in the analysis. Animals were housed in individual cages in a controlled environment (temperature 21–23°C, humidity 50–60%, lights on 7:00 am to 7:00 pm) with free access to food and water. All the experiments were approved by the Animal Ethics Committee of the Provincial Government of Southern Finland and performed in accordance with the guidelines of the European Community Council Directives 2010/63/EU.
Lateral fluid-percussion–induced traumatic brain injury
TBI was induced by lateral fluid percussion. 28 The mean impact pressure in the analyzed cohort was 3.26 atm (SD, 0.08). Time in apnea as well as occurrence and duration of impact-related seizure-like behaviors were monitored and recorded. Sham-operated experimental controls underwent the same anesthesia and surgical procedures without induction of the lateral FPI.
Magnetic resonance imaging protocol
A total of 144 (24 sham, 120 TBI) rats were imaged on days 2, 7, and 21 after inducing TBI or sham operation using a 7 Tesla Bruker PharmaScan magnet with ParaVision 5.1 software (Bruker BioSpin MRI GmbH, Ettlingen, Germany). Rats were anesthetized with isoflurane (1.5–2.5%, with carrier gas comprising 70% nitrogen and 30% oxygen). Body temperature (by rectal probe) and breathing rate (by pneumatic probe under the body) were monitored during imaging.
An actively decoupled volume radiofrequency coil (inner diameter, 72 mm) and a quadrature rat brain surface coil were used as the transmitter and receiver, respectively. Local magnetic field inhomogeneity over the brain was minimized using a three-dimensional field-map–based shimming protocol from Bruker. Bruker's Multi-Slice-Multi-Echo sequence was used to acquire images for estimation of the T2 relaxation coefficient. Twenty-four coronal slices were collected with a slice thickness of 500 μm and no gaps between slices; the slice excitation order was interleaved. Field of view was set large enough to contain the whole rat head. Saturation slices could thus be excluded from the sequence, reducing the influence of magnetization transfer on the relaxation measurement. The matrix size for reconstructed images was 212 × 212 with a partial Fourier acceleration factor of 1.325 along the phase-encoding direction, resulting in an encoding matrix of 212 × 160 in the frequency domain. In-plane resolution was 200.9 × 200.9 μm2 in the image domain. The repetition time was 3016 ms. Six echoes were recorded with echo times (TEs) 14.6, 29.2, 43.8, 58.4, 73.0, and 87.6 ms. Finally, signals from two measurements were averaged. Imaging time for the sequence was 16 min 5 sec.
Magnetic resonance imaging data analysis
Monoexponential decay was used to model signal attenuation as a function of echo time. T2 and S0 (signal magnitude at zero TE) were estimated for each imaging voxel using non-linear least squares estimation.
The Fiji distribution 29 of ImageJ (National Institutes of Health, Bethesda, MD) 30 was used for region of interest (ROI) selection. The perilesional cortical ROI (i.e., cortex around the necrotic lesion core; at early time points when the necrosis is developing, all lesioned cortex was included under the term) was outlined manually in each 0.5-mm-thick coronal slice given that animal-dependent TBI-induced progressive cortical atrophy does not allow for the use of standard templates. The lateral edge of the ROI was in the rhinal fissure. The medial edge extended medially until the entire area of the cortical perilesional T2 signal enhancement was included in the ROI (Fig. 2A). Voxels near the pial surface and external capsule (typically 1-voxel extent) were excluded from the ROIs to mitigate a partial volume effect (Fig. 2B).

(
T2 values within the ROI were used to grade the severity and extent of tissue pathology. Histograms showing the proportions of pooled T2 values in different intervals in the sham-operated experimental control group and TBI group were prepared (Fig. 3). To define T2 relaxation values for normal cortical tissue, all perilesional cortical voxels from all sham-operated experimental controls and all time points were pooled. The lower T2 limit for normal tissue was defined as the 2.5th percentile (45 ms) and the upper limit as the 97.5th percentile (55 ms) of the T2 values for the combined pool of voxels. Tissue with T2 values between these limits (45–55 ms) was categorized as normal (belonging to a category of normal tissue, R0). Tissue with a T2 value smaller than the lower limit was categorized as having a decreased T2 value (<45 ms, region R–).

Histograms showing the distribution of pooled voxel T2 values in (
TBI rats had a wide range of T2 values (55–500 ms) in the perilesional cortex during the follow-up (Fig. 3B). On day 2, almost without exception, the T2 of the perilesional cortical voxels was <100 ms whereas by day 21 post-TBI, the T2 of some voxels had increased to 500 ms. To elucidate the dynamics of the progression of perilesional pathology, elevated T2 values for each voxel were stratified into three categories (R+, R++, and R+++). First, all perilesional cortical voxels from all TBI rats were pooled separately at each of the three time points. Tissue with T2 values higher than the 99.9th percentile of the T2 values at day 2 post-TBI was categorized as having a greatly increased T2 value (>102 ms, category R+++). The threshold for a moderately increased T2 value (78–102 ms, R++) was iteratively selected so that the pool of such voxels in TBI rats decreased by 80% between day 2 and day 7 post-TBI. T2 values between 55 and 78 ms were considered slightly increased (R+).
The total volume for each of the categories was computed and labeled as V– (volume of region R-, decreased T2), V0 (volume of region R0, normal T2), V+ (volume of region R+, slightly increased T2), V++ (volume of region R++, moderately increased T2), and V+++ (volume of region R+++, greatly increased T2).
To analyze the extent and location of perilesional cortical pathology, we created a two-dimensional (2D) unfolded cortical map of the T2 relaxation. First, we computed the T2 relaxation along the curvature of the cortex in each axial imaging slice (Fig. 2B). Next, we averaged the T2 relaxation along the thickness of the cortex at each location. Representative examples of the unfolded 2D maps of T2 relaxation on the cortex are shown in Figure 2C,D.
To enable location-dependent comparison of the unfolded cortical maps between the animals, the rostrocaudal location of each imaging slice was determined by comparing the images to the coronal plates of a rat brain atlas. 31 The unfolded cortical map was then smoothed with a Gaussian kernel (SD, 0.5 mm) and interpolated to a uniform grid with 0.5 × 0.5 mm2 resolution.
Video-electroencephalography monitoring of spontaneous seizures
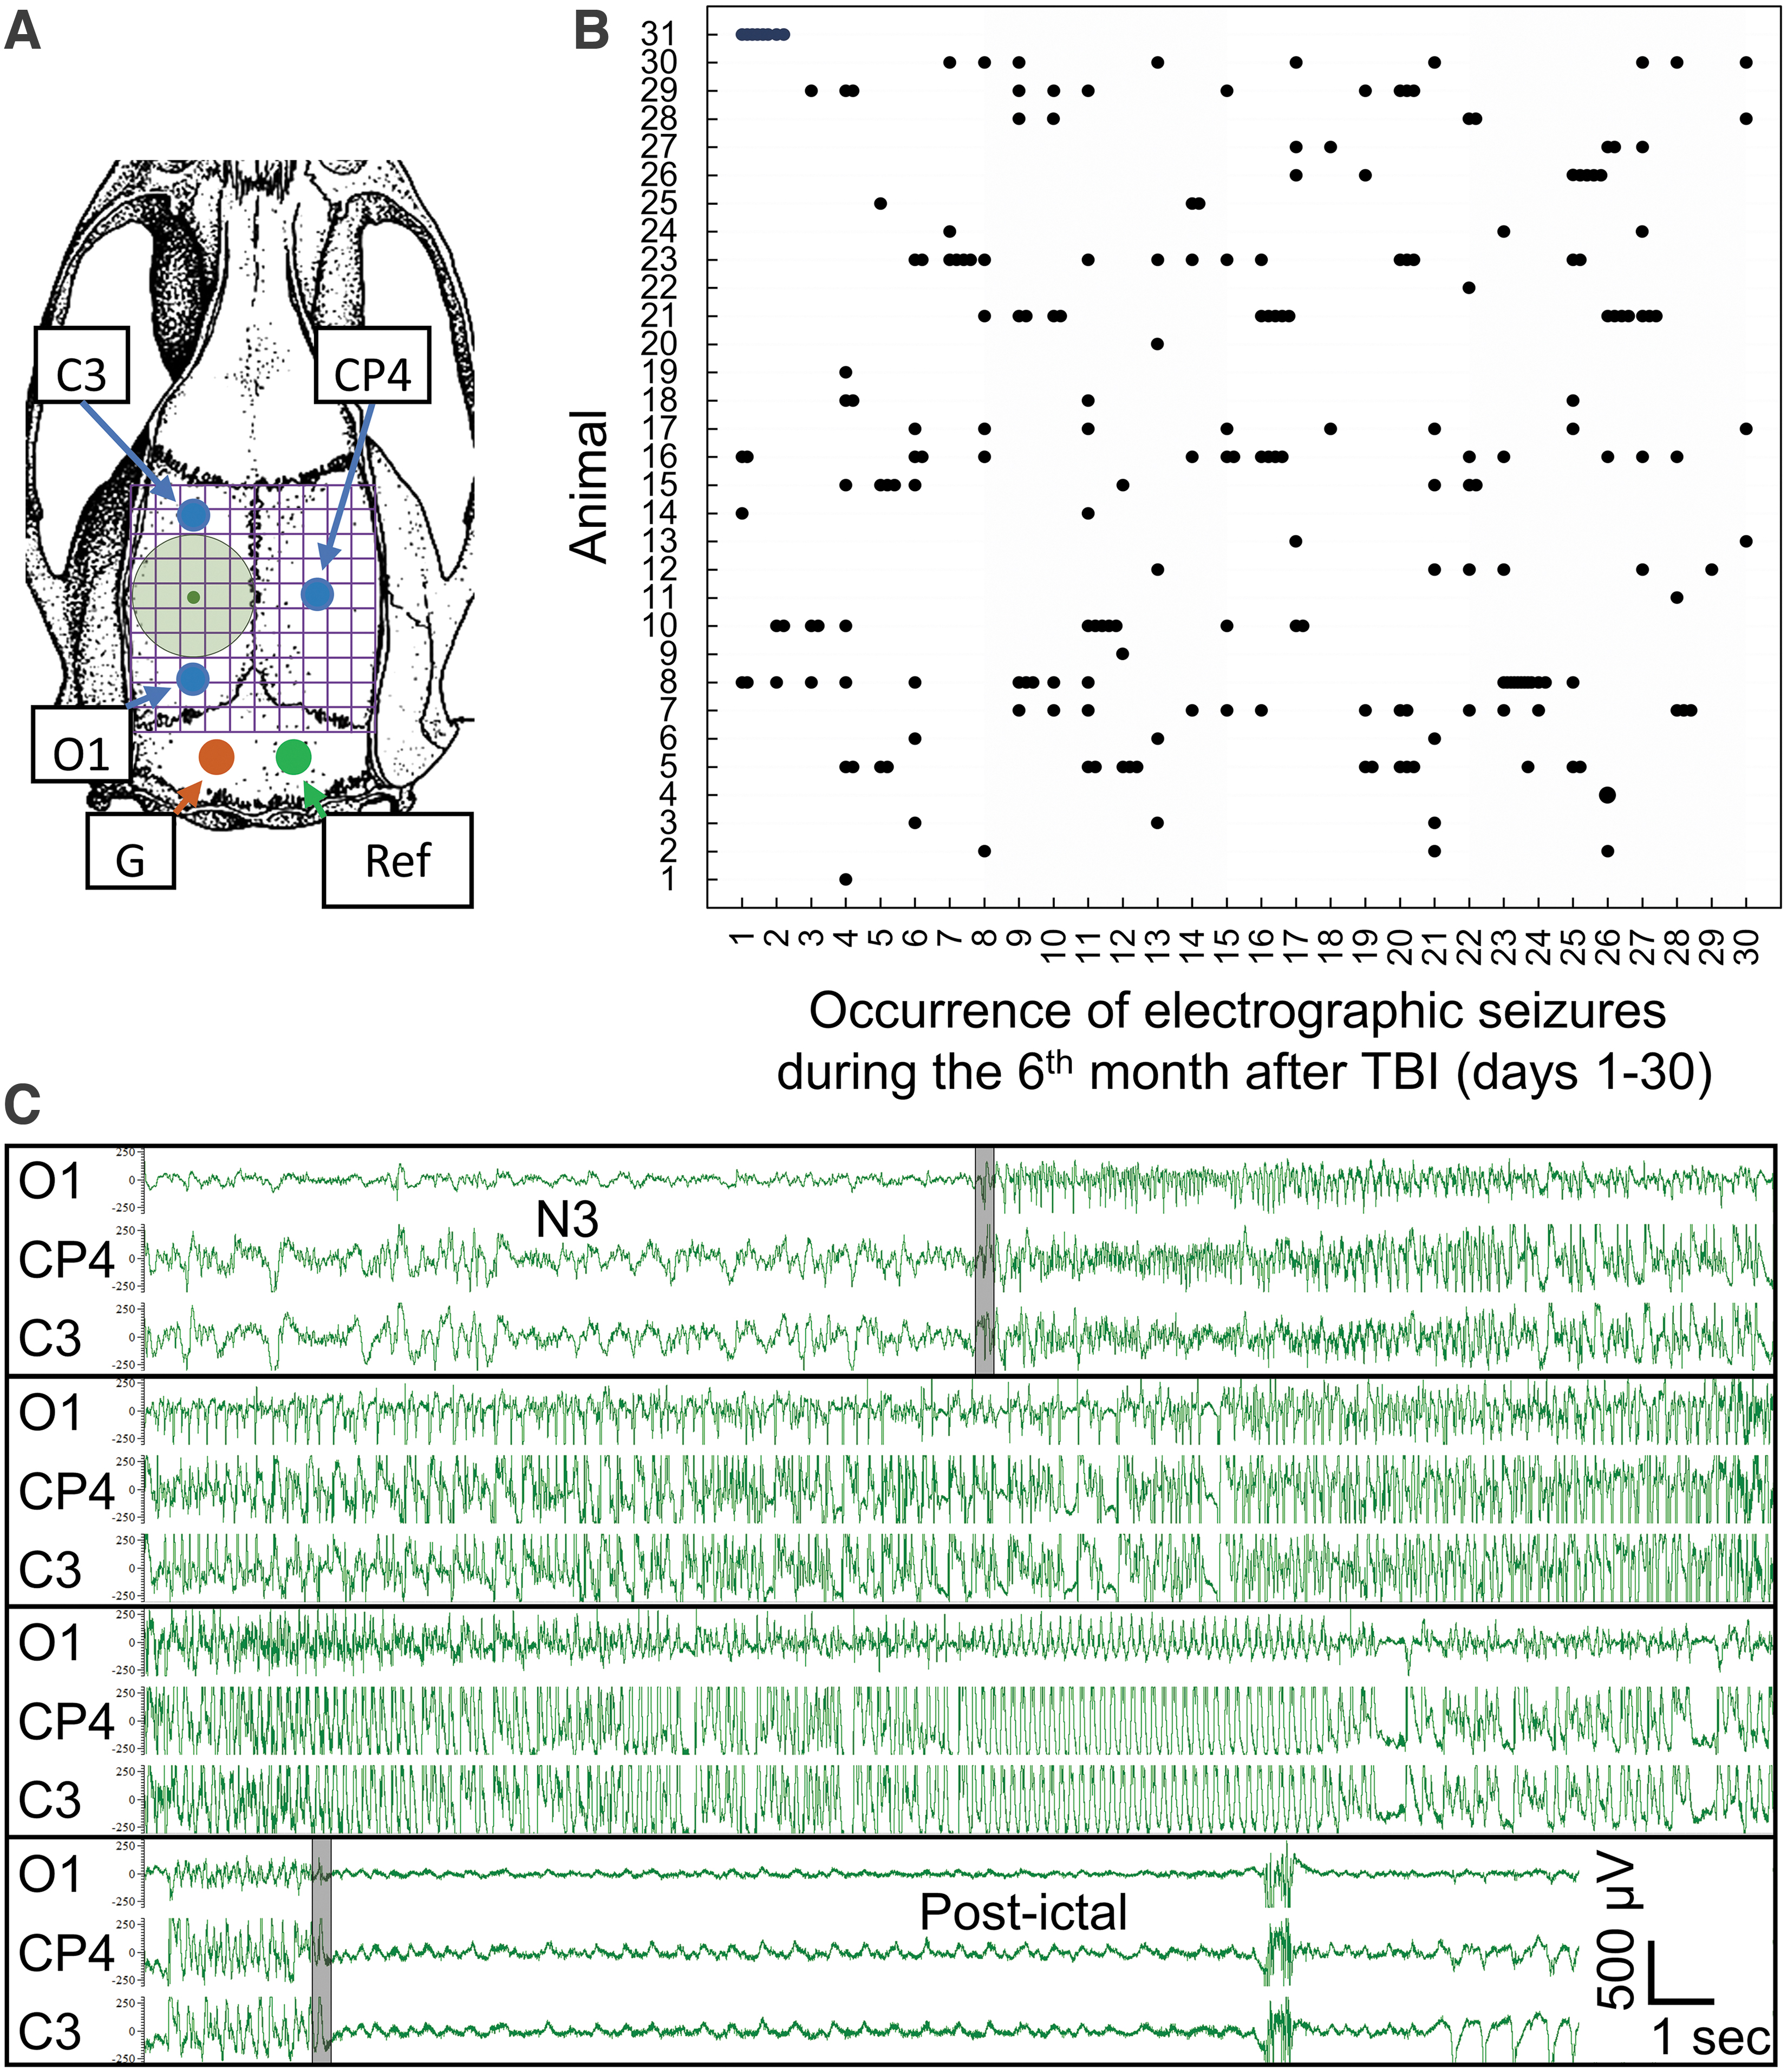
To monitor the occurrence of spontaneous seizures after lateral FPI, the rats were implanted with three skull electrodes at 5 months post-TBI as described by Kharatishvili and colleagues. 11 Electrode positioning is shown in Figure 4A. Continuous (24/7) 1-month vEEG monitoring to detect epileptiform activity was performed starting on day 154 post-TBI according to Nissinen and colleagues. 32 Seizure occurrence was detected by both visual screening and using a seizure detection algorithm as described previously (Fig. 4B). 33 A rat was diagnosed with PTE if it had at least one unprovoked spontaneous electrographic seizure in the vEEG. 34
Epilepsy phenotyping. (
Statistical analysis
Data analysis was performed using MATLAB (MATLAB and Statistics and Machine Learning Toolbox Release 2017b; The MathWorks, Inc., Natick, MA). The Mann-Whitney U Test was used to assess the significance of differences between median values among groups. Volumes of the regions with different levels of T2 change (V–, V+, V++, and V+++) at different time points (days 2, 7, and/or 21 post-TBI) were used as explanatory variables in regression analyses. In addition, lateral FPI peak pressure, duration of acute post-impact seizure, and duration of post-impact apnea were included as explanatory variables to account for their effects. Three response variables were modeled using these explanatory variables. 1) Multiple linear regression (first-order linear regression, using MATLAB function fitlm) was used to model the volume of tissue with greatly increased T2 at day 21 post-TBI (V+++(d21)) using T2-classified lesion volumes measured at day 2, day 7, or both days 2 and 7 post-TBI. 2) Multiple linear regression was used to model the sum of volumes of tissue with slightly and moderately increased T2 at day 7 post-TBI (V+(d7) + V++(d7)) using T2-classified lesion volumes measured at day 2 post-TBI. 3) A generalized linear model (logistic regression with explanatory variables modeled by first-order linear regression, using MATLAB function fitglm) was used to model the emergence of spontaneous epileptic seizures using T2-classified lesion volumes measured at days 2, 7, and 21 post-TBI.
Results
Impact force, duration of post-impact apnea, acute post-impact seizure-like behavior, mortality, and exclusions
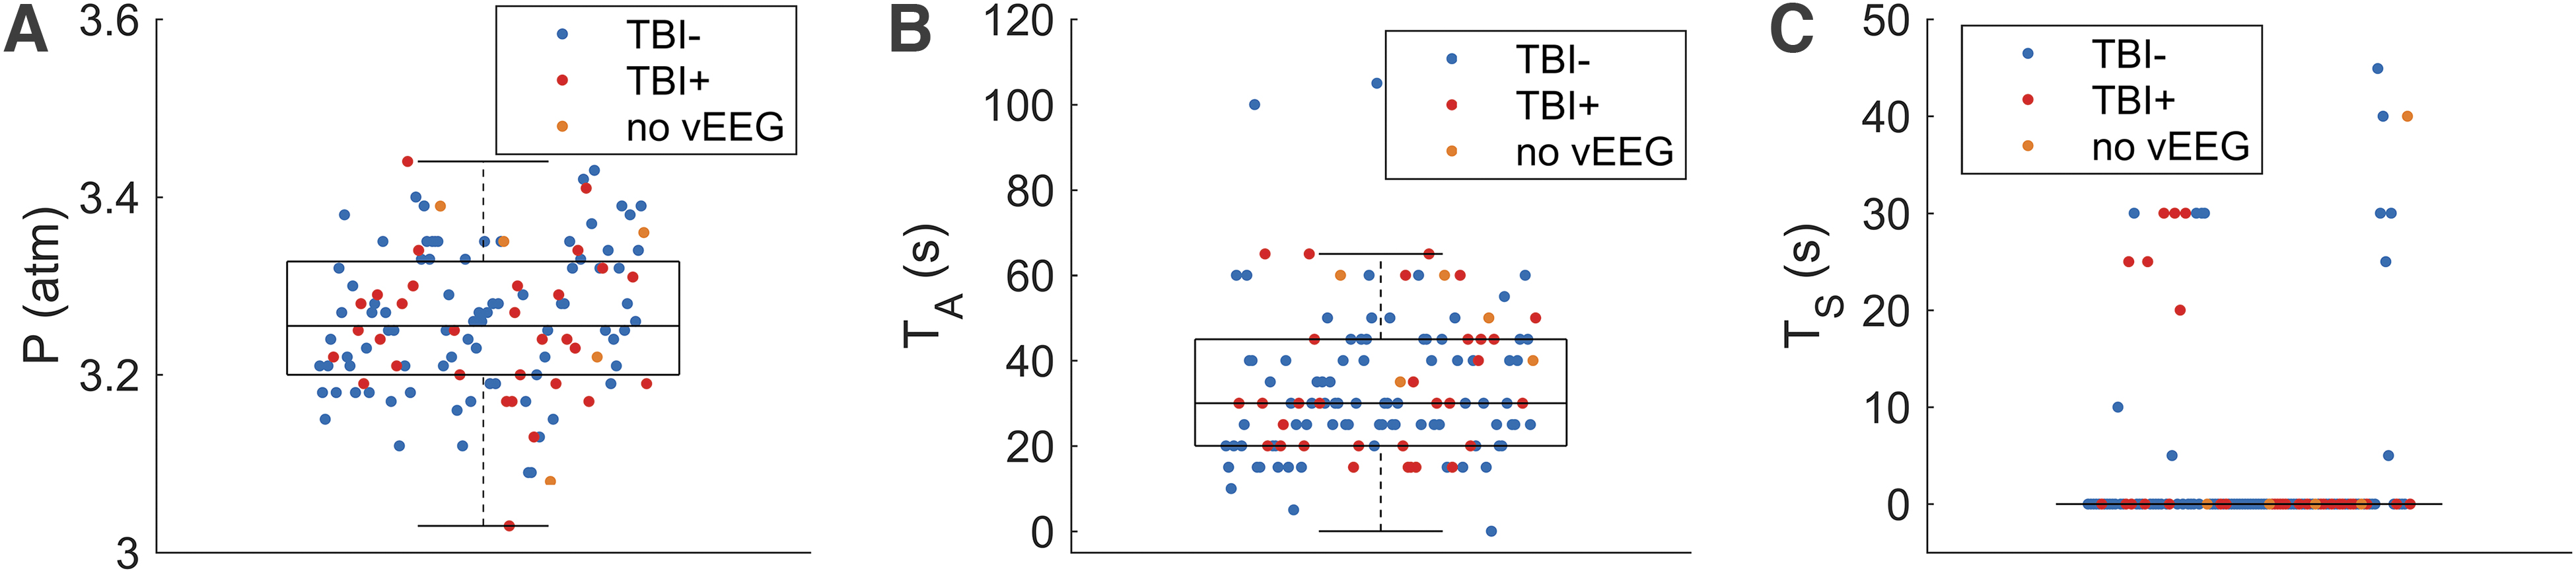
A flow chart summarizing the number of rats at each stage of the study is presented in Supplementary Figure S1. Mean peak impact pressure was 3.26 atm (SD, 0.08; median, 3.26; range, 3.03–3.44; Fig. 5A). Mean duration of post-impact time in apnea was 33.9 sec (SD, 17.0; median, 30.0; range, 0–105; Fig. 5B). Immediate post-impact seizure-like behaviors were observed in 19 of 120 TBI rats (16%), with a mean duration of 27 sec (SD, 11; median, 30; range, 5–45; Fig. 5C).
(
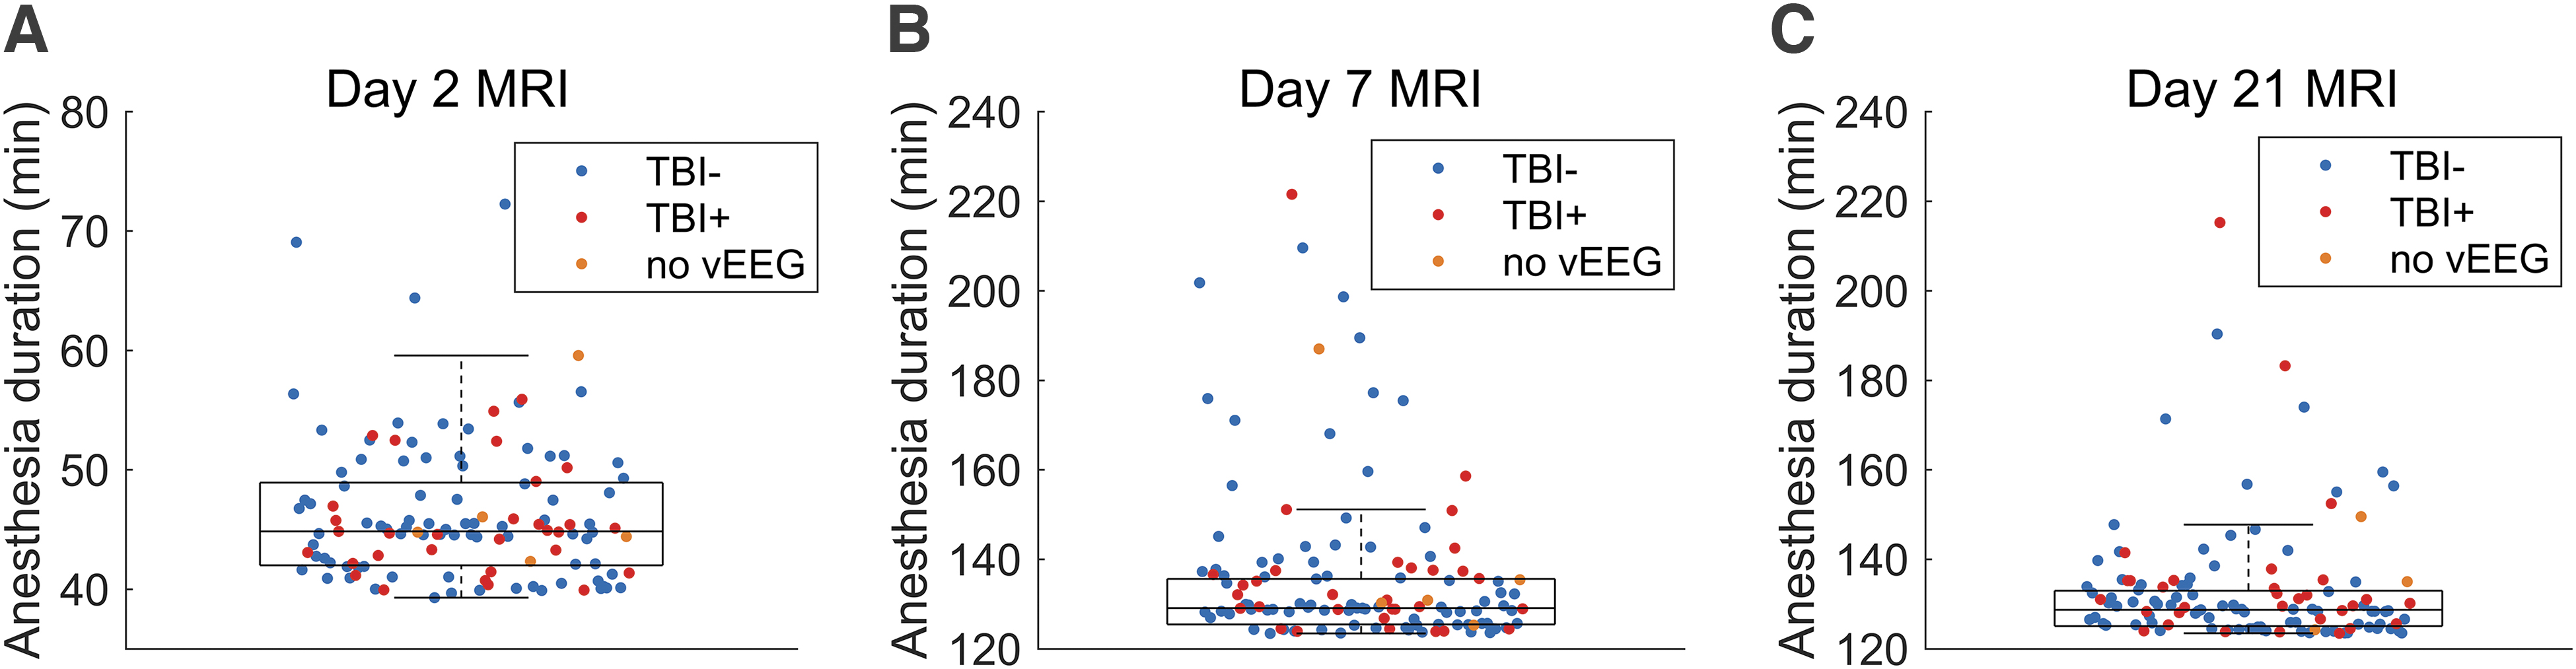
During MRI, rats were anesthetized using isoflurane. Mean duration of isoflurane anesthesia was 46 min (SD, 6; median, 45; range. 39–72) at the day 2 imaging (Fig. 6A), 137 min (SD, 19; median, 130; range, 123–222) at the day 7 imaging (Fig. 6B), and 133 min (SD, 14; median, 129; range, 123–215) at the day 21 imaging (Fig. 6C). The increase in anesthesia duration from day 2 to day 7 and 21 MRIs was attributed to the addition of diffusion tensor imaging (DTI) into the protocol. It was excluded from the day 2 MRI protocol because of a long anesthesia duration, which was considered as a risk for animal survival at the early post-injury period. DTI data were not analyzed in this study. Median duration of anesthesia between TBI rats without (TBI-) or with (TBI+) epilepsy did not differ at day 2 after TBI (n(TBI-) = 83; n(TBI+) = 31; U = 1210; p = 0.63), at day 7 after TBI (n(TBI-) = 84; n(TBI+) = 31; U = 1411; p = 0.50), and at day 21 after TBI (n(TBI-) = 84; n(TBI+) = 31; U = 1483; p = 0.26).
Anesthesia duration during (
Of the 144 (24 sham, 120 TBI) rats in the MRI group, 3 (1 sham, 2 TBI) died before the day 21 MRI and were excluded from the analysis (cause of death unknown). Three additional TBI rats died before completion of the vEEG monitoring (cause of death unknown), and the presence or absence of epilepsy could not be confirmed. Additionally, 1 TBI rat was excluded because of incorrect field-of-view settings. Hence, 140 (23 sham, 117 TBI) rats were included in the lesion size analysis, and 137 (23 sham, 114 TBI) rats were included in the analysis of epilepsy outcome (Supplementary Fig. S1).
Occurrence of epilepsy
All 23 sham-operated experimental controls and 114 of the 117 TBI rats that were included in the MRI analysis underwent a 1-month vEEG monitoring period in the sixth post-surgery month. A total of 98,640 h of EEG were analyzed from 137 rats (sham-operated experimental controls, 16,560 h; TBI, 82,080 h). None of the sham-operated experimental controls showed spontaneous seizures. In the TBI group, 31 of 114 rats (27%) with TBI exhibited at least one spontaneous seizure in vEEG (Fig. 4B). Thus, data from 31 TBI rats with epilepsy (TBI+) and 83 without epilepsy (TBI-) were used to analyze the association between T2 MRI and epileptogenesis.
The total number of seizures in the 31 TBI+ rats was 219. The mean seizure duration was 84 sec (SD, 33; median, 80; range, 12–236), and the mean seizure frequency per rat (number of seizures per number of monitoring days) was 0.23 per day (SD, 0.21; median, 0.13; range, 0.03–0.77). The mean behavioral severity score was 2.8 (SD, 1.5; median, 3; range, 0–5). 35
T2 relaxation-based grading of the severity and extent of the tissue pathology
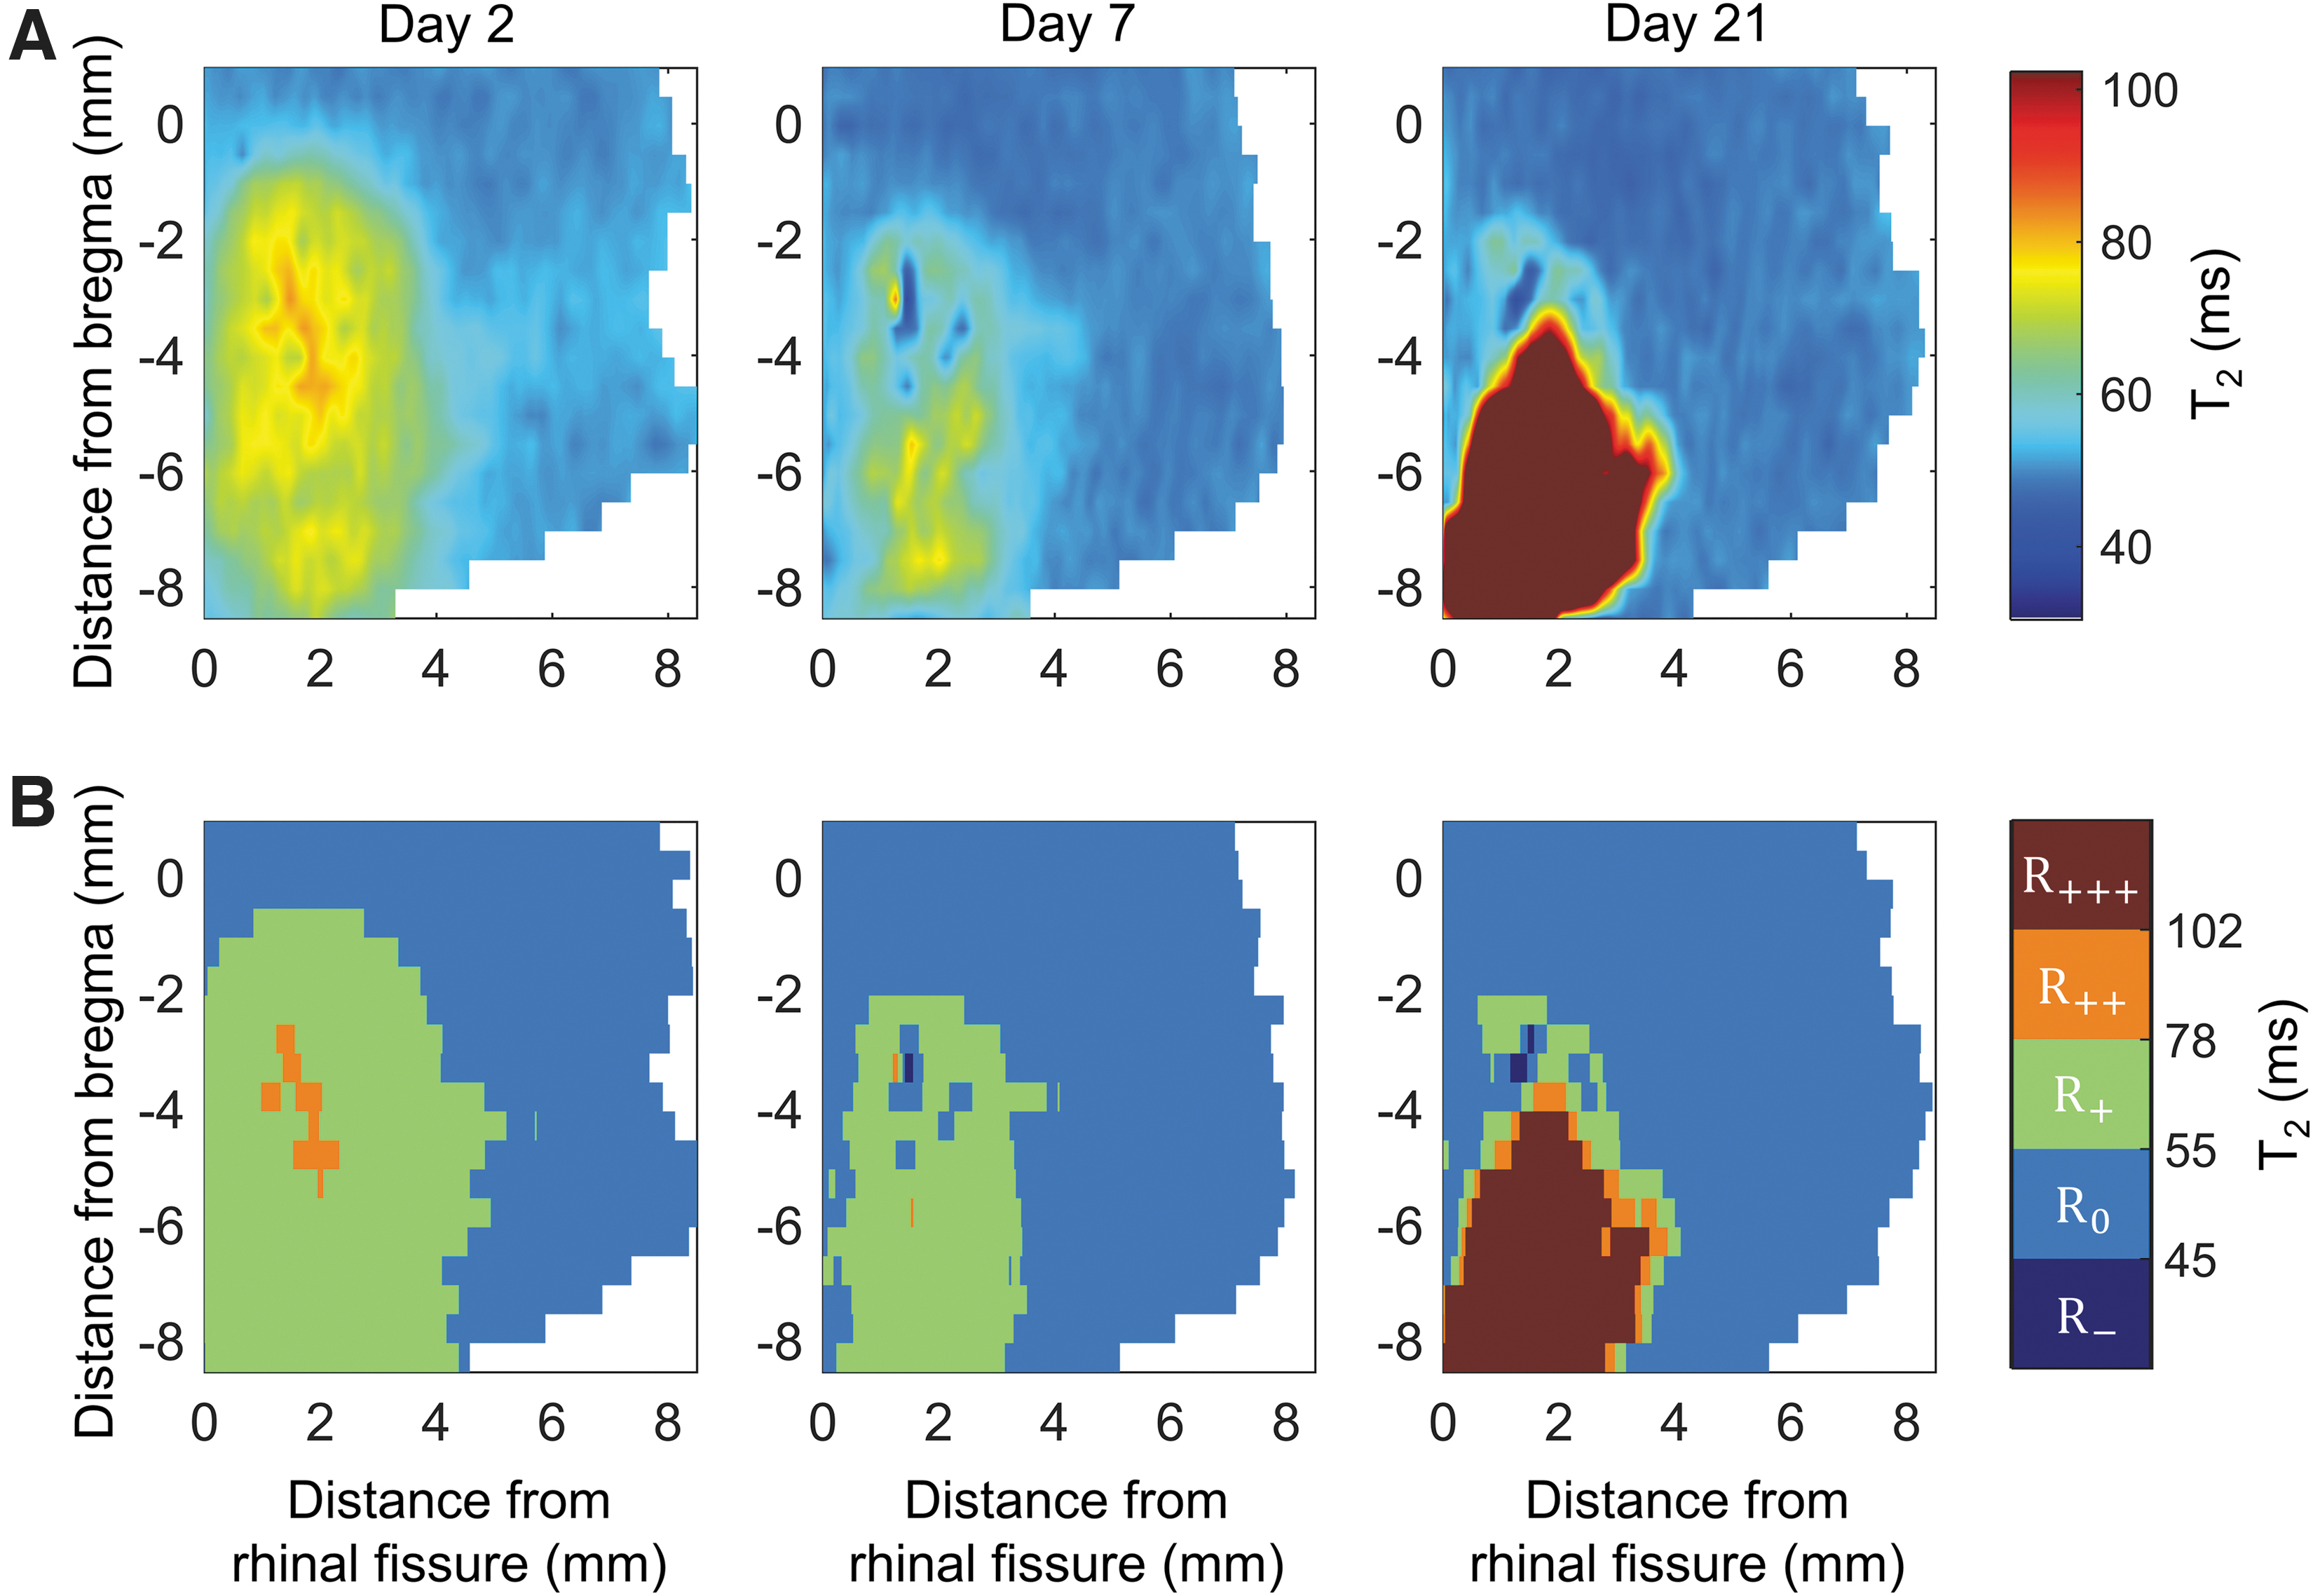
Figure 7A shows unfolded cortical T2 relaxation maps constructed from a representative TBI case, demonstrating the progression of cortical pathology over the 21-day follow-up. At day 2 post-TBI, a large area of smoothly varying spatial T2 gradient reveals the cortical tissue injured by the impact force. By day 7 post-TBI, there is a partial recuperation of tissue damage, which is seen as a smaller lesion area. The consequent pathology evolution results in the development of a large necrotic lesion, however, by day 21 post-TBI.
(
Grading of the severity of tissue pathology based on T2 relaxation values is shown in Fig. 7B. In a typical TBI case, the volumes of regions with slightly (R+) or moderately (R++) increased T2 values were large at day 2 post-TBI, thereafter progressively decreasing by days 7 and 21 post-TBI. The change in the volume of the region with greatly increased T2 values (R+++) tended to become significant by day 7 or 21 post-TBI. The volume of the region with decreased T2 values (R-) typically increased over time, but remained small when compared with regions R+, R++, and R+++.
Progression of post-injury T2 relaxation time during the follow-up
Our initial analysis indicated that progression of the lesion during the 21-day follow-up was remarkably variable among animals (Fig. 8). In the sham-operated experimental control group, the median V– was larger at day 2 (2.4 mm3; range, 1.2–6.3; mean, 2.8; n = 24) than at day 7 (0.71 mm3; range, 0.24–1.70; mean, 0.92; n = 23; U = 520; p < 0.001) or at day 21 after sham operation (1.2 mm3; range, 0.34–2.80; mean, 1.2; n = 23; U = 491; p < 0.001), indicating the presence of tissue pathology after the craniotomy (Fig. 8D). The median volume of tissue with V– at day 2 post-surgery in the sham-operated control group (2.4 mm3; range, 1.2–6.3; mean, 2.8; n = 24) was larger than that in the TBI group (0.32 mm3; range, 0.0–2.9; mean, 0.44; n = 119; U = 2803; p < 0.001).
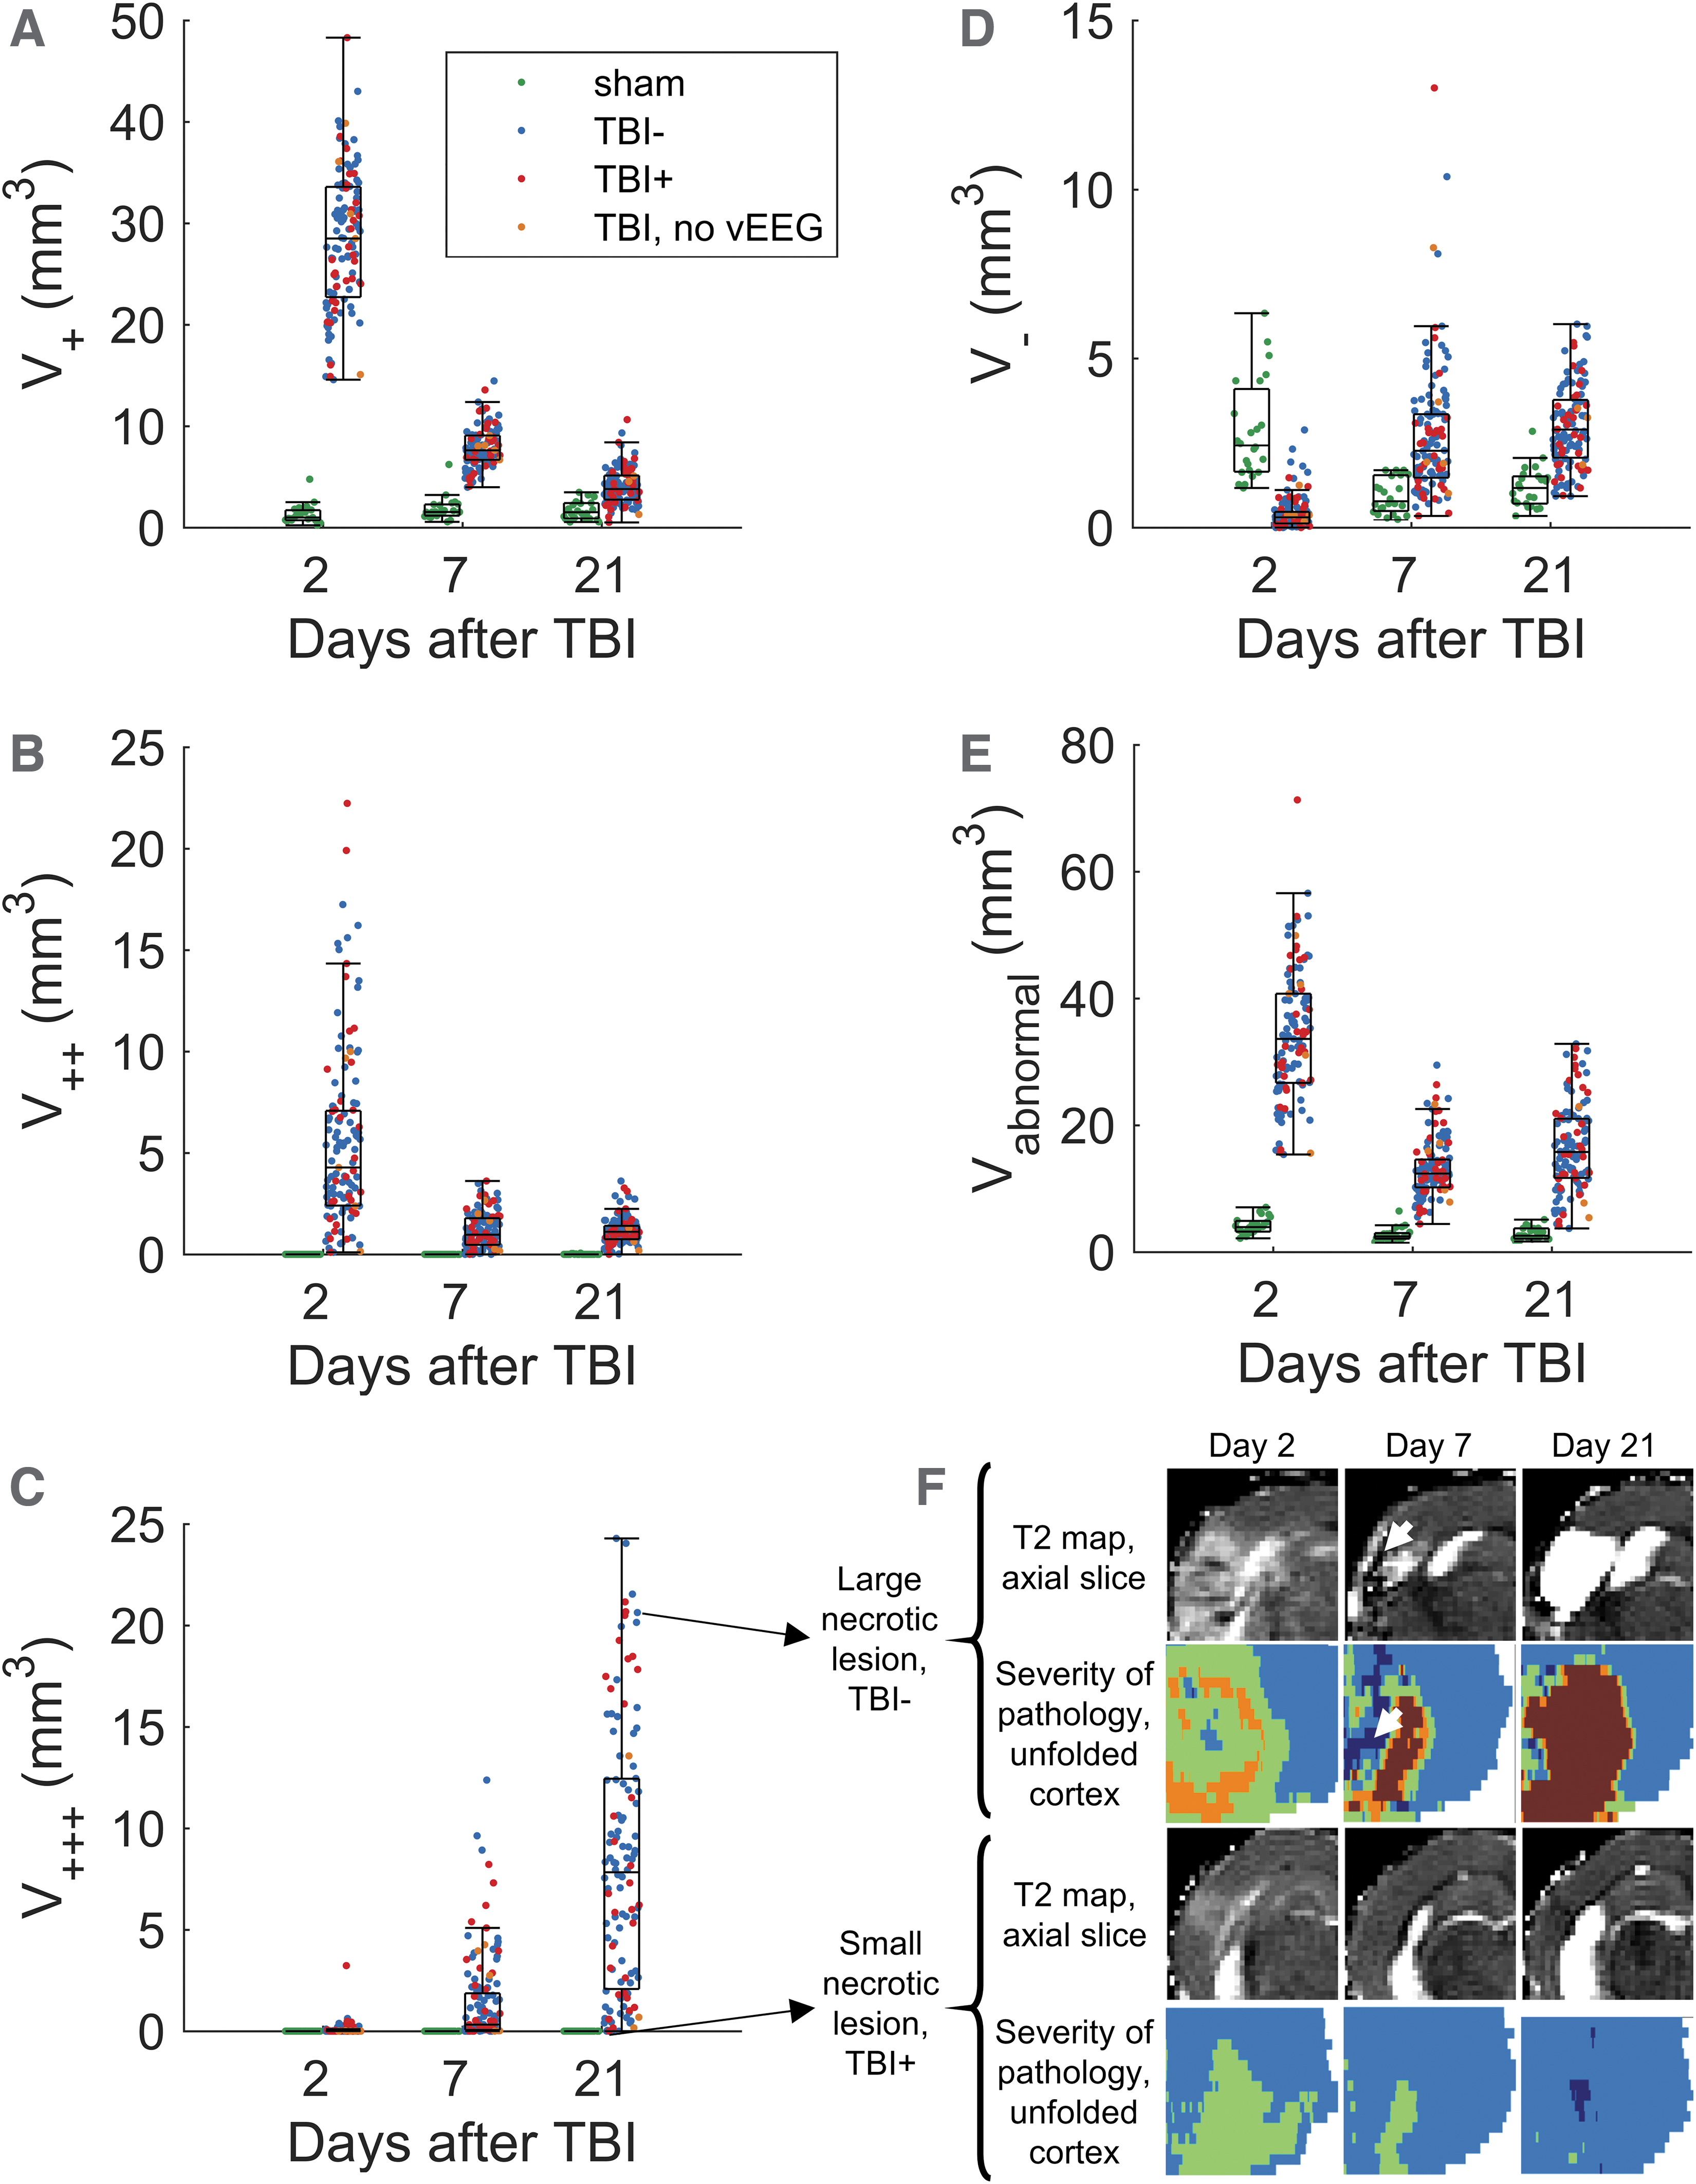
Boxplots showing the volumes of pathologic tissue in rats with traumatic brain injury (TBI) at days 2, 7, and 21 post-TBI. Occurrence of spontaneous seizures was assessed from video electroencephalography (vEEG) recordings performed during the sixth month after TBI. Blue dots represent rats without epilepsy (TBI-), red dots represent rats with epilepsy (TBI+), and orange dots represent rats with no vEEG data available (excluded from the epileptogenesis analysis but included in lesion progression analysis). Sham-operated experimental controls are shown as green dots. Total volume (V) of voxels with (
In the TBI group, V+ was at its highest (median, 28 mm3; range, 15–48; mean, 28; n = 119) at day 2 post-TBI (Fig. 8A). Thereafter, V+ decreased by day 7 post-TBI (median, 7.6 mm3; range, 4.0–14; mean, 7.9; n = 120; U = 14,280; p < 0.001) and further by day 21 post-TBI (median, 3.8 mm3; range, 0.50–11.00; mean, 4.0; n = 118; U = 14,042; p < 0.001).
V++ in the TBI group was at its highest at day 2 (median, 4.8 mm3; range, 0.10–22.00; mean, 5.7; n = 119), decreasing by day 7 (median, 0.98 mm3; range, 0.0–3.6; mean, 1.2; n = 120; U = 12,690; p < 0.001) and by day 21 post-TBI (median, 1.1 mm3; range, 0.0–3.6; mean, 1.2; n = 118; U = 12,417; p < 0.001; Fig. 8B). The difference in median V++ between day 7 and day 21 was not statistically significant (U = 6546; p = 0.32).
The median V+++ at day 2 post-TBI was 0.0 mm3 (range, 0.0–3.2; mean, 0.071; n = 119) and progressively and significantly increased thereafter. At day 7, it reached 0.45 mm3 (range, 0.0–12.0; mean, 1.5; n = 120; U = 2074; p < 0.001). At day 21, it further increased to 7.7 mm3 (range, 0.0–24.0; mean, 8.2; n = 118), which was significantly greater than at day 7 post TBI (U = 2248; p < 0.001; Fig. 8C).
V– was at its lowest at day 2 post-TBI (median, 0.32 mm3; range, 0.0–2.9; mean, 0.44; n = 119), then progressively and significantly increased at day 7 (median, 2.4 mm3; range, 0.34–13.00; mean, 2.8; n = 120; U = 513; p < 0.001) and then day 21 post-TBI (median, 3.0 mm3; range, 0.93–6.00; mean, 3.0; n = 118); day 21 was significantly greater than day 7 (U = 5748; p < 0.05; Fig. 8D).
Association of acute abnormality in T2 relaxation time with the evolution of severe cortical pathology after traumatic brain injury
We applied multiple linear regression to model the volume of necrotic lesions at day 21 post-TBI, V+++(d21), using the V–, V+, V++, and V+++ measures made at day 2 and day 7 post-TBI, as well as the combination of day 2 and day 7 measurements. In addition, duration of post-impact apnea (TA), duration of immediate post-impact seizure-like behaviors (TS), peak impact pressure (P), and isoflurane anesthesia duration during MRI (Ti) were included as variables. A statistically significant linear regression equation was detected in each case (F (8,108) = 31.8; p < 0.001 when using variables measured at day 2 post-TBI; F (8,109) = 83.6; p < 0.001 when using variables measured at day 7 post-TBI; and F (13,103) = 52.5; p < 0.001 when using variables measured both at day 2 and day 7 post-TBI). The results are summarized in Table 1, and the test statistics for each variable are shown in Supplementary Tables S1–S3.
Summary of Multiple Linear Regression Analysis Results to Explain the Volume of Perilesional Cortical Tissue with Greatly Increased T2 Relaxation Time (V+++; i.e., Necrotic Lesion Volume) at Day 21 (d21) after Traumatic Brain Injury (TBI)
Volume of tissue with decreased T2 (V-), slightly increased T2 (V+), moderately increased T2 (V++), and greatly increased T2 (V+++) on day 2 (d2), on day 7 (d7), or at both time points after TBI were used as explanatory variables (volume in mm3). Duration of post-impact apnea (TA (s)), duration of acute post-impact seizure-like behavior (TS (s)), impact pressure (P (atm)), and isoflurane anesthesia duration (Ti (h)) during magnetic resonance imaging were included as control variables. N is the number of observations, EDF is error degrees of freedom, F is F statistic versus constant model, p is p value, R 2 is the coefficient of determination, R 2 adj. is the adjusted coefficient of determination, MSE is the estimated mean squared error for leave-one-out cross-validation, and Q2 is the leave-one-out cross-validated coefficient of determination. At its best, the data show that on day 7, the model explains 86% (R2) of V+++ variance on day 21.
The modeled values of V+++(d21) are plotted against their measured values in Figure 9. All three regression models explained most of the interanimal variance in V+++(d21), with the coefficient of determination R 2 being 0.70 (adjusted R 2 = 0.68; Q2 = 0.56 [Q2 is leave-one-out cross-validated R 2]) when using variables measured at day 2 post-TBI, 0.86 (adjusted R 2 = 0.85; Q2 = 0.83) when using variables measured at day 7 post-TBI, and 0.87 (adjusted R 2 = 0.85; Q2 = 0.70) when using variables measured both at day 2 and day 7 post-TBI. Overall, using variables measured at day 7 post-TBI provided more explanatory power than variables measured at day 2 post-TBI. Combining variables measured both at days 2 and 7 post-TBI did not meaningfully improve the explanatory power compared with variables measured only at day 7 post-TBI.
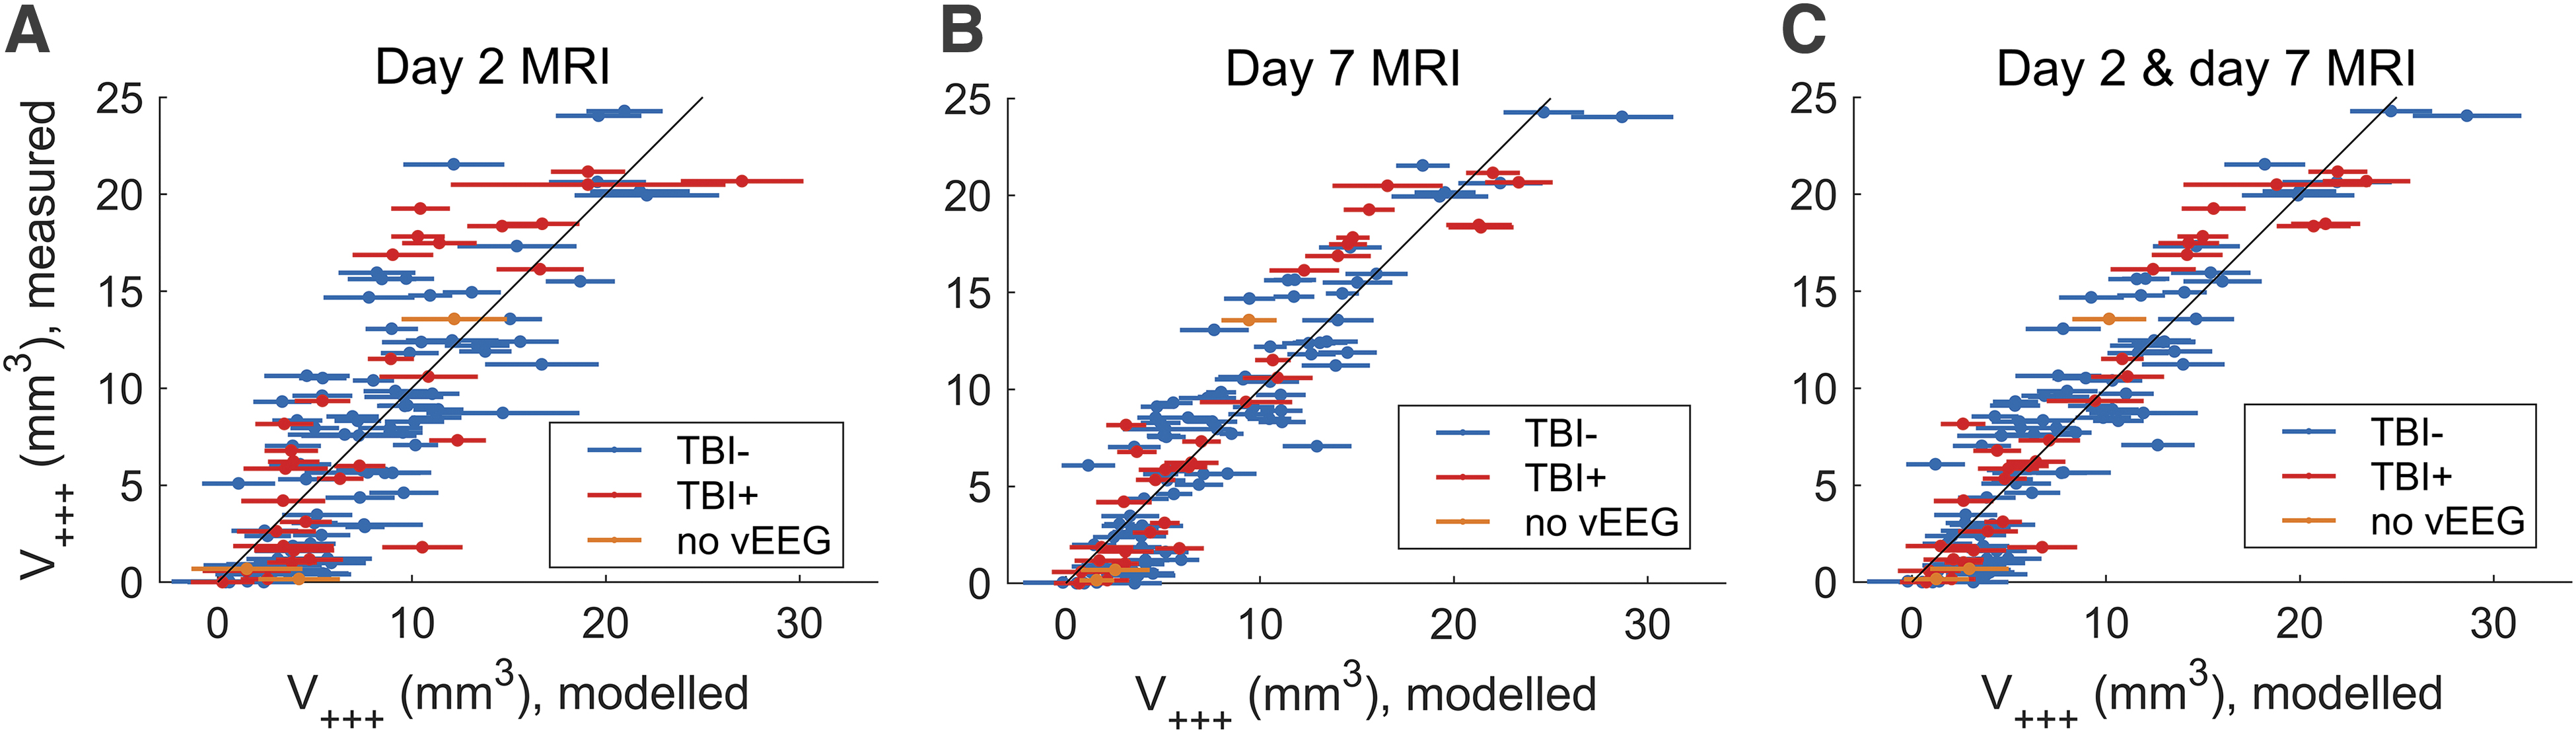
Estimated versus measured volumes (dots) of perilesional cortical tissue with greatly increased T2 (V+++) at day 21 after traumatic brain injury (TBI). Lines show the 95% confidence intervals of estimates. Estimates were calculated using a multiple linear regression model, including control variables (acute post-impact apnea and duration of acute post-impact seizure-like behavior, impact pressure, and isoflurane anesthesia duration during magnetic resonance imaging) and total volume of voxels with decreased (V–), slightly increased (V+), moderately increased (V++), and greatly increased (V+++) T2 relaxation in the perilesional cortex measured at (
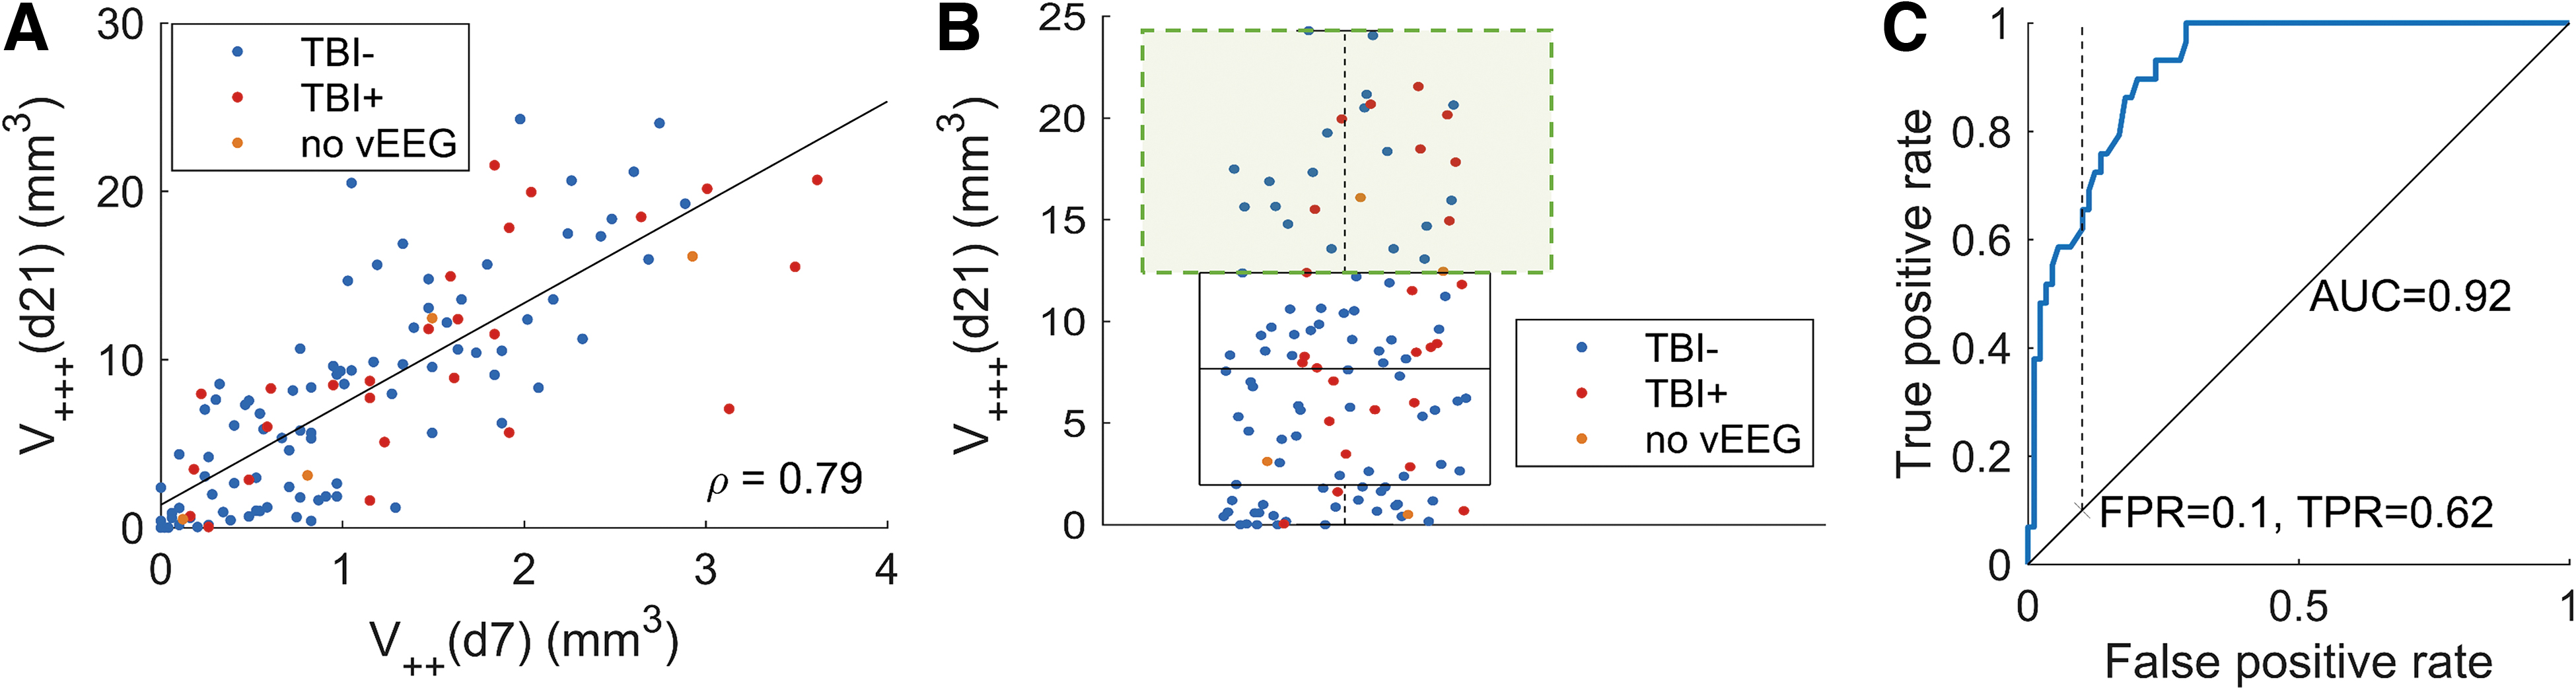
We tested the ability of a single parameter, V++(d7), to identify rats that would develop a large necrotic lesion, V+++(d21). The Pearson correlation coefficient (ρ) between V++(d7) and V+++(d21) was 0.79 (p < 0.001; Fig. 10A). We defined the top quartile of V+++(d21) values as having a large necrotic lesion (V+++(d21) >12 mm3; Fig. 10B). A receiver operator characteristic (ROC) analysis for the ability of parameter V++(d7) to identify these animals produced an area under curve (AUC) of 0.92 (p < 0.001; Fig. 10C). Selecting a false-positive rate threshold of 0.10 produced a true-positive rate of 0.62, corresponding to a cut-off value V++(d7) = 1.9 mm3.
(
Association of abnormality in T2 relaxation time with the evolution of moderate cortical pathology after traumatic brain injury
We used multiple linear regression to model the amount of tissue with mildly or moderately increased T2 at day 7 post-TBI, (V+(d7) + V++(d7)), using the measurements V–, V+, V++, and V+++ made at day 2 post-TBI. In addition, duration of post-impact apnea (TA), duration of immediate post-impact seizure-like behaviors (Ts), peak impact pressure (P), and isoflurane anesthesia duration during MRI (Ti) were included as control variables. A statistically significant linear regression equation was detected (F (8,110) = 12.3; p < 0.001). The results are summarized in Table 2, and test statistics for each variable are shown in Supplementary Table S4. The modeled values of (V+(d7) + V++(d7)) are plotted against their measured values in Figure 11. The model explained around half of the interanimal variance in (V+(d7) + V++(d7)), with the coefficient of determination being R 2 = 0.47 (adjusted R 2 = 0.44; Q2 = 0.39).
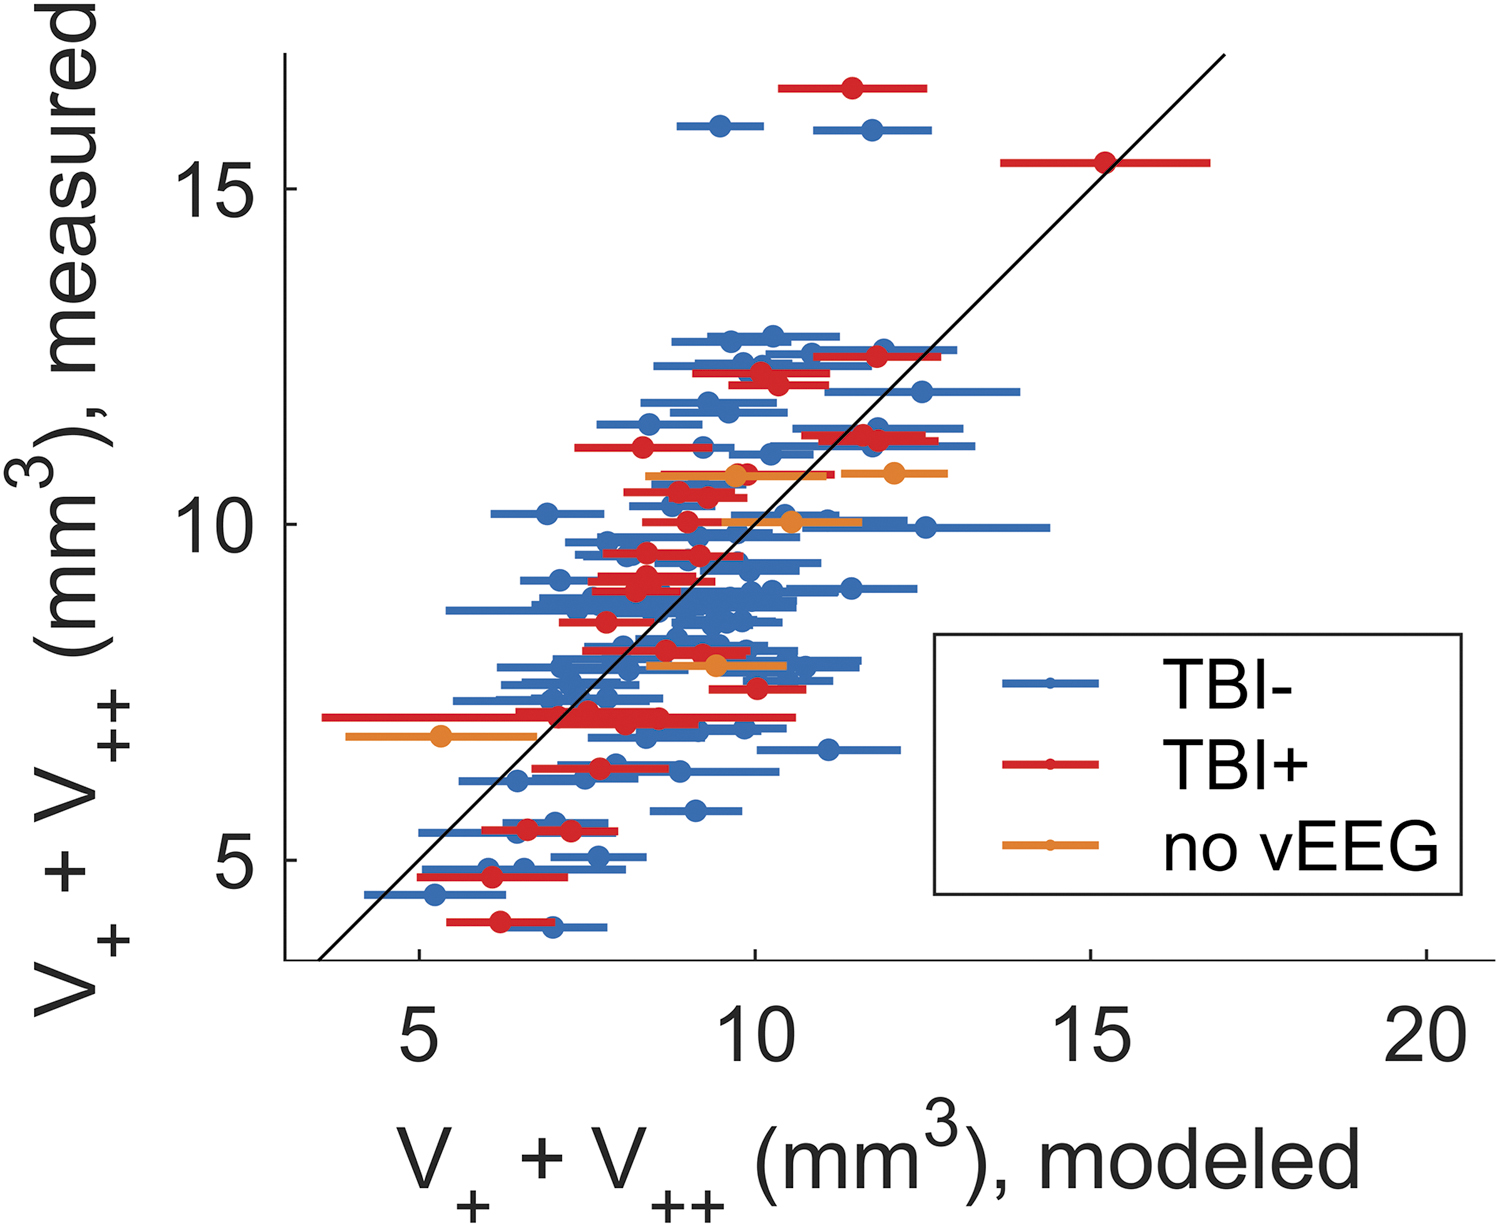
Estimated versus measured volumes (dots) and 95% confidence intervals of estimates (lines surrounding dots) of perilesional cortical tissue with slightly or moderately increased T2 (V+ + V++) at day 7 after traumatic brain injury (TBI). Estimates were calculated using a multiple linear regression model, including control variables (impact pressure, duration of acute post-impact apnea, duration of post-impact seizure-like behavior, and isoflurane anesthesia duration during magnetic resonance imaging) and total volume of voxels with decreased (V-), slightly increased (V+), moderately increased (V++), and greatly increased (V+++) T2 relaxation in the perilesional cortex measured day 2 post-TBI. Rats that did not show spontaneous seizures during 1-month-long video electroencephalography (vEEG) are indicated in blue (TBI-), rats with spontaneous seizures in red (TBI+), and rats that died before vEEG in orange (no vEEG). Color image is available online.
Summary of Multiple Linear Regression Results to Explain the Volume of Perilesional Cortical Tissue with Slightly or Moderately Increased T2 Relaxation Time (V+ + V++) at Day 7 (d7) after Traumatic Brain Injury (TBI)
Volume of tissue with decreased T2 (V-), slightly increased T2 (V+), moderately increased T2 (V++), and greatly increased T2 (V+++) on day 2 (d2) post-TBI were used as explanatory variables (volume in mm3). Duration of acute post-impact apnea (TA (s)), duration of acute post-impact seizure-like behavior (TS (s)), impact pressure (P (atm)), and isoflurane anesthesia duration (Ti (h)) during magnetic resonance imaging were included as control variables. N is the number of observations, EDF is error degrees of freedom, F is F statistic versus constant model, p is p value, R 2 is the coefficient of determination, R2 adj. is the adjusted coefficient of determination, MSE is the estimated mean squared error of leave-one-out cross-validation, and Q2 is the leave-one-out cross-validated coefficient of determination.
Association of abnormality in T2 relaxation time with epileptogenesis after traumatic brain injury
Perilesional cortical volumes with abnormal T2 relaxation values were highly variable in both the TBI- and TBI+ groups, as summarized in Figure 8. Mann-Whitney U tests were used to assess whether the TBI- and TBI+ groups were different in terms of control variables TA, TS, P, and Ti, as well as in terms of volumes V–, V+, V++, V+++, and V at days 2, 7, or 21 post-TBI. None of the parameters were significantly different between the groups at the 0.05 significance level (Fig. 12).
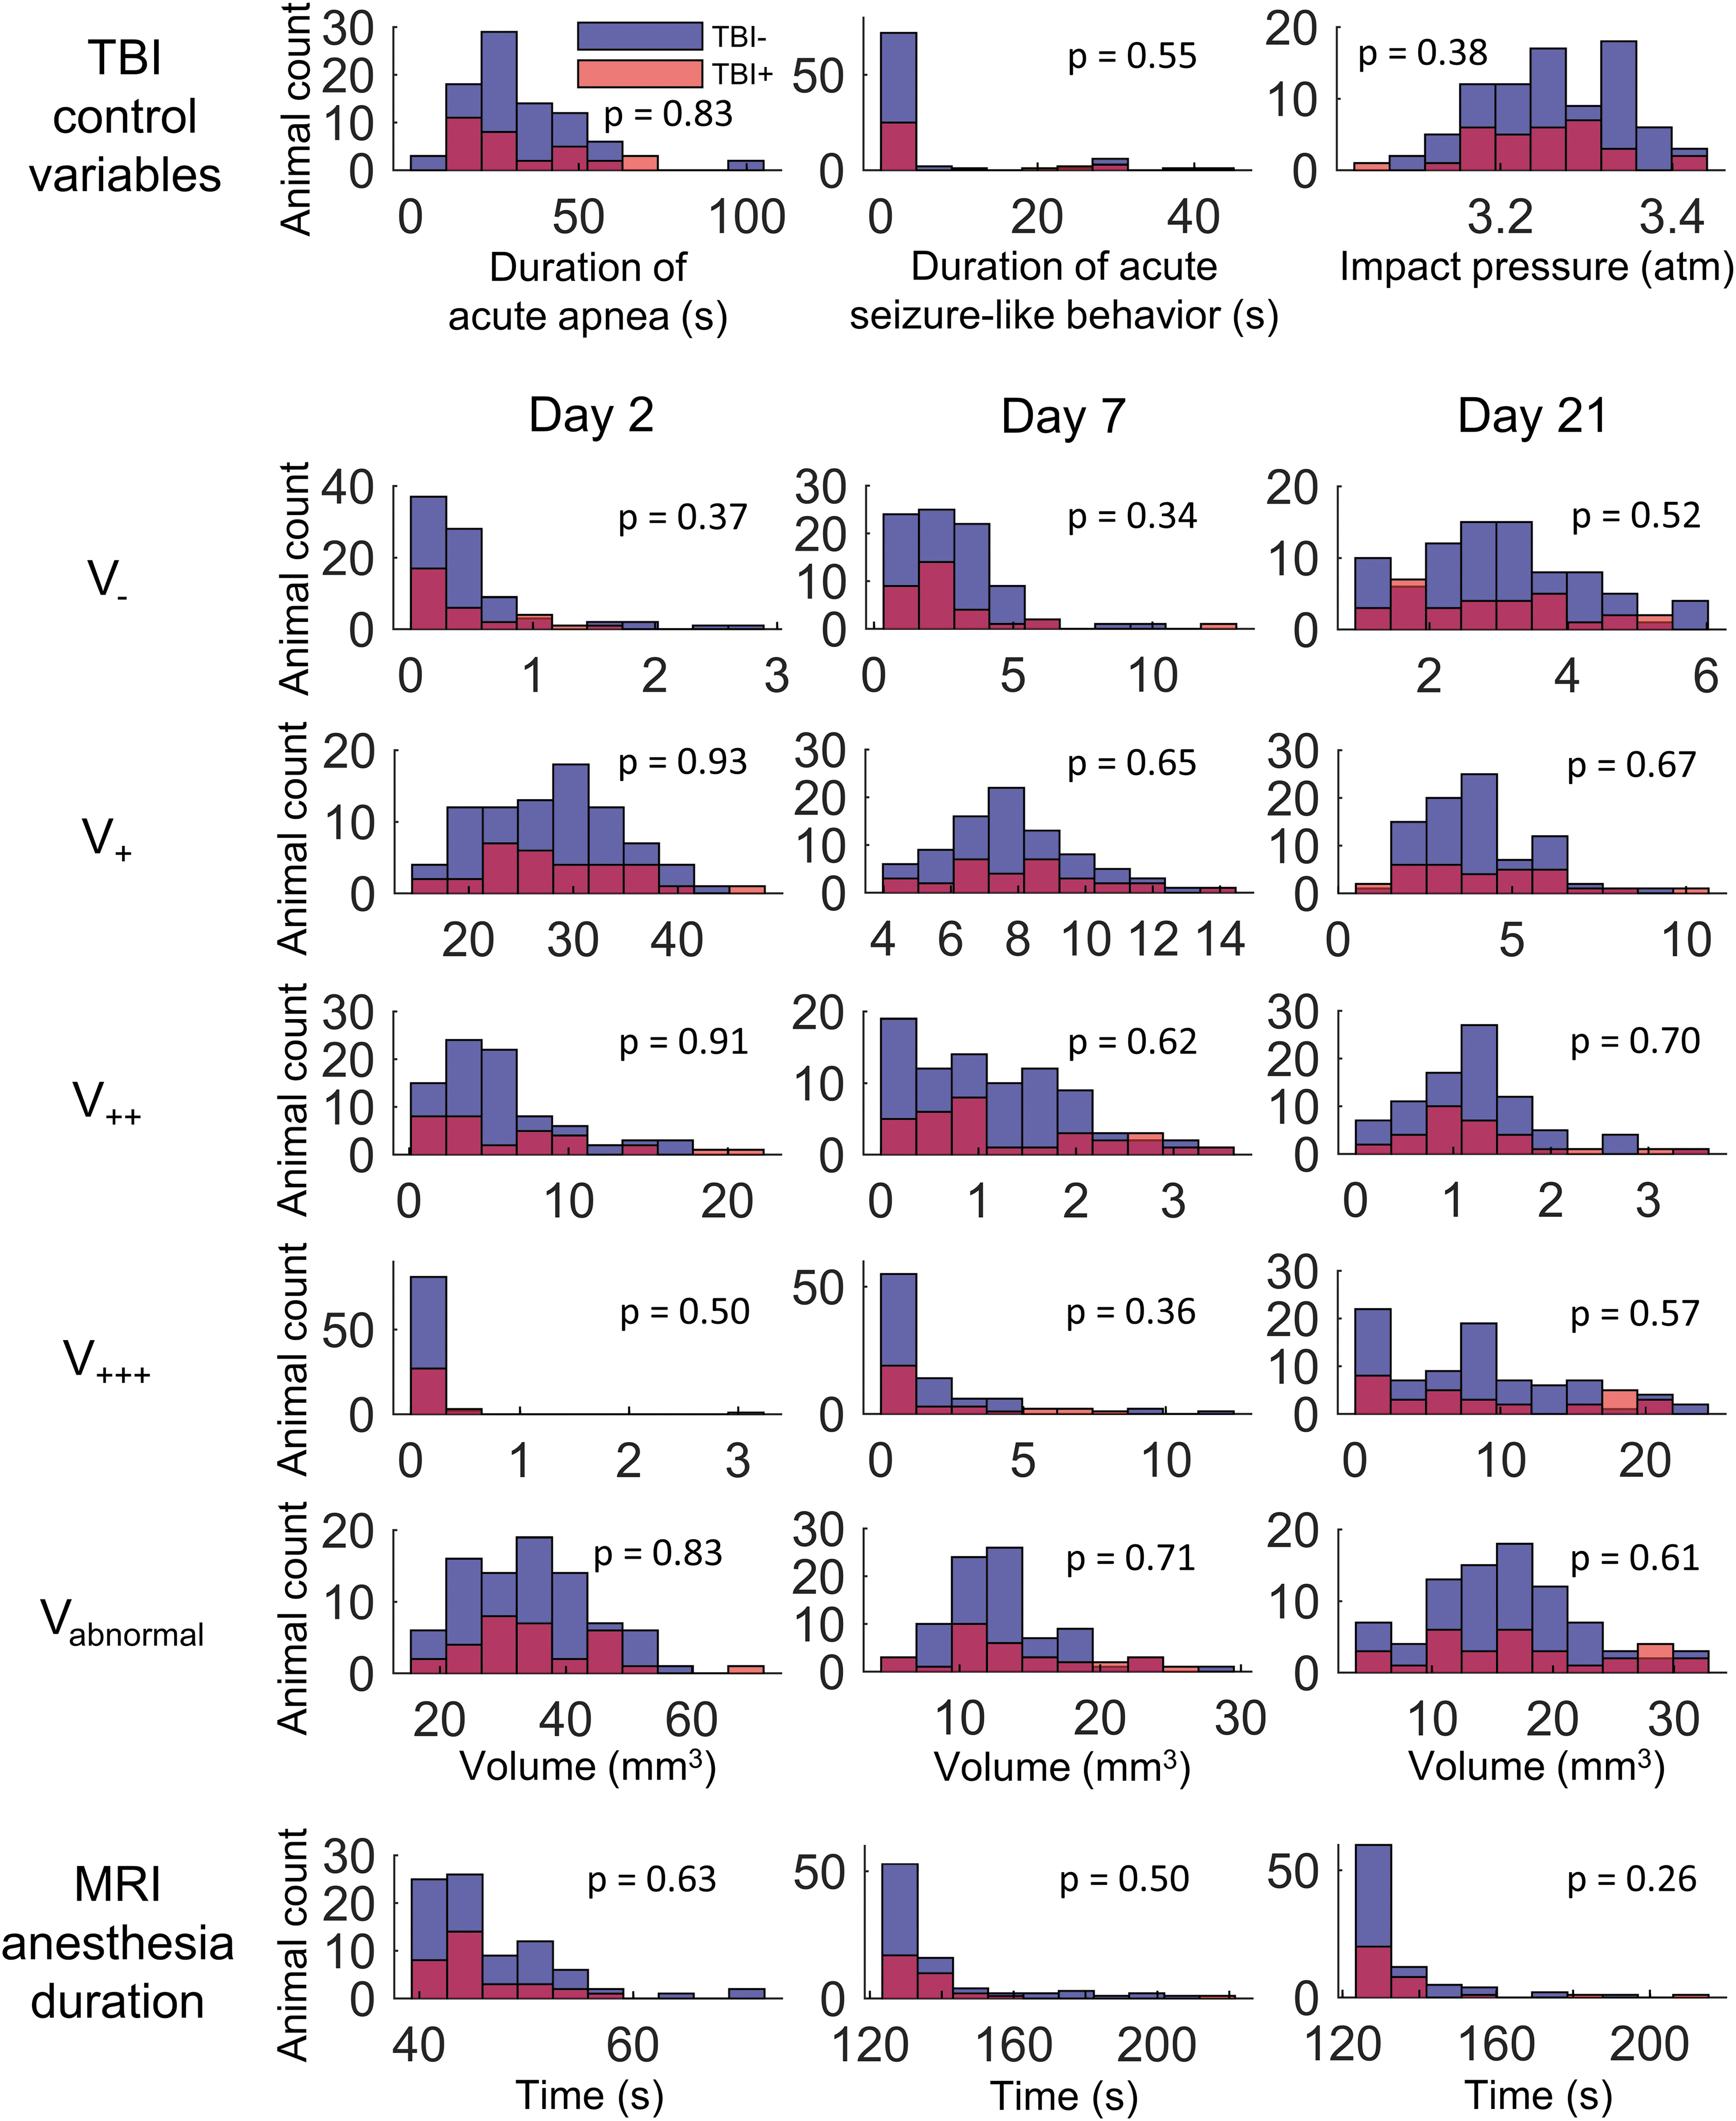
Associations between the development of post-traumatic epilepsy and duration of acute post-impact apnea, duration of immediate post-impact seizure-like behavior, and impact pressure, as well as the volume of pericontusional cortical region with decreased T2 relaxation (V-), slightly increased T2 relaxation (V+), moderately increased T2 relaxation (V++), greatly increased T2 relaxation (V+++), total volume of tissue with abnormal T2 relaxation (V), and duration of isoflurane anesthesia during magnetic resonance imaging (MRI) on days 2, 7, and 21 after TBI. Two superimposed histograms show rats with no spontaneous seizures in the 1-month (24/7) video-electroencephalography monitoring (TBI-) during the sixth follow-up month in blue and rats with spontaneous seizures (TBI+) in red. The p values for the null hypothesis (TBI+ and TBI- animals have the same distribution), according to the Mann-Whitney U test, are shown in each histogram. None of the parameters were significantly different between groups at a significance threshold of p < 0.05. TBI, traumatic brain injury. Color image is available online.
A general linear model (logistic first-order linear regression) was calculated to explain the development of PTE (one or more spontaneous seizures during vEEG monitoring period) using T2-classified lesion volumes V-, V+, V++, and V+++ at days 2, 7, and 21 post-TBI as explanatory variables. Additionally, duration of post-impact apnea (TA), duration of immediate post-impact seizure-like behaviors (TS), peak impact pressure (P), and isoflurane anesthesia duration during MRI (Ti) were included as control variables. No statistically significant model (χ2 (18,95) = 18.4; p = 0.427) was found to indicate that TBI+ and TBI- animals differed at the 0.05 significance level. Test statistics for each variable are shown in Supplementary Table S5.
Association of lesion location with epileptogenesis
We tested whether TBI- and TBI+ groups differed with respect to the cortical locations of T2 abnormalities. Figure 13 shows the location-dependent differences in the medians of TBI- and TBI+ animals. The difference at day 21 post-TBI suggests that the location of the lesion might be more rostral for the TBI- group and more caudal for the TBI+ group (Fig. 13C). The differences were not statistically significant, however, at any grid point (Mann-Whitney U test with Bonferroni's correction for multiple comparisons).
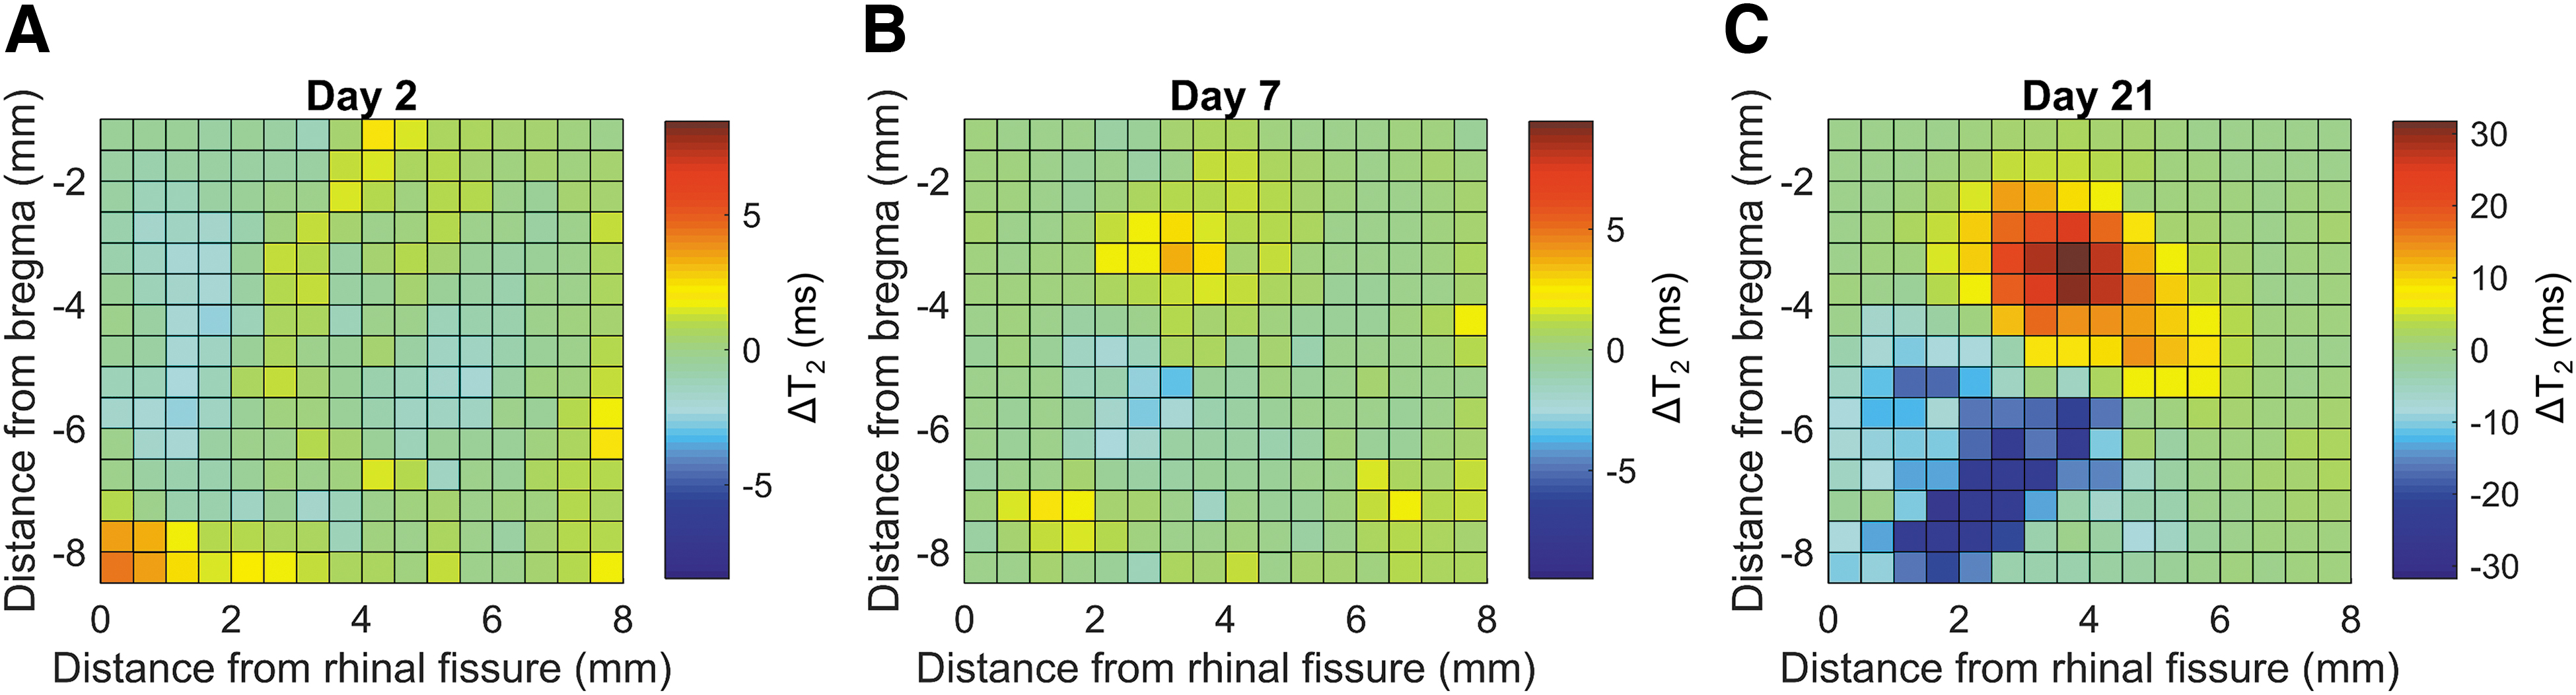
Difference (ΔT2) in median T2 on the unfolded cortical map between groups of rats with traumatic brain injury (TBI) with spontaneous seizures (TBI+) or without spontaneous seizures (TBI-) during the sixth month video-electroencephalography monitoring at (
Discussion
Our objective was to identify prognostic MRI biomarkers for cortical lesion severity and post-traumatic epileptogenesis after TBI. We performed a 6-month follow-up of 120 rats with lateral FPI that were imaged with MRI at days 2, 7, and 21 post-TBI. Of the 114 rats monitored by vEEG for 1 month during the sixth follow-up month, 27% developed epilepsy. In addition, our study included a follow-up of 23 sham-operated experimental controls. We found that size and severity of the pericontusional cortical lesion and its temporal progression greatly varied among the animals. The T2-based lesion severity classification reliably explained the progression of necrotic pericontusional cortical lesions, but not the development of epilepsy.
Unfolded two-dimensional cortical maps illustrated the dynamics and variability in the location, extent, and severity of T2 signal abnormality after lateral fluid percussion injury
Given that injury severity and location are risk factors for PTE in humans, 36 –38 we computed 2D cortical maps of T2 relaxation for each animal. In these maps, T2 relaxation time was averaged over the cortical thickness and is displayed as a function of two coordinates: distance from the rhinal fissure measured along the curvature of the cortex and the rostrocaudal location. Unfolded cortical maps are a convenient way of visualizing the location, extent, and severity of post-traumatic T2 signal abnormalities in individual animals. The maps also allowed for location-wise comparison between subjects and the identification of functional cortical regions affected by TBI. 39 However, because of the low spatial resolution (0.20 × 0.20 mm2 in the axial plane) and given that this approach averages the T2 relaxation values along the cortical thickness, we could not ascribe the observed changes in T2 relaxation to any specific cortical layer.
The T2 relaxation maps revealed a high variability in the necrotic lesion size, which ranged on day 2 from 0.0 to 3.2 mm3, on day 7 from 0.0 to 12 mm3, and on day 21 from 0.0 to 24 mm3. This is consistent with our previous findings of chronically monitored animals with lateral FPI and has also been reported by others. 21,39 –41 Importantly, lesion volume was not associated with the occurrence or duration of acute post-impact seizure-like behavior or the duration of isoflurane anesthesia during MRI. Although the duration of post-impact apnea was associated with lesion size, this association was not present when using the predictor variables from only the day 2 MRI. In addition, the lesion volume correlated with the magnitude of primary impact force, but the variability of the impact force between the animals was very small. Removal of all the control variables (duration of immediate post-impact apnea and seizure-like behavior, impact pressure, and duration of isoflurane anesthesia during MRI) from the regression model did not affect the explanatory power of the model (results not shown). We conclude that the variability of the control variables between individual animals did not explain the observed lesion sizes.
The mechanisms related to variable progression of the lesion severity within the presumably homogeneous population of animals with the same strain from the same vendor remain poorly understood, but could relate, for example, to pre-injury stress levels as in status epilepticus models. 42,43 In the present study, all animals received similar pre-surgery care by the same technician to reduce the handling-related stress. The variability in the lesion volume and progression, however, provide a starting point to explore whether the trajectory in the progression of pathology could be used as a biomarker of the structural and functional outcome.
Acute T2 abnormalities indicate the later progression of cortical injury
To assess whether the volume and severity of early post-injury T2 abnormalities would provide a prognostic biomarker for the evolution of cortical lesion severity, we categorized each imaging voxel based on its T2 value and converted the number of these voxels to volume. This allowed us to follow the number of voxels with different degrees of T2 abnormalities in individual animals over time and use the severity of T2 abnormality as a predictive factor in multi-variate analyses. For example, voxels in category R+++ with T2 >102 ms presented dead tissue with high confidence, progressing to even higher T2 values at later time points when the tissue was replaced with cerebrospinal fluid. Voxels in category R– with decreased T2 depicted an intake of dia- or paramagnetic substances and can likely be accounted for by the accumulation of iron.
Although the underlying pathological difference remained less clear in the intermediate categories R+ (55 ms < T2 ≤ 78 ms) and R++ (78 ms < T2 ≤ 102 ms), we considered their differentiation important given that the large range of elevated T2 values on days 2 and 7 appeared to predict the progression of the pathology by day 21. In particular, T2 MRI performed at day 2 or day 7 post-TBI modeled necrotic lesion volume at day 21 post-TBI, with the day 7 post-TBI measurements showing a better performance. Combining day 2 and day 7 measurements into a single regression model did not improve the model performance as compared with that for day 7 measurements only. The total volume of voxels in category R++ (78 ms < T2 ≤ 102 ms) on day 7 had a high linear correlation coefficient (0.79) with the necrotic lesion volume on day 21, suggesting that it alone could predict lesion progression with high confidence.
Interestingly, modeling the volume of non-necrotic tissue with increased T2 on day 7 after TBI proved to be unreliable, suggesting that tissue with slightly or moderately increased T2 might be recoverable with appropriate treatment. On day 2, the increase in T2 in such tissue likely relates to vasogenic edema and is mostly resolved by day 7. 40 The remaining tissue volume with mildly or moderately increased T2 on days 7 and 21 may reflect inflammation and neurodegeneration processes, which can last up to a year. 21,40
Taken together, data from our large EPITARGET series of animals revealed that the duration of post-impact apnea or seizure-like behavior did not predict the extent and/or severity of cortical pathology. It is possible, however, to predict the progression of necrotic lesion size in the perilesional cortex post-TBI using a single early time-point measurement of T2 relaxation time. This is valuable information for forming an acute time-point prediction of lesion progression, for example, for selecting subjects for pre-clinical trials testing neuroprotectants.
Acute cortical T2 abnormalities failed to demonstrate an association between the severity of cortical lesion and epileptogenesis after traumatic brain injury
In the EPITARGET animal cohort, 27% of rats exhibited spontaneous unprovoked electrographic seizures. This finding is in good agreement with the pre-study power calculations estimating a 25% prevalence of epilepsy at 6 months on the basis of previous pre-clinical follow-up studies of rats with lateral FPI in our laboratory and others. 10 –15
Previous epidemiological studies in humans have demonstrated an association between injury severity assessed with Glasgow Coma Scale and the risk of PTE. 36,37,44 Here, T2-based lesion classification enabled us to specifically investigate the effect of cortical lesion volume and its severity on the risk of epileptogenesis. We were unable to produce a model to explain the development of PTE. Our findings suggest that size and severity of the cortical lesion determined from T2 MRI relaxation mapping, without additional information, are insufficient metrics for predicting epileptogenic progression during the first month after lateral FPI. Interestingly, our data correlate with the findings of Tomkins and colleagues in humans with TBI, showing that perilesional blood–brain barrier leakage, but not cortical lesion volume, is associated with the development of PTE. 25,45
In animal studies, the caudal location of a cortical lesion is associated with PTE in the lateral FPI model. 26 Although we detected a trend toward an increased T2 in the caudal areas of the cortex in animals with epilepsy, the data became non-significant after correcting for multiple testing.
Conclusion
Our data show that quantitative T2 MRI provides a useful explanatory tool for predicting the progression of cortical lesions, particularly the necrotic component, that can be applied in pre-clinical trials testing neuroprotectants. This approach, however, did not reveal prognostic biomarkers for post-traumatic epileptogenesis. It is likely that the complexity of epileptogenesis after TBI cannot be predicted by a single-parameter approach, but requires integration of data from other brain regions, MRI sequences, and even other biomarker modalities.
Footnotes
Acknowledgments
We thank Jarmo Hartikainen for his excellent technical help.
Funding Information
This study was supported by the Medical Research Council of the Academy of Finland (grants 272249 and 273909) and by the European Union's Seventh Framework Programme (FP7/2007-2013) under grant agreement no. 602102 (EPITARGET). Alejandra Sierra wants to thank Academy of Finland for funding support (#284544; #312686, and #275453).
Author Disclosure Statement
No competing financial interests exist.
Supplementary Material
Supplementary Figure S1
Supplementary Figure S2
Supplementary Table S1
Supplementary Table S2
Supplementary Table S3
Supplementary Table S4
Supplementary Table S5
References
Supplementary Material
Please find the following supplemental material available below.
For Open Access articles published under a Creative Commons License, all supplemental material carries the same license as the article it is associated with.
For non-Open Access articles published, all supplemental material carries a non-exclusive license, and permission requests for re-use of supplemental material or any part of supplemental material shall be sent directly to the copyright owner as specified in the copyright notice associated with the article.