




Abstract
A sport-related concussion (SRC) results in short- and long-term deficits in oculomotor control; however, it is unclear whether this change reflects executive dysfunction and/or a performance decrement caused by an increase in task-based symptom burden. Here, individuals with a SRC – and age- and sex-matched controls – completed an antisaccade task (i.e., saccade mirror-symmetrical to a target) during the early (initial assessment ≤12 days) and later (follow-up assessment <30 days) stages of recovery. Antisaccades were used because they require top-down executive control and exhibit performance decrements following an SRC. Reaction time (RT) and directional errors were included with pupillometry, because pupil size in the antisaccade task has been shown to provide a neural proxy for executive control. In addition, the Sport-Concussion Assessment Tool (SCAT-5) symptom checklist was completed prior to and after each oculomotor assessment to identify a possible task-based increase in symptomology. The SRC group yielded longer initial assessment RTs, more directional errors, and larger task-evoked pupil dilations (TEPD) than the control group. At the follow-up assessment, RTs for the SRC and control group did not reliably differ; however, the former demonstrated more directional errors and larger TEPDs. SCAT-5 symptom severity scores did not vary from the pre- to post-oculomotor evaluation for either initial or follow-up assessments. Accordingly, an SRC imparts a persistent executive dysfunction to oculomotor planning independent of a task-based increase in symptom burden. These findings evince that antisaccades serve as an effective tool to identify subtle executive deficits during the early and later stages of SRC recovery.
Introduction
A sport-related concussion (SRC) is a mild traumatic brain injury (mTBI) resulting from biomechanical forces transmitted to the head that produce shear-related damage to the brain's neural and glial networks. 1 The Centers for Disease Control reports that among young people, SRCs are the third leading cause of TBI-related visits to emergency departments; however, this number is regarded as an underestimation given a myriad of factors including: (1) lack of recognition by coaching and training staff and (2) an athlete's reluctance to report symptoms because of concerns about being withheld from competition. 2 The lack of appropriate SRC identification is a crucial consideration given that concussed athletes are three to six times more likely to sustain a subsequent and more severe concussion. As a result, there is continued need for SRC research to improve identification and return to play management.
The Consensus Statement on Concussion in Sport reports that the Sport Concussion Assessment Tool (SCAT-5) is a valid neuropsychological test battery for differentiating between concussed and non-concussed athletes when administered by an experienced clinician. 3 SCAT-5 validity, however, is diminished 3–5 days post-injury. This is a salient limitation because not all athletes have timely access to SCAT-5 administration. Further, the SCAT-5 does not provide a comprehensive neuropsychological evaluation, does not provide sufficient resolution for identifying subtle neurocognitive deficits, and is associated with decreased sensitivity following repeated test exposure. 4
One approach that may account for limitations of the SCAT-5 – and other general SRC assessment tools – is a task providing a direct measure of executive function. Executive function represents a constellation of cognitive processes including inhibitory control, maintaining task goals in working memory, and cognitive flexibility. 5 Moreover, executive dysfunction is recognized as the most common and persistent sequela impairing recovery across all severities of TBI. For example, Heitger and colleagues evaluated executive function and general cognitive performance (e.g., Wechsler Abbreviated Scale of Intelligence) in a corpus of adults (n = 37) with a mTBI (sport and motor vehicle injuries) at 1 week and 3 and 6 months post-injury. 6 The authors reported that executive function – but not general cognitive performance – exhibited impairment at each post-injury assessment and is a deficit shown to persist 7 years post-injury. 7
Antisaccades are an executive task requiring a goal-directed eye movement (i.e., saccade) mirror-symmetrical to a target, and produce longer reaction times (RT), more directional errors, and decreased endpoint accuracy than their prosaccade counterparts (i.e., a saccade directed to a veridical target). 8 –10 Antisaccade behavioral “costs” are attributed to the executive demands of inhibiting a pre-potent prosaccade (i.e., response suppression) and the 180° transposition of a target's coordinates (i.e., vector inversion). 11 Human neuroimaging and non-human primate electrophysiological evidence has linked the constituent elements of the antisaccade task to increased activity in an extensive frontoparietal executive network. 12 What is more, antisaccades have been shown to be an effective tool for identifying subtle executive impairments in persons at risk for cognitive decline and predisposed to neuropsychiatric disease. 13 –15
To our knowledge, only two studies have used antisaccades to examine executive dysfunction in SRC. In the first, Johnson and colleagues had individuals with an SRC complete antisaccades at acute (i.e., <7 days) and later (> 30 days) stages of recovery, and measured concurrent neuroimaging (i.e., functional magnetic resonance imaging [fMRI]). 16,17 The authors reported that persons with an SRC produced acute and later stage RTs that were 50 ms and 15 ms longer, respectively, than those for counterparts without an SRC. Further, the authors reported that the longer antisaccade RTs were associated with hyperactivity across a range of frontal and posterior structures, and proposed that such results reflect increased recruitment of neuronal resources to account for impaired and inefficient executive control. In a second study, our group contrasted pro- and antisaccades in persons with an SRC and their age- and sex-matched controls at an acute (< 7 days post-injury) and a follow-up (14–20 days post-injury) stage. 18 Notably, the follow-up stage occurred immediately after individuals were medically cleared for safe return to play. Results showed that initial and follow-up stage prosaccade RTs for the SRC and control group did not reliably differ: an expected finding given that prosaccades are mediated largely independent of executive control. 19 In contrast, initial stage antisaccade RTs for the SRC group were 97 ms longer than for the control group, whereas follow-up values did not reliably vary between groups. It is, however, important to note that the SRC group exhibited more antisaccade directional errors at initial and follow-up stages. As a result, it was concluded that executive dysfunction in oculomotor planning persists even after the clinical signs of an SRC have resolved.
An important consideration of the antisaccade task and other executive and cognitive tasks is that their “challenging” nature may exacerbate SRC symptomology. 20 It is therefore possible that a task-induced increase in symptom severity engenders an implicit or explicit strategy wherein concussed athletes decrease executive effort to prevent (or reduce) symptomology. Of course, in an antisaccade task, such a strategy would result in longer RTs and increased directional errors independent of an executive impairment. To address this issue, we employed traditional antisaccade performance metrics (i.e., RT and directional errors) with measures of: (1) pupil size (i.e., pupillometry), and (2) pre- and post-assessment symptom severity determined via the SCAT-5 total symptom severity score. In the first case, the inclusion of pupillometry was based on work in healthy controls showing that the preparatory phase (i.e., prior to saccade initiation) of directionally correct antisaccades is associated with larger pupil dilations than prosaccades. 21,22 Wang and colleagues proposed that pupil size changes in the antisaccade task provide a proxy for the neural activity related to executive-based oculomotor planning. In the second case, it is widely recognized that the number and severity of concussion symptoms (e.g., anxiety, headache, nausea, vertigo) are increased when an individual with an SRC is returned to a challenging environment (i.e., school, occupation, or sport) prior to recovery. 23 It is, however, unclear whether the evaluation of antisaccades contributes to increased symptom burden and a decrease in executive effort and performance. Accordingly, the present work measured symptom severity prior to and after oculomotor assessments via the SCAT-5 total symptom severity checklist. The total symptom severity score involves a Likert rating of a 22-item list of symptoms that index quality of life following an SRC.
Here, participants completed pro- and antisaccades at acute (average = 5.7 days, standard deviation [SD] = 3.5) and follow-up (average = 23.2 days, SD = 5.3) stages of SRC recovery, and results were contrasted with those of age- and sex-matched controls. Both groups completed the SCAT-5 symptom severity checklist prior to and after initial and follow-up stage oculomotor assessments. In terms of research predictions, if the SRC group produces longer antisaccade RTs coupled with null between-task (i.e., pro- vs. antisaccade) differences in preparatory phase pupil dilations, and demonstrate an increase in symptom severity following an oculomotor assessment, then results would provide evidence of a task-based increase in symptom severity. In contrast, if the SRC group exhibits longer antisaccade RTs and a between-task difference in pupil diameter without a change in symptom severity, then results would provide convergent evidence of executive dysfunction in oculomotor planning. Further, the inclusion of initial and follow-up stages provided a framework to determine the magnitude by which SRC executive dysfunction and/or symptom burden continues to influence oculomotor performance.
Methods
Participants
Participants with an SRC were recruited through the Sport Medicine Concussion Care Program at the Fowler-Kennedy Sport Medicine Clinic, London, Ontario. The identification of an SRC was based on SCAT-5 performance and the combined clinical judgment of a sports physician and physician assistant. Inclusion criteria for the SRC group were: being recruited into the study within 12 days of the concussive event; being between 16 and 35 years of age; being self-reported right-hand dominant; having normal or corrected-to-normal vision; having no previous or current neurological or neuropsychiatric disorder (apart from the current concussion); having no history of learning disorder; and not using anticholinergic medication. Twenty-seven individuals were identified for inclusion in the study with recruitment occurring over a 7-month window. The rationale for not enrolling in the study included: lack of interest (n = 2), the time between injury and diagnosis being >12 days (n = 7), and being unable to commit to initial and follow-up assessments (n = 1). Seventeen individuals with an SRC met the inclusion criteria and agreed to participate in the study. One SRC participant was excluded from final data analyses because of excessive blinking. Hence, the final SRC group included 16 participants (age range: 16–28 years; 6 male, 10 female). Seventeen healthy individuals (i.e., control group, age range: 16–28 years of age; 6 male, 11 female) were recruited from the University of Western Ontario community and served as age- and sex- matched controls. Inclusion criteria for the control group were the same as for the SRC group, with the exception of the controls having no previous concussion history. Participants were asked to refrain from consuming caffeine or tobacco 8 h prior to a study visit, and all participants reported that they could differentiate between the differently colored (i.e., see Apparatus and procedures) fixation crosses used in our oculomotor assessment.
Prior to data collection, participants read a letter of information and signed a consent form approved by the Health Sciences Research Ethics Board, University of Western Ontario, and the Research Quality and Compliance Board, Lawson Health Research Institute. This work was conducted according to the Declaration of Helsinki.
Experimental overview
The SRC group completed their experimental sessions at two different time points (i.e., initial and follow-up assessments). The initial assessment occurred 1–12 days post-injury (average = 5.7 days, SD = 3.5), and in all cases occurred within 1 h of SRC diagnosis (see Participants). The follow-up assessment occurred 14–30 days post concussive event (average = 23.2 days, SD = 5.3) and was completed within 1 h of participants' seeing the Fowler–Kennedy clinical care team. For the control group, the duration between initial and follow-up assessments was designed to closely match the timing of their age- and sex-matched participant in the SRC group (average = 16.6 days, SD = 2.5).
Apparatus and procedures
Prior to and after initial and follow-up oculomotor assessments participants completed the self-report SCAT-5 symptom severity checklist that includes 22 concussion symptoms (e.g., headache, difficulty concentrating, vertigo) with each scored on a Likert scale (0 = none; 6 = severe). We used the total symptom score (maximum = 132) to evaluate for possible pre- to post-oculomotor assessment changes in symptomology. The administration of the symptom checklist required ∼5 min.
For the oculomotor assessment (i.e., initial and follow-up), participants sat in a height-adjustable chair with their heads placed in a head/chin rest. A 30-inch liquid crystal display (LCD) monitor (60 Hz, 8 ms response rate, 1280 × 960 pixels; Dell 3007WFP, Round Rock, TX, USA) was located at participants' midline and 550 mm from the front edge of the tabletop, and was used to present visual stimuli. The gaze position and pupil size of participants' left eye was sampled (EyeLink 1000 Plus; SR Research Ltd, Ottawa, ON, Canada) at 1000 Hz. Two additional monitors, visible only to the experimenter, provided real-time point of gaze information, trial-by-trial saccade kinematics (i.e., displacement and velocity), and information related to the accuracy of the eye-tracking system (i.e., to perform a recalibration when necessary). Stimulus presentation and data acquisition were controlled via MATLAB (R2018b, TheMathWorks, Natick, MA, USA) and the Psychophysics Toolbox extensions (v. 3.0) including the EyeLink Toolbox. 24 –26 Prior to data collection a nine-point calibration of the eye-tracker was completed and followed by an immediate verification to determine that no point in the calibration space contained more than 1 degree of error.
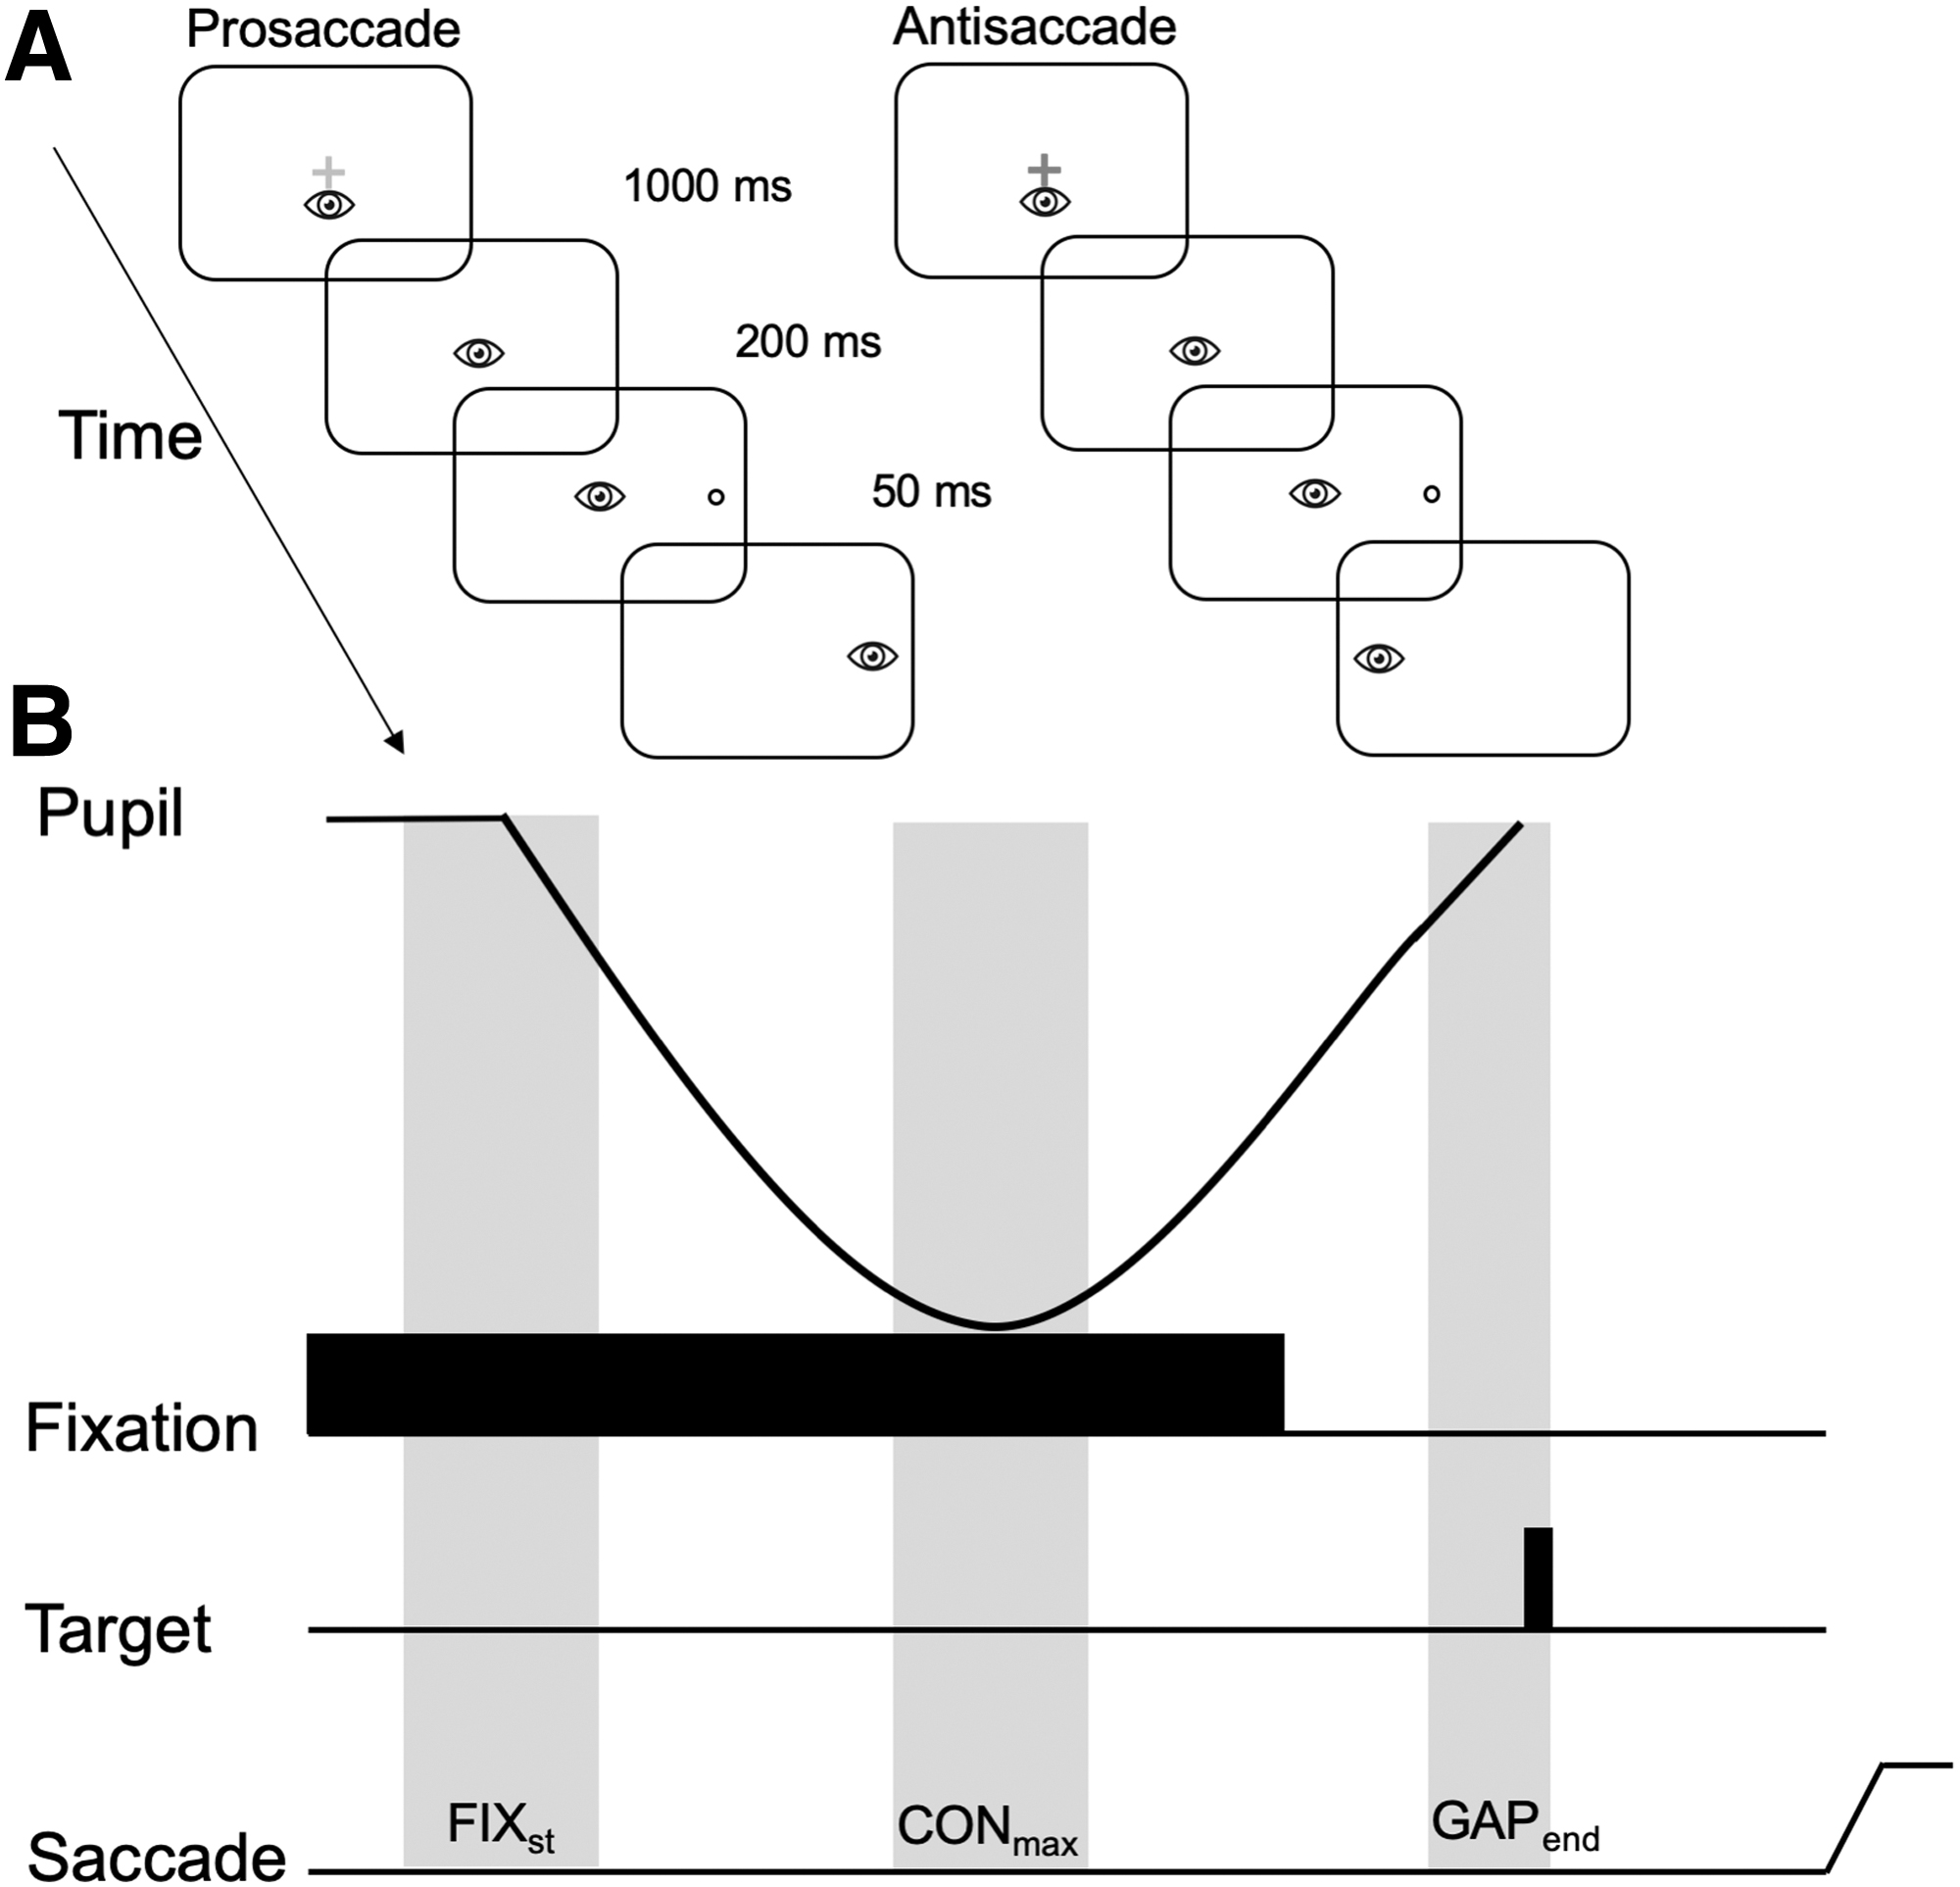
Visual stimuli were presented on a high-contrast black background (1 cd/m2) and included a centrally presented fixation cross (1 degree) that appeared as green or red, and were luminance matched (42 cd/m2). The color of the fixation indicated the nature of a to-be-completed response (i.e., prosaccade = green; antisaccade = red). Open white circles served as target stimuli (2.7 degree diameter: 132 cd/m2) and were 13.5 degrees (i.e. proximal target) and 16.5 degrees (i.e., distal target) to the left and right of fixation and in the same horizontal axis. The different eccentricities were used to prevent participants from adopting stereotyped responses. A trial began with the appearance of the fixation cross for 1000 ms, after which it was extinguished and a target appeared 200 ms thereafter (i.e., gap paradigm) (Fig. 1a). A gap paradigm was used because its duration provided a time frame to examine task-based changes in pupil dynamics. 21,22 Targets were presented for 50 ms and this brief presentation – in part – served to equate pro- and antisaccades for the absence of retinal feedback. 27 Target onset cued participants to pro- (i.e., saccade to veridical target location) or antisaccade (i.e., saccade mirror-symmetrical to target location) as “quickly and accurately as possible.” Pro- and antisaccades, as well as stimulus location (i.e., left and right of fixation at proximal and distal eccentricities) were pseudo-randomly interleaved for a total of 120 trials. Data collection – including calibration time – required ∼12 min.
Data reduction and pupillometry processing
Gaze position data were filtered offline via a dual-pass Butterworth filter employing a low-pass cutoff frequency of 15 Hz. Filtered displacement data were used to calculate instantaneous velocities via a five-point central-finite difference algorithm. Acceleration data were similarly obtained from the velocity. Saccade onset was determined when velocity and acceleration exceeded 30 degrees/sec and 8000 degrees/sec, respectively. Saccade offset was marked by velocity <30 degrees/sec for 42 consecutive frames (i.e., 42 ms). Trials with missing data (i.e., loss of signal >25% of fixation period), RT <85 ms, and/or an amplitude <2 degrees or >26 degrees were excluded from the analyses and accounted for <6% of trials. 10,28,29 Pro- and antisaccade trials with a directional error (i.e., a prosaccade instead of an instructed antisaccade or vice versa) were excluded from the analyses of performance and pupillometry metrics (see Dependent variables and statistical analyses) because they are mediated by planning mechanisms distinct from their directionally correct counterparts. 30
Pupil data were filtered offline via a 10 Hz low-pass filter. Trials missing >40% of data or an eye position deviation >2 degrees from the fixation during the initial fixation period (i.e., 0–1200 ms after fixation cross onset) were excluded from analyses. A blink correction algorithm involving linear interpolation beginning 50 ms before the blink and ending 150 ms after the blink was used to avoid task-uncorrelated high-frequency changes in pupil size. 28 A pupil size >2.5 SD from a participant's mean was removed (< 18% of trials). Because video-based tracking systems can distort pupil size following changes in gaze location, this measure was restricted to epochs involving central fixation and prior to saccade initiation (i.e., when gaze was located at the center of the screen). In line with Wang and colleagues, three epochs were selected: (1) the start of the visual fixation (FIXst: 100–300 ms after fixation onset), (2) maximal pupil constriction (CONmax: 650–750 ms after fixation onset), and (3) end of gap (GAPend: 150–200 ms following gap onset) (see Fig. 1b). 21
Dependent variables and statistical analyses
Dependent variables included the SCAT-5 total symptom severity score (max score = 132), RT (time from target onset to saccade onset), coefficient of variation (CV) of RT (i.e., SD/mean × 100), percentage of directional errors, saccade duration (time from saccade onset to saccade offset), peak velocity (i.e., time from saccade onset to peak velocity), and saccade gain (i.e., saccade amplitude/target amplitude) in the primary (i.e., horizontal) movement direction. Dependent variables for pupillometry included: baseline pupil diameter (average pupil diameter during FIXst) and task-evoked pupil dilation (TEPD) (GAPend - CONmax). The aforementioned pupil measures were based on relative diameter and are in accord with an extensive literature. 21 As shown in Figure 1b, the pupil response consists of a sharp constriction in response to fixation onset (i.e., the pupillary light response) followed by a dilation (i.e., TEPD). The dilation is reported to represent a measure of cognitive and neural processing related to saccade preparation in the locus coeruleus, superior colliculus (SC), and frontal eye fields. 21,31
Oculomotor performance and pupillometry dependent variables were analyzed via 2 (group: SRC, control), by 2 (assessment: acute, follow-up), by 2 (task: pro-, antisaccade) split-plot analyses of variance (ANOVAs). To simplify our ANOVA model, target eccentricity (i.e., proximal, distal) was included as a collapsed factor. This decision was based on the work of Webb and colleagues (which employed the same target eccentricities as used here) showing that RTs for the SRC and control groups did not vary as a function of target eccentricity. 18 For the SCAT-5 symptom severity score, the variable time (pre-oculomotor, post-oculomotor) was included in the ANOVA model to account for the fact that symptom scores were examined prior to and after each oculomotor assessment. An α level of 0.05 was used for statistical significance and simple-effects (i.e., Welch's and Student's t tests for between- and within-groups contrasts, respectively) were employed to decompose main effects and interactions.
Results
SCAT-5 symptom severity
Results revealed a main effect of group (F[1,31] = 38.90, p < 0.001, ηp 2 = 0.55), assessment (F[1,31] = 42.18, p < 0.001, ηp 2 = 0.57), and their interaction (F[1,31] = 45.51, p < 0.001, ηp 2 = 0.58). Figure 2 presents participant-specific symptom severity scores and demonstrates that values were larger for the SRC – at initial and follow-up assessments – than the control group. Control group symptom severity did not reliably vary between initial and follow-up assessments (t[16] = -0.15, p = 0.87) (Fig. 2a), whereas SRC group values decreased from initial to follow-up assessments (t[15] = 6.37, p < 0.001) (Fig. 2b). Symptom severity did not produce a main effect of time or any higher-order interaction involving time (F[1,31] = 1.85, p = 0.18, ηp 2 = 0.05); that is, symptom severity did not reliably vary from pre- to post-oculomotor time points. Given the nature of our research question, two one-sided test (TOST) statistics were used to determine if SRC group pre- and post-oculomotor symptom severity values were within an equivalence boundary. 32 Initial assessment values were not within an equivalence boundary (t[15] = 1.44, p = 0.085), whereas follow-up assessment values were (t[15] = 1.80, p = 0.046). Although not “statistically equivalent,” Figure 2b shows that symptom severity at the initial assessment (and the follow-up assessment) decreased from the pre- (44, SD = 25) to the post-oculomotor (40, SD = 25) time points. Thus, null hypothesis and equivalence testing combined with descriptive statistics indicate that the oculomotor task did not increase symptom severity.

The left panels show control and sport-related concussion group initial and follow-up assessment Sport-Concussion Assessment Tool (SCAT)-5 participant-specific symptom severity scores (maximum score = 132) at pre- and post-oculomotor time points. (
Saccade performance
RT and CV of RT
Figure 3 provides initial assessment pro- and antisaccade position by time trajectories for an exemplar control and SRC participant. The figure demonstrates that RTs for the SRC participant were longer and markedly more variable than those for the control participant. Figure 4 presents control and SRC group pro- and antisaccade RT frequency histograms at initial and follow-up assessments. The figure demonstrates that: (1) pros-accade RTs were shorter than antisaccade RTs, and (2) SRC group RTs decreased from the initial to follow-up assessments. Quantitative analyses yielded main effects of group (F[1,31] = 4.86, p = 0.035, ηp 2 = 0.13), assessment (F[1,31] = 11.52, p = 0.002, ηp 2 = 0.27), and task (F[1,31] = 130.40, p < 0.001, ηp 2 = 0.81), and a group by assessment interaction (F[1,31] = 6.29, p = 0.018, ηp 2 = 0.17). RTs for prosaccades were shorter than those for antisaccades, and the interaction indicated that initial assessment RTs were longer for the SRC than for the control group (t[24.4] = 3.03, p = 0.005), whereas follow-up assessment RTs did not reliably vary between groups (t[24.1] = 1.18, p = 0.25) (Figure 4a and b; see also Table 1). The TOST statistic indicated that follow-up assessment RTs for control and SRC groups were outside an equivalence boundary (t[24.2] = 0.24, p = 0.25). Within-group contrasts indicated that RTs decreased from initial to follow-up assessment for the SRC (t[15] = 3.30, p = 0.005) but not the control group (t[16] = 0.92, p = 0.37).
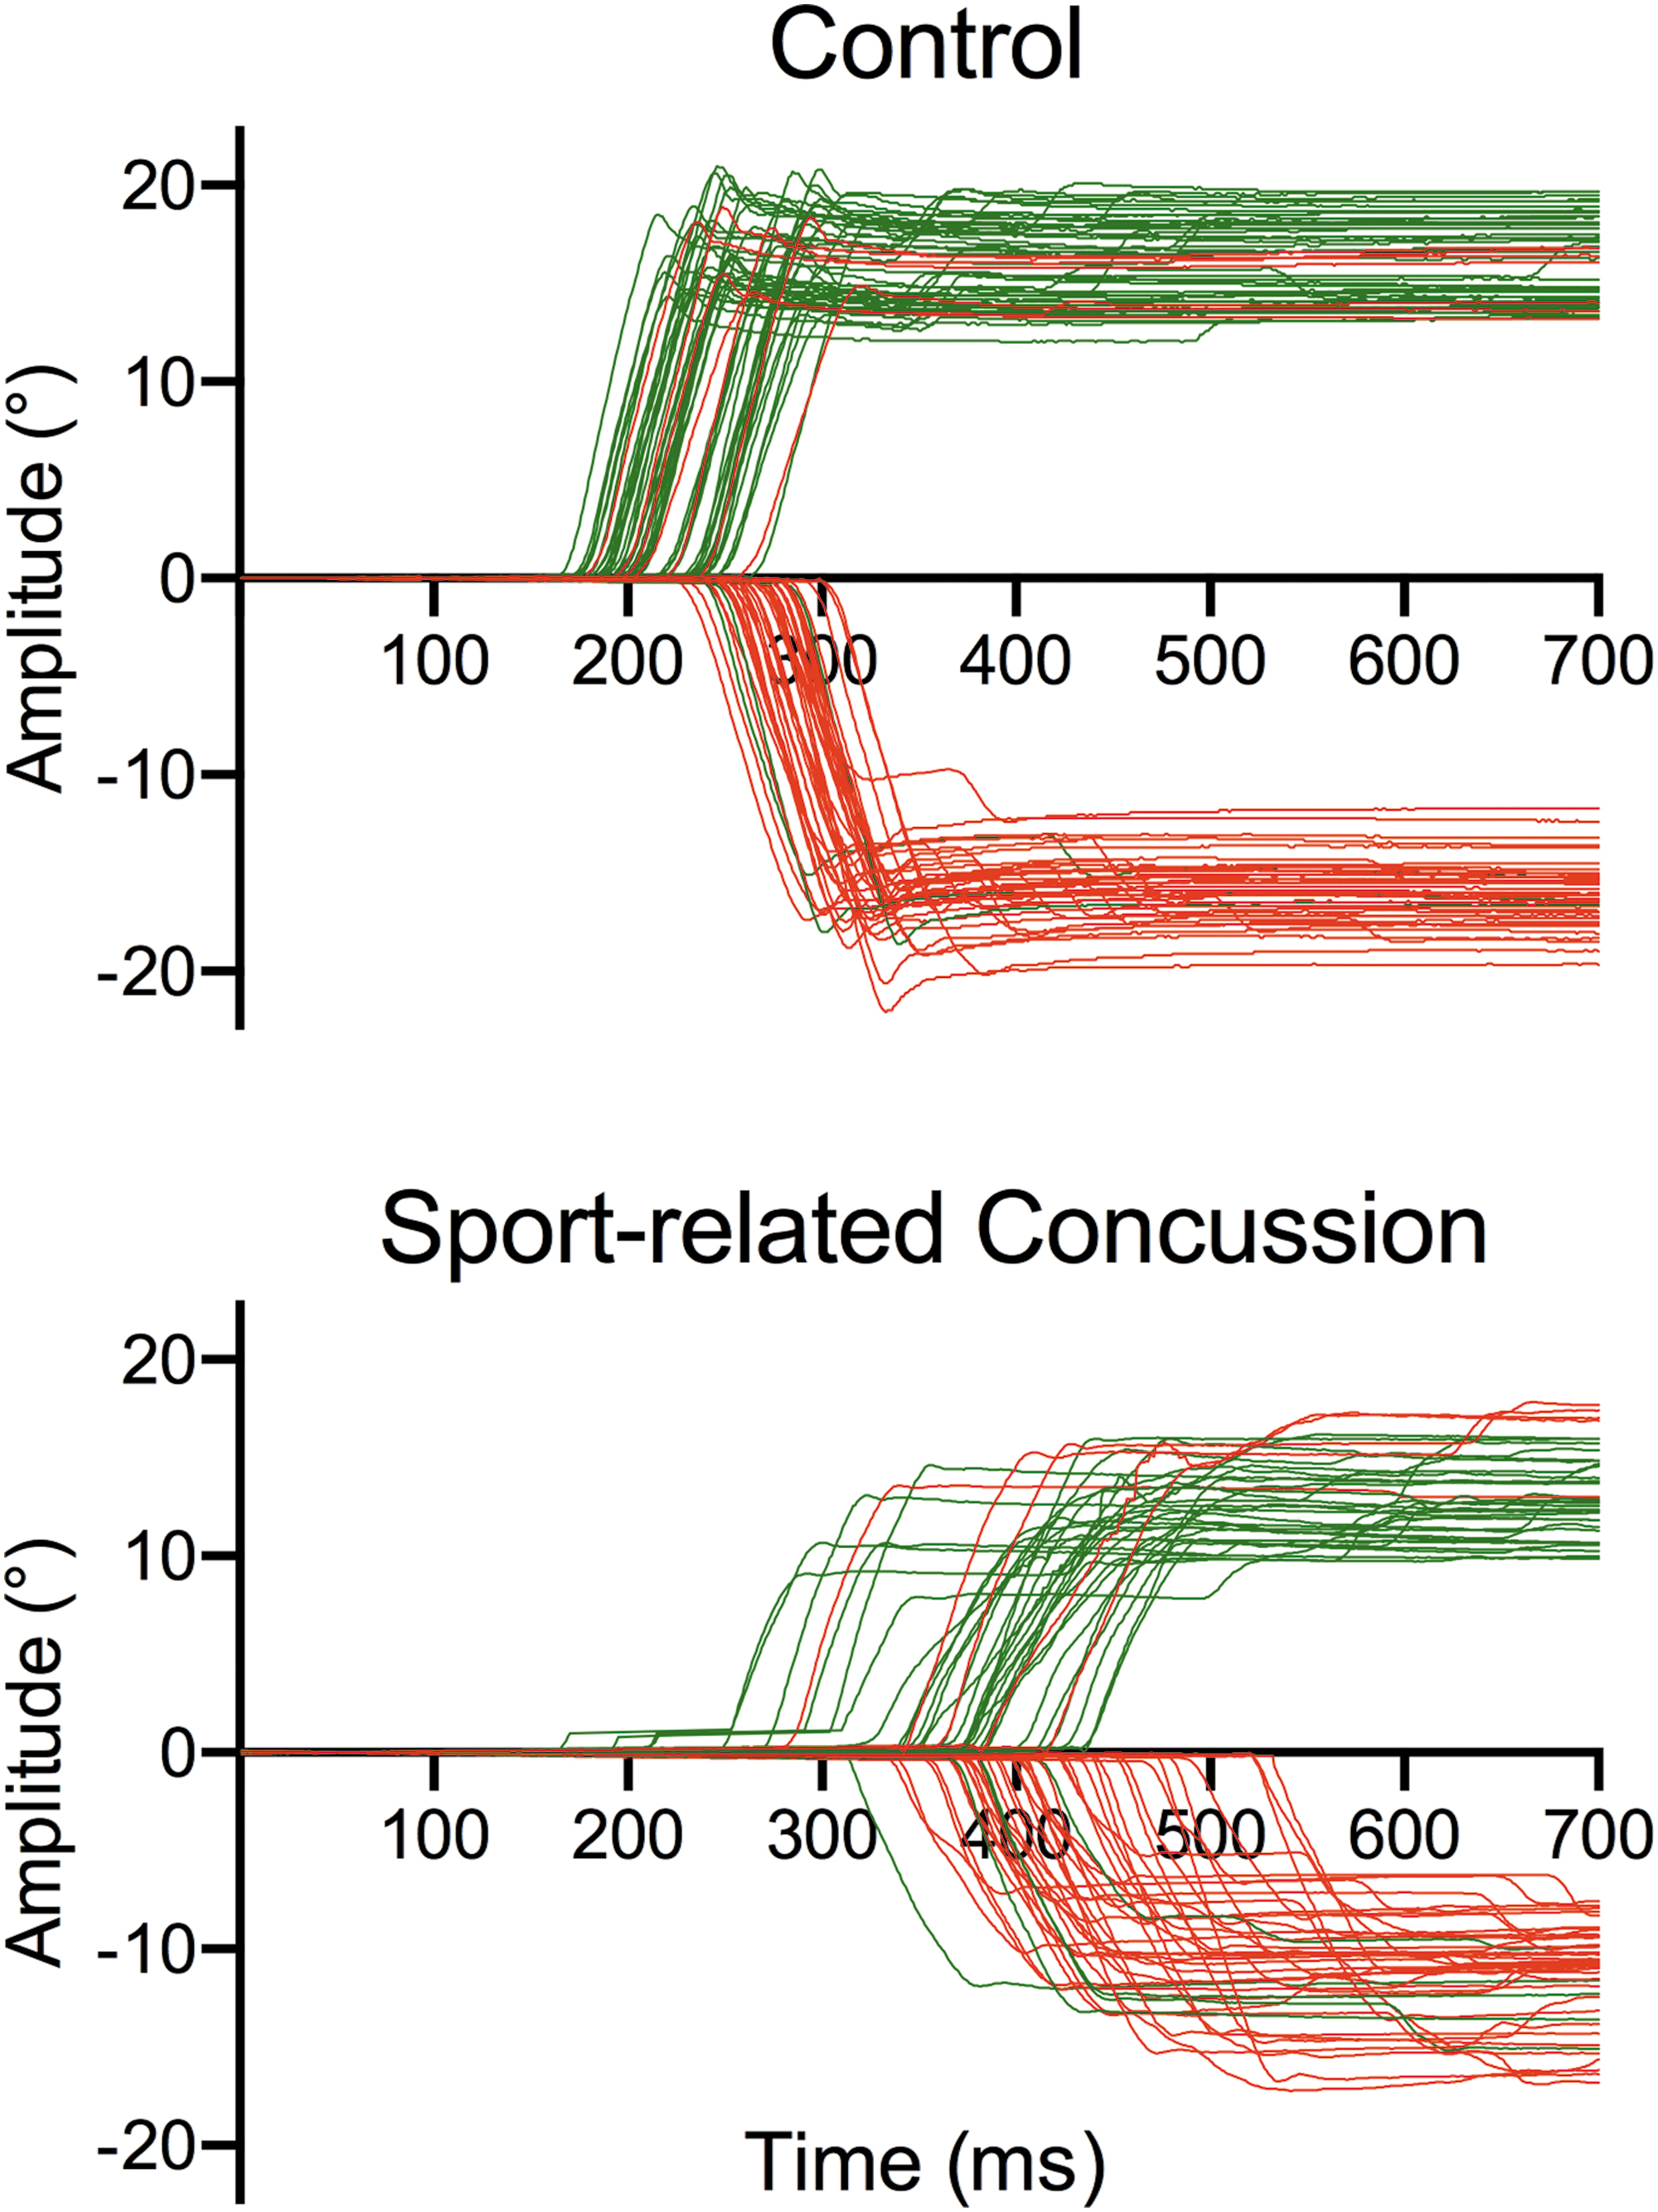
Position (horizontal movement direction: in degrees) by time pro- (green lines) and antisaccade (red lines) trajectories for an exemplar control and sport-related concussion participant at the initial assessment for the proximal (13.5 degree) and distal (16.5 degree) targets. Directional errors are depicted by negative and positive deflection pro- and antisaccade trajectories, respectively. Error trials are shown to demonstrate the frequency by which they occurred for each participant. As noted in the Methods, however, error trials were not included in the computation of saccade performance or pupillometry measures. Color image is available online.
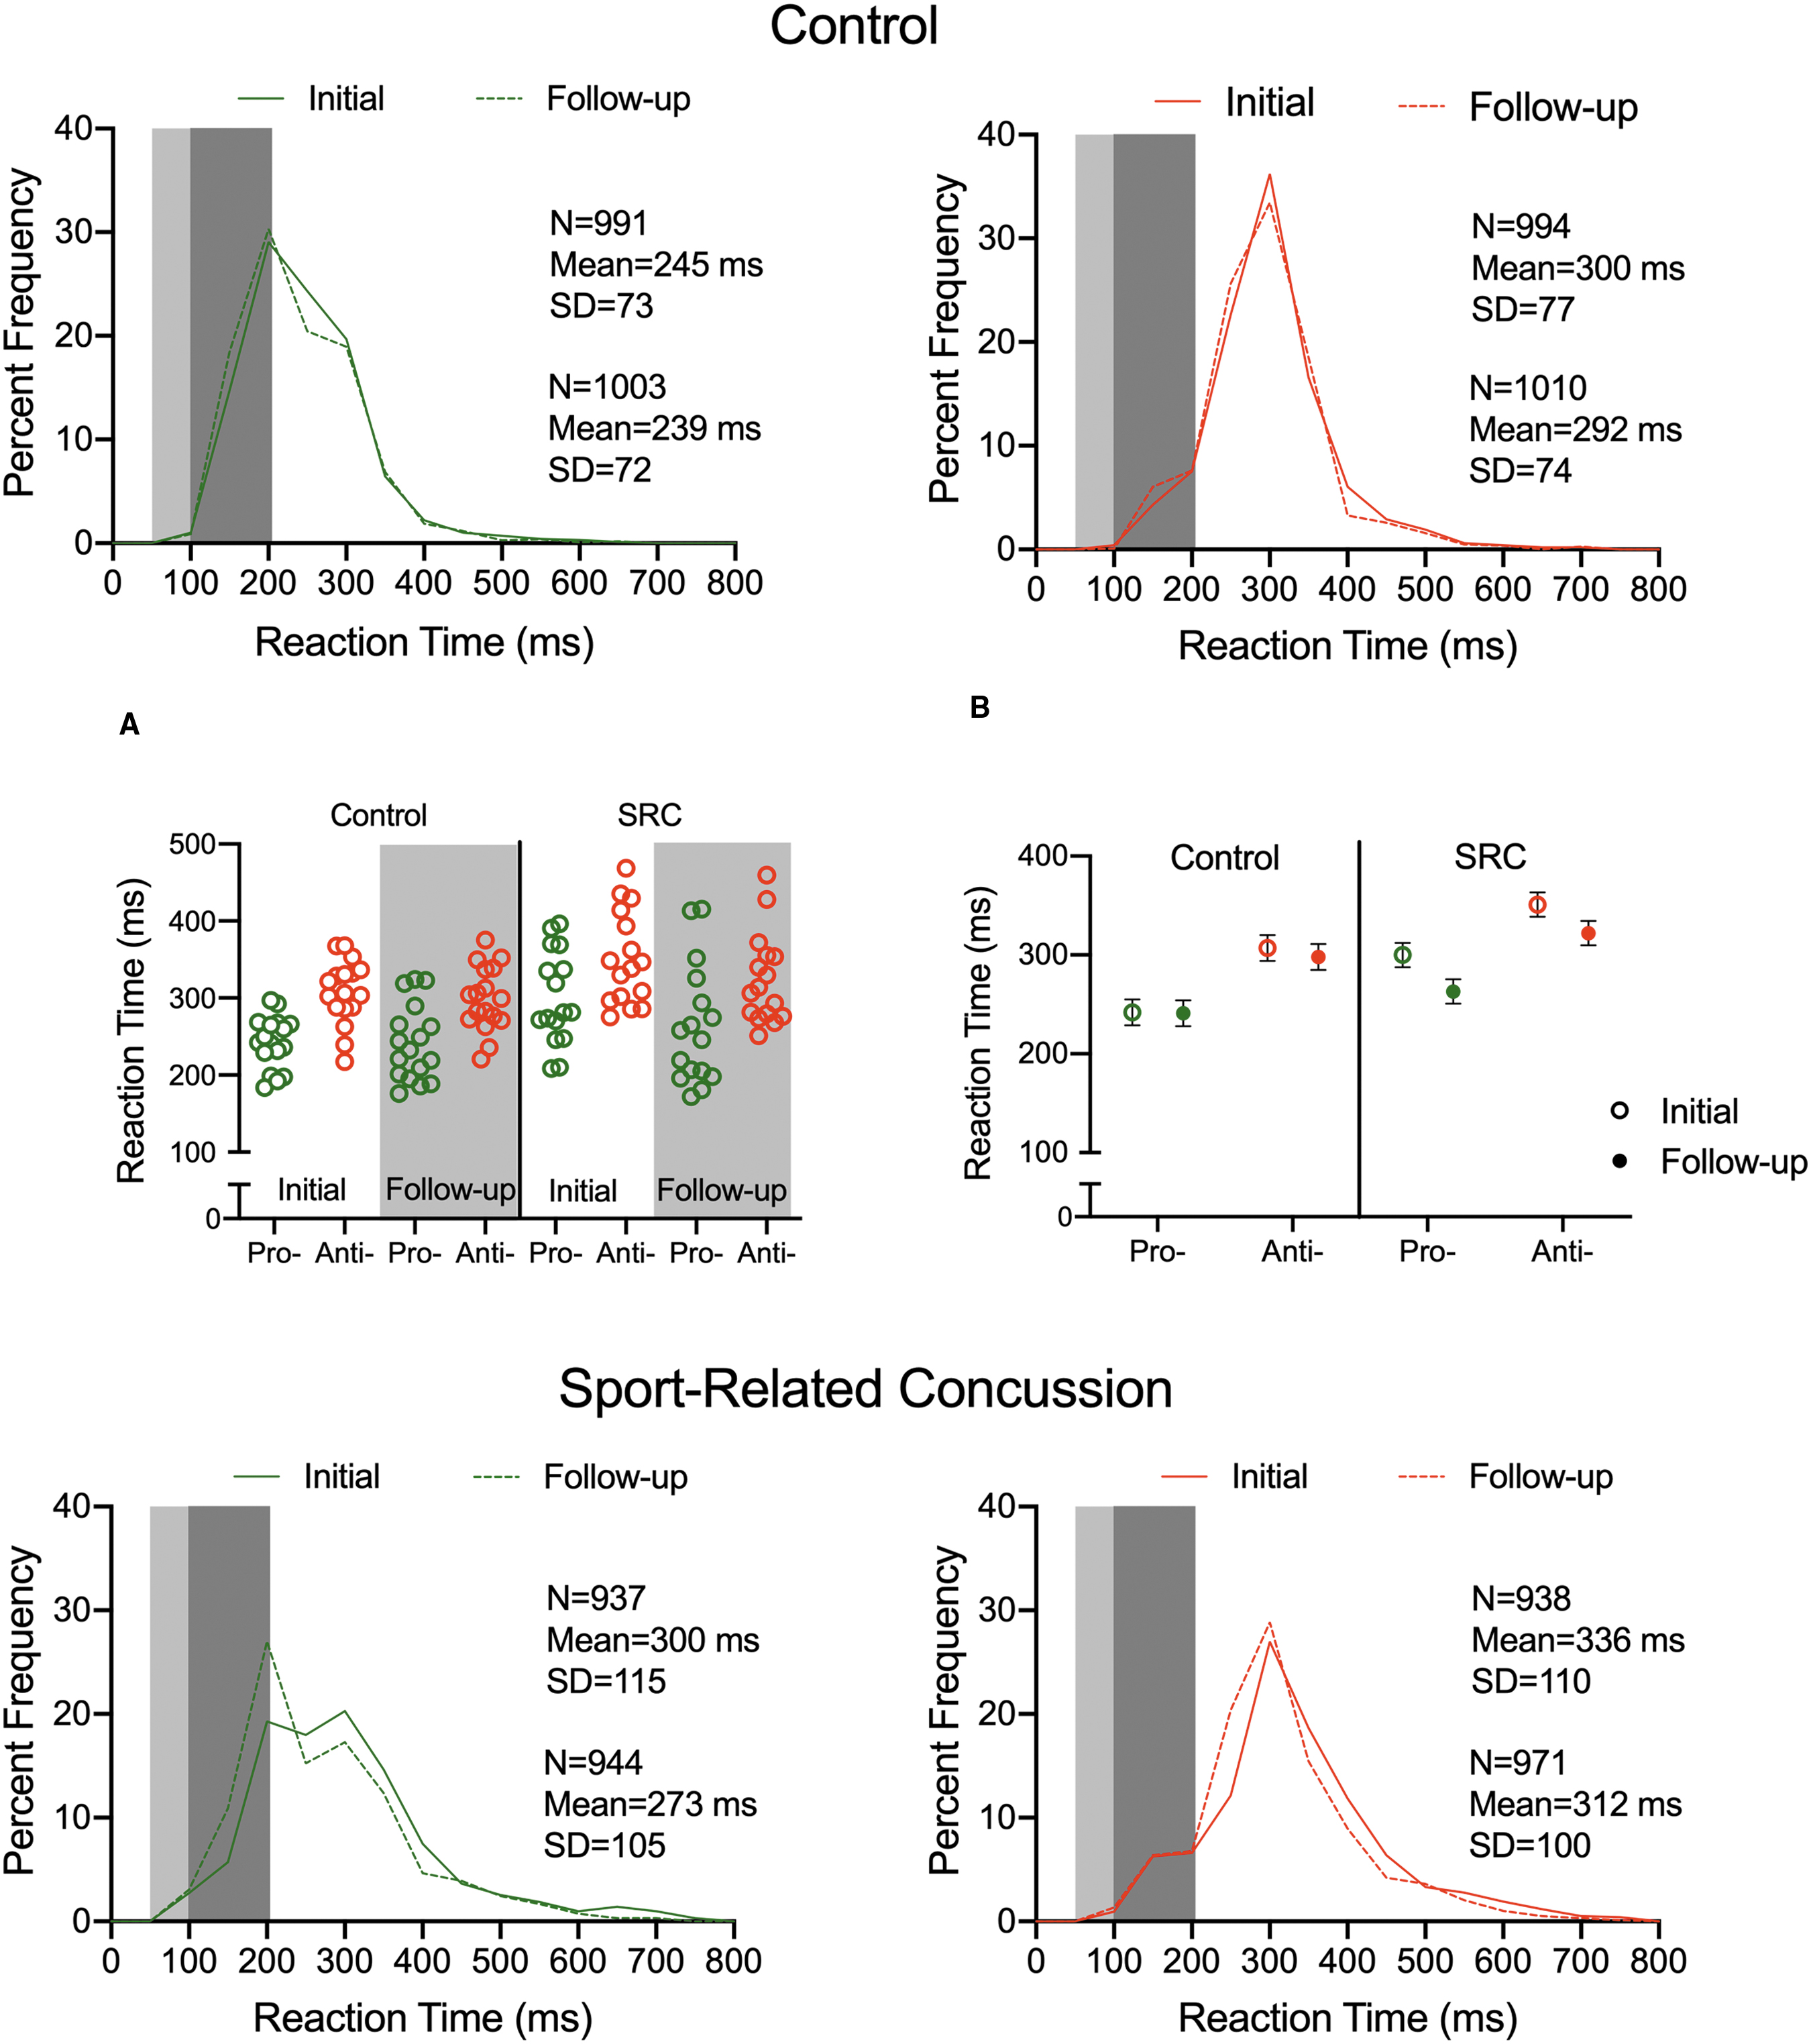
Control and sport-related concussion (SRC) group reaction time (RT) percent frequency histograms for pro (left panels; green line) and antisaccades (right panels; red line) at initial (solid line) and follow-up (dashed line) assessments. The light and dark gray rectangles in each histogram highlight anticipatory (< 100 ms) and short-latency (100–200 ms) responses, respectively. The text in each panel presents descriptive statistics for initial (top) and follow-up assessments (bottom). Inspection of control and SRC prosaccade histograms reveals bimodal distributions. This finding has been interpreted to reflect that planning times for gap paradigm prosaccades are mediated by distinct “loops” associated with fast (i.e., pre-potent) and slow (i.e., volition) planning mechanisms.
44,45
In turn, antisaccades exhibit a unimodal distribution because they are entirely under volitional control.
Group Means and between-Participant Standard Deviations (in Parentheses) for Sport-Related Concussion (SRC) and Control Group Initial and Follow-up Session Pro- and Antisaccade Performance and Pupillometry Measures
RT, reaction time (ms); CV of RT, coefficient of variation of RT; DE, directional errors (%); SD, saccade duration (ms); PV, peak velocity (degrees/sec); gain (saccade amplitude/veridical target amplitude), ABS, absolute pupil diameter (mm); TEPD. task-evoked pupil dilation (mm).
The CV of RT revealed main effects of group (F[1,31] = 4.62, p = 0.04, ηp 2 = 0.18), assessment (F[1,31] = 10.69, p = 0.003, ηp 2 = 0.25), and task (F[1,31] = 40.40, p < 0.001, ηp 2 = 0.56). Values were larger for the SRC (22, SD = 9) than the control group (18, SD = 7), were larger at the initial (22, SD = 8) than follow-up (19, SD = 7) assessment, and were larger for pro- (23, SD = 8) than antisaccades (17, SD = 8).
Directional errors
Main effects of group (F[1,31] = 16.19, p = 0.002,ηp 2 = 0.35, assessment (F[1,31] = 9.25, p = 0.005, ηp 2 = 0.32), and task (F[1,31] = 24.95, p < 0.001, ηp 2 = 0.45), indicated that directional errors were larger for the SRC than for the control group, were larger at the initial than at the follow-up assessment, and were larger for antisaccades than for prosaccades (Fig. 5a; see also Table 1).
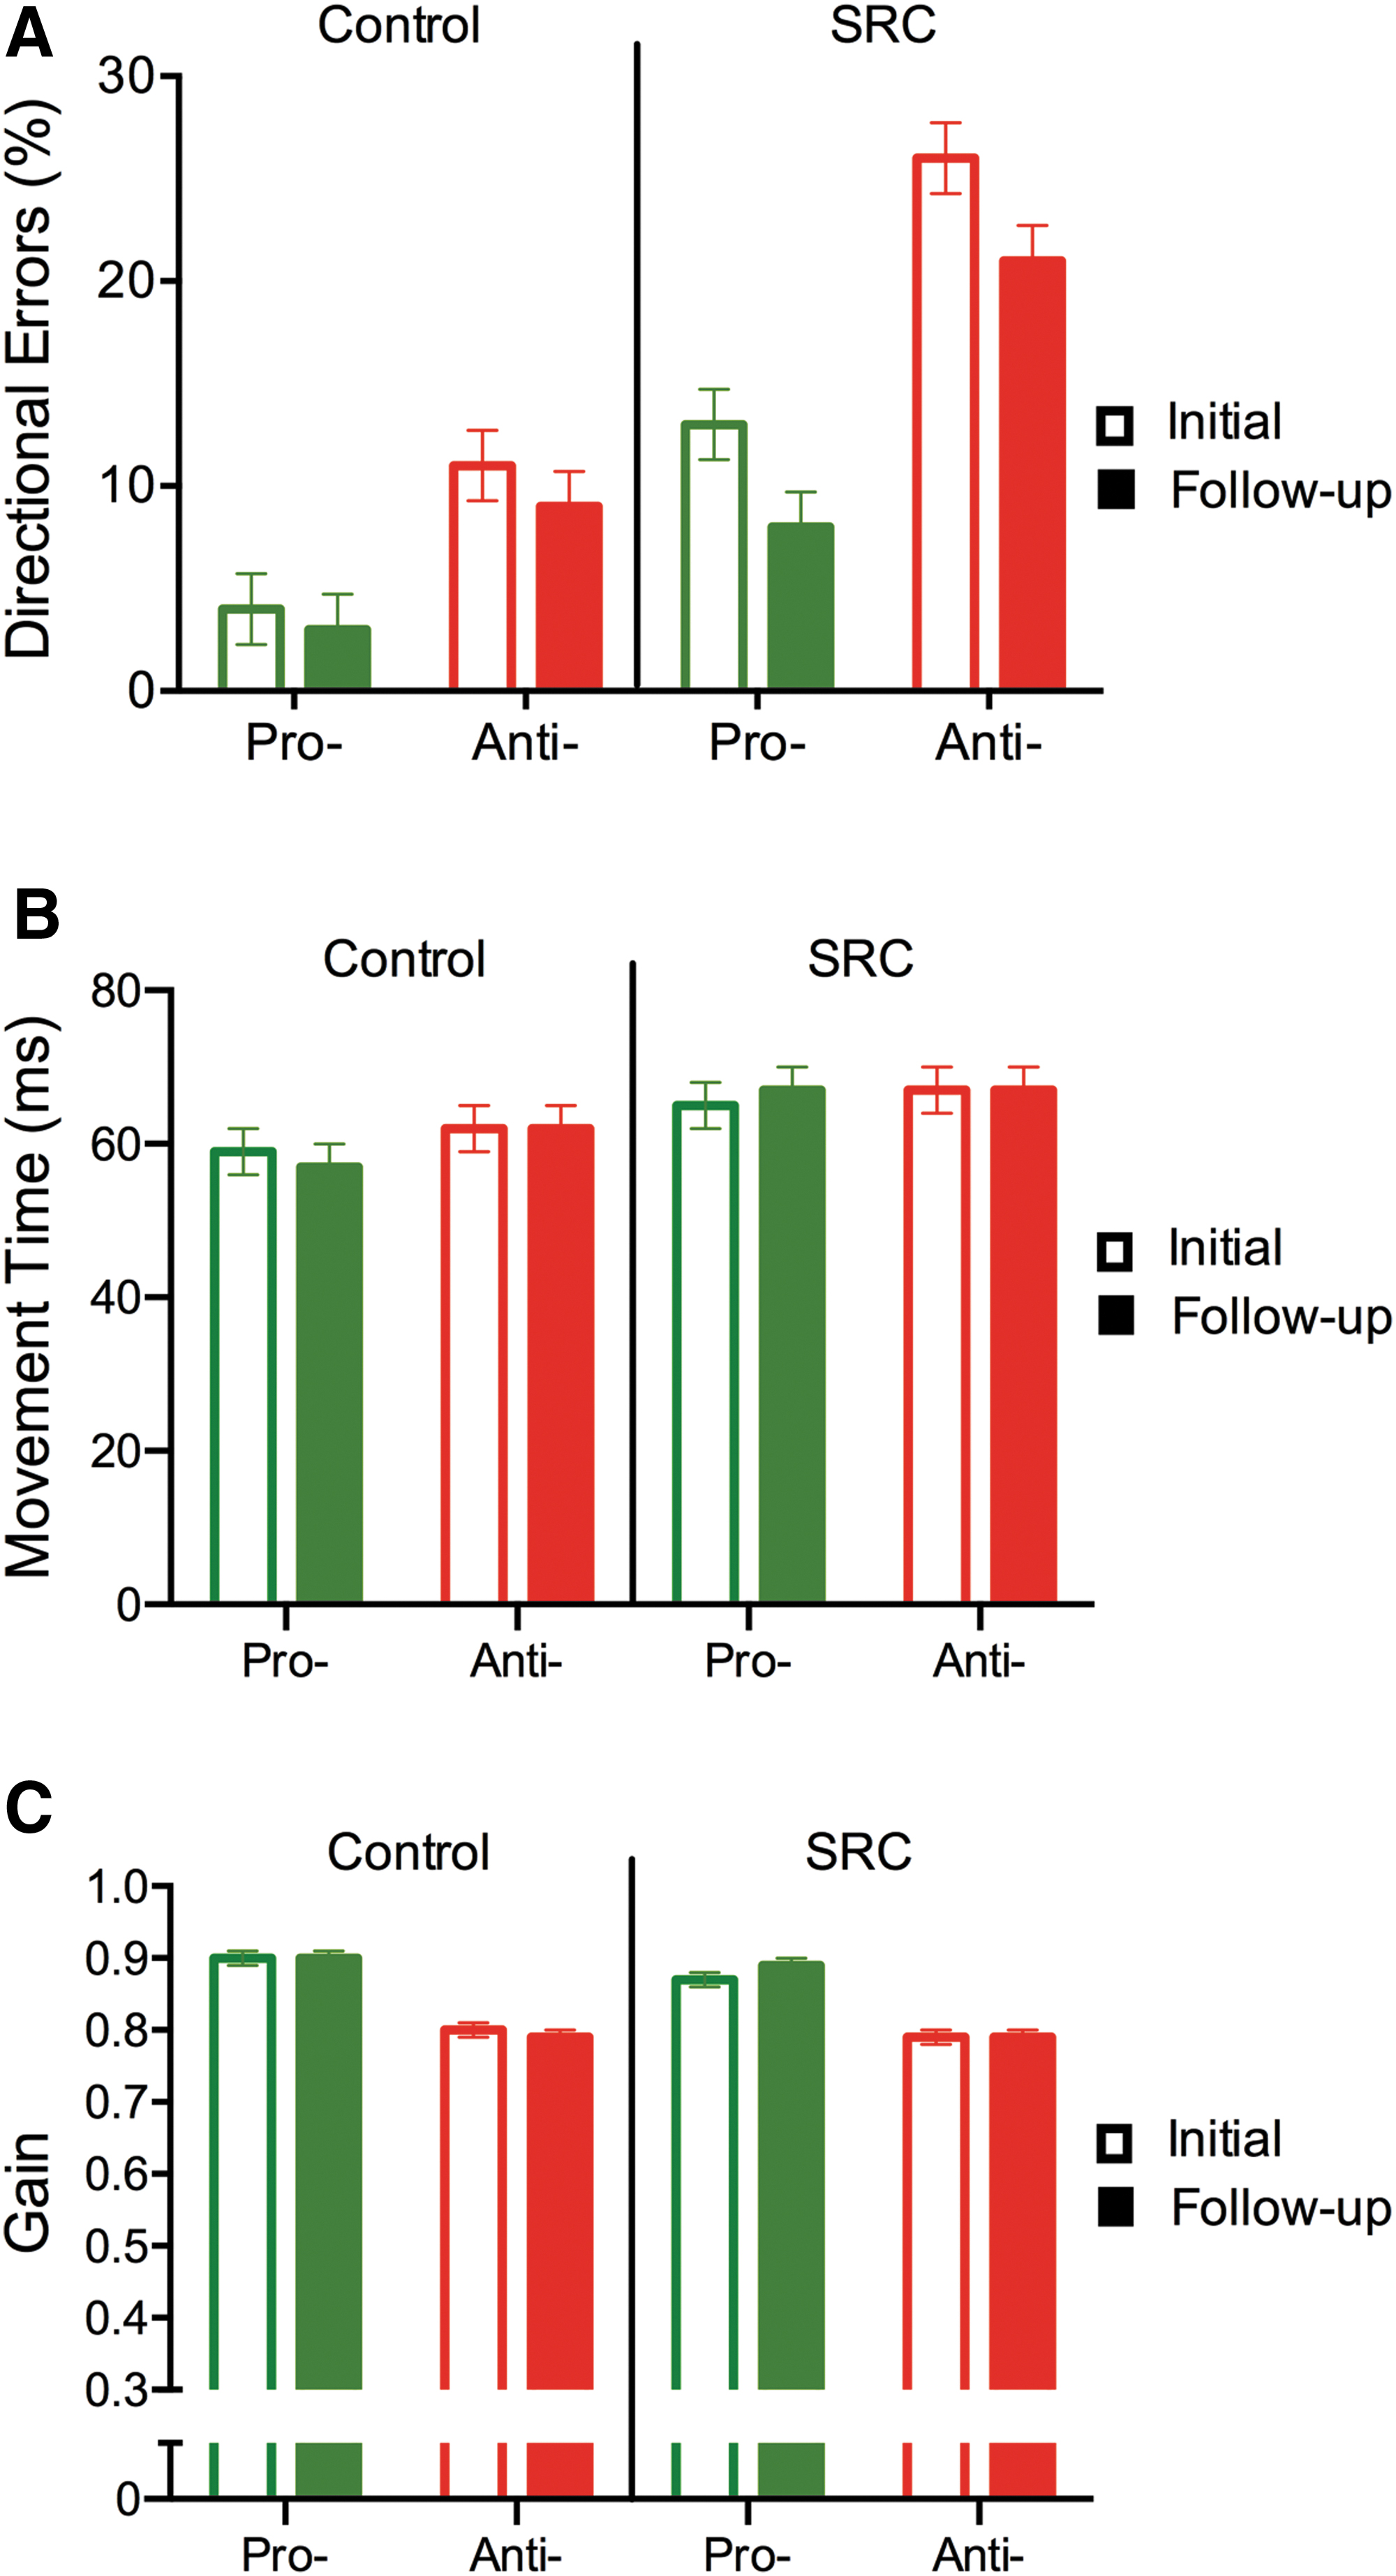
Control and sport-related concussion (SRC) group mean pro- and antisaccade directional errors
Saccade duration, peak velocity and gain
Results yielded main effects for task, (Fs[1,31] = 4.22 38.31 and 24.89, p = 0.048 and ps < 0.001, ηp 2 = 0.12, 0.55, and 0.44). Prosaccades produced shorter durations and larger peak velocities and gains than antisaccades (Fig. 5b and c; see also Table 1). Duration, peak velocity, and gain did not yield main effects or higher-order interactions involving group (all F[1,31] < 1.71, ps > 0.20, all ηp 2 < 0.06).
Pupillometry
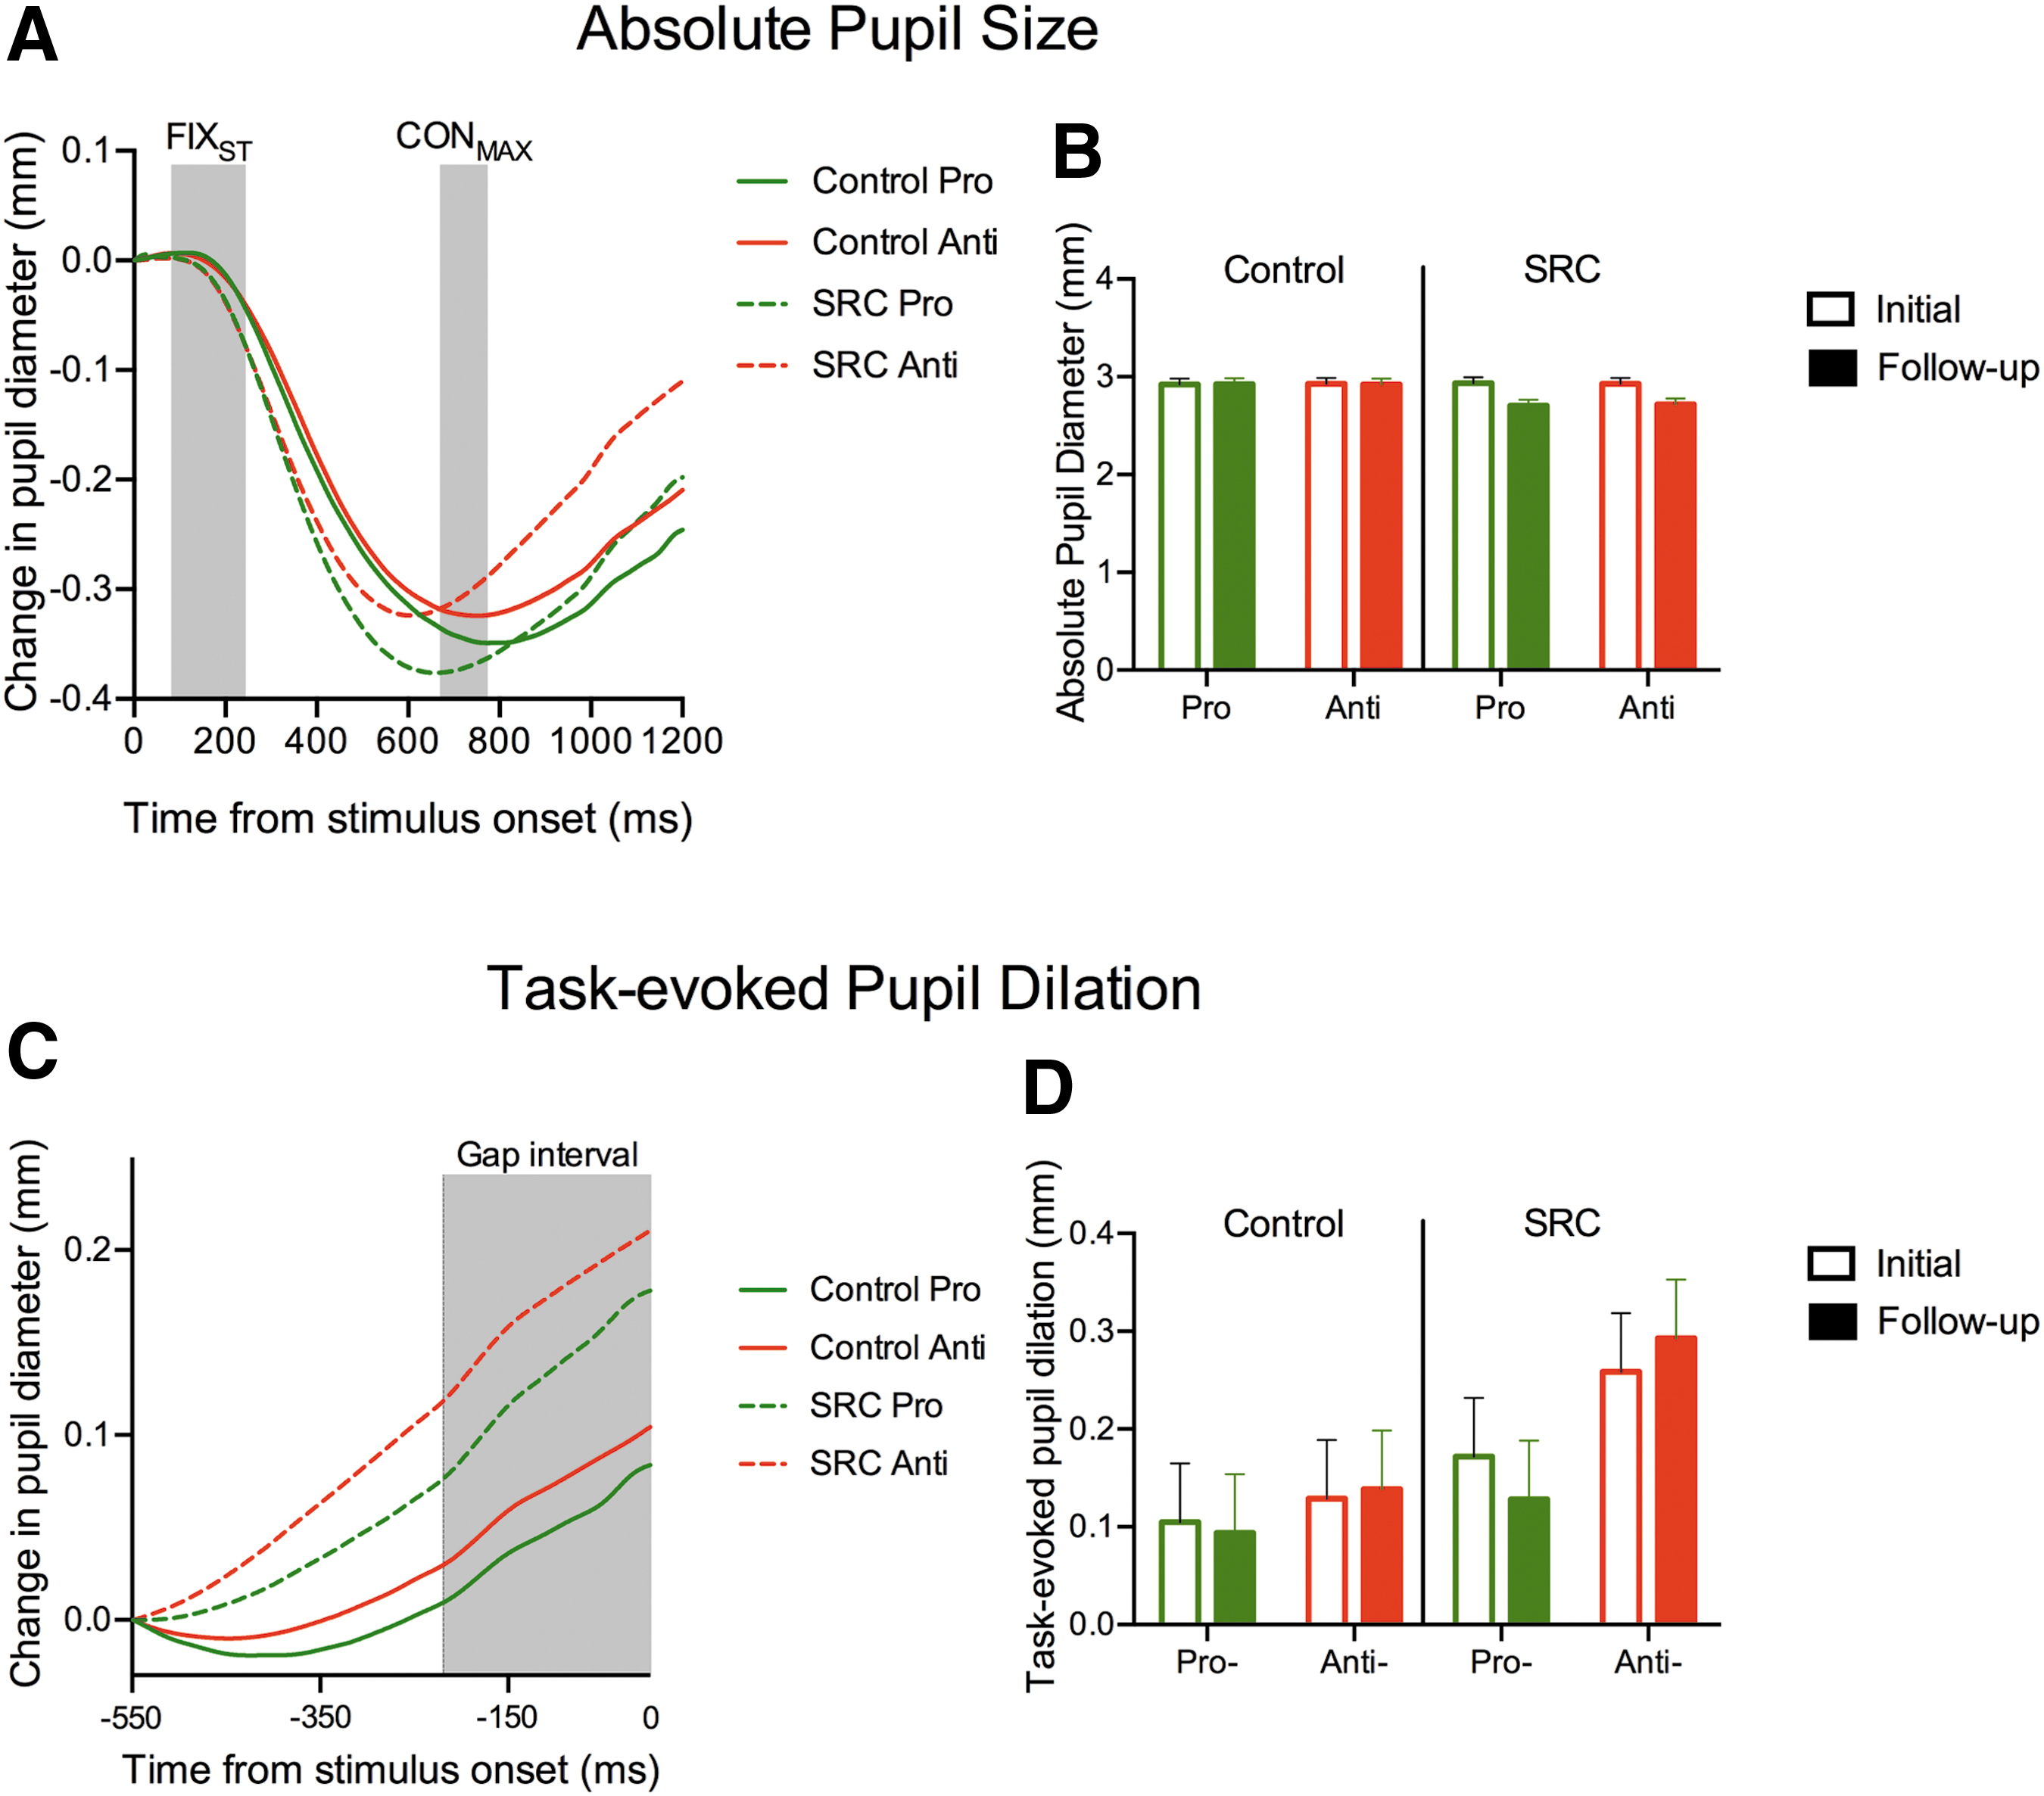
Figure 6a and c display time by pupil size traces for an exemplar control and SRC participant for the epochs from fixation onset to maximum constriction, and from maximum constriction to the end of the gap interval, respectively. The figure shows the well-documented constriction response to fixation onset (i.e., the pupillary light reflex) and the increase in pupil dilation associated with the executive demands of the antisaccade task. 21,33
Baseline pupil diameter
A main effect of assessment (F[1,31] = 5.62, p = 0.024, ηp 2 = 0.15), and a group by assessment interaction (F[1,31] = 5.53, p = 0.025, ηp 2 = 0.15, indicated that SRC and control groups did not reliably differ at initial or follow-up assessments (t[27.8 and 29.7] = 0.03 and 0.81, ps = 0.97 and 0.42) (Fig. 6b; Table 1). In turn, within-group contrasts indicated that SRC (t[15] = 0.22, p = 0.83) and control (t[16] = 0.07, p = 0.94) group values did not reliably vary from initial to follow-up assessments.
TEPD
Main effects for group (F[1,31] = 8.32, p = 0.007, ηp 2 = 0.21), and task (F[1,31] = 6.58, p = 0.015, ηp 2 = 0.17), indicated that TEPDs for the SRC group were larger than for the control group and were larger for antisaccades than for prosaccades (Fig. 6d). We did not observe any higher-order interactions involving group (all F[1,31] < 1.78, ps > 0.19, ηp 2 < 0.17).
Correlation between short-latency antisaccades RT and TEPD
Wang and colleagues showed that larger TEPD values were reliably related to “fast” antisaccade RTs. Accordingly, and in line with Wang and colleagues, we grouped “fast” and “slow” RTs (median-split) for antisaccades across initial and follow-up sessions and correlated with their respective TEPD values. 21 To provide a sufficient corpus of trials and improve statistical power, we did not perform separate analyses for control or SRC groups. Results showed that initial and follow-up assessment RTs categorized as fast were negatively correlated with TEPDs (r = -0.34 and -0.39, ps < 0.05), whereas RTs categorized as slow did not reliably relate to TEPDs (r = 0.14 and -.05, ps > 0.44).
Correlation between RT variability and directional errors
Karatekin and colleagues reported that a strong positive correlation between antisaccade RT variability and directional errors provides an index of task-based “fluctuations of attention”; that is, the correlation determines whether attentional dysfunction relates to antisaccade performance deficits. 34 In the present study, SRC group correlation coefficients for the aforementioned variables did not produce a reliable relationship at either assessment (all r[14] = 0.37 and -0.24, p = 0.15 and 0.37).
Discussion
We examined SCAT-5 symptom severity and saccade performance and pupillometry metrics to determine whether oculomotor changes following the initial and later stages of SRC recovery relates to increased task-based symptom burden and/or impaired executive control. In outlining our results, we first discuss SCAT-5 symptom severity scores. Subsequently, we describe the general differences between pro- and antisaccade performance and pupillometry measures, and then discuss how such metrics varied between the SRC and control groups at initial and follow-up assessments.
Concussion symptomology does not influence oculomotor performance or pupillometry metrics
Some work has asserted that longer RTs and more directional errors following an SRC evince an executive dysfunction. 16 –18 An alternative account is that the attentionally and cognitively challenging nature of antisaccades results in persons with an SRC deploying a strategy of cognitive disengagement to avoid a task-based increase in symptomology. 20 Here, we employed the SCAT-5 measure of symptom severity prior to and after initial and follow-up oculomotor assessments. As expected, symptom severity for the SRC group was greater than for the control group at both assessments, and symptom severity for the SRC group decreased at the follow-up assessment. More notably, symptom severity for the SRC group at initial and follow-up assessments did not vary from pre- to post-oculomotor time points. In fact, Figure 2b shows that the SRC group had a reduction – albeit not statistically reliable – in symptomology following each oculomotor assessment. Accordingly, the oculomotor assessment used here did not lead to a task-based increase in symptom burden.
Pro- and antisaccades exhibit distinct performance and pupillometry properties
Prosaccades produced shorter RTs and durations, fewer directional errors, and larger peak velocities and gains than antisaccades, a result consistent across SRC and control groups. The prosaccade findings reflect that responses entailing overlapping stimulus-response spatial relations are mediated via retinotopic motor maps in the SC, which operate with minimal top-down executive control. 19 In turn, the antisaccade RT and directional error findings reflect that the task's constituent elements (i.e., response suppression and vector inversion) are time consuming and executive demanding. 11 Further, the longer antisaccade durations, decreased peak velocities, and gains are in line with evidence that the task renders greater uncertainty in movement planning and results in motor output supported via visual information (i.e., relative) distinct from the direct (i.e., absolute) visual information mediating prosaccades. 10,35 Indeed, work has shown that antisaccade gains are smaller than their prosaccade counterparts because the former encode target location based on a summary statistical representation of the range of targets included in a stimulus set, a perceptual strategy that results in an increased undershooting bias.
In terms of pupillometry, a number of studies have demonstrated that pupil size is modulated by saccade preparation demands and reflects neural activity in the SC and frontal eye fields. 21,31 More notably, Wang and colleagues have shown that antisaccades elicit an increase in pupil dilation compared with prosaccades during the time prior to target onset (i.e., TEPD) and is a result interpreted to reflect a neural proxy for an increase in executive control. In the present work, SRC and control groups exhibited larger TEPDs for antisaccades than for prosaccades, and in line with Wang and colleagues, we found that antisaccade RTs categorized as “fast” were negatively correlated to TEPD; that is, results provide evidence that TEPD provides a measure of oculomotor planning preparedness. Accordingly, the present performance and pupillometry measures provide a framework to address the nature of oculomotor dysfunction in persons with an SRC.
Initial stage oculomotor performance and pupillometry: Evidence of early executive dysfunction
The SRC group had longer RTs and more directional errors than the control group, a result consistent across pro- and antisaccades. The prosaccade RT finding is in contrast to an earlier study by Webb and colleagues reporting a null between-group difference; however, results are in line with an earlier study demonstrating that persons in the acute stage of mTBI recovery (< 16 h) elicit increased RTs for pro- and anti-pointing (i.e., reach mirror-symmetrical to a target) responses. 36 Further, a distinction between the present work and that of Webb and colleagues relates to the fact that the former employed a blocked pro- and antisaccade design, whereas the current work randomly interleaved tasks on a trial-by-trial basis. 18 We used an interleaved design so that our pupillometry measures could be interpreted in line with Wang and colleagues. 21,22 Notably, however, an interleaved design introduces the additional executive component of task switching and it has been reported that RTs for a prosaccade preceded by an antisaccade (i.e., task-switch trial) are increased (i.e., 10–40 ms) compared with when a prosaccade is preceded by its same task type (i.e., task-repeat trial). In contrast, antisaccade task-switch and task-repeat trials exhibit comparable RTs. 37 –39 Behavioral and electroencephalographic evidence has attributed the unidirectional prosaccade switch cost to the response suppression demands of antisaccades rendering an executive-mediated task set that persists inertially and proactively delays the planning for a subsequent prosaccade. 40 What is more, Clough and colleagues reported that asymptomatic persons with a history of an SRC elicit longer prosaccade switch costs than their non-concussed controls. 41 The authors interpreted their results via Weiler and Heath's oculomotor task-set inertia hypothesis. 38 –40 Although the present work is unable to contrast RTs for prosaccade task-switch and task-repeat trials because an equal number of each trial type was not included in our interleaved paradigm, we propose that a parsimonious explanation for the longer SRC prosaccade RTs is an executive dysfunction in task switching. This notion is further underscored by the fact that the SRC group exhibited increased directional errors (i.e., >9%) compared with a design wherein pro- and antisaccades are performed in separate blocks. 16,17,38 Therefore, we propose that the increased cognitive demands (i.e., cognitive flexibility, working memory, and inhibitory control) of the interleaved design used here, in part, contributed to the increase in SRC group prosaccade RTs and directional errors.
At the initial assessment, the SRC group produced longer RTs and increased directional errors compared with the control group, which is a finding in accord with previous work. 16 –18 Moreover, at this time, absolute pupil diameter for the SRC and control groups did not reliably vary, whereas TEPDs were larger for the former group. The absolute pupil diameter findings indicate that groups had a comparable pupillary light reflex. 28 In turn, larger TEPDs during saccade preparation have been interpreted as a neural proxy for increased executive demands. 21,22,34 Therefore, the fact that TEPDs were larger for the SRC group in conjunction with the observation of Johnson and colleagues that the acute stage of SRC recovery results in hyperactivity across a range of frontal and posterior brain regions during antisaccades provides convergent evidence of executive-related oculomotor dysfunction during the early stage of SRC recovery. 16 Moreover, this conclusion is bolstered by the fact that oculomotor dysfunction was independent of a task-based change in symptomology (see section entitled Concussion symptomology does not influence oculomotor performance or pupillometry metrics).
Follow-up assessment of oculomotor performance and pupillometry: Evidence of persistent executive dysfunction
Pro- and antisaccade RTs for the SRC group did not differ from those of the control group. This finding is consistent with Webb and colleagues who showed that between 14 and 20 days following SRC diagnosis – and when athletes were medically cleared for return to play – antisaccade RTs for SRC and control groups were comparable. 18 The absence of a reliable between-group difference reported here should be tempered by the fact that: (1) SRC and control group RTs were not within an equivalence boundary, (2) Figure 4b shows that SRC group mean pro- and antisaccade RTs were longer than those of the control group, and (3) the SRC group exhibited more directional errors and larger TEPDs than the control group. Therefore, the RT findings coupled with directional errors and TEPD results underscore that subtle executive-related oculomotor planning deficits persist for >23 days (on average) following an SRC.
Although the SRC group exhibited oculomotor deficits compared with controls at the follow-up assessment, it is important to recognize that the former demonstrated a reduction in RTs and directional errors from the initial to the follow-up assessment. These findings fit with a significant literature reporting that neurocognitive dysfunction resolves significantly in the first 7–10 days following an SRC, and shows a gradual improvement thereafter. 42 Further, the fact that the SRC group continued to exhibit increased directional errors and larger TEPDs at the follow-up assessment demonstrates that executive functions have a more protracted rate of recovery than that reported for attention, memory, and general information processing. 43
Study limitations
The present findings are constrained by at least four methodological limitations. First, the SRC group included single- and multiple-concussed athletes, and given the sample size used here, it was not possible to determine whether the magnitude of executive dysfunction varied with previous concussion history. Future work should therefore examine whether concussion history differentially influences oculomotor performance and pupillometry metrics. This idea is illustrated by an event-related brain potential study demonstrating attenuation in the amplitude of an ERP waveform (i.e., P300) as a function of single and multiple SRCs. 44 Second, the evaluation of oculomotor performance, pupillometry, and SCAT-5 symptomology should be examined in a longitudinal design (i.e., acute, subacute, and early and late chronic stages) to determine whether subtle executive deficits are resolved, and hence determine whether the antisaccade task represents a reliable tool for continued SRC management. Third, initial and follow-up oculomotor assessments were completed at a range of times post-SRC, which is a factor attributed to patient scheduling at the Sport Medicine Concussion Care Program at the Fowler Kennedy Sport Medicine Clinic. Fourth, we wish to emphasize that we do not believe that any single antisaccade performance or pupillometry metric provides a valid criterion for SRC diagnosis, management, or recovery. Instead, we believe that performance and pupillometry metrics may provide a platform for assessing subtle executive dysfunction when used in conjunction with additional assessment tools (i.e., SCAT-5).
Conclusion
The oculomotor assessments used here did not influence SRC symptomology as determined by the SCAT-5 measure of total symptom severity. In terms of oculomotor performance, the initial assessment showed that persons with an SRC produced longer pro- and antisaccade RTs, increased directional errors, and larger TEPDs. At the follow-up assessment, SRC and control group RTs did not reliably differ; however, the former continued to exhibit increased directional errors and larger TEPDs. Taken as a whole, the present results indicate that SRC changes in oculomotor performance are independent of a task-based increase in symptom burden and reflect impaired executive-related oculomotor planning.
Footnotes
Acknowledgments
We thank the participants for their involvement in this project, and the Fowler-Kennedy Sport Medicine Clinic, London, Ontario, for assistance with participant recruitment.
Funding Information
This research was supported by the Natural Sciences and Engineering Research Council of Canada, and Academic Development Fund and Faculty Scholar Awards from the University of Western Ontario.
Author Disclosure Statement
No competing financial interests exist.