
Abstract
Although concussions can result in persistent neurological post-concussion symptoms, they are typically invisible on routine magnetic resonance imaging (MRI) scans. Our study aimed to investigate the use of ultra-high-field diffusion tensor imaging (UHF-DTI) in discerning severity-dependent microstructural changes in the mouse brain following a concussion. Twenty-three C57BL/6 mice were randomly allocated into three groups: the low concussive (LC, n = 9) injury group, the high concussive (HC, n = 6) injury group, and the sham control (SC, n = 7) group. Mice were perfused on day 2 post-injury, and the brains were scanned on a 16.4T MRI scanner with UHF-DTI and neurite orientation dispersion imaging (NODDI). Finite element analysis (FEA) was performed to determine the pattern and extent of the physical impact on the brain tissue. MRI findings were correlated with histopathological analysis in a subset of mice. In the LC group, increased fractional anisotropy (FA) and decreased orientation dispersion index (ODI) but limited neurite density index (NDI) changes were found in the gray matter, and minimal changes to white matter (WM) were observed. The HC group presented increased mean diffusivity (MD), decreased NDI, and decreased ODI in the WM and gray matter (GM); decreased FA was also found in a small area of the WM. WM changes were associated with WM degeneration and neuroinflammation. FEA showed varying region-dependent degrees of stress, in line with the different imaging findings. This study provides evidence that UHF-DTI combined with NODDI can detect concussions of variable intensities. This has significant implications for the diagnosis of concussion in humans.
Introduction
Concussion or mild traumatic brain injury (mTBI) is a global health issue, with the incidence of mTBI reported to hospitals having a population rate of approximately 100–300/100,000 per year and an estimated true population rate of 600/100,000 per year. 1 The concussion injury is a combined interplay of acceleration, deceleration, and rotational head and brain movements that induces shear strains in brain tissue; this strain leads to consequential damage and persistent sequelae that are associated with the common symptoms seen thereafter. 2 The shearing in the brain tissue results in diffuse axonal injury, which is non-uniform and hard to detect with conventional diagnostic imaging techniques. 3 The variable biomechanics of the head impact, the injury severity, and the non-specific symptoms present in concussions all complicate the accurate diagnosis of the condition. 4
Diffusion tensor imaging (DTI) is a magnetic resonance imaging (MRI) modality that uses magnetic field gradients to detect phase shifts in the magnetization of water molecules as they undergo diffusion in biological tissues. 5,6 Water diffusion is modeled in each voxel as three orthogonal (mutually perpendicular) eigenvectors and their corresponding positive eigenvalues; the major eigenvector with the largest eigenvalue indicates the principal diffusion direction, and the relative ratios of the three eigenvalues determine the “shape” of the diffusion. 7 Barriers, such as cell membranes and axonal myelin restrict water diffusion along a certain direction, and the diffusion tensor has an elliptical shape; in contrast, unrestricted diffusion results in a more spherical tensor. 7 The shape of the tensor is usually described by a DTI metric called fractional anisotropy (FA), which ranges from 0 to 1, with 0 being completely isotropic spherical diffusion and 1 being completely in one direction. 7
The magnitude of diffusion is described by mean diffusivity (MD), which is calculated by the mean of the three eigenvalues. 8 The major (largest) eigenvalue is also referred to as parallel diffusivity (Dp), and the mean of the second and third eigenvalues is called radial diffusivity (Dr). 9 DTI has been applied in concussed patients to detect white matter (WM) pathologies, although the results have been contradictory; 10 –16 both reduced FA coupled with increased MD 10 –13 and increased FA coupled with decreased MD 14 –16 have been reported in the WM following mTBI. A 2014 meta-analysis of 122 publications suggested that following a concussion changes in FA are time-dependent—FA increases during the acute phase then decreases in the subacute phases following the impact. 3 Two major factors may account for the disparity in the DTI results reported: 1) the heterogeneity of the impact, which varies in severity despite similar clinical symptoms, and 2) the non-specific nature of DTI means multiple contributing changes at any given time, which further motivates the use of neurite orientation dispersion imaging (NODDI) along the injury/repair time course.
Animal models, therefore, serve as a very reliable way to study concussion. Animal models allow precise control of injury severity, restrict the variability in the pathology, and allow for longitudinal monitoring and intervention. Namjoshi and colleagues developed the Closed-Head Impact Model of Engineered Rotational Acceleration (CHIMERA) model, which, unlike previous models of brain injury, 17 is more representative of human concussions because it includes a rotational component following the impact. 18 They showed persistent cognitive deficits 2–14 days post-injury, 18 which were associated with decreased FA in the brachium and hippocampal WM tracts, and decreased Dp in the optical tracts. 19
Although the consensus is that the amount of kinetic energy transferred to the brain at impact directly correlates with the severity of the injury, Namjoshi and colleagues 20 demonstrated that a single impact of higher energy caused less damage than repeated impacts of lower energy. Indeed, the cumulative effect of concussive head impacts is a major driver for the variability of concussion thresholds. 21 Therefore, it is imperative to develop imaging methods that can discern concussions of variable impacts and allow for continued monitoring over the injury time course.
NODDI is a more recently developed advanced diffusion imaging technique that aims to provide more specificity to water diffusion signal changes, as compared with DTI. 22 Instead of modeling the water diffusion signal from one voxel in terms of the shape of the diffusion tensor (from elliptical to spherical) using three orthogonal eigenvectors, NODDI models the water diffusion signal as the sum of diffusivity from three non-exchanging compartments, each weighted by its volume fraction—the intra-neurite (also called intra-cellular in diffusion MRI publications 22 ), extra-neurite (also called extra-cellular), and cerebrospinal fluid (CSF) compartments. 23 NODDI produces two important metrics: the neurite density index (NDI) and the orientation dispersion index (ODI), which describe neurite density and local structural organization of neurites, respectively. 22,24 NODDI has been applied to WM imaging in concussed athletes 6 months post-injury and found increased NDI and decreased ODI when compared with non-concussed athletes. 25 Decreased NDI with no changes in ODI in the WM has also been shown 1 month post-injury. 26
The histopathological validation of NODDI using ultra-high-field ex vivo imaging has demonstrated the capacity of ODI and NDI in differentiating different layers of the mouse neocortex. 27 Ex vivo NODDI imaging of a cuprizone model of demyelination showed decreased NDI without changes in ODI, demonstrating demyelination with no effect on the gross structure or large fiber orientation. 27 Ex vivo NODDI of pharmacologically induced microglial depletion showed a positive correlation between microglial density and ODI. 28 In an in vivo tauopathy model, the loss of pyramidal cells and sprawling cortical dendrites were associated with decreased ODI, and atrophy plus increased filamentous tau burden led to increased NDI. 29 DTI, by comparison, detected a non-specific increase in MD. 29 In the WM of the tau model, increased ODI and decreased NDI were detected, suggesting disorganization of WM due to increased tau burden. 29
Finite element analysis (FEA) is a valuable tool for studying the mechanical response of the brain to a physical impact during the injury-causing process, which otherwise is very challenging to evaluate experimentally. 30 FEA has been employed in the reconstruction of human TBI injuries 31,32 and the delineation of injury severity in a number of pre-clinical TBI models. 33 FEA in this work was applied to characterize the pattern of the mechanical insult imposed by the impact and, at the same time, estimate the extent of brain injury as a means to guide the pathological correlation with the neuroimaging findings.
In this study, we investigated the capabilities of ultra-high-field DTI and NODDI MRI to discern the effects of a single concussion impact, at two different thresholds, on the brain. We hypothesized that the contradictory findings often found in human concussion DTI studies might be related to contributions from varying levels of injury severities. A more advanced tissue diffusion model used by techniques such as NODDI may provide better specificity and may provide an easier interpretation of the underlying mechanisms of TBI. Histopathological analysis was employed to confirm the underlying mechanism and correlates of DTI and NODDI metric changes.
Methods
Study design
All experiments were approved by the Institutional Animal Ethics Committee at the University of Queensland (Animal Ethics Committee approval number QBI/260/17). Twenty-three male C57/Bl6 mice aged 7–7.5 months were included in this study. Animals were randomly assigned to either the sham control (SC, n = 7) or concussion groups (n = 15). Animals in the concussion groups were further classified into low concussion (LC, n = 9) and high concussion (HC, n = 6) sub-groups based on the loss of righting reflex (LRR) time and impact velocity. Specifically, the LC group was defined as animals with LRR time <600 sec (LC LRR [mean ± standard deviation]: 308.4 ± 125.5 sec) and impact piston velocity <5.1 m/sec (LC impact velocity [mean ± standard deviation]: 4.88 ± 0.17 m/sec), and animals with longer LRR duration and higher impact velocity were classified into the HC group (HC LRR [mean ± standard deviation]: 812.3 ± 118.6 sec; HC impact velocity [mean ± standard deviation]: 5.36 ± 0.11 m/sec).
Impactor device
The device used in this experiment was designed based on the same concept of the CHIMERA device with minor variations. 18 The impactor was fabricated as a brass piston ending with a 3-mm impactor tip covered with a 2-mm layer of soft neoprene rubber; the total weight of the moving piston was 206.627 g, and the length was 30 cm. The piston is driven by compressed air on one end and vacuum on the other. The piston's motion was stopped by a hard physical stop, and a solenoid valve was activated to swap the direction of vacuum and compressed air pressure, allowing the piston to quickly retract out of the way before the mouse head drops down. An air pressure regulator and air pressure gauge allowed for maintenance of reproducible air pressure and two laser sensors calculated the terminal piston velocity. The injury device, the important component for positioning the animal's head and causing the injury, and the captured high-speed camera footage are shown in Supplementary Figure S1.
Concussion procedure
The animals were housed in the animal holding facility with a 12-h light-dark cycle, and food and water available ad libitum. Animals were initially anesthetized with 3% isoflurane in a 60% air, 40% O2 gas mixture at 2 L/min for 2 min. Mice were then transferred to the impactor device and supported on the body plate. The animal support structure included a reclining body plate to support the mouse's body and a head plate to support the head. The head plate had a hole to allow a brass piston to deliver the impact from below; two perpendicular lines were used as crosshairs to aim and position the head. The body plate was reclined to allow the frontal and parietal bones on the mouse's head to be positioned flat against the head plate. The mouse body was secured in the supine position by a non-slip silicone mattress and two Velcro straps across the chest and abdomen. The tail was secured to the body plate with masking tape to prevent slipping. Anesthesia was maintained at 2% isoflurane in the same gas mixture via a nose cone; total time under anesthesia was 10–12 min.
Once the animal was secured on the platform, anesthesia was discontinued, and the trigger button was pressed immediately to induce a concussive impact. Terminal piston velocity used ranged from 4.7 to 5.7 m/sec. After the impact, the animal was removed from the animal supporting platform and placed on a heated bed in a supine position and monitored for recovery. LRR time was the time (seconds) from the moment of impact to the first sign of the animal righting itself to a prone position. SC animals underwent all procedures except the impact.
Finite element analysis
A freshly culled and unfixed mouse cadaver was used to record mouse head kinetics during impact. The cadaver was positioned and restrained as per the in vivo experimental conditions. The mouse head motion during impact was recorded using a high-speed camera at 525 frames per second. The footage was incorporated into a finite element model (FEM) to characterize the spatial extent of the impact on the brain tissue and to qualitatively compare deformations between high- and low-impact conditions. Two impact thresholds were recorded: low at 4.8 m/sec and high at 5.2 m/sec terminal piston velocity.
We captured the geometry of the mouse cranium using a head computed tomography (CT) scan—Inveon PET-CT scanner (Siemens, Germany), field of view (FOV) = 42.5 × 42.5 × 32.7 mm, 51 μm isometric resolution. Brain structural imaging was performed using a 16.4 T scanner (Bruker, Germany) with a T2-weighted fast spin echo sequence at 100 μm isotropic resolution (see details in the section below, “Post-injury sample preparation, MRI imaging, and data analysis”). Cranial CT and brain T2-weighted MRI images were registered together manually. The three dimensional (3D) surfaces of the cranium and the brain were reconstructed using the Mimics Materialise software version 21 (Materialise, Leuven, Belgium) using a combination of automatic and manual segmentation. 34 Due to the resolution constraints of the CT and T2-weighted MRI modalities, the cranium and the brain were modeled as solid tissues. The 3D surfaces of both the cranium and the brain were imported into the 3-Matic software (Materialise) and grouped into an assembly of 3D surfaces. We converted all the assembly surfaces into volumetric mesh files of 63,262 quadratic tetrahedral elements (type C3D10M) and imported them into the Abaqus CAE Simulia software, version 2018 (Systémes, Vélicy-Villacoublay, France) for the assignment of material properties, boundary, and loading conditions. To simulate the head impact as per the experimental concussion procedure, we designed an impactor in Abaqus CAE, using dimensions and material properties identical to the actual impactor piston.
The cranium was modeled as linear elastic and assigned a density value of 2.09*10^-3 g/mm^3, 35 isotropic and homogeneous Young's modulus (E) of 17 GPa and Poisson's ratio (v) of 0.3. 34 A hyperelastic material with density 1.04*10^-3 g/mm^3 was assigned to the brain. Here, the brain was modeled as a hyperelastic material, mainly because the brain is close to a rubber-like material whose stress is not proportional to its strain. In such a case, a hyperelastic material definition rather than a linear elastic material definition should be used in FEA to accurately simulate the response of the brain. The hyperelastic material has been commonly used in reports in the literature. 36 –38 For the impactor, both brass and neoprene were modeled as elastic materials, where brass had a density of 8.73*10^-3 g/mm^3, E = 125 GPa, and v = 0.34 and neoprene had a density 1.3*10^-3 g/mm^3, E = 2 MPa, and v = 0.499. The total mass of the simulated impactor was kept the same as in the concussion procedure.
In both the initial and loading steps, we constrained the posterior part of the cranium using spring elements to simulate the neck. The spring set was assigned stiffness properties from a rat spine as per Cunningham and associates. 39 In the dynamic loading step, we applied a velocity of 5.2 m/sec to the impactor, which then hit the inferior surface of the head, when the latter was in the supine position. Upon impact, the cranium was pushed by the neoprene of the impactor and swung upward. The simulation stopped when the cranium swung to the highest point, and the whole process was divided into 20 frames. The first 2 frames contained the translation of the impactor, and the impact started from frame 3. There was a large variation of the stress in the first 10 frames when the head was accelerated by the impactor. The stress values stabilized and became smaller in the last 10 frames; thus, these frames were not included in the figures used to assess stress patterns. Similar settings were applied to the low-impact model except that a velocity of 4.8 m/sec was used.
To capture the variation in stress magnitudes between our FEMs, we conducted a series of surface-element-level comparisons as per Panagiotopoulou and co-workers 34 and Abraha and colleagues. 40 We performed this analysis by calculating von Mises stress values from all surface elements of the brain from Abaqus CAE, and using custom-written Matlab scripts (Mathworks, Natick, MA, USA) we calculated the elemental-level difference using threshold values of 0.2 − 0.3 MPa. Threshold values of 0.2 − 0.3 MPa were selected because they allowed us to capture both the highest and lowest stress differences between and within the FEMs. We projected these differences in the 3D model of the mouse brain.
Post-injury sample preparation, MRI imaging, and data analysis
Tissue collection
Brain samples were collected on day 2 post-injury. Mice were sacrificed by transcardial perfusion-fixation with 0.1 M phosphate-buffered saline (PBS) pre-wash and 4% formaldehyde in PBS as a fixative. The brains were extracted and post-fixed in 4% formaldehyde for 16 h at 4°C. Post-fixation, the brains were rinsed with PBS and incubated in 0.2% (v/v) Magnevist (Bayer, Germany) in PBS solution for 2–4 days for ex vivo imaging. After ex vivo imaging, the brains were rinsed with PBS and stored in 0.05% sodium azide in PBS until further processing.
Ex vivo imaging
Brain samples were immersed in perfluoropolyether (Fomblin®, Solvay, Belgium). Ex vivo imaging was conducted on a 16.4 T scanner (Bruker, Germany) with a 2.5-cm volume coil, controlled by a console using Paravision 6.0.1 software (Bruker Biospin, Germany). Diffusion imaging was performed using a spin echo sequence with the following parameters: repetition time [TR]/echo time [TE] = 3000/22.52 msec, matrix size = 100 × 120 × 55, resolution = 0.1 × 0.1 × 0.3 mm, 3 b-value shells with b = 1000, 3000, and 5000 sec/mm2 (maximum achievable b-value = 12,500 sec/mm2) and 12 diffusion-weighted directions for each shell, diffusion gradient duration = 2.5 msec, diffusion gradient separation = 15 msec, 2 B0 images, 1 average. The overall image acquisition time was 2 h and 40 min.
MRI data processing and analysis
All MRI data were converted to DICOM in Paravision 6.0.1 then converted to NIFTI data format using the MRIcron dcm2nii tool (
Multi b-value shell data were fitted using the NODDI MATLAB Toolbox (
The sum of diffusion signal in each voxel A is the sum of diffusivity of different compartments weighted by the corresponding compartment volume fraction as follows:
22
where Aic and vic are normalized signal and volume fraction of the intra-neurite compartment (restricted anisotropic diffusion); Aec and (1 – vic ) are the normalized signal and volume fraction of the extra-neurite compartment (Gaussian anisotropic diffusion); viso and Aiso are normalized signal and volume fraction of the CSF compartment (unhindered isotropic diffusion); vir and Air are normalized signal and volume fraction of the stationary water compartment (“dot” compartment with restricted isotropic diffusion).
Individual b0 images were then linearly registered to the Australian Mouse Brain Mapping Consortium (AMBMC,
The individual b0 image non-linear registration to the AMBMC structural template also produced the Jacobian determinant. Affine-transformation-included Jacobian determinant (obtained using fnirtfileutils command with the –withaff option) for each voxel is a measure that indicates the relative volume change required to warp the template voxel to the individual voxel. Voxel-wise statistics performed on Jacobian determinants allowed for assessment of the local structure absolute (as opposed to normalized by total brain volume) volume difference between groups. This type of structural analysis is defined as tensor-based morphometry (TBM). 44
Two-sample t tests on registered DTI and NODDI metric images and the affine-transformation-included Jacobian determinant comparing each concussion group with the sham group were performed using permutation inference for the general linear model
45
as implemented in FSL's randomize package (
Histopathology
Tissue sectioning
Brain samples were cryoprotected by incubation with 30% sucrose in PBS until sunk. The cryoprotected brains were flash-frozen on dry ice and sectioned into 40-μm sections using a Leica SM2000 R Sliding Microtome (Leica Biosystems). Brain sections were preserved in 30% sucrose and 30% ethylene glycol in 0.1 M PBS cryoprotectant at −20°C until use.
De Olmos silver stain
Brain sections were removed from cryoprotectant, washed with six exchanges of purified water, and post-fixed for 4 days with 4% formaldehyde in water. The post-fixed sections were silver-stained for assessment of neuronal and axonal degeneration using modified de Olmos stain specified by Tenkova and Goldberg. 49 The silver-staining procedure was modified to work with cell-culture well plates by transferring brain sections through successive solutions in wells. Mounted slides were imaged under a brightfield microscope (Zeiss Axio Imagers) at 40 × magnification using ZEISS ZEN software. Further processing and analysis were performed using FIJI software (ImageJ version 2.0.0-rc-59/1.51k).
Immunofluorescent staining
Brain sections were removed from the cryoprotectant, washed with three exchanges of PBS, and incubated in 0.05 M glycine, 0.01% sodium azide in 0.1 M PBS under a light and ultraviolet lightbox for 48 h. After photobleaching, the sections were washed with three exchanges in 0.1 M PBS and incubated in 2% bovine serum albumin (BSA), 5% normal goat serum, and 0.2% Triton-X in 0.1M PBS solution (blocking solution) for 1 h. After this blocking step, the sections were incubated in primary antibody solutions: Rabbit anti-Iba-1 (Wako, #019-19741), and Chicken anti-GFAP (glial fibrillary acidic protein; abcam, #4674) and diluted 1:1000 in blocking solution at room temperature on a shaker overnight. The sections were then washed by three exchanges of 0.1 M PBS and incubated in secondary antibodies solution: Goat anti-Rabbit IgG Alexa Fluor 555 (Invitrogen, #A-21428), and Goat anti-Chicken IgY Alexa Fluor 647 (Invitrogen, #A-21449) diluted 1:1000 in 0.2% Triton-X in 0.1 M PBS at room temperature for 1 h covered from the light on the shaker. Brain sections were transferred to 1:10,000 4’,6-diamidino-2-phenylindole (DAPI) in 0.1 M PBS for 5 min and washed with two exchanges of 0.1 PBS. Sections were then mounted onto Superfrost Plus microscope slides (Thermo Fisher Scientific) with VECTASHIELD (Vector Laboratories, #H-1400-10) mounting media and covered with a glass coverslip.
Immunofluorescent imaging, processing, and quantification
Mounted sections were imaged on a spinning-disk confocal system (Marianas; 3i, Inc.) consisting of an Axio Observer Z1 (Carl Zeiss), a CSU-W1 spinning-disk head (Yokogawa Corporation), and an ORCA-Flash 4.0 version 2 sCMOS camera (Hamamatsu Photonics), using a 63 × magnification oil immersion objective. Image acquisition was performed using SlideBook 6.0 software (3i, Inc.). Images were taken from randomly chosen regions of interest (ROIs) in the caudate putamen (CPu), hippocampus (HP), primary somatosensory cortex (S1), anterior corpus callosum (antcc), fimbria (fbr), and internal capsule (ic). Images were acquired as 20-μm Z-stacks with 0.5-μm step intervals. Each Z-stack was maximum intensity Z-projected to create a single 2D image and was converted to 16-bit TIFF digital images for further processing and analysis.
Processing and analysis were performed using FIJI software (ImageJ version 2.0.0-rc-59/1.51k). Confocal microscopy maximum intensity Z-projected Z-stack images were pre-processed with “rolling ball” background subtraction (radius = 40 μm) and median filtration (radius = 0.3 μm). Pre-processed Iba-1 and GFAP fluorescent images were then binarized into binary masks using the Li automatic thresholding algorithm. 50,51 The Li algorithm performed qualitatively well with the majority of imaged ROIs, except GFAP staining in the CPu and S1, which overestimated the GFAP-positive area; in these ROIs, the Triangle algorithm 52 was used instead. Binarized Iba-1 binary masks were minimum filtered (radius = 0.6 μm) to create isolated (process-eroded) microglial cell body binary masks.
Astrogliosis was quantified by the total GFAP-positive area fraction from the thresholded binary mask. Microglia density and morphology were quantified by three metrics: total microglial cell number, mean process-eroded cell body size, and the area fraction of microglia processes. Microglial cell number, average process-eroded cell body size, and total cell body area were quantified using the Analyse Particle function, detecting “particles” larger than 10 μm2. The microglial process area was calculated as the difference between total Iba-1 positive area and total process-eroded cell body area. The results were analyzed by one-way analysis of variance (ANOVA), with post hoc Fisher's least significant difference (LSD) tests of the mean of each group to every other group (three comparisons in total) in Prism 7 (GraphPad Inc.).
Sample immunofluorescent images displayed in this report were enhanced in ImageJ as follows: 16-bit TIFF exported images were background-subtracted using the Rolling Ball function (radius = 400 μm) with the brightness/contrast enhanced using the Auto Brightness/Contrast function (0.1 saturation for DAPI channel and 0.9 saturation for Iba-1 channel). Enhanced images were merged into multi-channel (DAPI and Iba-1) 8-bit TIFF images.
Total Iba-1 positive area fraction, Iba-1 positive cell body size, and Iba-1 positive process area fraction from each histological sample ROI were correlated with DTI (FA and MD) and NODDI (NDI, ODI) metrics quantified from equivalent ROIs in MRI images using Spearman correlation in Prism 7 (GraphPad Inc.).
Results
Finite element analysis reveals stress patterns of different brain areas
FEA frame timing was set to start (t = 0 msec) on the contact between the piston and the head; the highest concentration of von Mises stresses in both the LC and HC models was recorded during the acceleration of the brain post-impact at frame 4, at approximately t = 0.325 msec for the LC condition and t = 0.3 msec for the HC condition (Fig. 1B: 0.325 msec, Fig. 1C: 0.3 msec). During this time, peak von Mises stresses were recorded around the retrosplenial (RSN) area, the midbrain, parts of the thalamus, and the corpus callosum at both the HC and LC thresholds. However, stress magnitudes at the HC model were higher than the LC model at the RSN area, the midbrain, the thalamus, and the corpus callosum, respectively (Fig. 1). The von Mises stress levels and patterns did not change significantly and reached a plateau at both impact models beyond frame 10 (t = 0.975 msec for the LC condition and t = 0.9 msec for the HC condition).
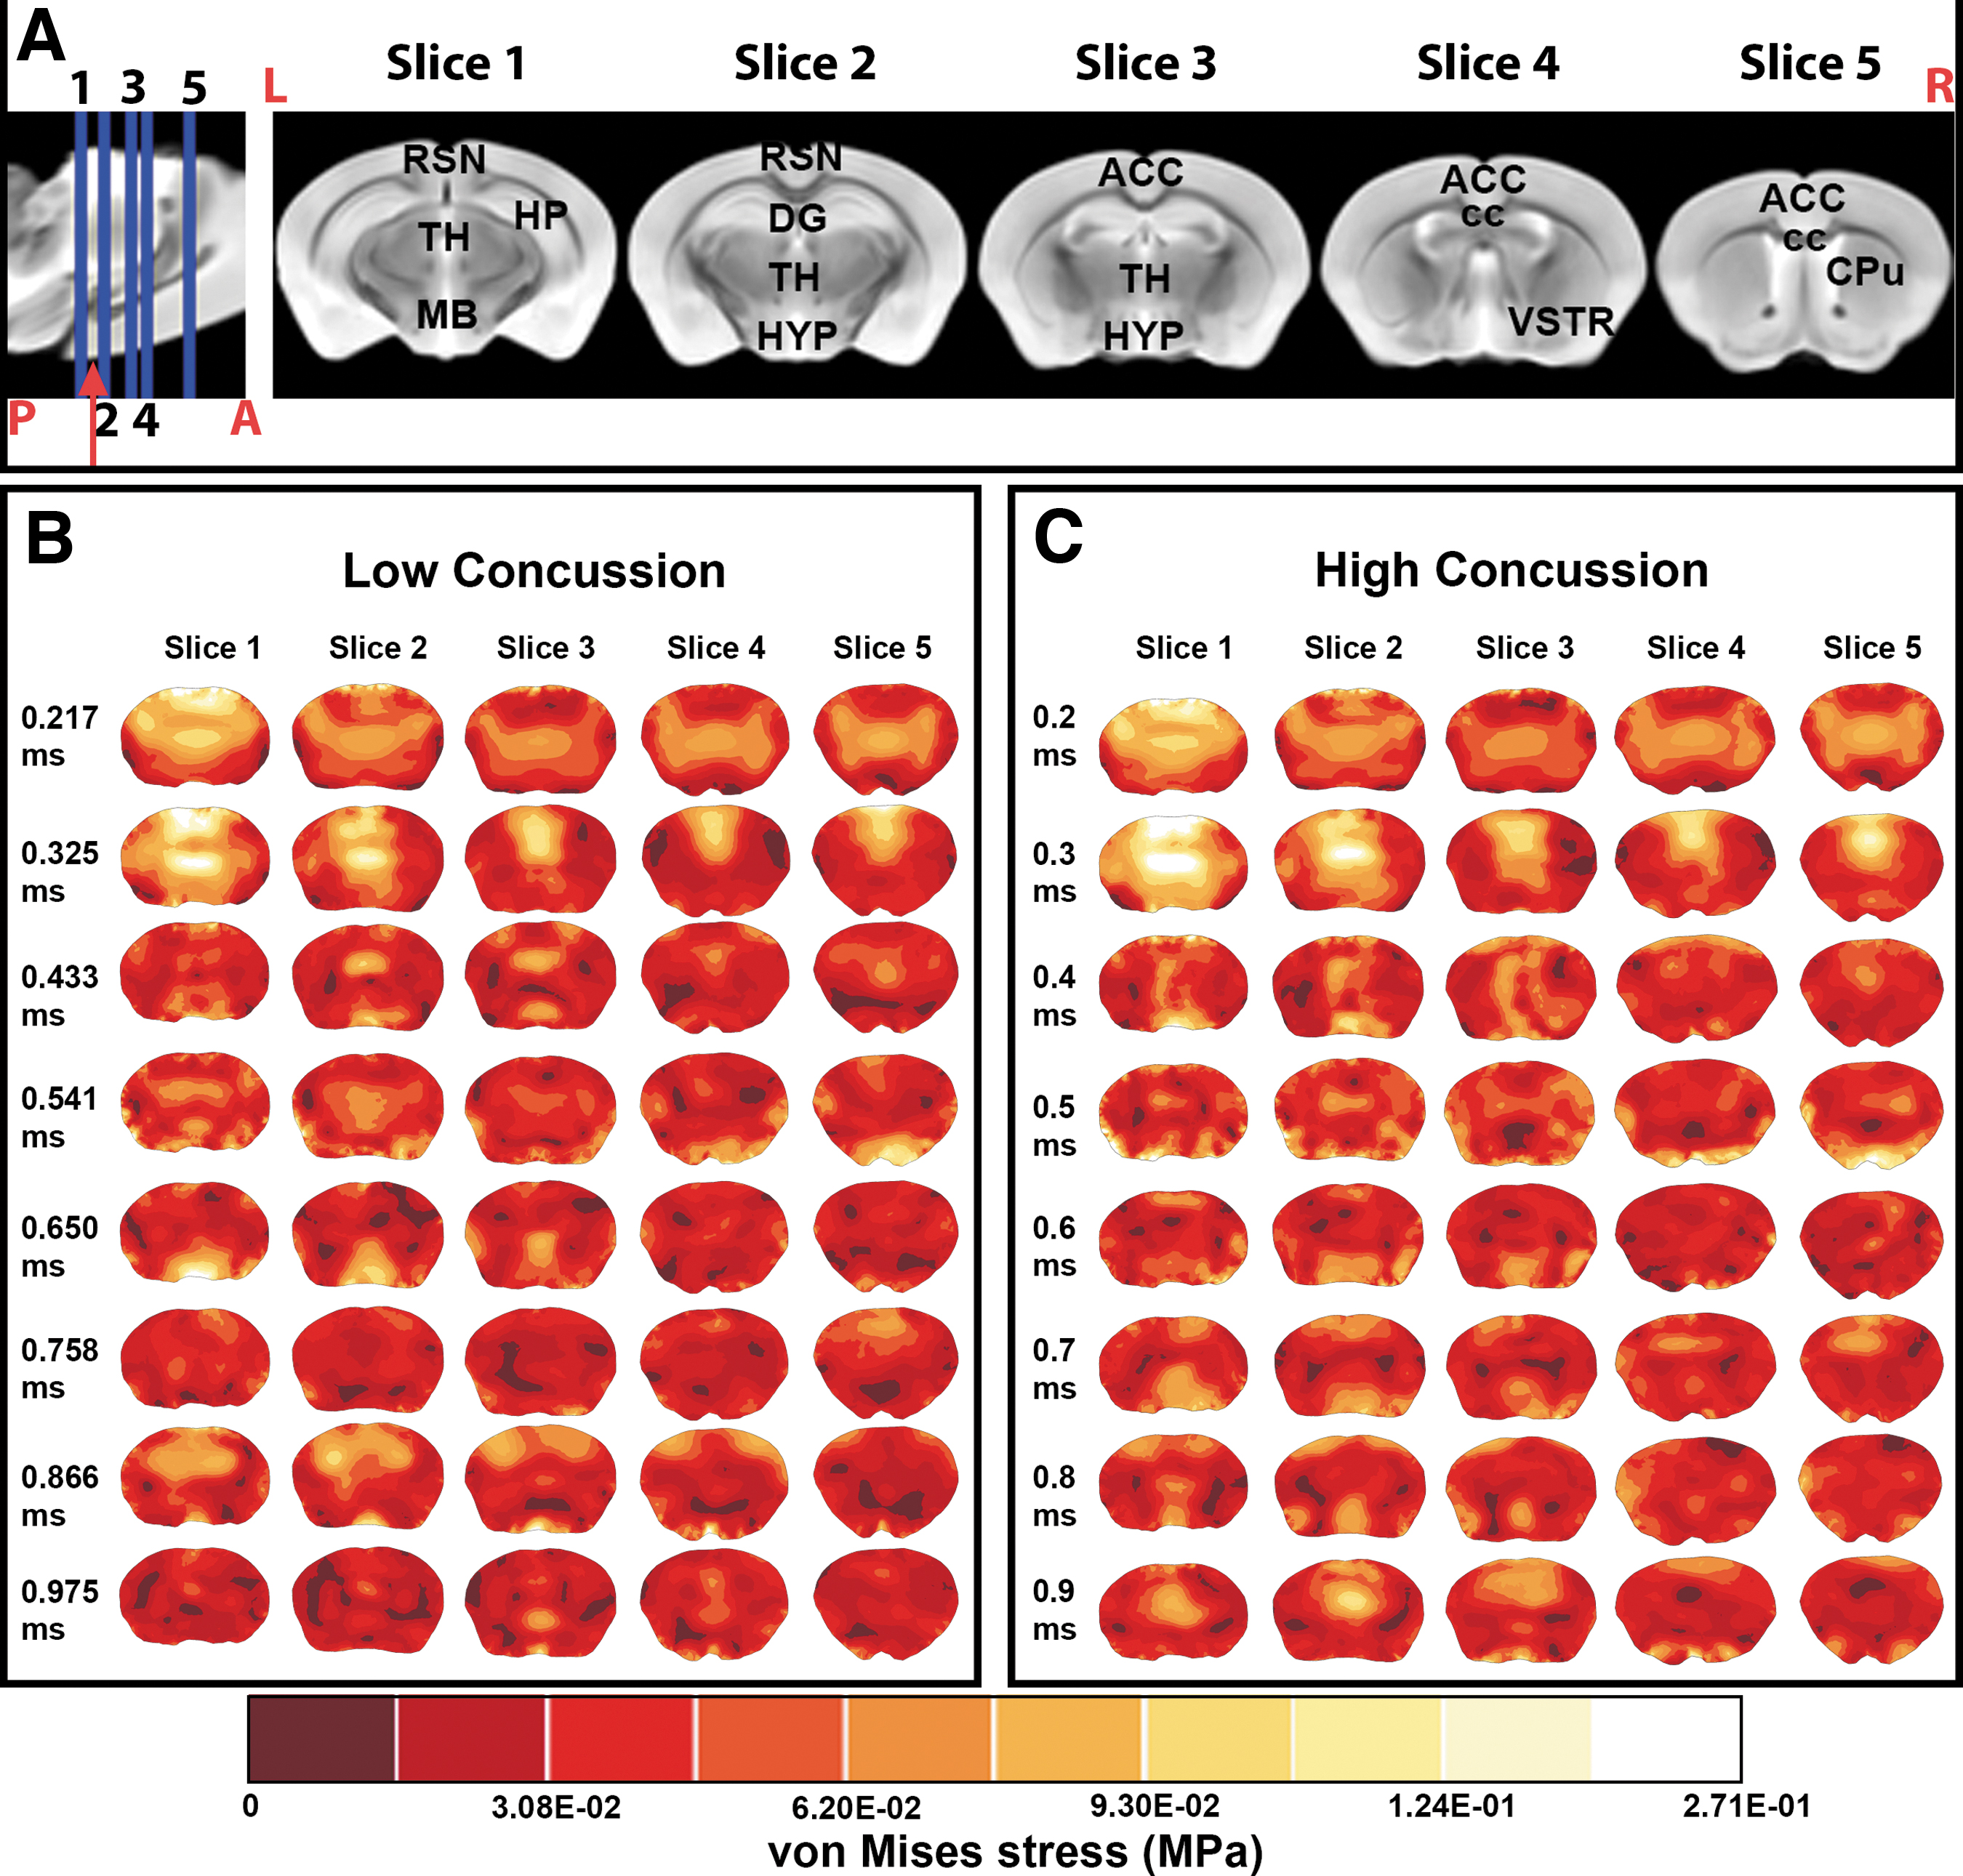
In both concussion simulations, we found moderate von Mises stresses at LCs 0.325 msec and HCs 0.3 msec frames at the isocortex, the HP, parts of the thalamus, the hypothalamus, and the cerebral nuclei. Low-stress areas were shown at the anterior cingulate cortex, the pre-limbic area, and the most ventral portion of the brain. Moderate-stress areas at the LC 0.433 msec frame and the HC 0.4 msec frame were recorded in the lateral two-thirds of the brain, which included parts of the HP and the visual, auditory, temporal, and parietal association areas. From the LC 0.217 to 0.325 msec frames, and from the HC 0.2 to 0.3 msec frames, the highest stress area moved from the most posterior (slice 1) to the most anterior (slice 5) part of the coronal section of the brain and stress magnitudes dropped from the LC 0.433 msec frame and the HC 0.4 msec frame onward. We did not find a specific pattern in the distribution of stress in the moderate and low stressed areas, but the lowest stress areas were collectively found around the supplementary somatosensory cortex, the anterior cingulate cortex, the CPu, and the ventral striatum regions (Fig. 1).
We found variations in the distributions and magnitudes of stress within and between the HC and LC dynamic FEMs. Within the HC FEM, stress comparisons post-impact (frame 4) versus the plateau period (frame 10) in the HC model were found around the olfactory bulb, RSN area, and cingulate area (Supplementary Fig. S2A). In the LC model the highest differences post-impact and during the plateau period were reported in the cingulate area (Supplementary Fig. S2B). At the two thresholds, post-impact showed moderate stress variations around the neocortex (Supplementary Fig. S2C).
Video outputs of the Finite Element Model of the low and high impact threshold are included in the Supplementary Material videos.
Loss of righting reflex time and relation with impact velocity
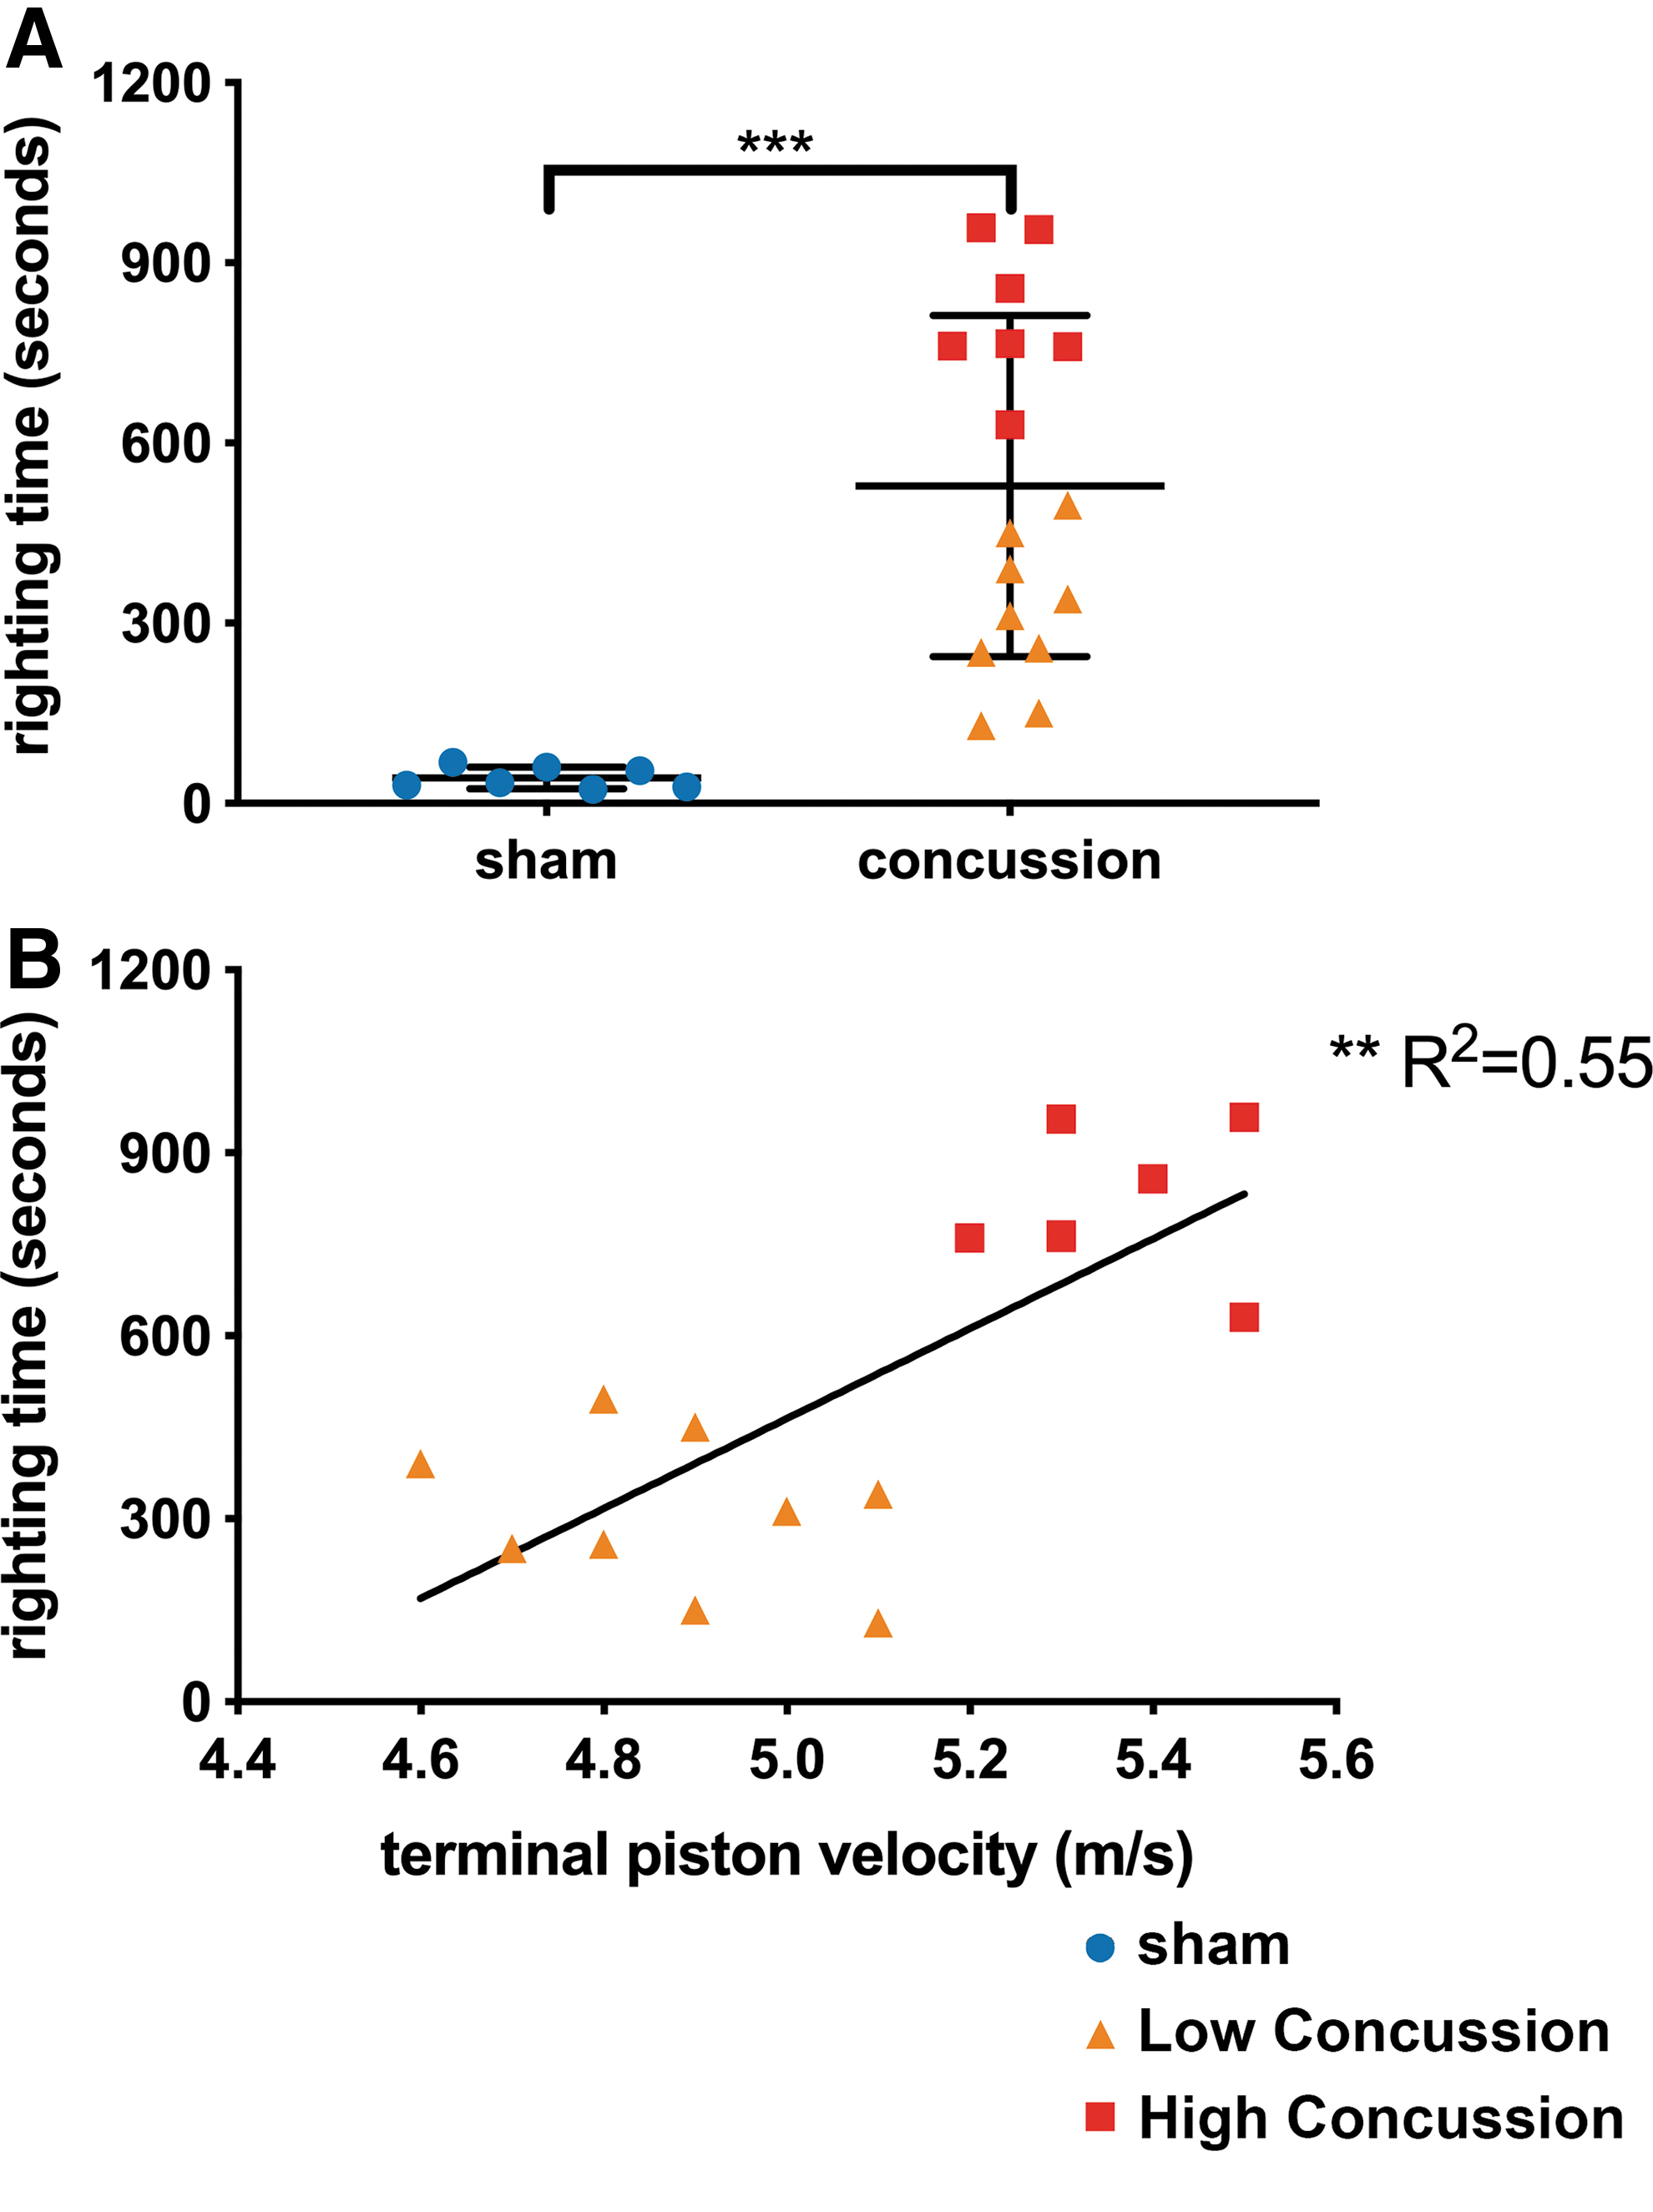
Concussed animals were classified into two groups based on the LRR: LC (piston velocity <5.1 m/sec, LRR time <600 sec) and HC (piston velocity >5.1 m/sec, LRR time >600 sec). Figure 2A represents the LRR duration from each of the groups—concussed animals had significantly longer LRR duration compared with sham animals (528.9 ± 71 sec vs. 42.3 ± 6.8 sec, p-value <0.0001). Correlation analysis shows LRR duration is correlated with terminal piston impact velocity (Fig. 2B, p-value = 0.0011, R2 = 0.55). The LC and HC groups had significantly different LRR duration (LC: 308.4 ± 41.8 sec vs. HC: 812.3 ± 44.8 sec, p-value <0.0001)
DTI and NODDI reveal unique diffusion metric changes at different impact thresholds
Figure 3 represents voxel-by-voxel DTI, NODDI metrics, and TBM statistical analysis of the LC and HC groups compared with the sham group. DTI detected a significant increase in FA in the gray matter (GM) of the LC group compared with the sham group (Fig. 3A, FA) most prominently in the neocortex, CPu, amygdala, piriform cortex, and HP. WM changes were also detected using DTI, represented by an increase in Dp values in the posterior of the external capsule in the LC group compared with the sham group (Fig. 3A, Dp).
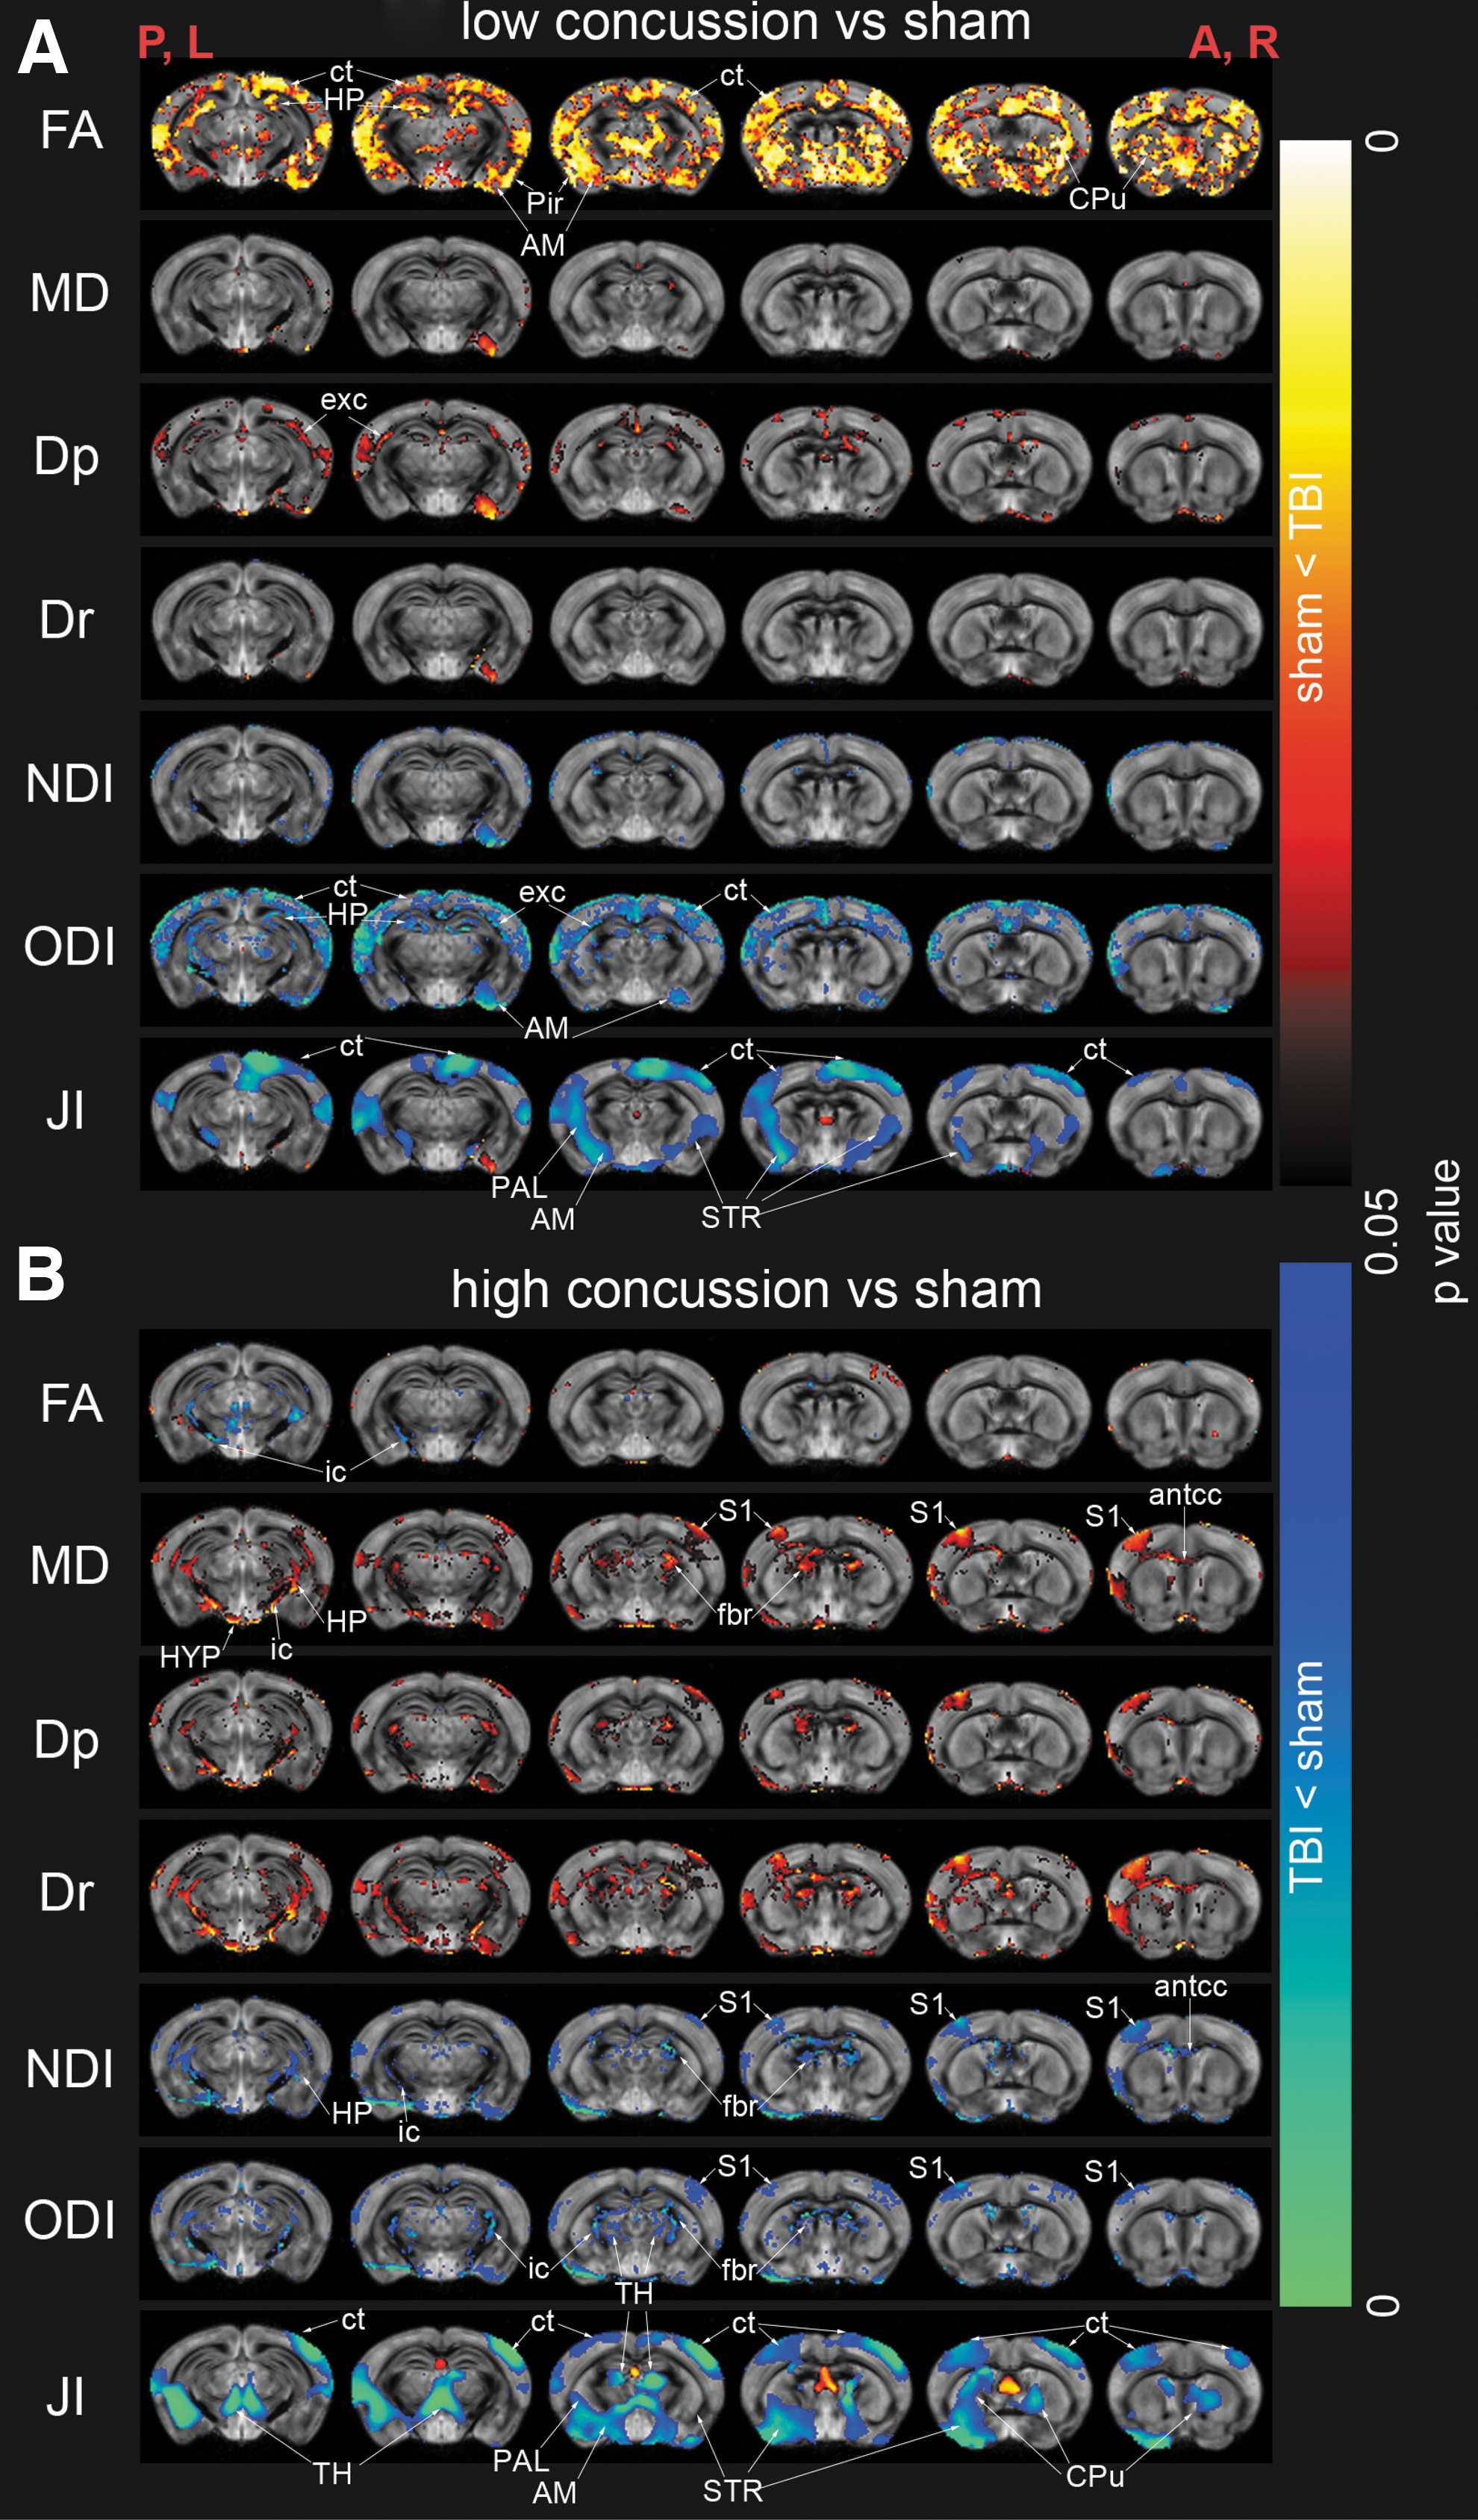
Voxel-by-voxel statistical analysis results of diffusion tensor imaging metrics (Dp, parallel diffusivity; Dr, radial diffusivity; FA, fractional anisotropy; MD, mean diffusivity), neurite orientation dispersion and density imaging (NDI, neurite density index; ODI, orientation dispersion index) and tensor-based morphometry (JI, Jacobian index) of low concussion (n = 7, A) and high concussion (n = 9, B) groups compared with sham (n = 7) group. Statistical map thresholded at p-value <0.05, unpaired two-sample t test, implemented as permutation tested for the general linear model. Statistical maps were overlaid on the study-specific averaged ODI images. Red anatomical orientation indicators: P, L: posterior, left; A, R: anterior, right. AM, amygdala; antcc, anterior corpus callosum; CPu, caudate putamen; ct, neocortex; exc, external capsule; fbr, fimbriae; HP, hippocampus; HYP, hypothalamus; ic, internal capsule; PAL, pallidum; Pir, piriform cortex; S1, primary somatosensory cortex; STR, striatum. Color image is available online.
The HC group showed increased MD, Dr, and Dp compared with the sham group in a few GM regions: S1, posterior HP, and the hypothalamus (Fig. 3B, MD, Dp, and Dr). MD, Dr, and Dp increases were detected in several WM tracts: the antcc, fbr, and the ic (Fig. 3B, MD, Dp, and Dr). Decreased FA was detected in the ic WM tract in the HC group compared with the sham group (Fig. 3B, FA).
NODDI's NDI was observed to have little change in the LC group (Fig. 3A, NDI). A significant decrease was found in the HC group compared with the sham group in the S1, posterior HP, the antcc, fbr, and ic (Fig. 3B, NDI). The LC group had decreased ODI primarily in the GM: neocortex, HP, and amygdala and the external capsule tract of the WM (Fig. 3A, ODI). The HC group had decreased ODI in both GM and WM: S1, thalamus, fbr, and ic (Fig. 3B, ODI).
Tensor-based morphometry
TBM detected overall decreased tissue volume measured as the Jacobian index (Fig. 3A,B; JI) in both the LC and HC groups compared with the sham group. Regions detected to have decreased tissue volumes included the neocortex, striatum, CPu, pallidum, thalamus, and amygdala. The average tissue shrinkage in the LC group was 7.66% (Mean JI ± standard error of the mean [SEM] among statistically significantly different voxels 1.409 ± 0.0152 [sham] vs. 1.301 ± 0.0178 [LC]) and in the HC group 10.98% (Mean JI ± SEM among statistically significantly different voxels: 1.457 ± 0.0175 [sham] vs. 1.297 ± 0.0336 [HC]).
Iba1 and GFAP immunofluorescent staining
Quantification of different aspects of Iba-1+ cell morphology showed different activation states of microglia in different concussion groups, although this was dependent on the brain region and GM versus WM. Figure 4 showed representative immunofluorescent stains of DAPI and Iba-1 from each ROI: CPu, dentate gyrus, S1, and the corpus callosum of one animal from each of the sham, LC, and HC group. In the HP, the HC group had significantly more Iba-1+ cells (normalized as % sham group mean, 95% difference confidence interval [CI] vs. sham: 0.67–51.9, p-value <0.05, Fig. 5B), larger microglial process-eroded cell body (normalized as % sham group mean, 95% difference CI vs. sham: 8.43–60.56, p-value <0.05, Fig. 5F) compared with the sham group. The LC group was not found to have significantly different morphological metrics in the microglia compared with the sham group in the HP (Fig. 5B,F,G). These indicated that there were more microglial cells in the HP of the HC group and those microglial cells were likely to have an “ameboid” cell body shape and de-ramified appearance, corresponding to reactive/phagocytic microglia. 53,54

Examples of immunofluorescent staining images of DAPI (blue) and Iba-1 (red) of sham, LC, and HC animals taken from the caudate putamen (CPu), dentate gyrus (DG), primary somatosensory cortex (S1), and corpus callosum (cc) regions of interest. HC, high concussion; LC, low concussion. Color image is available online.

Iba-1+ microglia cell morphological quantification results from each region of interest: total cell count (A, B, C, D, normalized as % of mean of sham values), microglial-process-eroded cell body size (E, F, G, H, normalized as % of mean of sham values), and microglial process area (I, J, K, L, % of imaged area): caudate putamen (CPu), hippocampus (HP), primary somatosensory cortex (S1), and anterior corpus callosum (antcc). One-way analysis of variance (ANOVA), with post hoc Fisher's least significant difference (LSD) tests of the mean of each group to every other group. *P-value <0.05, **p-value <0.01, ***p-value <0.001. Graphs displayed as box and whisker plots: the box displays the 25th to 75th percentile, the line in the box displays the median, and the whiskers display the 5th and 95th percentiles.
In the S1, no significant differences in the number of Iba-1+ cells were found among the groups. Nevertheless, the LC group had significantly larger process-eroded cell body size compared with the sham group and HC group (normalized as % sham group mean, 95% difference CI vs. sham: 5.12–23.48, p-value <0.01; 95% difference CI vs. HC: 9–27.38, p-value <0.001; Fig. 5B, S1). The LC group total microglia process area was not significantly smaller than that of the sham group but was slightly larger than that of the HC group, indicating that microglial cells of the LC group in the S1 region had a hyper-ramified (intermediate activation stage) morphology. 53
In the WM tract of the antcc, the HC group had significantly more microglial cells (normalized as % sham group mean, 95% difference CI vs. sham: 43.63–160.5, p-value <0.01, Fig. 5D), larger process-eroded cell body size (normalized as % sham group mean, 95% difference CI vs. sham: 3.34–90.45, p-value <0.05, Fig. 5H), and greater total microglia process area (total % area as processes, 95% difference CI vs. sham: 1.17–5.4, p-value <0.01, Fig. 5L) compared with the sham group. These indicated that there were more microglial cells in the antcc of the HC group compared with the sham group, and those cells were likely to have “ameboid” cell body shape and de-ramified appearance, corresponding to reactive/phagocytic microglia. 53,54
In the CPu, the HC group had a significantly smaller total microglial process area (total % area as processes, 95% difference CI vs. sham: −0.29 to −3.9, p-value <0.05, Fig. 5I) but no significant difference in process-eroded cell body size compared with the sham group. These indicated that the microglia in the HC group adopted a de-ramified appearance.
Quantification of the GFAP-positive area fraction showed that both concussion groups had an insignificant change in the GFAP-positive area in most ROIs (Fig. 6), except for the HC group having significantly greater % GFAP+ area in the HP, antcc, and fimbriae.
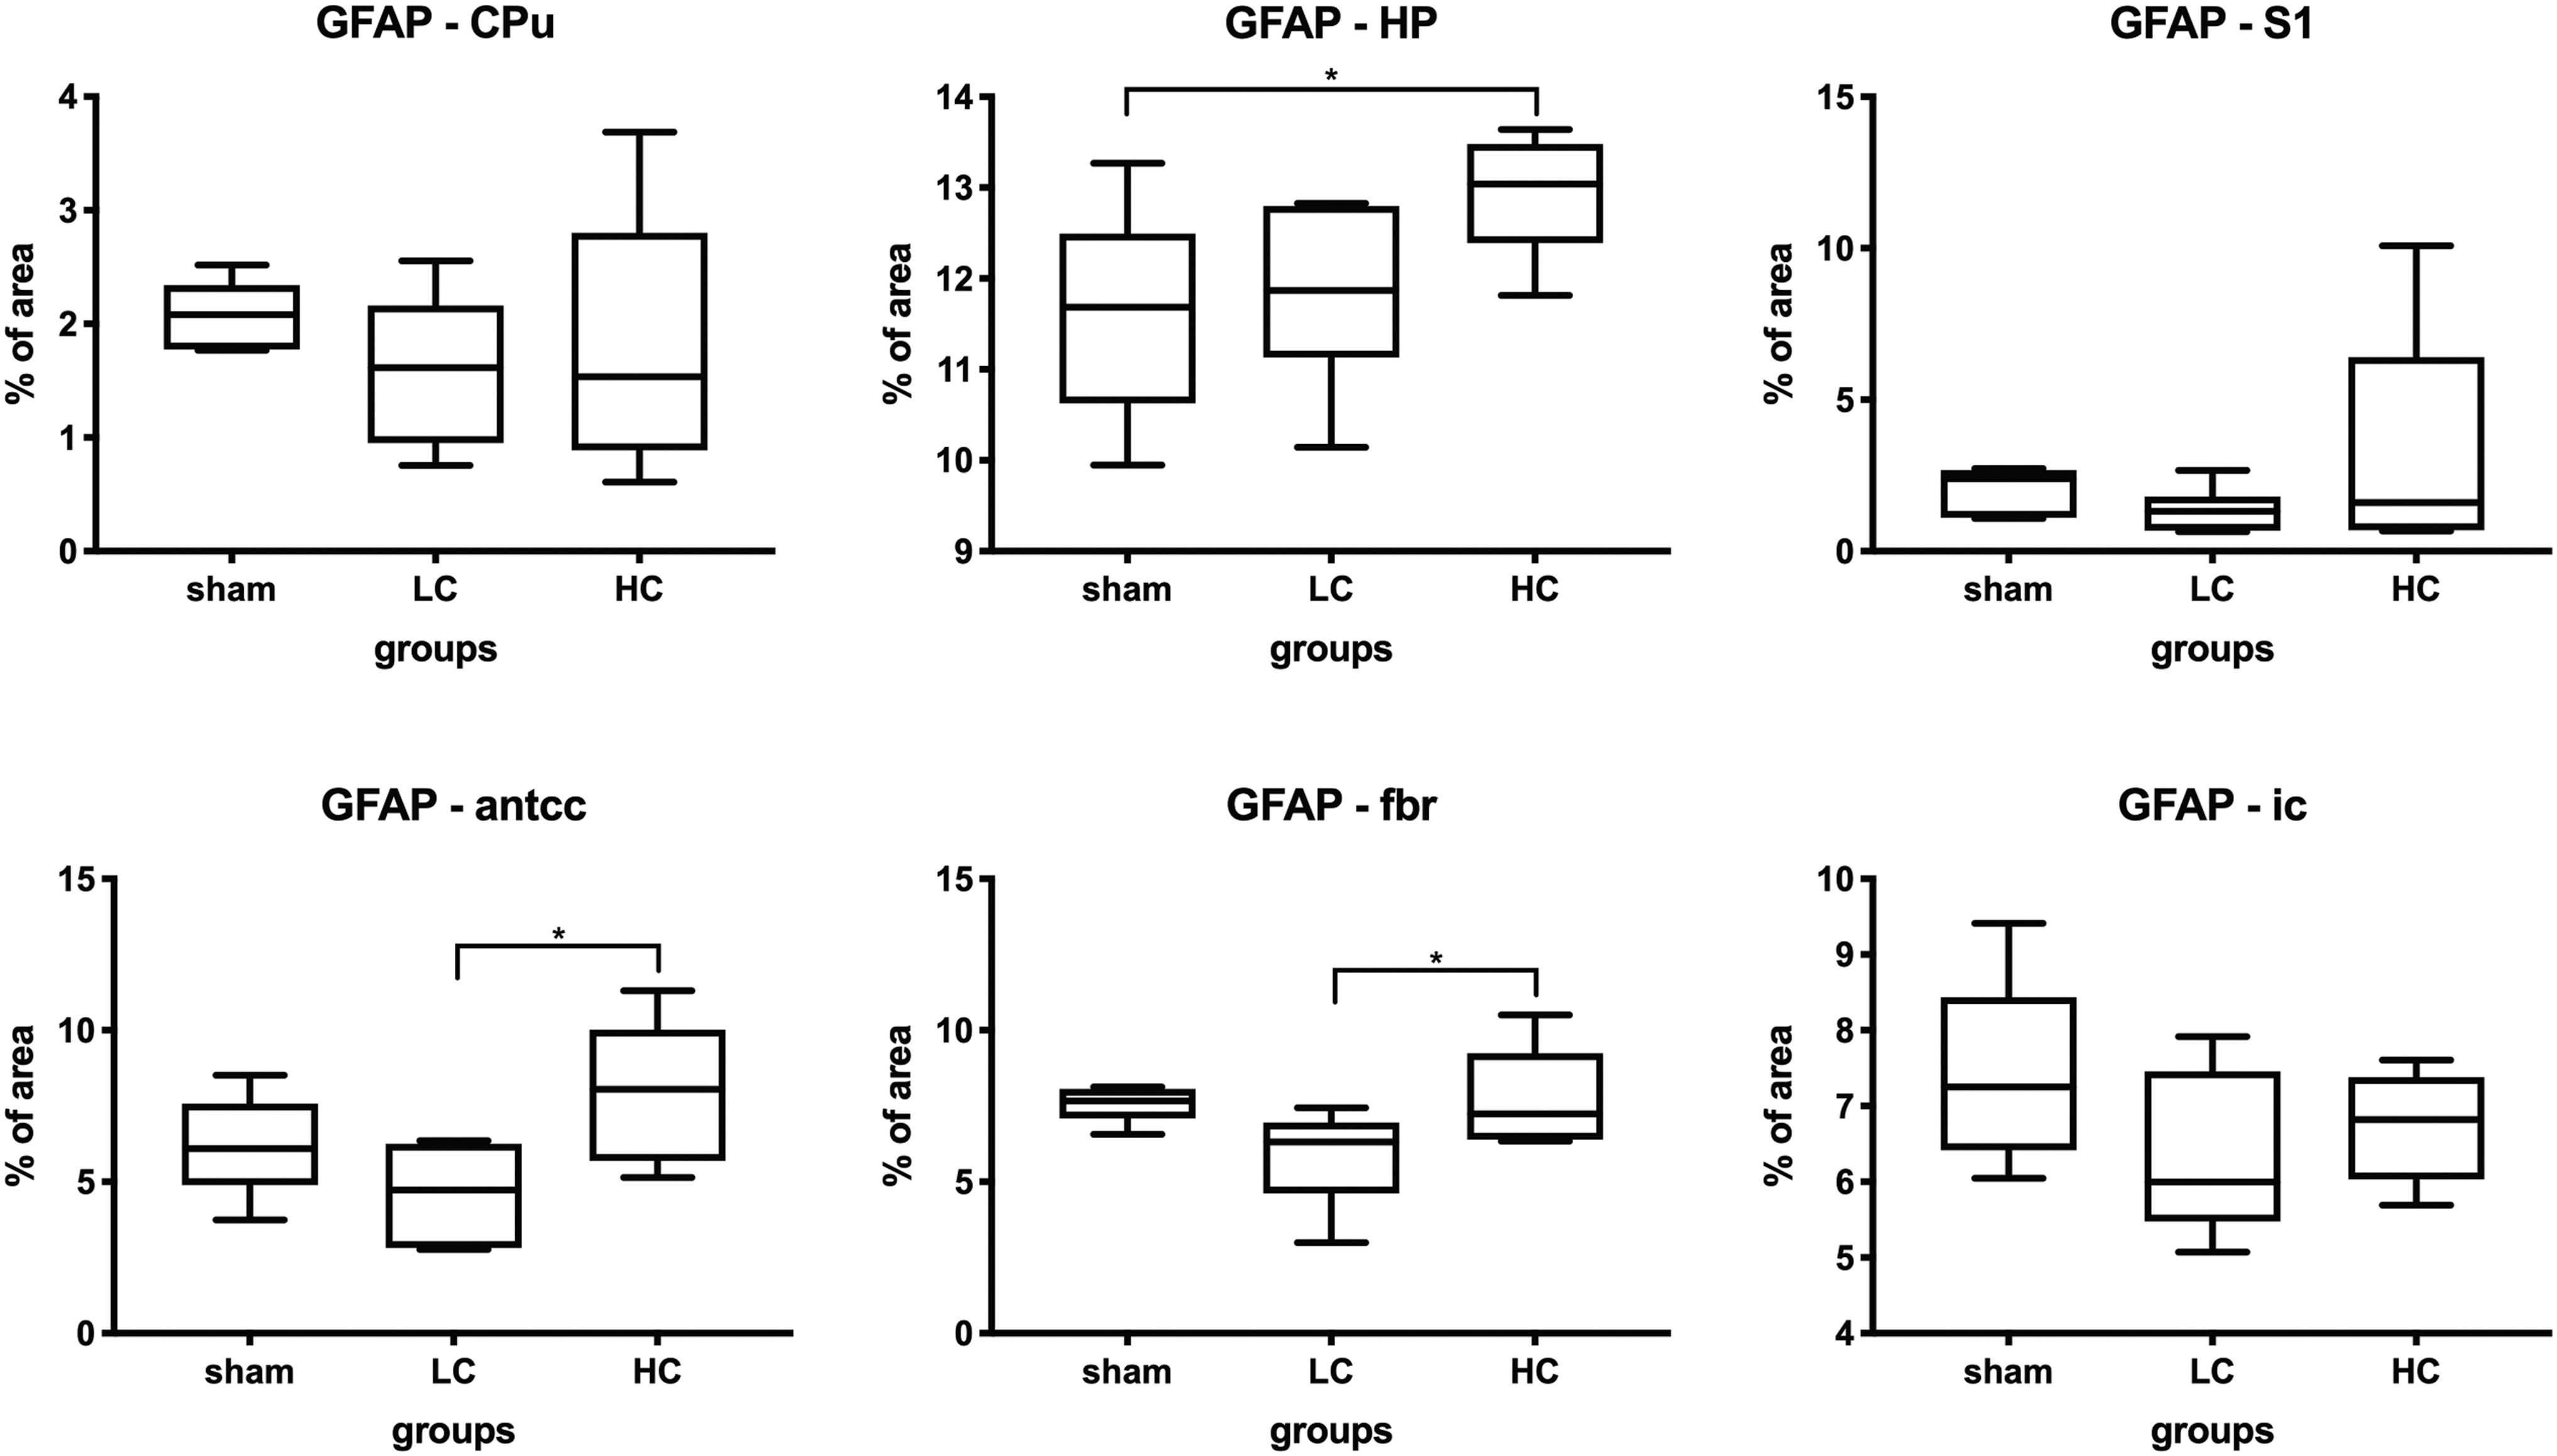
Glial fibrillary acidic protein (GFAP) staining results from each region of interest: caudate putamen (CPu), hippocampus (HP), primary somatosensory cortex (S1), anterior corpus callosum (antcc), fimbriae (fbr), and internal capsule (ic). GFAP+ area quantified as total % imaged area one-way analysis of variance (ANOVA), with post hoc Fisher's least significant difference (LSD) tests of the mean of each group to every other group. *P-value <0.05, **p-value <0.01, ***p-value <0.001. Graphs displayed as box and whisker plots: the box displays the 25th to 75th percentile, the line in the box displays the median, and the whiskers display the 5th and 95th percentiles.
De Olmos cupric-silver stain reveals neuronal and axonal degeneration
Representative sections showing areas with degenerating axons and neurons detected by de Olmos cupric-silver stain are shown in Figure 7. The RSN cortex, which was directly impacted by the piston during the concussion procedure, showed dense silver stain in the HC group, indicating significant neuronal and axonal degeneration (Fig. 7, RSN region, HC group). Fine silver-stained axons were detected in the same region of the LC group (Fig. 7, RSN region, LC group), indicating some axonal but limited neuronal degeneration. The dentate gyrus also showed differentiating levels of degeneration (Fig. 7, HP region). Other regions of the neocortex did not have significantly more silver-stained tissue in the concussion groups compared with the sham group (Fig.7, S1 region).

Examples of de Olmos silver-stained images of sham, low concussion (LC), and high concussion (HC) animals in the retrosplenial cortex (RSN), dentate gyrus (DG), primary somatosensory cortex (S1), corpus callosum (cc), and internal capsule (ic) regions of interest. Scale bar = 50 μm. Color image is available online.
WM tracts in both the LC and HC groups were significantly more silver-stained, indicating the presence of degenerating axons. These WM tracts include the corpus callosum (Fig. 7, cc), ic (Figure 7, ic), and the fbr (data not shown).
Correlation of MRI with Iba-1 levels in the brain
A linear correlation of the DTI and NODDI metrics with the microglial cell morphological metrics showed varying degrees of correlation; microglial cell morphology was used as an indicator of neuroinflammation in the different regions of the brain (Fig. 8). In the CPu, ODI and NDI positively correlated with all three microglia metrics, whereas MD negatively correlated only with the process-eroded cell body size and the total microglial process area. FA showed no correlation with any of the microglia measures. In the dentate gyrus, FA, MD, and NDI correlated with the total microglial process area only. No correlation between DTI/NODDI metrics and microgliosis was found in the S1 and antcc.
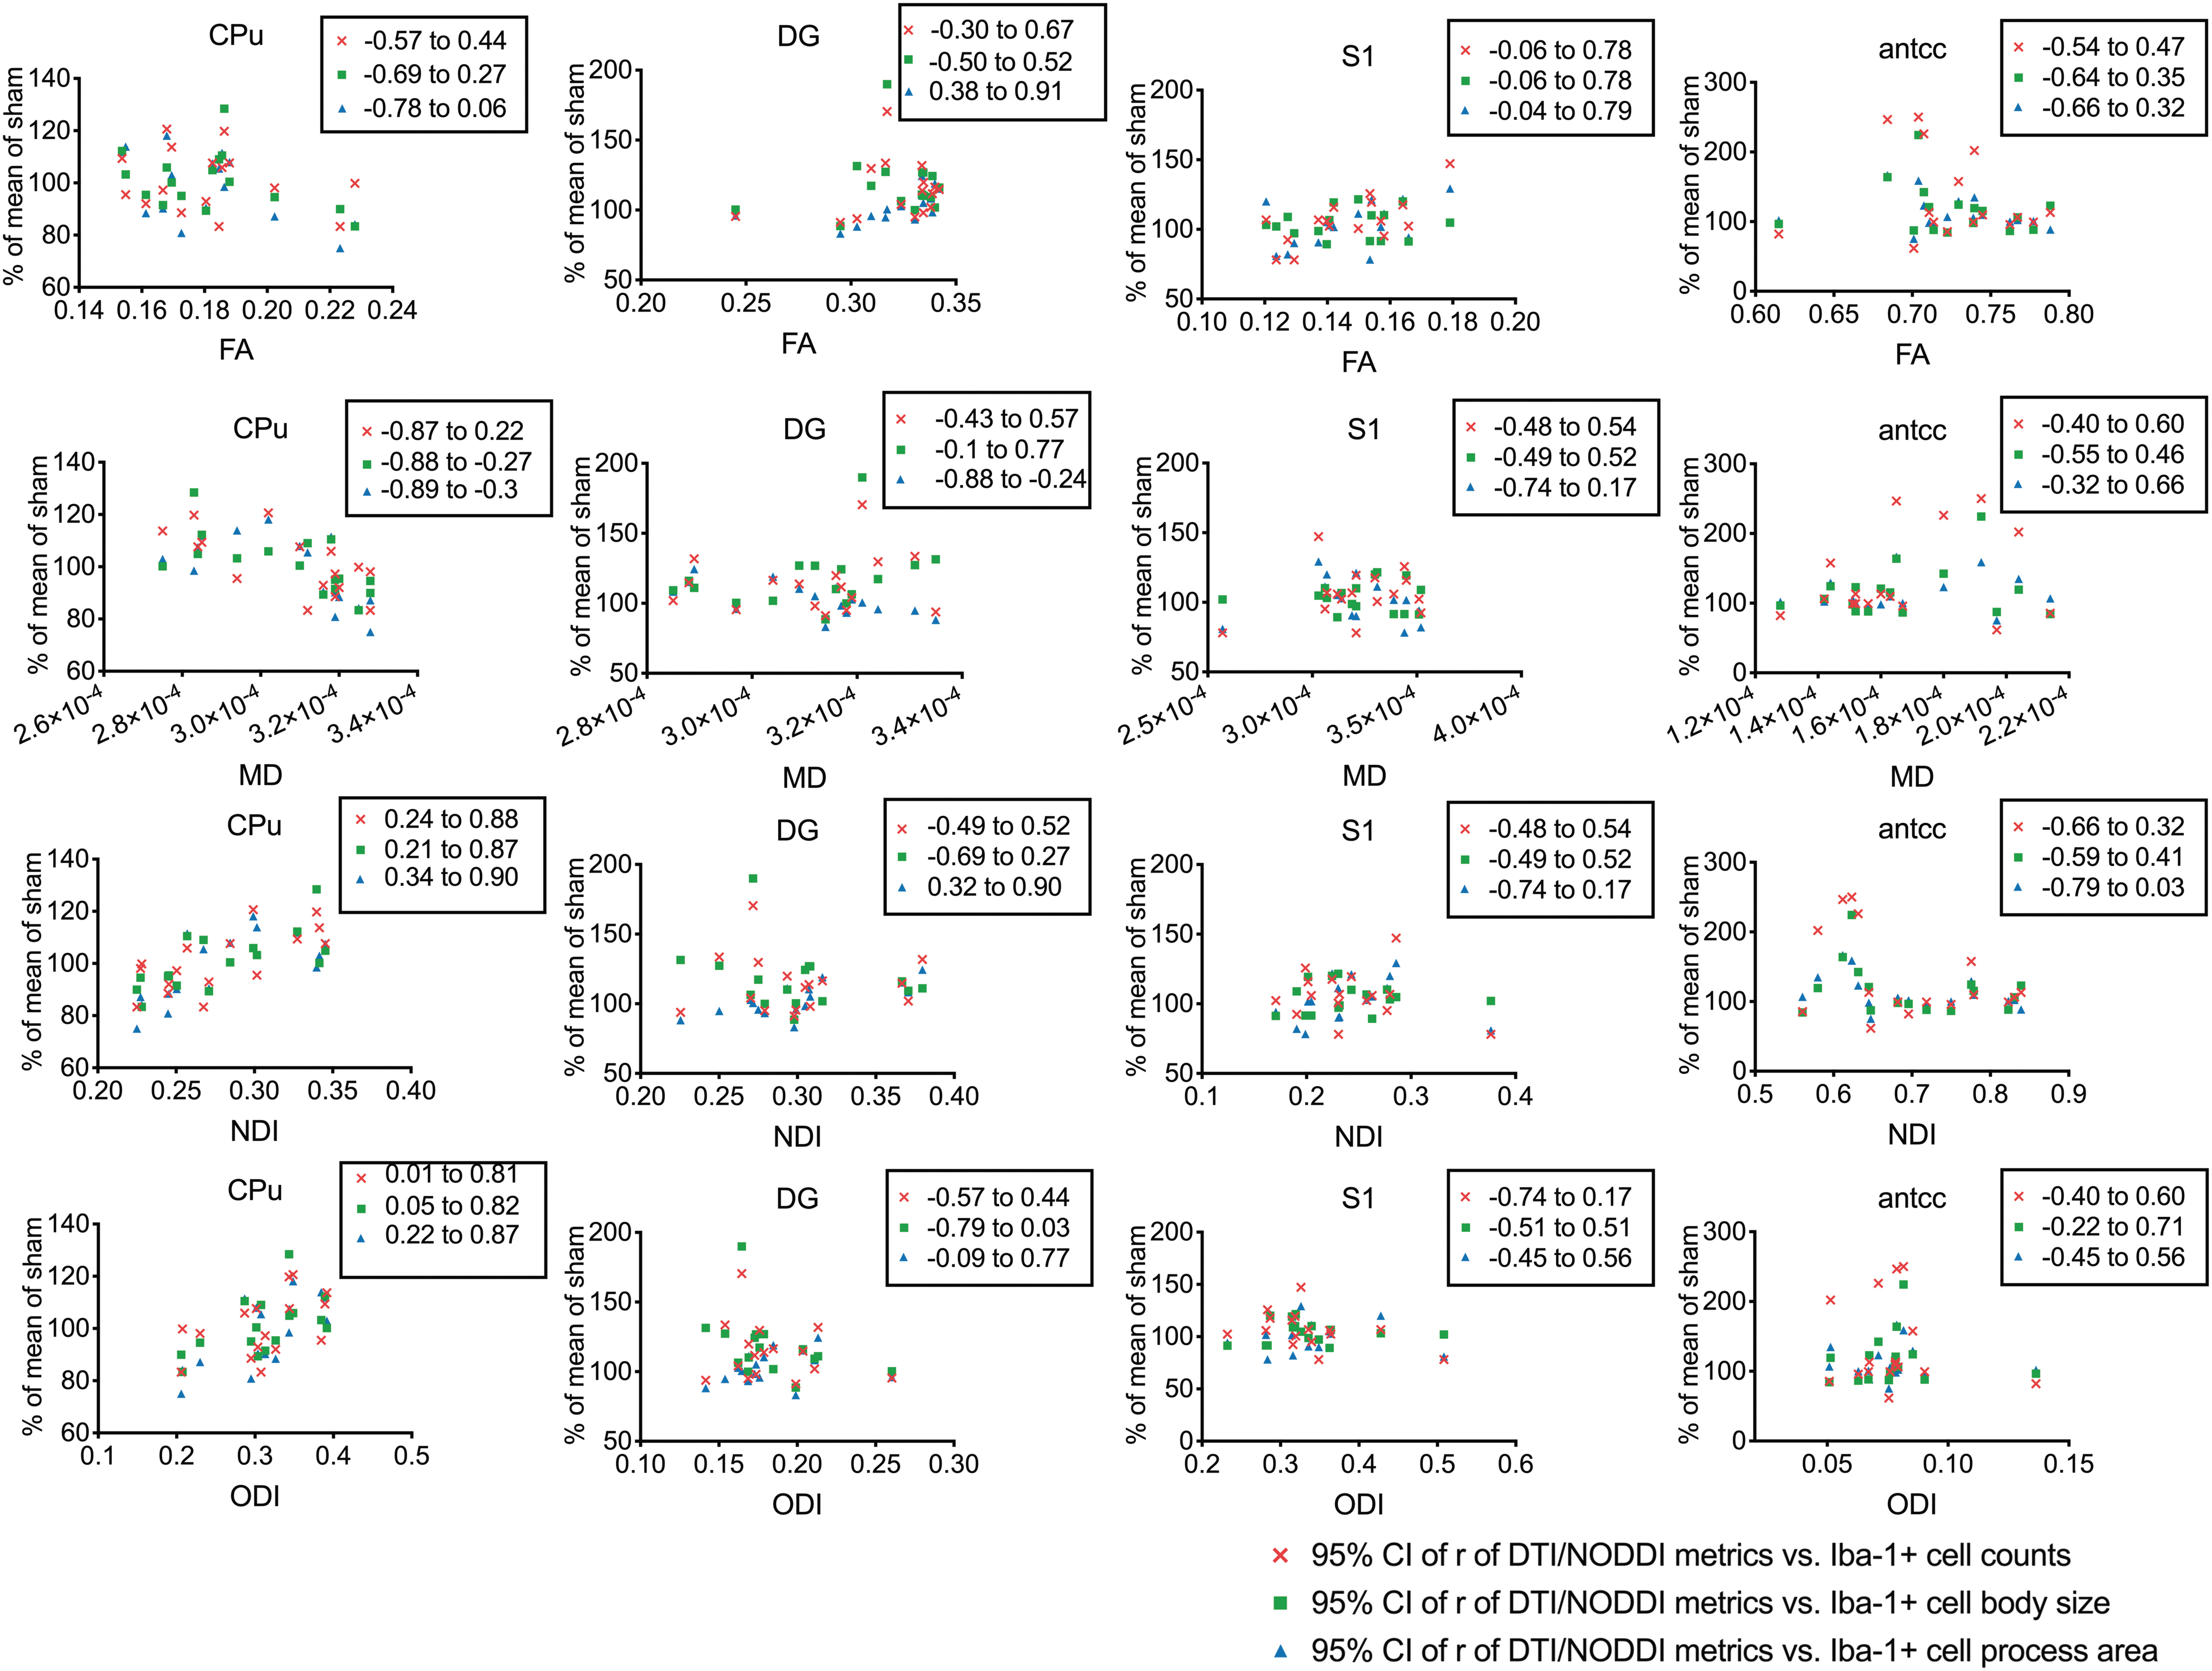
Spearman linear correlation graph of diffusion tensor imaging (DTI) metrics (FA, fractional anisotropy; MD, mean diffusivity), neurite orientation dispersion and density imaging (NODDI; NDI, neurite density index; ODI, orientation dispersion index) and microglial cell morphology metrics (cell count, dendrite-eroded cell body size, and dendrite area) from each region of interest: caudate putamen (CPu), dentate gyrus (DG), primary somatosensory cortex (S1), and anterior corpus callosum (antcc). Displayed are 95% confidence intervals of Spearman correlation coefficients (r). Color image is available online.
Discussion
In this work, we demonstrate that DTI and NODDI were able to detect severity-dependent spatial patterns of microstructural changes in the brain following concussive injury. The LC group presented increased FA and decreased ODI with no change on NDI in the GM, whereas the HC group showed increased MD, decreased ODI, and decreased NDI in both the GM and WM. Both the LC and HC groups showed argyrophilic pathology with staining densities corresponding to the severity of the impact. The LC group had insignificant changes in microgliosis and astrogliosis, whereas the HC group had increased microgliosis in the WM tracts. The study, therefore, sets the foundation for NODDI as the diffusion imaging modality with the capability to show progressive diffusion metric changes as a response to increasing injury severity, and for DTI as the more sensitive but less specific modality to detect microstructural changes after a concussion.
Given the heterogeneity in the symptoms, diagnosis and management of concussion have been very challenging, and by far, have been based on clinical symptoms. 55 Diagnosis of concussion often relies on the exclusion of more severe forms of TBI—the absence of penetrating injury, contusion, amnesia lasting longer than 24 h, or loss of consciousness (LOS) for longer than 30 min. 56 In this work, we measured the LRR, which is considered analogous to LOS symptoms in humans and also is considered a symptomatic indicator of injury severity. 17,57 LOC, although a common symptomatic criterion for exclusion of human patients from the “mild” classification of TBI, has been shown to not correlate with neuropsychological or functional outcomes. 58 In contrast, LRR in rodents has appeared to be a reasonable indicator of injury (for a review, see the article by DeWitt and colleagues 57 ). The review suggests that LRR under 15 min could be considered “mild,” 15–20 min “moderate,” and above 20 min “severe.” LRR duration positively correlated with impact velocity, and two discriminant clusters were identified based on this correlation into LC and HC groups. In both groups, the longer LRR duration in concussed animals compared with shams was consistent with previous studies, especially those using the CHIMERA device. 18 –20
Our FEA results show how the von Mises stress patterns started at the highest stress level in the RSN, dentate gyrus, and thalamic areas close to the impact site. As the brain started to rotate and move, high-stress areas became moderate stress, and the moderate stress areas moved from the superior to inferior structures. This moderate stress “column” traversed, then spread out to the inferior structure of the brain (hypothalamic and amygdala areas), then rebound and traveled up and spread out into the isocortex. Brain regions more anterior to the impact site had smaller maximum stress, although the distribution pattern of the high to low stress remained similar. The peak stress estimated from our model is within the mTBI range of earlier studies. 59
Current clinical imaging cannot diagnose concussion and only serves to exclude other etiologies such as contusion or cerebral hemorrhage. 55 Animals in our study exhibited distinct patterns on DTI, suggesting that the different patterns relevant to each group had underlying biological significance. We also detected significant WM alterations in the HC group with decreases in FA and increased MD in the antcc, external capsule, and WM tracts of the HP. FA decreases in WM are commonly associated with reduced WM integrity. 60 Earlier studies in the mouse model of closed head injury detected decreased FA in WM tracts, representative of WM degeneration. 19 A single impact has been previously reported to show both increased 61 and decreased 62 FA in the WM of a rat model of concussion. Increased FA has been observed in rats suffering a single injury 7 days after the injury in the anterior commissure, cerebellar peduncles, corpus callosum, and the fbr of the HP. 61 Decreased FA has also been recorded in rats receiving a single mTBI, 1 and up to 8 days after the injury in the corpus callosum. 62
An earlier DTI study in a rat model of rotational head injury showed that rotational acceleration magnitude and duration had different levels of effects on DTI metrics post-injury. 63 Specifically, a higher rotational acceleration magnitude was associated with lower FA in a limited number of WM tracts (the internal capsule). 63 Our findings were consistent with this result—higher impact velocity, and potentially acceleration, resulted in more WM tracts with decreased FA. The study also demonstrated that shorter rotational duration was associated with higher FA values in the GM. 63 Our impact injury model only allowed for the control of a single factor, impact velocity; the control for the rotational duration could not be established, and a comparison between the results might not be straightforward. Nevertheless, we can hypothesize that a shorter rotational duration imparted smaller cumulative rotational strain on the brain, approximating lower impact threshold in our study; thus, our result is consistent in that the lower impact or shorter rotational duration 63 resulted in higher FA values in the GM. A number of DTI studies of rodent models of mild closed-head injuries revealed that repeated injuries generally resulted in decreased FA in several WM regions—the corpus callosum, optic tract, cingulum bundle, and the brachium of the superior colliculus 7 days after the injury. 19,64
NODDI detected WM changes (decreased NDI and ODI) in the corpus callosum, external capsule, ic, and fbr. A recent study by Churchill and associates reported decreased NDI (accompanied by decreased FA, increased Dp and Dr) in the WM of concussed athletes (aged 20.3 ± 2 years of age), 0.5–2 months post-injury. 65 This is consistent with our results of decreased NDI and ODI (accompanied by decreased FA and increased Dp, Dr) in the HC group at day 2 post-concussion. Wu and co-workers detected decreased NDI (without other changes) in the WM of patients with concussion approximately 2 weeks (15 ± 10 days) post-injury. 26
In this work, the de Olmos cupric-silver stain revealed distinct pathology in the LC and HC groups. Dense silver-staining was seen in the RSN cortex and the dentate gyrus of the HP—sites in very close proximity to the impact. These regions were also observed in the FEMs to have the highest peak stress. The HC group had more densely stained degenerative GM regions and WM tracts than the LC group. A higher impact resulted in larger high-stress areas in the FEM and, consequently, more densely silver-stained degenerative regions. The WM was apparently more vulnerable to injury; WM tracts in the HC group further away from the impact site, including the corpus callosum, ic, and fbr, were stained, evident of axonal degeneration, whereas adjacent GM regions had no significant silver staining. No changes in FA and MD were seen in the WM of the LC group despite detected axonal degeneration by silver staining in the corpus callosum, which may be a limitation in the sensitivity of DTI. However, decreased FA, NDI, and ODI, and increased MD were detected in several WM tracts, including the corpus callosum, anterior commissure, fbr, and ic of the HC group, which could be a consequence of axonal degeneration. Decreased NDI and ODI in the WM is consistent with NODDI imaging of human patients with concussion in the sub-acute phase (up to 2 months post-injury). 24,26,65
DTI is sensitive to WM alterations; however, it has been reported to detect GM injury after TBI with increased FA in the GM correlating with astrocyte activation and inflammation in a rat open-head injury model. 66 Our astrocyte staining showed that increased FA in the GM was not associated with increased astrogliosis. We extended our investigation to a different marker of neuroinflammation, microgliosis. In the current model, both groups showed different stages of microglial activation in small regions of the GM. The HC group had significantly increased microglial cell count, microglial cell body size, and decreased microglial process area in the HP. The LC group did not have significant changes in either microglial cell count or cell morphology in the hippocampal region. However, microglial activation patterns were not similar across different brain regions within the same group. Microglial cells were not significantly activated in the S1 of the HC group, whereas the LC group had slightly larger microglial cell bodies and cell process areas but no change in cell counts, indicating that these cells in the S1 in the LC group were at an intermediate stage of activation with hyper-ramified appearance.
Diffuse brain injury has been shown to potentially result in hyper-ramified microglia in brain regions further away from the impact site. 67 Correlation analysis of microglial morphological metrics and diffusion metrics have suggested that although NODDI and DTI metrics correlated with microglial morphological changes in a few areas, these relationships were not consistent across different brain regions. ODI was found to be consistently positively correlated with different microgliosis metrics only in the CPu. This positive correlation is consistent with findings in microglia-depletion studies in mice. 28 NDI was also found to have a positive correlation with microgliosis metrics in the CPu; MD was found to have a negative correlation with only microglial process-eroded cell body size and total microglial process area, and FA had no correlation. Other ROIs (the dentate gyrus, S1, and antcc) with significant signs of microgliosis were not found to correlate with the DTI/NODDI values significantly. These regions, unlike the CPu, had other accompanying pathologies besides neuroinflammation, such as tissue atrophy (the S1) or argyrophilic neurodegeneration (dentate gyrus and antcc). Because water diffusion is highly sensitive to a number of microstructural changes, and such changes in concussion are complex, influences of microgliosis in TBI on diffusion metrics might be obscured by other factors, and thus, limit the usefulness of DTI and NODDI in the detection of neuroinflammation in TBI. The specificity of DTI and NODDI for neuroinflammation may be restricted to neuroinflammation in the absence of other pathologies.
One of the interesting findings of this study is the increased FA in the GM of the LC group. FA changes in the GM are rarely reported; tract-based spatial statistics methods, such as that implemented in FSL's TBSS, 68 of voxel-wise analysis of DTI data exclude regions with FA below a set threshold, effectively excluding inferences of FA from the GM. Nevertheless, increased FA in the GM is known to be associated with persistent post-concussive symptoms following an mTBI in human patients, 69 suggesting this finding is consistent and relevant to a human concussion. DTI has been reported to detect GM changes after TBI, with increased FA in the GM correlating with astrogliosis in open-head controlled cortical impact injury 66 and repetitive mild blast exposure. 70 No significant increase in GFAP expression in the regions with increased FA in the LC group was observed in our samples, suggesting other factors contributing to the observed FA increase. Elevated FA in the GM has been shown to be a result of brain tissue compression in humans. 71 There was some evidence to suggest this might be the case in the LC group; decreased tissue volume found by TBM might have been a consequence of increased intracranial pressure and brain tissue compression. Nevertheless, the HC group also showed decreased tissue volume without corresponding FA increases.
GM regions in both concussion groups were found to have significant atrophy, and the degree of atrophy appeared to be progressive—quantitatively, more atrophy was found in the HC group compared with the LC group. The silver stain detected similar progressive changes—more argyrophilic neurodegeneration at higher impacts. Indicators of microgliosis showed less of such progressive changes in all ROIs; nevertheless, brain regions suffering the highest von Mises stresses in FEMs displayed more significant reactive “ameboid” microglia at higher impacts compared with low impacts. Intermediate stress regions showed less correlation between microgliosis and impact energy; this might be due to microglial activation at different times in different regions, depending on impact severity. In a recent study using the CHIMERA model, Bashir and colleagues showed microglia activation to peak at different time-points post-injury for different regions. 72
DTI changes were especially non-progressive—with increased FA in the LC group and decreased or no change in the HC group, and increased MD in the HC group but not in the LC group. This result was consistent with similar contradictory findings in human concussion (for review and meta-analysis, see the article by Eierud and associates 3 ). On the other hand, NODDI changes suggested a progressive trend from low to high impact thresholds. The LC group's NODDI metric changes were characterized by unremarkable changes in NDI and reduced ODI, whereas the HC group showed a significant decrease in both NDI and ODI. Our data suggest that although DTI might be more sensitive (and require fewer b-value shells and shorter acquisition time), as evidenced by a greater brain area detected to have DTI metric changes post-injury, NODDI metric changes provided greater specificity and a progressive change that corresponded to injury severity.
Recent studies have shown the possibility to differentiate different cortical layers in the mouse brain with NODDI metrics. 73 Layer 1, a molecular layer high in symmetrical apical dendritic tufts of cortical pyramidal neurons and the thalamocortical and cortical-cortical axons that innervate them, and a low density of neuronal bodies, had high ODI. 73 Layers 2, 3, and 4 formed a low ODI band in the cortex, followed by a high ODI band in Layer 5, which presumably reflects the low density of neuronal cell bodies and the isotropic distribution of basal dendrites of the large pyramidal neurons of Layer 5. 73 Averaged registered ODI images obtained from the NODDI fitting of our data showed this cortical laminar pattern (Fig. 3). Therefore, reduced ODI observed in the cortical area of both the LC group and the HC group could be interpreted as a reduction of the sprawling dendrites of the pyramidal neurons. Further reduction in the NDI was detected in the cortex of the HC group, presumably reflecting further damage that reduced the neurite volume fraction compared with the non-neurite fraction. Notably, the GM region with reduced ODI or both reduced ODI and NDI were also regions with notable tissue atrophy; thus, the damage to neurites and reduction of neurite density of cortical pyramidal neuron dendrites could be mechanisms for the observed GM atrophy. Nevertheless, this reduction was not confirmed in our silver stain and, thus, warrants further investigation.
TBM of structural MRI in this study revealed brain morphometry changed as early as 48 h post-injury. Although this might seem very quick, prior literature showed morphometric changes could happen in as early as 24 h post-intervention, though the underlying cellular mechanisms were not clear. 74 –76 Patterns of structural atrophy observed in concussed animals were not correlated with patterns of argyrophilic neuronal and axonal degeneration in the performed silver staining. This suggested that the atrophy was caused by mechanisms other than neuronal and axonal degeneration.
Another caveat is that ex vivo and in vivo volumetric analysis of the brain may produce different results, which are independent of imaging resolution but are strongly affected by the sample preparation, chemicals used for preservation, and storage duration. For example, the ex vivo total brain volume in a transgenic mouse model of Huntington disease (TG) shrunk at different rates compared with wild type (WT) (7.79% TG vs. 4.37% WT), and different regions in different strains of mice shrunk at different rates (striatum: 10.6% TG vs. 21.8% WT, hippocampus 0.62% TG vs. 7.42% WT). 77 Perfused and fixated brain samples' total brain volumes continually decreased for up to 6 months during storage; with different structures experiencing volume changes at different rates and to different extents over time. 78 GM structures showed volume changes up to 7% in either direction, and WM structures were found to have shrunk by 3% but also expanded as much as 5%. 78 Ex vivo imaging was more capable of detecting differences between transgenic and wild type mice, as well as the effect of doxycycline treatment in a mouse model of tauopathy by either TBM 79 or automated structural parcellation. 80 Despite its popularity, 81 there might be certain limitations in extrapolating ex vivo diffusion imaging to in vivo findings.
Of particular interest for advanced diffusion imaging methods that estimate different tissue compartments is the phenomenon where perfusion-fixation processes with aldehyde fixatives collapse the extracellular space. 82,83 This might have altered the estimated isotropic volume fraction and caused the water diffusion in the extracellular space to no longer be free isotropic diffusion and “contaminate” the signals from other tissue compartments.
Limitations
Due to the resolution constraints of the MRI, it was not possible to model the different parts of the brain as separate tissues. As a result, the brain was modeled as an isotropic, homogeneous, and hyperelastic material. Because GM, WM, and CSF have different mechanical properties, 84,85 and the cortical plate is separated from the subcortical area by a layer of WM, during rotational injuries the cortical and sub-cortical structures may “slide” over each other, representing the shearing component of axonal injuries. The CSF in ventricles would have also absorbed some of the impact energy, reducing injury-causing potentials. The large ventricle presence in slice 1 of Figure 1, not modeled in FEM, might have overestimated the stress in the brain regions in that slice. WM integrity, quantified by diffusion imaging, at gray-white matter boundaries, may represent diffuse axonal injury associated with TBI, 86,87 indicating the potential for greater clarity in future FEA studies with better segmentation and modeling of different tissue types in the brain.
The olfactory bulb was found to have large variation and change in von Mises strain with FEA in the HC but to a much smaller extent in the LC condition (Supplementary Fig. S2). The olfactory nerve was reported to have argyrophilic neurodegeneration in the CHIMERA model previously. 18,20 This suggested an important anatomical and functional area with large difference in injury at different impact thresholds. Nevertheless, the area was outside the scope and coverage of our MRI and histological examination but remains a potential avenue for further research.
MRI scans were performed on fixed and extracted brains, which allowed for extended scan time and higher resolution; however, ex vivo scans may not be easily translatable to the in vivo condition due to the various reasons discussed above. This study's diffusion imaging sequence used a lower angular resolution of diffusion gradients (12 directions) as compared with other more routine clinical studies; thus, NODDI sensitivity was potentially limited. On the other hand, Ni and co-workers demonstrated that different numbers of diffusion-encoding gradient directions resulted in largely similar MD and FA values, although specific eigenvalues were preserved to a lesser extent. 88 The majority of DTI metric changes were observed with MD and FA values in our studies.
A similar study comparing the effect of the number of diffusion directions on NODDI metrics reported that additional noise (greater dispersion of values) was introduced into ODI and NDI with a lower number of diffusion directions 27 ; however, NDI was better preserved and had less noise introduced than ODI. Because additional noise and dispersion of the estimated metrics reduces the statistical power, it is arguable that as DTI and NODDI are able to detect differences with 12 diffusion directions, a greater number of diffusion directions (approaching routine clinical use) would only reinforce the validity of the two methods. This might be another reason that the spatial patterns of NODDI metric changes were not correlating well with FEM stress patterns. Another limitation of this study is the lack of the application of a comprehensive battery of behavioral assessments and in vivo imaging. Future studies of the same model would incorporate other behavioral assessments, such as the neuro severity score (NSS) 89 for general balance and motor function and active place avoidance task for working memory and cognitive function, 90 in conjunction with in vivo imaging.
Conclusion
To the best of the authors' knowledge, this is the first study combining FEM, volumetric imaging, DTI, and advanced NODDI at ultra-high magnetic fields to investigate the microstructural changes in a mouse model of concussion. We demonstrated the potential of DTI and NODDI at 16.4 T to detect brain changes following a concussion, as well as classify concussions of different intensities. The findings have significant translational prospects for the detection of the inherently variable phenotype of concussion in humans.
Footnotes
Acknowledgments
We thank Eugene Kochnieff, J.P. and John Steptoe (Queensland Brain Institute Workshop, The University of Queensland) for building the impactor device. We also thank Mahadeeswara Mandiyam (Queensland Brain Institute, The University of Queensland) for technical assistance in acquiring the high-speed footage. We acknowledge the support from the Queensland NMR Network and the National Imaging Facility (a National Collaborative Research Infrastructure Strategy capability) for the operation of 16.4 T MRI and utilization of image processing computational resources at the Center for Advanced Imaging, The University of Queensland. The brightfield light microscopy imaging was performed at the Queensland Brain Institute's Advanced Microscopy Facility using the Axio Imagers and ZEISS ZEN software. Confocal fluorescent microscopy imaging was performed using a Yokogawa Spinning Disk confocal microscope and the SlideBook software.
Funding Information
This research was supported by the Motor Accident Insurance Commission (MAIC), the Queensland Government, Australia (grant number: 2014000857).
Author Disclosure Statement
No competing financial interests exist.
Supplementary Material
Supplementary Figure S1
Supplementary Figure S2
Supplementary Videos
References
Supplementary Material
Please find the following supplemental material available below.
For Open Access articles published under a Creative Commons License, all supplemental material carries the same license as the article it is associated with.
For non-Open Access articles published, all supplemental material carries a non-exclusive license, and permission requests for re-use of supplemental material or any part of supplemental material shall be sent directly to the copyright owner as specified in the copyright notice associated with the article.