
Abstract
Intracranial pressure (ICP) is an important parameter to monitor in several neuropathologies. However, because current clinically accepted methods are invasive, its monitoring is limited to patients in critical conditions. On the other hand, there are other less critical conditions for which ICP monitoring could still be useful; therefore, there is a need to develop non-invasive methods. We propose a new method to estimate ICP based on the analysis of the non-invasive measurement of pulsatile, microvascular cerebral blood flow with diffuse correlation spectroscopy. This is achieved by training a recurrent neural network using only the cerebral blood flow as the input. The method is validated using a 50% split sample method using the data from a proof-of-concept study. The study involved a population of infants (n = 6) with external hydrocephalus (initially diagnosed as benign enlargement of subarachnoid spaces) as well as a population of adults (n = 6) with traumatic brain injury. The algorithm was applied to each cohort individually to obtain a model and an ICP estimate. In both diverse cohorts, the non-invasive estimation of ICP was achieved with an accuracy of <4 mm Hg and a negligible small bias. Further, we have achieved a good correlation (Pearson's correlation coefficient >0.9) and good concordance (Lin's concordance correlation coefficient >0.9) in comparison with standard clinical, invasive ICP monitoring. This preliminary work paves the way for further investigations of this tool for the non-invasive, bedside assessment of ICP.
Introduction
Intracranial pressure (ICP) is a biomarker that is routinely monitored in many neurocritical care patients and in certain types of disorders of cerebrospinal fluid (CSF) dynamics. Typically, ICP is measured invasively by implanting an intracranial sensor through a burr hole or a twist drill in the skull. However, this procedure is associated with a risk of infection and/or hemorrhagic complications. 1 Because the procedure is invasive, ICP is only monitored in patients with critical pathologies such as traumatic brain injury (TBI), subarachnoid hemorrhage, and difficult cases of hydrocephalus for which the benefit of continuous ICP monitoring outweighs the risks. For example, continuous, invasive ICP monitoring is recommended in patients with severe TBI, because it has been established that, as a secondary injury, raised ICP is a cause of neurological deterioration and is related to an unfavorable neurological outcome. 2 The monitoring of ICP allows clinicians to manage elevated ICP via a set of interventions. In other conditions such as difficult cases of hydrocephalus, ICP monitoring helps clinicians to decide whether a CSF shunt is required or not.
As another potential application, ICP monitoring may also be relevant for the management or diagnosis of other neurological conditions in different populations, especially in pediatric populations, 3 in patients affected by certain pathologies such as acute liver failure, 4 or in patients with moderate TBI, large hemispheric ischemic stroke, or aneurysmal subarachnoid hemorrhage. However, routine ICP monitoring is not recommended in these cases because of its aforementioned risks. To overcome this limitation, over the past 40 years, several non-invasive techniques of ICP monitoring have been proposed, but no method has been accurate enough to be widely implemented in clinical practice. 1,5,6
The spontaneous fluctuations of the pulsatile cardiac component of cerebral blood flow (CBF) is often considered as a non-invasive surrogate for ICP. 1,5,6 To that end, transcranial Doppler ultrasound (TCD) has been widely utilized as a tool to try to estimate these changes based on the measurement of the blood flow velocity in a major artery. A detailed overview of those techniques can be found in a study by Cardim and coworkers, 7 in which the use of simple parameters such as the pulsatility index (PI) — the difference between systolic and diastolic blood flow velocities normalized by the mean blood flow velocity — have been reported alongside more advanced models and methods including machine learning models, both in the supervised and unsupervised sense, to predict cerebral perfusion pressure (CPP). We note that most of these models require a reliable, beat-to-beat measurement of arterial blood pressure (ABP) as an input parameter.
Unfortunately, despite major advances in head gear and robotic control of transducers, TCD is not yet a practical technique, because of its operator dependence, motion sensitivity, and the lack of a usable bone window insonation in a significant number of the patients. 7,8 The need for non-invasive, practical ICP monitoring is still unmet, and it has motivated researchers to explore the potential of diffuse optical techniques such as near-infrared spectroscopy (NIRS) 9 as other alternative surrogate measures.
NIRS was first used in neurocritical care as a monitor for detecting the desaturation of cerebral blood oxygenation with a better time resolution than the widely used venous saturation in the jugular bulb (SjO2). 10 In these studies, the underlying assumption was that cerebral oxygen saturation is a surrogate for reductions of CBF that may be caused by elevated ICP. Hence, the results were an indirect and imprecise estimator of high ICP under certain conditions. It has also been shown that changes in the NIRS signal indicate that hemoglobin desaturation is related to changes in ICP. 11,12 However, the NIRS approach is limited because it is only an indirect index of episodes of raised ICP that influence brain oxygen desaturation and it is also heavily influenced by other variables such as mean ABP (MABP), arterial oxygen saturation (SaO2), and hemoglobin content. Typical NIRS measurements do not allow for absolute measures of ICP and, therefore, its clinical adoption requires building up new evidence and guidelines because the current guidelines for conditions such as severe TBI management algorithms are based on absolute ICP thresholds. 13
There is an emerging complementary approach to traditional NIRS, diffuse correlation spectroscopy (DCS), which is also a near-infrared, diffuse optical technique that instead measures a blood flow index (BFI) in a non-invasive and continuous manner, to directly retrieve the microvascular CBF by quantifying laser speckle statistics. 14 Recent progress in DCS technology allows for fast measurements (∼10–100 Hz) capable of resolving the pulsatile behavior of blood flow caused by the cardiac cycle. 15,16 It has been suggested, in a similar manner to TCD methods, that one can now utilize beat-to-beat variations in the CBF signal with additional beat-to-beat information of the ABP to estimate critical closing pressure (CrCP) as a surrogate for ICP. 17,18 Preliminary results have shown a good correlation of DCS measures with ICP values in infants with hydrocephalus. 19 The main disadvantage of this approach is that continuous measurements of CrCP require continuous and reliable ABP measurements, which are often not readily available.
In our work, we have been motivated by the fact it is well known from previous work with TCD that the CBF waveform is significantly altered because of external influences of ICP on the vasculature with a complex and non-linear relationship. 20 In fact, previous studies have shown that ICP and intracranial compliance can be estimated by TCD-based measures 21 or by using the waveform morphology of the pulsatile ICP signal using machine learning methods. 22,23 Therefore, we have hypothesized that a non-linear, autoregressive, machine learning model can identify a system that maps the pulsatile CBF onto the ICP. A recurrent neural network (RNN), which is a type of neural network, is a suitable method for this type of time dependent data and was selected for our purpose.
Here, we present data of a proof-of-concept study in which we have employed an RNN- based method that maps the pulsatile, microvascular CBF that was measured non-invasively by DCS to the invasive ICP measurements conducted by conventional intracranial extradural or intraparenchymal ICP sensors. We demonstrate the capabilities of the model in a population of infants with external hydrocephalus and in another population of adults with severe TBI.
Methods
Clinical populations
Pediatric population
This part of the study was conducted at the Neurosurgical Pediatric Unit of the Vall d' Hebron University Hospital (Barcelona, Spain). The study protocol was approved by the local ethical committee (PR[AMI]459/2017). Infants between 0 and 42 months of age, initially diagnosed with “benign” enlargement of the subarachnoid spaces (BESS) were recruited for the study. The parents of the infants gave their informed written consent.
Patients diagnosed with BESS presented a combination of macrocephaly or an abnormal acceleration in the growth of the head circumference along with associated clinical symptoms such as delays in psychomotor development and irritability. All patients had a moderate dilation of the ventricular system. ICP was continuously monitored using an extradural device to confirm the diagnosis of external hydrocephalus and decide if the child required a CSF shunt. A DCS probe was applied to the frontal lobe on the same hemisphere where the ICP probe was placed, for a minimum of 30 min after the infant fell asleep.
Adult population
The second part of the study was conducted at the Neurotrauma Intensive Care Unit of the Vall d'Hebron University Hospital (Barcelona, Spain). The study protocol was approved by the local ethical committee (ACU-AT-203/2012[3531]). Written informed consent was obtained from the next of kin of the patients. Patients admitted to the neurotrauma care unit >18 years of age with a moderate or severe TBI (admission Glasgow Coma Score ≤13) requiring mechanical ventilation and ICP monitoring were eligible for this study. Pulsatile CBF was measured for at least 30 min on one frontal lobe, usually on the same hemisphere where the cranial sensors were implanted (parenchymal ICP, brain tissue oxygen pressure [PtiO2] and cerebral microdialysis). The presence of an open wound, extensive sutures, craniectomy, and other issues that hinder reliable optical measurements or the probe placement was the reason for the utilization of the contralateral hemisphere for the measurements. All patients were sedated at the time of the measurement. We note that these patients were enrolled in a larger study related to non-invasive transcranial, bedside monitoring of hemodynamics with optics. Therefore, some of the data recorded was taken during patient manipulations, such as changes in head-of-bed position, or during a protocol of hyperventilation, as indicated in the Results and Discussions sections when relevant.
Both studies were conducted following the principles of the Declaration of Helsinki.
Optical method and instrumentation
A DCS system 14 was developed for this study, consisting of a long coherence laser at 785 nm (iBeam smart WS, Toptica Photonics AG, Germany), eight single-photon avalanche diodes (2x SPCM-AQ4C, Excelitas Technologies, Canada) and a custom hardware correlator (CM 8, HemoPhotonics S.L., Spain). The custom hardware correlator allows for fast measurements up to 100 Hz, but the acquisition rate was set to ∼40 Hz to ensure a sufficient signal quality while still being able to sufficiently resolve the details of the pulsatile blood flow.
A custom-made optical probe with a source-detector separation of 2.5 cm was developed. The probe consisted of a foam piece as the main body and incorporated a 90 degree bent multi-mode fiber (Fiberoptic Systems Inc., USA) for the source as well as a 90 degree bent fiber bundle (Fiberoptic Systems Inc., USA) with seven single-mode fibers for the detection of the light.
The time course of the CBF was obtained by applying the modified Beer–Lambert law for blood flow. 24 The signal-to-noise ratio was increased by averaging the signal of the seven channels. 15 The first 5 min of each measurement were used as a baseline for the analysis. In order to increase the sensitivity to the brain, we have considered only early delay times of the normalized electrical field correlation function g 1 for the calculation of the BFI following g 1 > 0.63 for an average correlation curve of the baseline. 25 As optical properties, we have assumed a reduced scattering coefficient of 10 cm−1 and an absorption coefficient of 0.1 cm−1 for all the analysis. The calculated BFI time course was used as the input to the neural network.
Intracranial pressure sensors and signal synchronization
In the pediatric patients with suspected external hydrocephalus, ICP was measured with an epidural sensor (NEURODUR-P®, Raumedic AG, Germany). In the TBI population, the ICP was measured using an intraparenchymal sensor (Neurovent-PTO®, Raumedic AG, Germany or Camino®, Integra LifeSciences, USA). Both were part of the routine clinical care of the patients.
In both cases, the optical signals and the ICP measurements were synchronized using the LabChart software v7.0.3 (ADInstruments, New Zealand) and the data acquisition hardware PowerLab (ADInstruments, New Zealand). The ICP signal was directly fed from the ICP monitor to PowerLab and the correlator sent a 10 Hz digital signal to PowerLab as a timing basis.
Learning architecture and algorithm
The algorithm and the neural network were implemented in Python 3.5.2 and PyTorch 1.0.0. The model was trained on a GeForce GTX-1080 GPU (Nvidia Corporation, USA) with 8 GB of memory.
As previously noted, we have used an RNN to model a system generating an ICP estimate using the time series of the pulsatile CBF as an input. The results from a gated recurrent unit (GRU) 26 architecture are reported because of reduced memory and computational restraints, with a similar performance as other architectures such as long short term memory (LSTM) networks. 27,28 We note here that this type of neural network is designed for sequential data and does not require independent inputs. 29
Because of the limited number of the patients who were planned, we have used a 50% holdout validation method, otherwise known as “random sample splitting validation.” Here, the 50% of the data was randomly assigned for training, and the other 50% was used for testing. The algorithm was implemented on a windowed basis, meaning that windows of data – as will be detailed – from a subject's time course of pulsatile CBF were used as the input to the neural network and an ICP estimate was predicted for each window.
The general flow chart for training and testing our model is shown in Figure 1. The data was first pre-processed by low pass filtering the raw data (sampling rate ∼40 Hz). The filter had a cutoff frequency of 7 Hz in order to capture at least three harmonics of the heart rate while retaining low frequency data such as the fluctuations induced by the respiratory rate. The same filtering method was applied to the ICP data. Then, the entire filtered time course of the CBF with NM
measurements was windowed in NW
sections of several cardiac cycles with a length LW
of 600 measurements, or roughly 15 sec, given the acquisition rate of ∼40 Hz for one measurement. A moving window was performed with a stride of
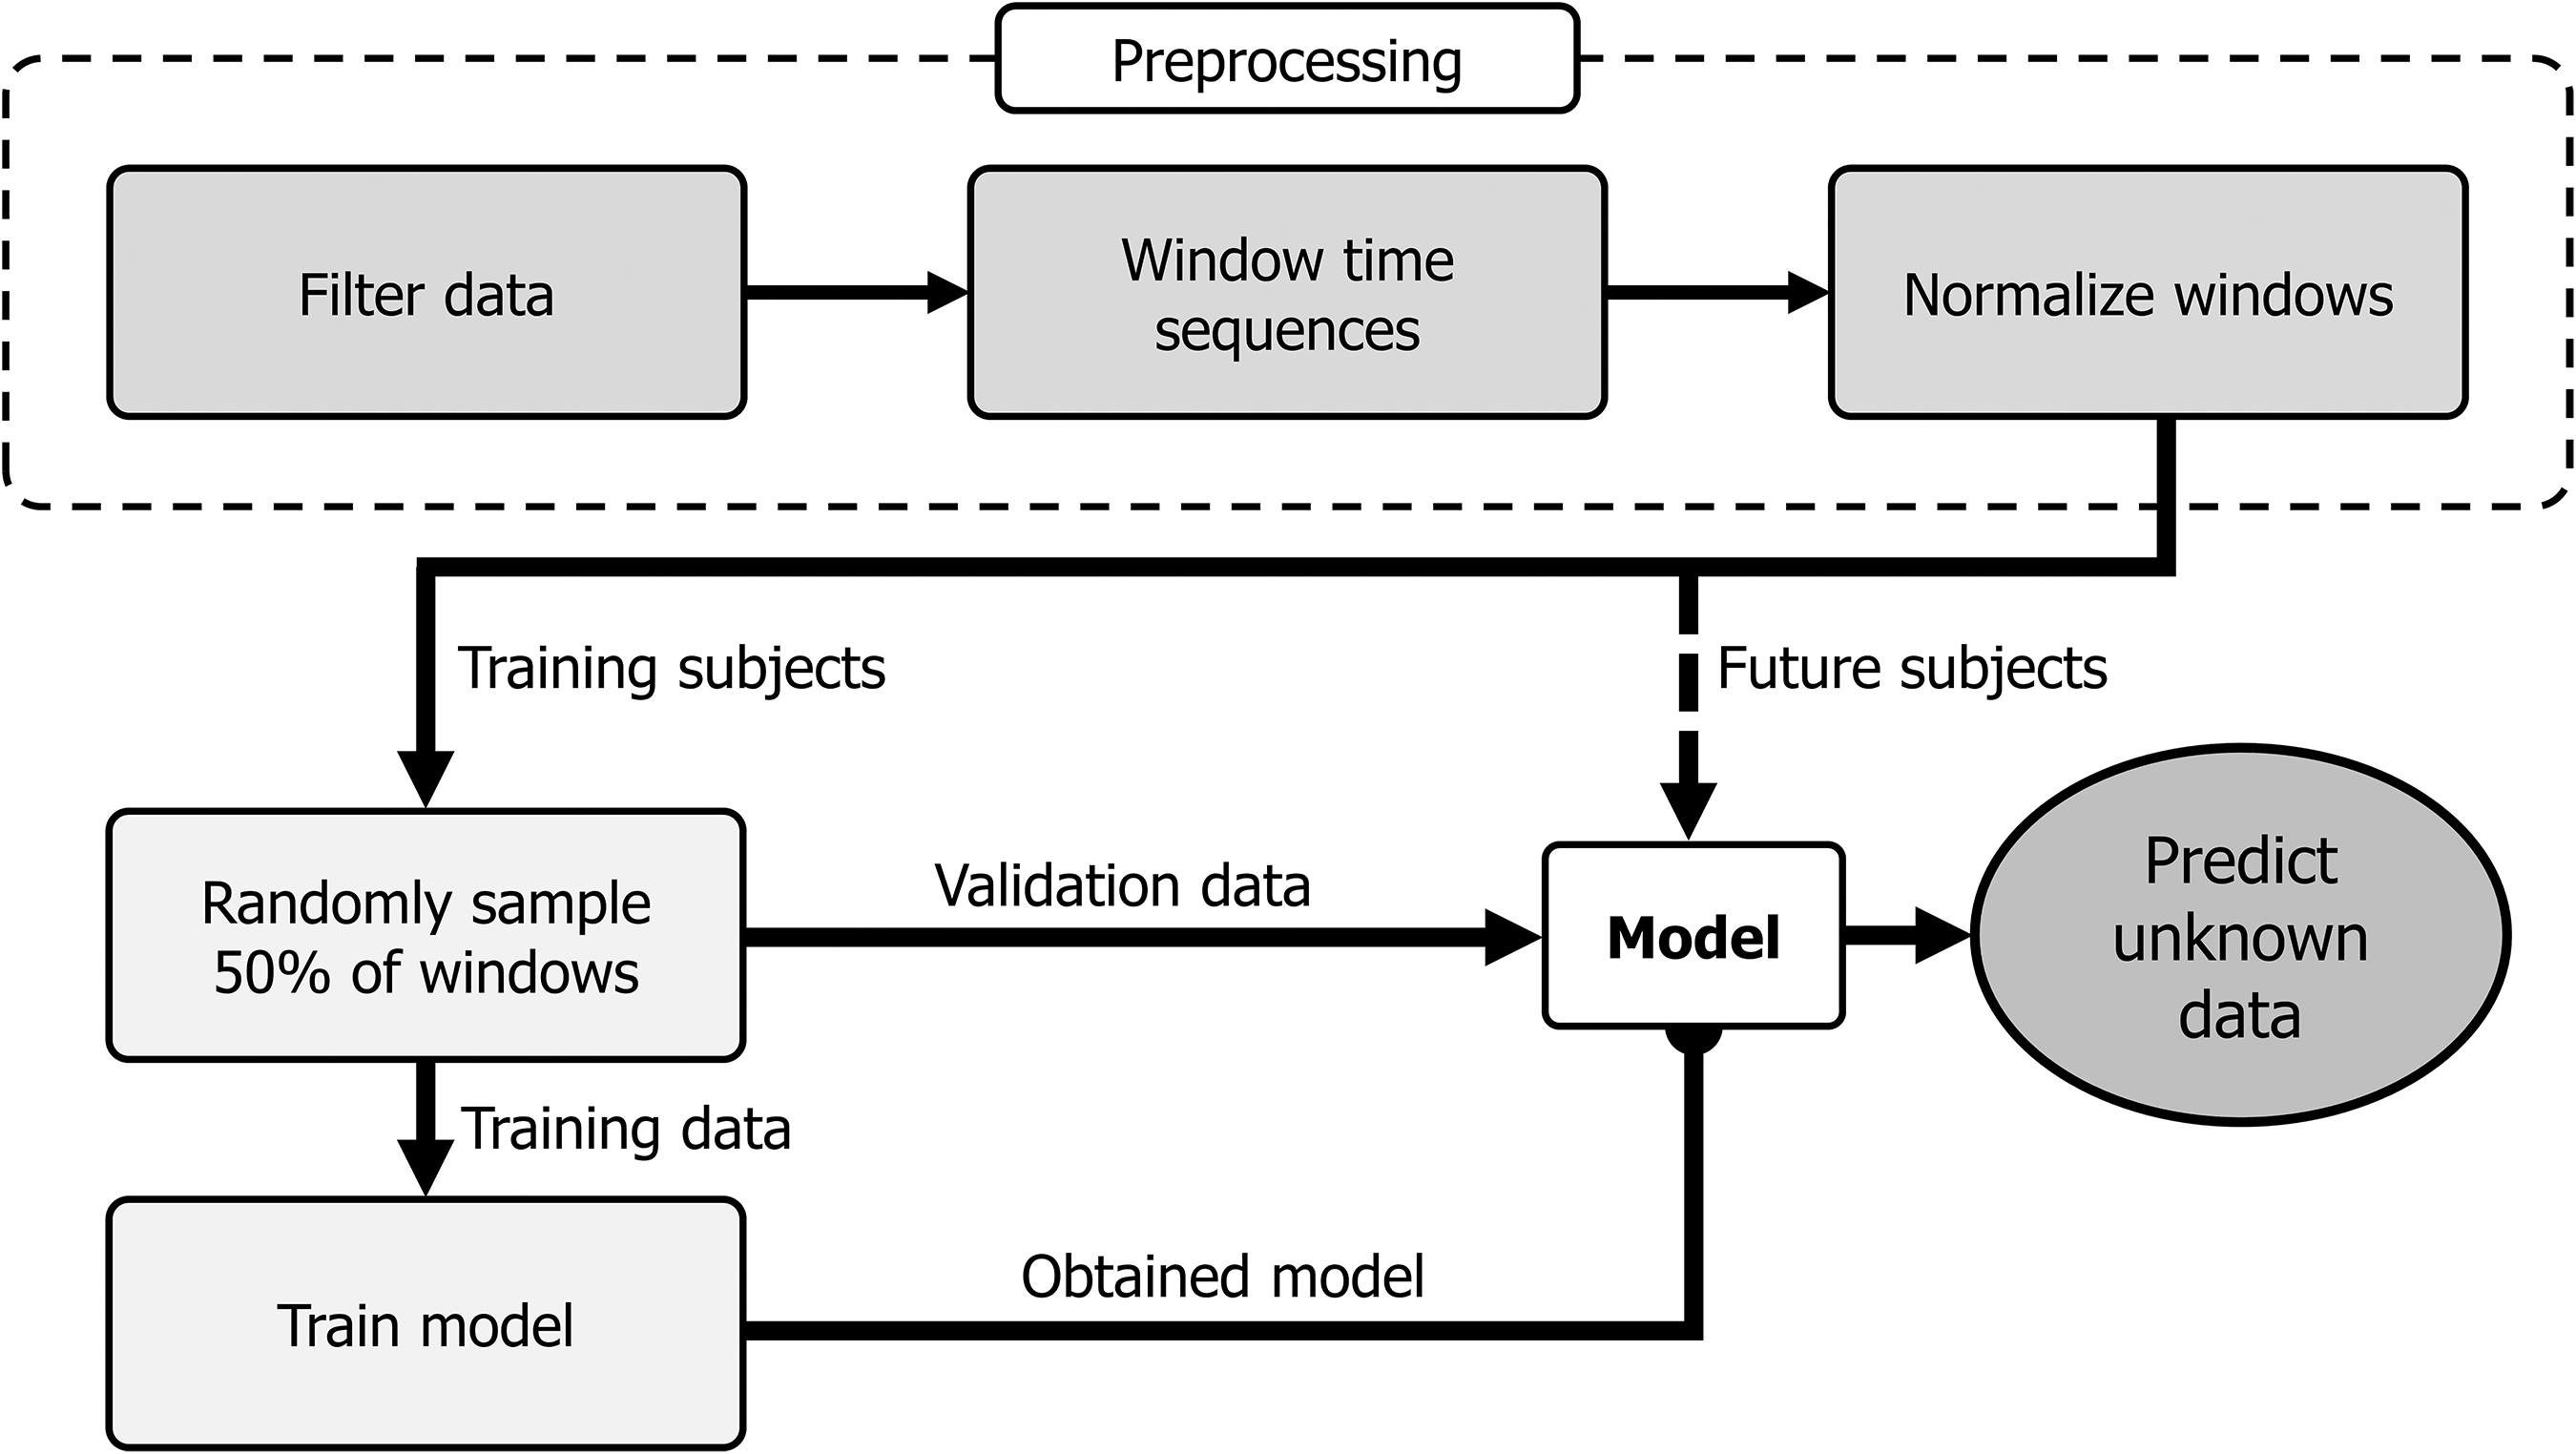
Algorithm flow chart. After pre-processing, the model is trained with up to 50% of the data as the training set, to simulate a “weak learner.” The validation data and additional subjects can be evaluated by applying the obtained model. The normalized windows of the pulsatile cerebral blood flow (CBF) are the input to the model. See text for further details.
The general architecture of the RNN model and how the windows are fed into the network is shown in Figure 2. All hyperparameters of the network were empirically determined. The pre-processed windows with a length of LW
shown in blue were subsequently passed into the algorithm in subwindows (
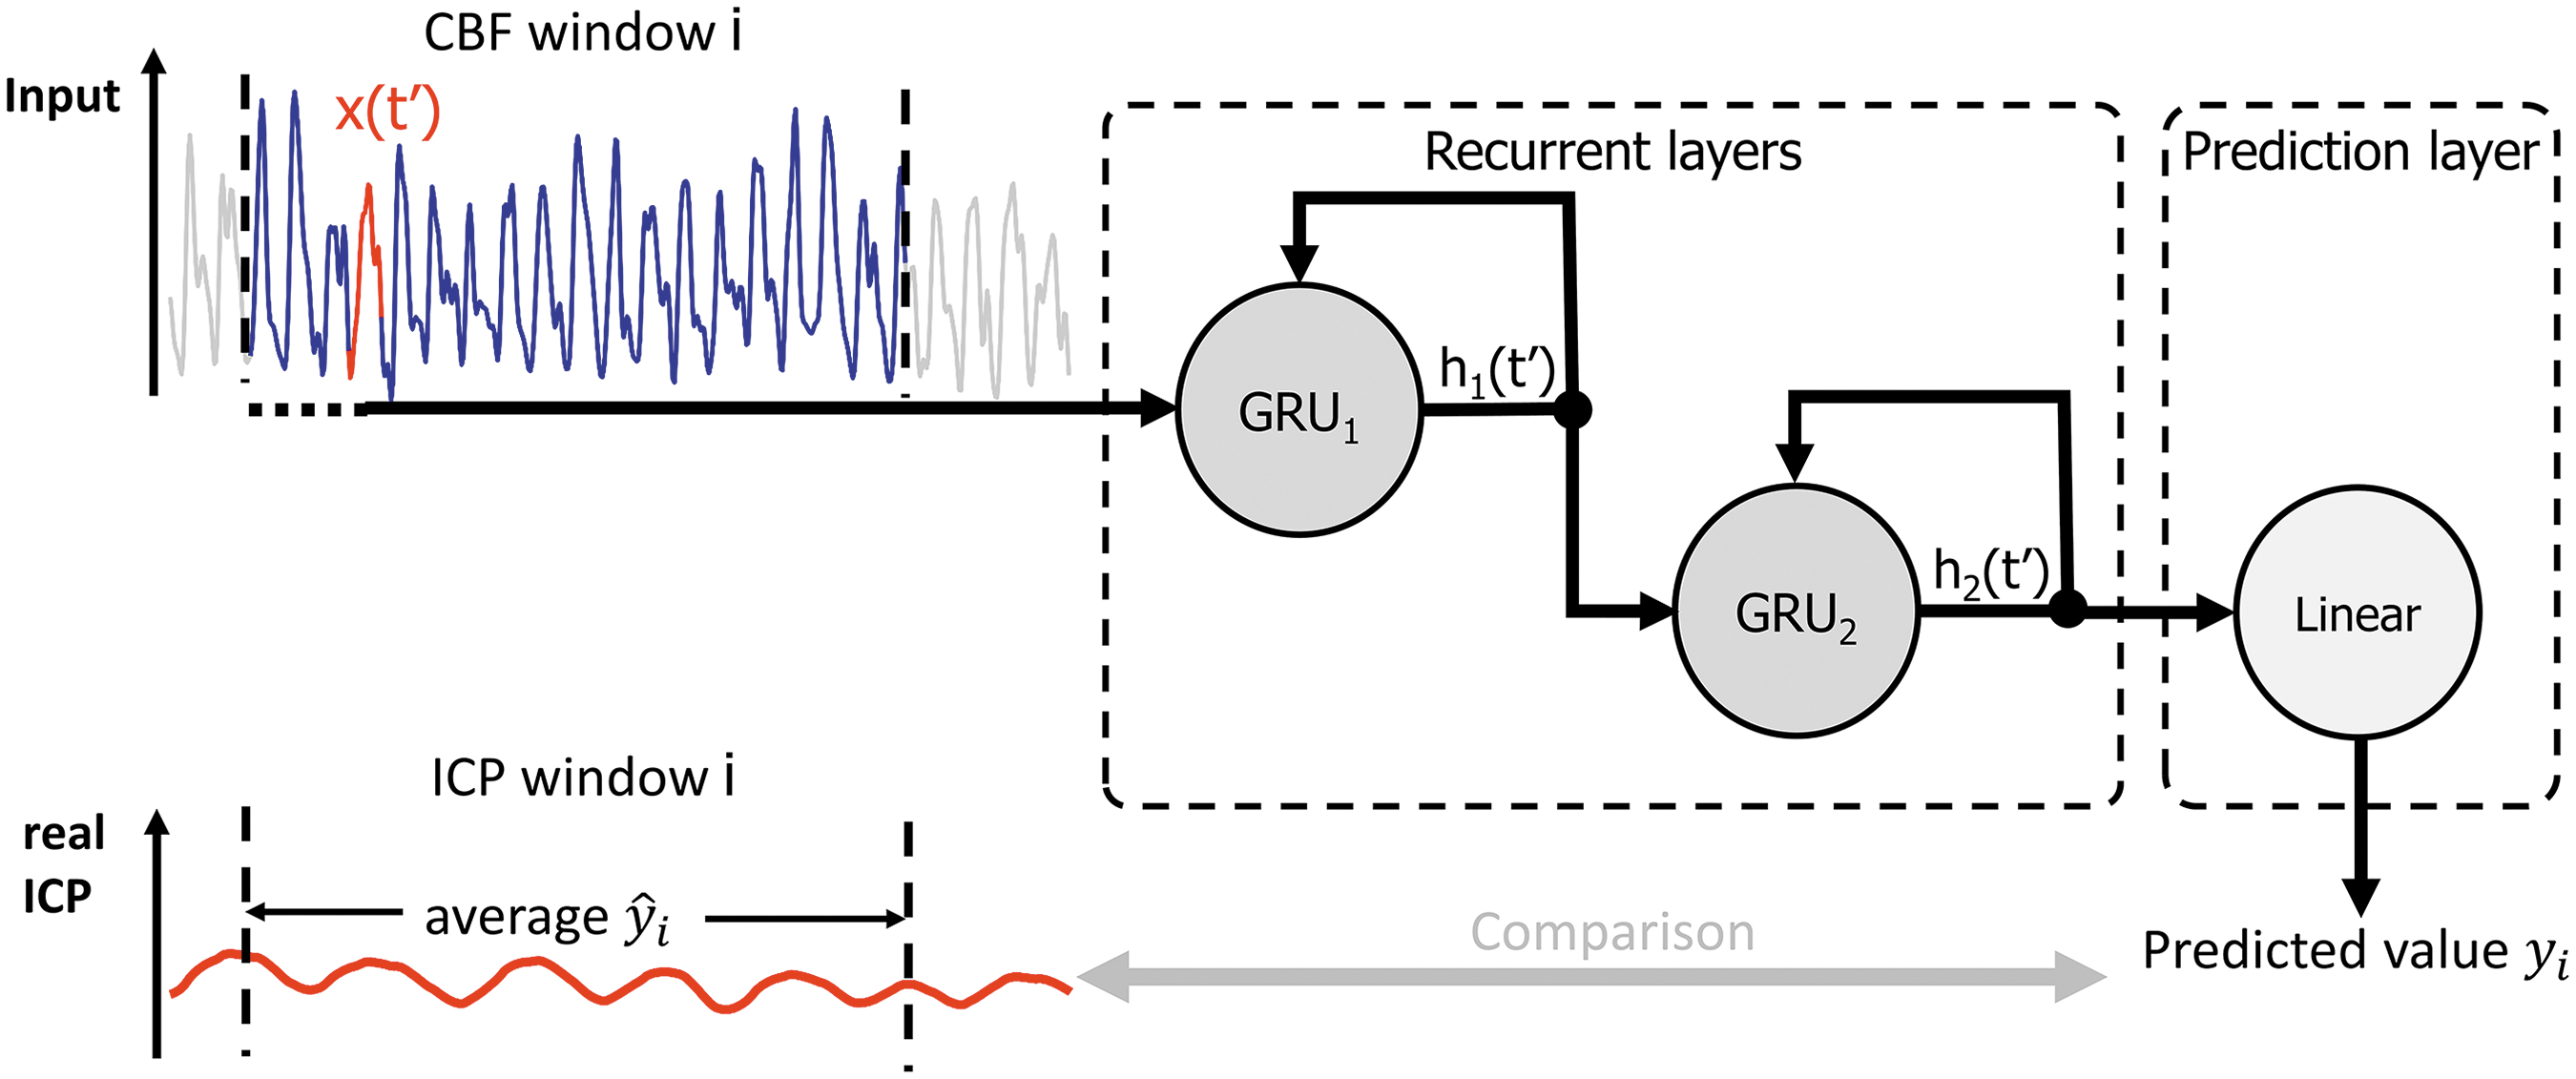
Schematic structure of the recurrent neural network (RNN). A window (blue) of the pulsatile cerebral blood flow (CBF) is fed sequentially with subwindows (red) into the input layer. The RNN consists of a multi-layer structure with two gated recurrent unit (GRU) cells followed by a prediction layer, with a linear cell to predict one intracranial pressure (ICP) index for the said CBF window. This index can be then compared with the average of the same window of the ICP time series, which can also act as a label (a ground-truth value for a certain set of features) when the model is trained. The definitions for
Back-propagation, which is the algorithm to calculate the gradient of the error function, was used at the last time step of a window to calculate the gradient of the error with respect to the weights of the network. This allowed for stochastic gradient descent, particularly the Adam algorithm, to optimize the weights of the neural network. 30 Here, we have used a learning rate of 10−3, which is a parameter that controls how fast the model learns by setting a fixed amount of change for each step in the process. One hundred epochs were used to train the model, where one epoch represents the full presentation of the training set to the network to update the weights. The learned weights of the network were stored for the analysis of the validation data set.
After the training, the obtained model was used and ICP was predicted for the entire CBF time traces. The predicted ICP time series was binned in 30 sec bins (∼ 45 windows) to improve the signal-to-noise ratio. By doing so, the 30 sec bins may contain data from both training and validation in the same bin (because of random sampling). In these cases, the majority (i.e. >50%) was identified and used for assigning the bin to the particular group. For completeness, we have also used an analysis of strict, 100% inclusion criteria and investigated whether there are any substantial changes in the results.
CBF pulse morphologies
In order to showcase the effect of ICP on the observed CBF traces, we have picked example input windows of high and low ICP periods and calculated an average pulse shape for each window. As already described in the section Learning architecture and algorithm, the input windows are standardized with a standard deviation of one and zero mean. The average shape of the CBF corresponding to a single heartbeat within this window was calculated by using a peak detection (findpeaks, MATLAB, MathWorks, USA) to find the diastole as the starting point, and an offset on the y-axis was added such that the waveform starts at zero to provide a measure of the pulse height.
Statistical analysis
The analysis of the data was conducted with MATLAB (MathWorks, USA). Each data point of the predicted ICP represents an average value derived from the aforementioned 30 sec bin for both invasive and non-invasive data. For the statistical analysis, we report results only from data that were included in the validation set of the said 30 sec bins.
We have checked for the correlation between the non-invasive estimation of an ICP and the real measured ICP. The slope and the intercept are reported with their 95% confidence interval (CI). Further, we present the Pearson's (R) correlation alongside Lin's concordance correlation coefficient (
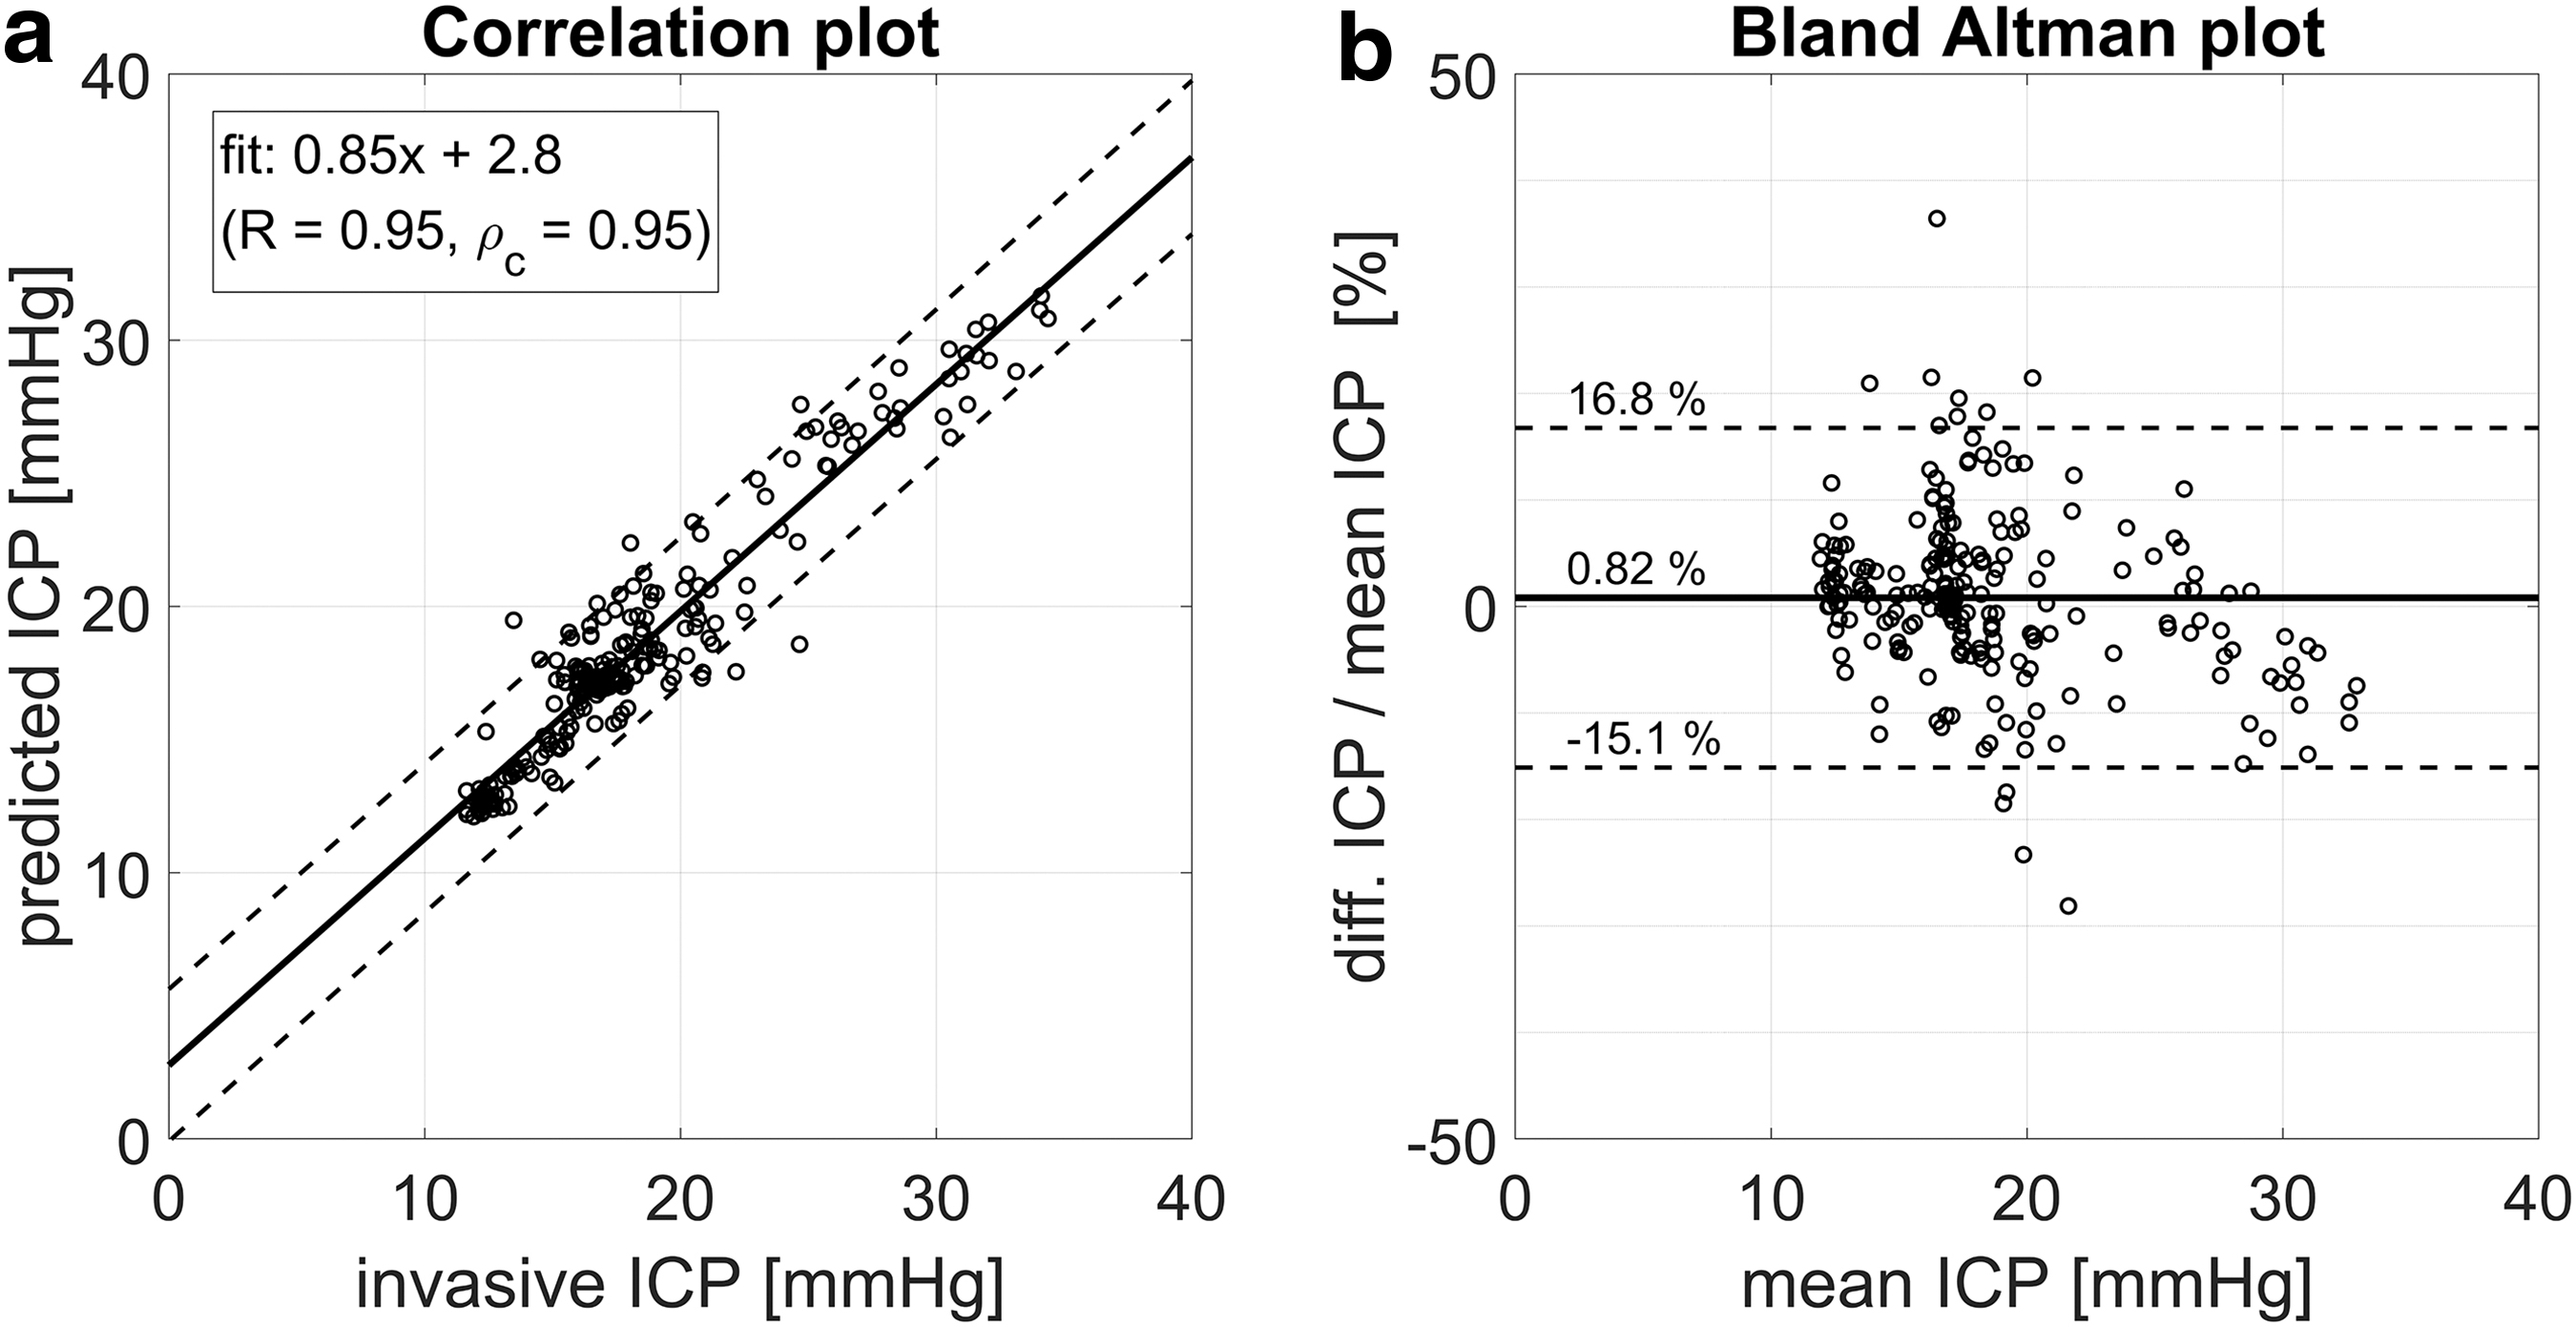
A Bland–Altman analysis was used to to check for the agreement of both methods by looking at the differences between the DCS method and the gold standard. 32 In particular, we have calculated the Bland–Altman plot for the differences as a percentage ([non-invasive ICP − invasive ICP] / mean ICP × 100%) in order to detect potential systematic bias at low or high ICP values.
For a more complete picture of the data, we provide supplementary materials with further subject-specific information such as the distribution of the ICP for each subject as well as all the time traces showing the ICP measured, with the invasive sensor compared with the non-invasively estimated ICP.
Results
Illustration of CBF pulse morphologies
As an illustration of the input data to the proposed method, Figures 3 and 4 show (a) CBF input windows corresponding to a randomly picked low (blue) and a high (red) ICP value and (b) the average waveform shape of the windows in (a) for a BESS and a TBI subject, respectively. The shaded area represents the standard error of the mean.
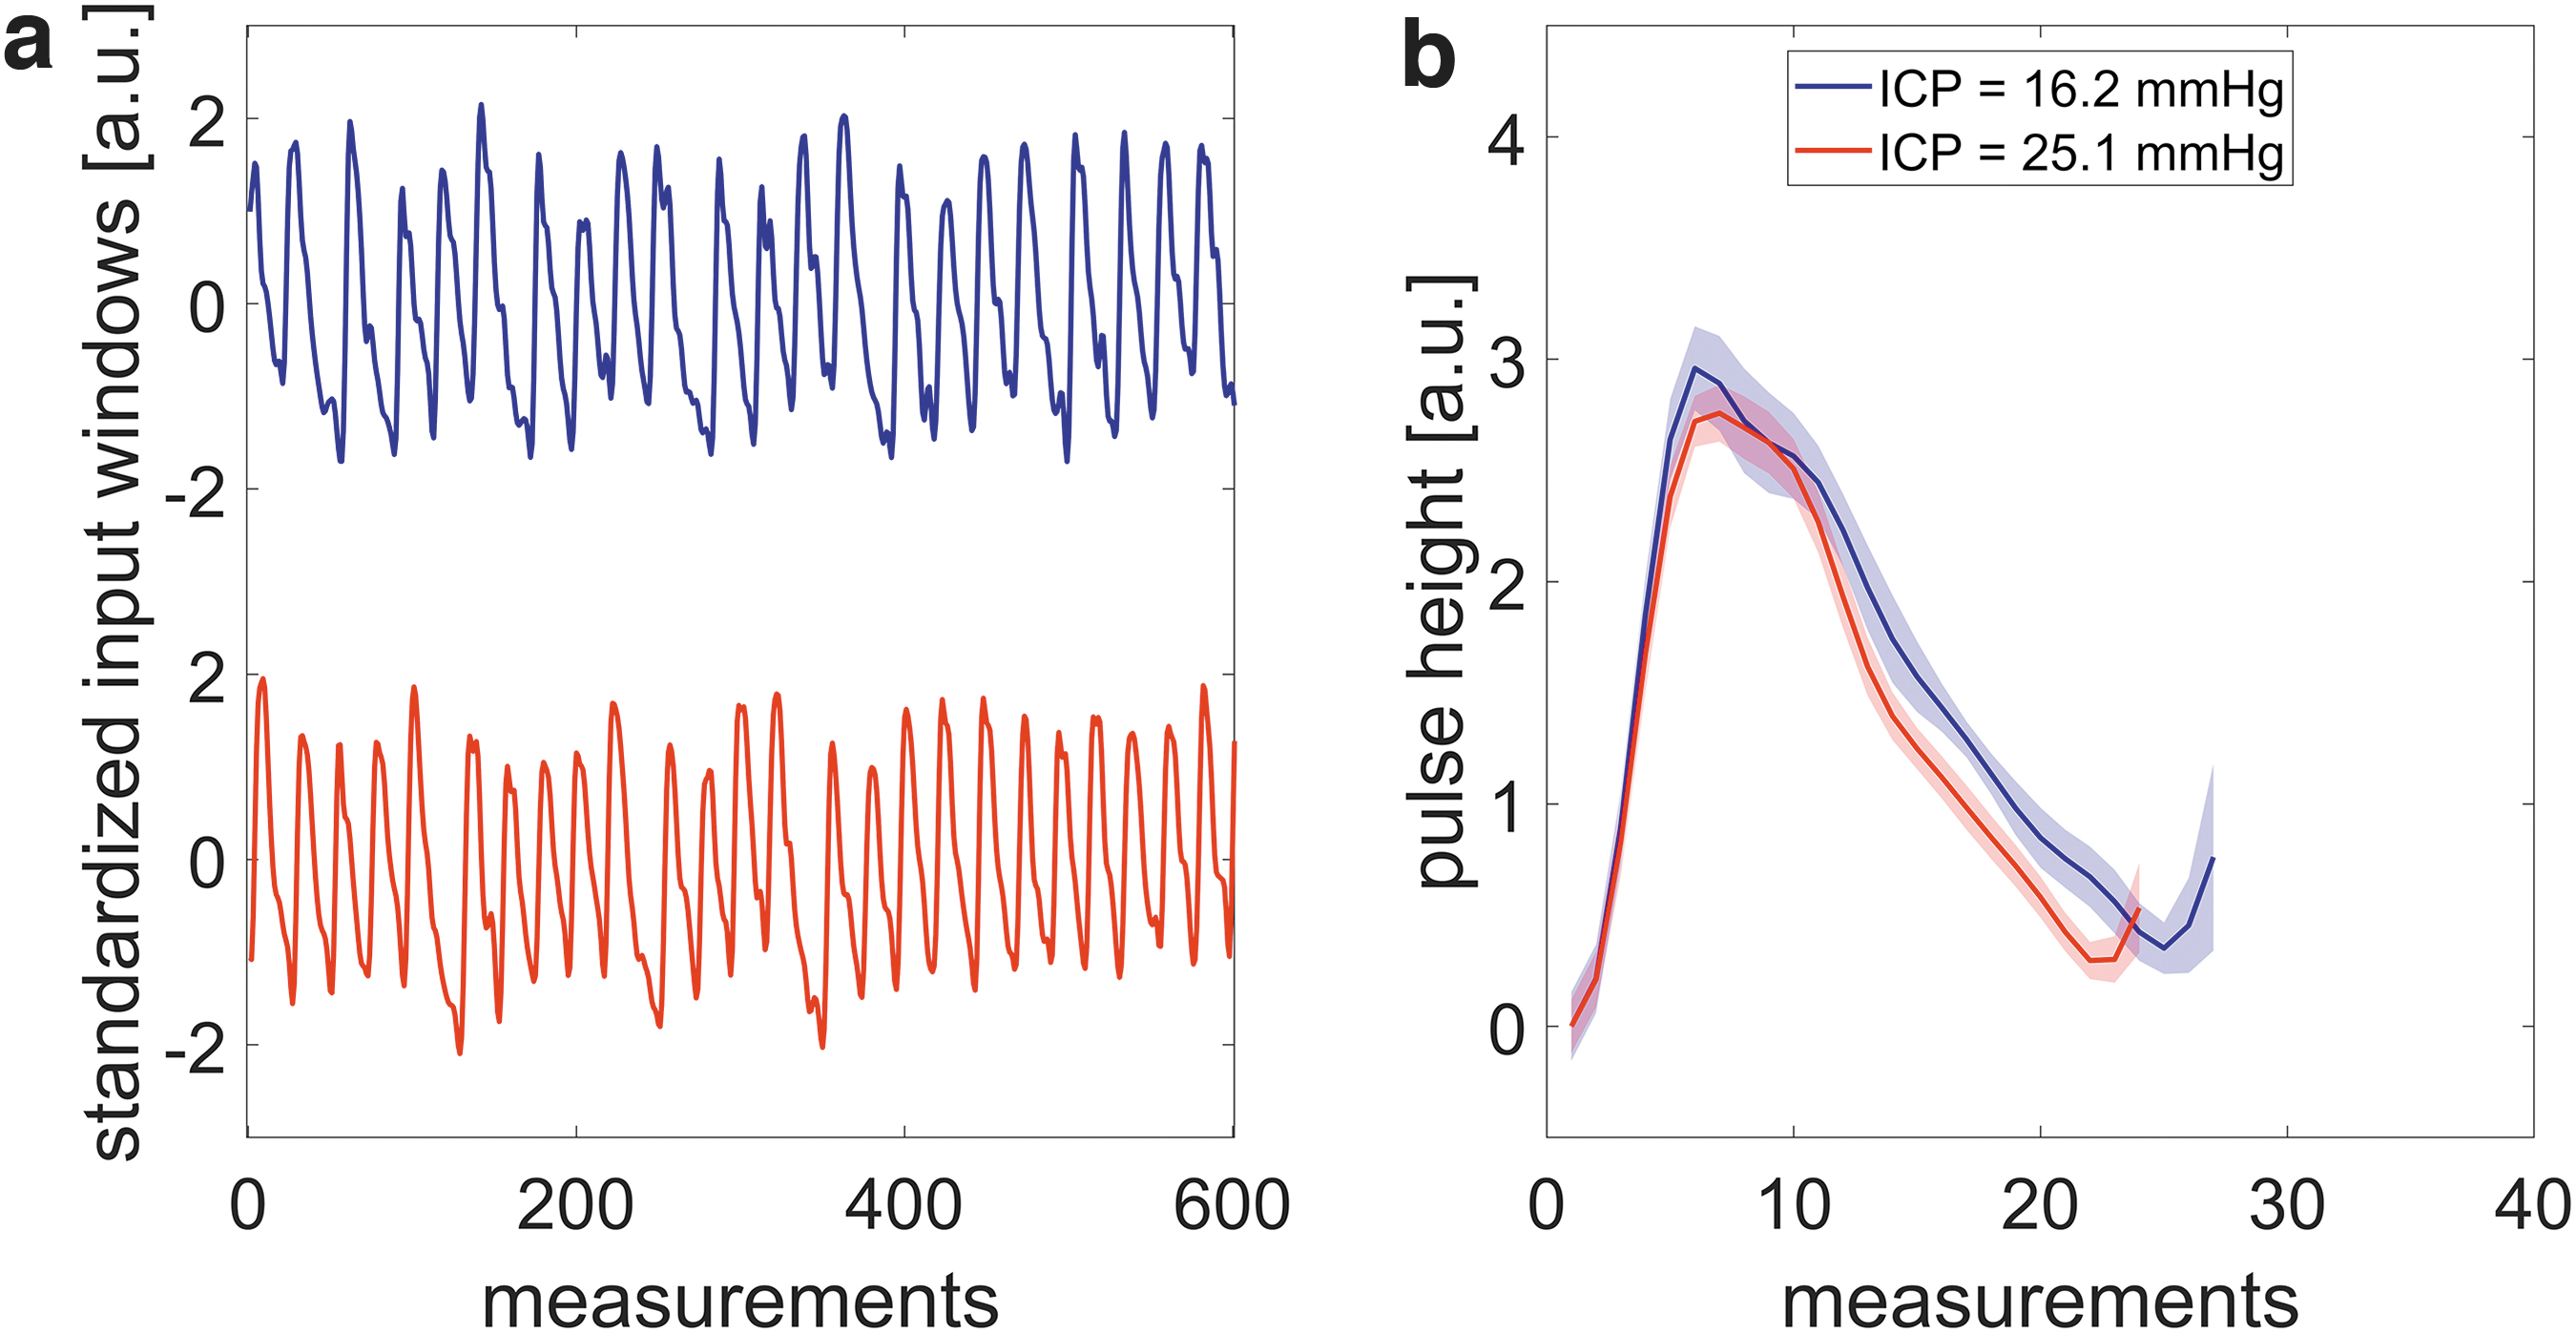
Illustrative example of cerebral blood flow (CBF) time traces in an input window for low (blue) and high (red) intracranial pressure (ICP) of “benign” enlargement of the subarachnoid spaces (BESS) subject B2. The average ICP value corresponding to the window is shown in the legend.

Illustrative example of cerebral blood flow (CBF) time traces in an input window for low (blue) and high (red) intracranial pressure (ICP) of traumatic brain injury (TBI) subject T3(1). The average ICP value corresponding to the window is shown in the legend.
In the example of the BESS subject (Fig. 3), the difference in the CBF waveform between the low and high ICP level are subtle. On the other hand, the differences for the two different ICP values in the example of the TBI subject (Fig. 4) are more pronounced. Overall, in both examples, one can see that the waveform and its features are changing. However, these features are not immediately generalizable, but this is the benefit of deep neural networks, which can find them blindly. We note that the algorithm does not provide direct information about the features itself.
Benign enlargement of subarachnoid spaces cohort
Six infants with external hydrocephalus (initially diagnosed with BESS) were included in the study. The median age of the population was 26.5 months (min: 7, max: 55 months).* Time series of CBF was obtained alongside ICP measured in the epidural intracranial space of the left hemisphere. Table 1 summarizes the demographic data and the methodology used in each patient. Further, the ICP results are detailed in Supplementary Text 2 in Figure S1 where histograms of the measured ICP values are shown for each subject in order to assess the distribution of values available for training the algorithm.
Overview of the BESS Population Including Information of the Measurement
BESS, “benign” enlargement of the subarachnoid spaces; ICP, intracranial pressure; DCS, diffuse correlation spectroscopy.
In Figure 5a (also Supplementary Text 2, Fig. S2a), the predictions from the validation set of time windows are plotted against the readings of the invasively measured epidural ICP sensor (see Supplementary Text 2, Figs S3–S8 for individual time traces). The linear regression slope was 0.85 (95% CI: 0.82, 0.89) and the intercept was 2.8 mm Hg (95% CI: 2.1 mm Hg, 3.5 mm Hg). The Pearson correlation coefficient was R = 0.95 and the Lin's concordance correlation was
“Benign” enlargement of the subarachnoid spaces (BESS) subjects:
In order to prove that the information about ICP is mainly contained in the pulsatile dynamics of the CBF, we have trained the algorithm on a low-pass filtered data set (0.4 Hz) of the BESS cohort yielding a poorer correlation (R < 0.5) and a poorer concordance
Traumatic brain injury cohort
Six patients with a moderate or severe TBI that required ICP monitoring were recruited. The median age of this population was 35.5 years (min: 21, max: 39 years). Table 2 reports a summary of the subjects and the clinical settings. We note that Subjects 3 and 4 have repeated measurements at different days. The histograms of the ICP measurements for each subject can be found in Supplementary Text 3 in Figure S9.
Overview of the TBI Population Including Information of the Measurement
TBI, traumatic brain injury; ICP, intracranial pressure; DCS, diffuse correlation spectroscopy; parench., intraparenchymal; R, Raumedic; C, Camino.
The linear regression of the predicted versus the measured ICP values for the TBI patients is shown in Figure 6a (also Supplementary Text 3, Fig. S10a). Further, for clarity, Figures S11–S18 in Supplementary Text 3 show individual time traces. The slope of the linear regression was 0.90 (95% CI: 0.88, 0.92) with an intercept of 1.2 mm Hg (95% CI: 0.94 mm Hg, 1.4 mm Hg). The Pearson's correlation coefficient was R = 0.96 and the concordance correlation was

Traumatic brain injury (TBI) subjects:
Typically, non-invasive ICP methods are assessed by performing a receiver operating characteristic (ROC) analysis for a threshold of 20 mm Hg, to obtain a measure of their ability to detect raised ICP. If we assume that our model will generalize to out-of-sample subjects in a similar manner, an analysis of the ROC curve for the detection of ICP values >20 mm Hg for the TBI population could be evaluated to show its usefulness in the neurocritical care setting. We have performed an exercise despite the limitations (see Discussion) of our study to evaluate its performance, and an area under the curve (AUC) of 0.96 with an optimal threshold of 17.5 mm Hg for the DCS estimated ICP showed a sensitivity of 96% and a specificity of 88%. Further, we have calculated performance measures for the said threshold, which are summarized in Table 3.
Performance Measures to Detect Raised ICP (20 mm Hg Used as a Threshold) Based on the Estimated ICP by the RNN in the TBI Population
Only validation data were taken into account.
ICP, intracranial pressure; RNN, recurrent neural network; TBI, traumatic brain injury; PPV, positive predictive value; NPV, negative predictive value.
Discussion
We have described and introduced a new method to non-invasively predict ICP based on the optical measurement of pulsatile CBF with DCS together with an RNN model. Overall, we were able to map the pulsatile CBF to the ICP readings of the invasive sensors with a machine learning algorithm both in infants and adults (see Figs. 5 and 6).
We highlight here that the algorithm gave promising results for the two different models in infants with a mean age of 26.5 months as well as in adults with a mean age of 32 years. This is remarkable, because the two populations have a different head anatomy because of their age difference. In particular, the depth of the brain from the scalp surface is different, which will alter the partial volume effect 33 and the origin of the optical signal. In other words, the fraction of the DCS signal that is coming from the brain can be significantly different. 25 The same optical probe with a source-detector separation of 2.5 cm was used in both populations, meaning that we were more sensitive to the brain in the infants because of the thinner skull. Nonetheless, the algorithm gave similar results for the adult population. We speculate that the fact that the algorithm performed well for adults and infants with different head geometries is that the predicted ICP is related to the pulsatile component of the CBF.
Taken together, these findings can be seen as an indication that pulsatility has an enhanced sensitivity to deeper layers, in particular to the cortex compared with the extracerebral layers. This speculation is further strengthened by the findings of a recent study in which the authors have shown that the pulsatility of the DCS measured CBF is not affected by the probe pressure. 34 This finding also implies enhanced sensitivity to the deeper layers for the pulsatile component compared with traditional, low-frequency measurements, in which probe pressure was shown to modulate the DCS signal. 35,36
Head anatomy is not the only factor that could have led to differing results in populations because different ICP sensors introduce different systematic errors in estimating the true ICP. For example, the extradural ICP sensors (used in the BESS group) are known to overestimate the real ICP compared with parenchymal or ventricular ICP sensors in adults. 37,38 Therefore, we have chosen to train different models per population set.
Different populations have different needs as well. Invasive ICP monitoring is not common in pediatric BESS patients, because it is often considered a self-limiting condition that does not require treatment. Our clinical partners were motivated to conduct ICP monitoring in BESS patients because of recent literature (and yet unpublished data) demonstrating that BESS is associated in some cases with a persistent delay in motor and cognitive skills. 39 The hypothesis here is that in some of these patients, persistent alterations may exist in the CSF dynamics, which could be demonstrated by continuous ICP monitoring. If our method for non-invasive optical monitoring for estimation of ICP is validated, it may shed light on this line of unknowns, leading to changes in clinical practice.
In TBI patients, the most relevant information is the mean ICP value to detect intracranial hypertension. A common way to assess the ability to detect raised ICP is an ROC analysis using a threshold of 20 mm Hg. We note that our results of the illustrative exercise taking the small data set and calculating performance measures (AUC of 0.96, sensitivity of 96%, and specificity of 88% for a threshold of 20 mm Hg) are in line with other studies. Kashif and coworkers 40 obtained an AUC of 0.83 with a sensitivity of 83% and a specificity of 70% for detection of elevated ICP based on a threshold of 20 mm Hg and their model based estimation of ICP. Kim and coworkers 21 reported an AUC of 0.92 using a semi-supervised method in a heterogeneous cohort of TBI, aneurysmal subarachnoid hemorrhage, and normal pressure hydrocephalus patients. This motivates us to obtain a larger training data set and evaluate the potential of the method for online, non-invasive detection of elevated ICP.
Moreover, a non-invasive ICP monitor ideally should not only detect elevated ICP but also be sensitive to small changes even though they might not be clinically relevant. For example, if a controlled alteration of the patient status causes an expected change, the clinical care staff may use this as a means to ensure the correct functioning of the probe. In our case, a head-of-bed (HOB) position change (HOB angle of 25 degrees → HOB angle of 10 degrees for ∼15 min → HOB angle of 25 degrees) was captured in one subject showing a continuous measurement of the expected ICP changes as shown in Supplementary Text 3, Figure S16. This is of importance for a device that provides critical information such as ICP, such that the clinicians can trust its output. We admit here that the algorithm did not do well in detecting abrupt changes accurately. However, the algorithm was able to detect slower but significant changes (Supplementary Text 3, Fig. S13). On the contrary, one may develop a device that only detects periods of elevated ICP instead of providing continuous ICP information. Further studies will allow us to evaluate the true potential. The true clinical use scenario of this method is yet to be determined.
Another relevant point for TBI management is temporal resolution. According to the BrainIT consortium, one mean ICP value per minute is sufficient for critical care patients with a TBI, 41 which compares well to our 30 sec time bins. On the other hand, in hydrocephalus patients, qualitative information such as the presence of ICP waves is of importance. ICP B-waves occur with frequencies of up to three cycles per minute, 42 which would require a higher temporal resolution for the prediction of an ICP index. A larger training data set should reduce the the prediction error on unseen data, thus allowing us to tune the time resolution parameters of the algorithm in order to get a better temporal resolution with potential equivalent or better performance. In particular, the binning parameter can be adjusted to obtain a temporal resolution of one cycle per second so that ICP waves can potentially be detected. However, slow wave oscillations might also occur in TBI patients. In one patient from the TBI cohort we observed visibly recognizable slow waves that were caught by the DCS estimated ICP (see Supplementary Text 3, Fig. S14).
One of the limitations of our study was that the sample size of recruited subjects for both populations was small, and the measurement periods were relatively short, implying that a lot of our data were derived from periods of relatively stable ICP measurements. One can observe this in individual time traces and histograms shown in Supplementary Text 2 and 3. This has hindered us from conducting an analysis for each individual, such as a leave-one-out analysis and, therefore, we have opted for a group analysis in which both populations showed a high correlation (R = 0.95 and 0.96, for infants and adults, respectively) with also a high concordance (
In comparison with our method, several TCD-based methods have been used for the non-invasive estimation of ICP with an overall accuracy of ±12 mm Hg. 7 Correlating the TCD pulsatility index with ICP, as shown in the study by Bellner and coworkers, 43 led to an accuracy of ±4 mm Hg, whereas other studies could not reproduce these results. Kim and coworkers 21 used a semi-supervised method to analyze the morphology of the TCD waveform in order to classify intracranial hypertension, but this method was unable to give a continuous ICP estimate. Other emerging non-invasive methods either analyze acoustic signals that propagate through the cranium yielding in an accuracy of ±6.8 mm Hg to estimate ICP, 44 or measure with ultrasound or other imaging techniques the optic nerve sheath diameter to detect elevated ICP. 45 Our results show a “best-case-scenario,” because of our use of all subjects in the training data set, which has converged to a similar accuracy.
As a side note, Zacchetti and coworkers 46 analyzed the accuracy of intraparenchymal ICP sensors in comparison with a ventricular catheter with an external transducer in a meta-analysis, concluding that using the random standard error, the mean difference of 1.5 mm Hg is acceptably small, but its accuracy of 11.4 mm Hg shows a wide spread. This is an example illustrating the accuracy of invasive ICP sensors compared with each other, demonstrating once more the potential of our method.
As previously mentioned, there are other non-invasive ICP methods based on optics. In comparison with those, we were able to directly obtain an ICP value without the need of using surrogates such as the CrCP 19 or the need to indirectly look at metabolic alterations as was done with NIRS. 10,11 In the recent preliminary results of Baker and coworkers, 19 they have shown a good correlation of the estimated CrCP to ICP values in infants with hydrocephalus. However, the CrCP was estimated before and after a shunt was placed, and the ICP was measured at the moment the shunt was placed. Further, continuous measurements of the CrCP are difficult, because a continuous ABP signal is required, whereas our method does not rely on a second input such as ABP. Instead, it strongly depends on the learned features and the information that has provided the network for training. All in all, it shares with the other optical methods its advantage and suitability for continuous long-term measurements at the bedside, whereas in other methods; for example, using TCD, the head gear to hold the probes in place might be uncomfortable over time.
We admit that the accuracy of ±4 mm Hg in the random sample splitting method may be deceptively good. This is because the training set partially contains information about all subjects used. Therefore, the overall bias is almost zero and negligible. Again, ideally, a larger data set with more subjects and longer monitoring periods would enable a complete leave-one-out analysis for a true evaluation of the performance of the RNN.
The fact that neural networks can learn patterns from data without prior analysis via feature engineering makes it a strong algorithm in the engineering sense, especially when it is not so clear what features from raw data may be most relevant. However, the concern with using neural networks on raw data in this sense is that if the problem turns out to be very complex, very large data sets would be required for the algorithm to reach a point at which it generalizes well. In addition to training on a larger data set, the extraction of specific features to reduce the dimensionality of the raw data could help improve the model to generalize better for a data set with a small sample size. Some pertinent features in pulsatile blood flow measured by DCS have recently been suggested by Ruesch and coworkers 47 as valuable markers using a similar approach based on a random regression forest in a non-human primate model. On the other hand, there are other types of algorithms, such as convolutional neural networks (CNN), 48 which could be implemented by integrating a CNN architecture to focus on local temporal correlations alongside an RNN analyzing complex feedback loops in the pulsatile CBF signal, to prove a more fruitful method.
Ideally, such an algorithm should be trained on a large cohort covering the entire ICP range equally. Thus, the method could be used directly as a stand-alone non-invasive technique to continuously predict an ICP index. However, if the limitations persist, one can think about the following possible clinical forecasting scenario. For example, all the gathered data are used to initially train the network. In a second stage, for each subject, a short period of time would be used to calibrate the method by training the pre-trained model with a measurement alongside an invasive monitor. With this procedure, clinicians could obtain information even after removing the invasive ICP sensor. One can also imagine calibrating the method with an invasive ICP measurement during surgery or by using a lumbar puncture. For this purpose, we have tried to test the algorithm using even fewer data for the training. By using randomly sampled 30% (= 70% holdout) and 10% (= 90% holdout) for the training we have achieved similar results compared with the 50% split analysis with a lowest accuracy of ±4.7 mm Hg. This shows clearly the potential for such a scenario, but further investigations, especially for long-term stability of the model, are still needed. Further, one can think of applying similar concepts of changes in the pulsatile CBF signals to detect changes in the vascular tone; for example, to detect vasospasms in subarachnoid hemorrhage patients.
Our data open a window of opportunity to explore our algorithm in larger cohort of patients ideally enrolled in multi-center studies with better controlled conditions such as using the same ICP sensors and protocols to gather enough data for generalization of the method.
Conclusion
We have introduced and demonstrated a promising new method and an algorithm to estimate ICP in a continuous, non-invasive manner with DCS. In particular, a neural network was used to learn complex dynamics and features from pulsatile CBF measured optically by DCS, to predict ICP values coming from an invasive ICP sensor. The method was demonstrated on infants with BESS and adults with TBI, showing its versatility.
If the method is improved and validated on larger studies, it may have implications for both children and adults with severe brain injury or hydrocephalus. It may additionally open new scenarios for patients with potential disruptions of ICP, but not in such a way as to incur the risks of invasive ICP monitoring, such as those with ischemic strokes, unexplained headaches, and others.
Footnotes
Acknowledgments
We gratefully acknowledge valuable discussion with Wesley B. Baker, David R. Busch, Daniel J. Licht, and Arjun G. Yodh.
Funding Information
This work was funded by the European Union's Horizon 2020 project “BitMap: Brain Injury and Trauma Monitoring Using Advanced Photonics” (No. 675332); Fundació CELLEX Barcelona; Ministerio de Economía y Competitividad/FEDER (PHOTODEMENTIA, DPI2015-64358-C2-1-R); Instituto de Salud Carlos III/FEDER (MEDPHOTAGE, DTS16/00087 and PI18/00468); the “Severo Ochoa” Programme for Centers of Excellence in R&D (SEV-2015-0522); the Obra social “laCaixa” Foundation (LlumMedBcn); Institució CERCA, AGAUR-Generalitat (2017 SGR 1380); LASERLAB-EUROPE IV; KidsBrainIT (ERA-NET NEURON); and la Fundació La Marató de TV3 (201709.31 and 201724.31).
Author Disclosure Statement
Turgut Durduran, Udo Weigel, Jonas Fischer, and Ameer Ghouse are inventors on a relevant patent application. Turgut Durduran is also an inventor on other relevant patents. ICFO has equity ownership in the spinoff company HemoPhotonics S.L. Potential financial conflicts of interest and objectivity of research have been monitored by ICFO's Knowledge & Technology Transfer Department. No financial conflicts of interest were identified. Udo Weigel is the CEO and has equity ownership in HemoPhotonics S.L. and Udo Weigel and Jonas Fischer are employees. Their role has been defined by the BitMap project and was reviewed by the European Commission. The other authors have no competing financial interests.
Supplementary Material
Supplementary Text S1
Supplementary Text S2
Supplementary Text S3
Supplementary Figure S1
Supplementary Figure S2
Supplementary Figure S3
Supplementary Figure S4
Supplementary Figure S5
Supplementary Figure S6
Supplementary Figure S7
Supplementary Figure S8
Supplementary Figure S9
Supplementary Figure S10
Supplementary Figure S11
Supplementary Figure S12
Supplementary Figure S13
Supplementary Figure S14
Supplementary Figure S15
Supplementary Figure S16
Supplementary Figure S17
Supplementary Figure S18
References
Supplementary Material
Please find the following supplemental material available below.
For Open Access articles published under a Creative Commons License, all supplemental material carries the same license as the article it is associated with.
For non-Open Access articles published, all supplemental material carries a non-exclusive license, and permission requests for re-use of supplemental material or any part of supplemental material shall be sent directly to the copyright owner as specified in the copyright notice associated with the article.