
Abstract
The Glasgow Outcome Scale-Extended (GOS-E), an ordinal scale measuring global outcome, is used commonly as the primary outcome measure in clinical trials of traumatic brain injury. Analysis is often based on a dichotomization and thus has inherent statistical limitations, including loss of information related to the collapse of adjacent categories. A fixed dichotomization defines favorable outcome consistently for all subjects, whereas a sliding dichotomy tailors the definition of favorable outcome according to baseline prognosis/severity. Literature indicates that the sliding dichotomy is more statistically efficient than the fixed dichotomy; however, the sliding dichotomy still collapses categories and therefore discards information. We propose an alternative, a sliding scoring system for the GOS-E, intended to address the limitations of the sliding dichotomy. The score is assigned based on the number of levels between the achieved score and the favorable cut-point. The proposed scoring system reflects the magnitude of change, where change is defined according to each subject's baseline prognosis. Because the score is approximately continuous, statistical methods can rely on the normal distribution, both for analysis and study design. Two examples show the corresponding potential for improved power. A sliding score approach allows for quantification of the magnitude of change while still accounting for prognosis. Scientific advantages include increased power and an intuitive interpretation.
Introduction
The Glasgow Outcome Scale-Extended (GOS-E), an extension of the Glasgow Outcome Scale (GOS), is the most common primary outcome measure in traumatic brain injury (TBI) clinical trials. Among 163 outcome measures included in the Common Data Elements recommendations for TBI, the GOS-E is the only outcome designated as core, meaning that it is essential and relevant to all TBI studies. 1 The scale measures global outcome, including functional status, independence, and participation in relevant societal roles. 2 The GOS-E extends the five categories of the GOS into eight states: (1) Death, (2) Vegetative State, (3) Lower Severe Disability, (4) Upper Severe Disability, (5) Lower Moderate Disability, (6) Upper Moderate Disability, (7) Lower Good Recovery, and (8) Upper Good Recovery.
Although ordinal in nature, the GOS/GOS-E is often dichotomized for the purposes of the primary analysis. A fixed dichotomy typically defines favorable outcome via moderate disability or good recovery. 3 Alternative cut-points have been used, however; the RESCUEicp trial, for example, defined favorable outcome via upper severe disability or better. 4 Because information is lost when categories are collapsed to define favorable outcome, this approach is expected to be less powerful than an analysis that reflects the ordinal response categories. 5 Further, a fixed dichotomization does not reflect clinical interpretation, where the definition of a favorable outcome depends on the severity of the initial injury. Any improvement from an expected poor outcome relative to baseline severity is likely meaningful, even if it does not cross the boundary into the favorable designation. In response to these criticisms, Murray and associates 6 proposed the sliding dichotomy, in which the definition of favorable outcome depends on baseline prognosis.
Analytical approaches that maintain the ordinal nature of the data, including the sliding dichotomy and the proportional odds model, are more statistically efficient than the fixed dichotomy. 7 –9 McHugh and colleagues 7 concluded that the proportional odds model is more efficient but less clinically appealing than the sliding dichotomy. In addition, the common odds ratio resulting from the proportional odds model may not be a reasonable summary of the treatment effect if the assumption of proportional odds is not met.
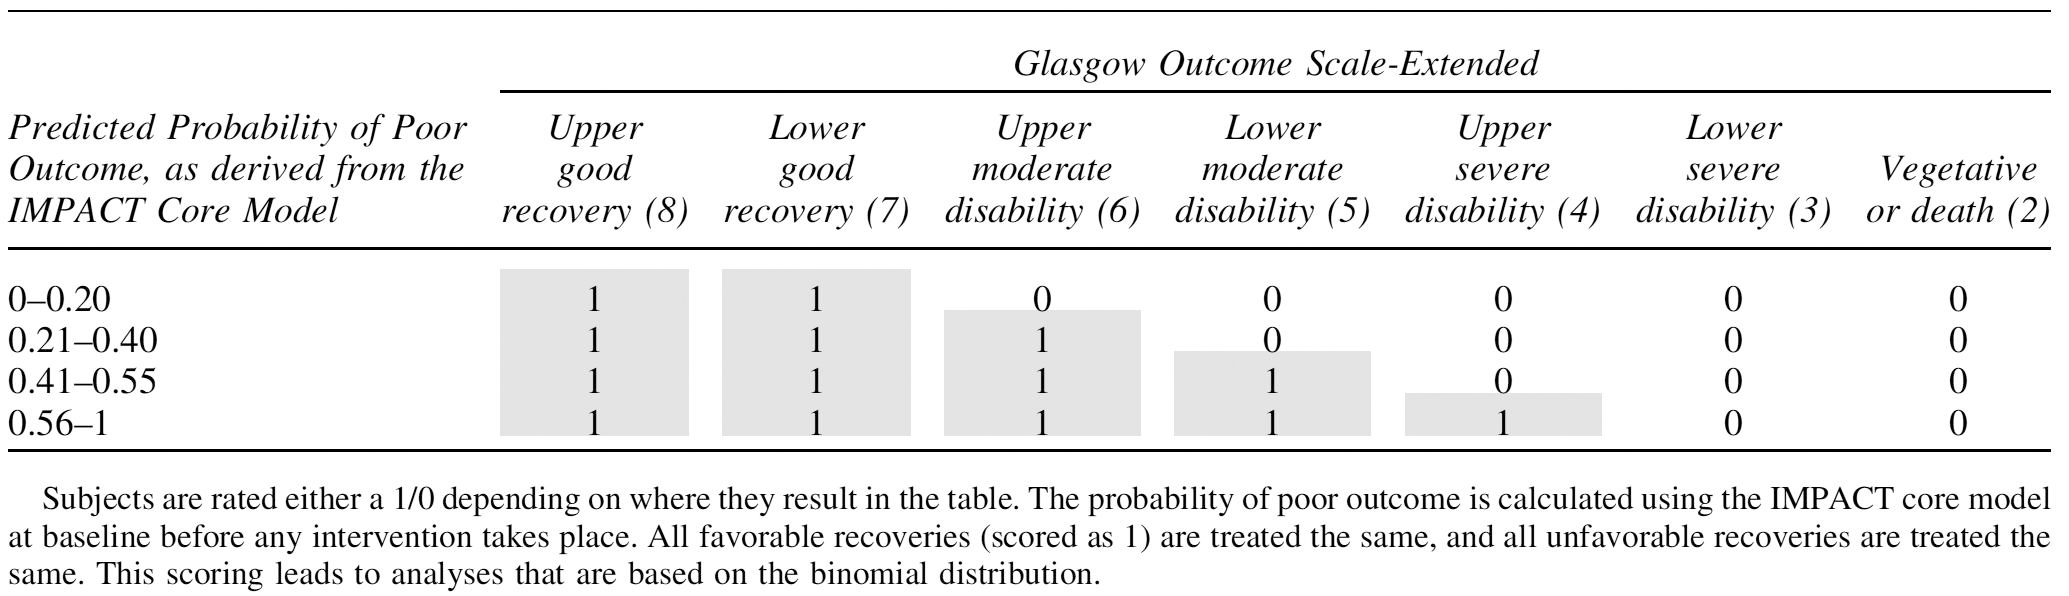
Under the sliding dichotomy approach, however, the outcome variable used in primary analysis is a binary variable; one can therefore expect a reduction in power because of the loss of information associated with collapsing categories. The sliding dichotomy approach was specified in TBI treatment trials of progesterone, 10 hyperbaric oxygen (HOBIT: NCT02407028), and brain tissue oxygen management (BOOST-3: NCT03754114). The current protocols for BOOST and HOBIT define the sliding dichotomy as shown in Table 1.
Scoring of the Glasgow Outcome Scale-Extended Using the Sliding Dichotomy Scale Defined for HOBIT and BOOST
The BOOST-3 trial is a randomized comparative effectiveness study of goal-directed critical care based on monitoring of brain tissue oxygen and intracranial pressure versus monitoring of intracranial pressure alone in patients with severe TBI. Subjects are randomized to one of the two treatment arms (1:1), using a covariate adaptive randomization scheme adjusting for site and severity, as defined by the IMPACT Core model probability of poor outcome. 11 The primary statistical analysis is based on the corresponding generalized linear model.
The HOBIT is an adaptive clinical trial designed to select the optimal dose regimen of hyperbaric oxygen treatment. Subjects are randomized via covariate adaptive and response adaptive randomization to one of seven novel therapy arms (extra oxygen over five days using a hyperbaric chamber in six of the arms) or a standard of care control arm. The primary model is a Bayesian hierarchical EMAX dose-response model 12 with a Binomial model, again because the response is binary.
The aim of the current investigation is to improve on the limitations of dichotomization of the GOS-E for prospective studies of TBI through the development of a sliding scoring system.
Methods
In developing the proposed sliding scoring system for the GOS-E, it is worth noting how the dichotomy has been defined for the BOOST-3 and HOBIT studies. As shown in Table 1, favorable and poor outcome are defined based on the probability of poor outcome using the baseline IMPACT score and the GOS-E score at six months post-injury. To prospectively define these prognosis categories, and corresponding favorable outcome definitions, during the BOOST-3 design phase, data from the completed trial of progesterone in TBI 10 (ProTECT III) was used. The ProTECT III methods and results have been published previously.
Briefly, subjects with TBI were randomized to receive progesterone or placebo (1:1) and followed for six months to ascertain the GOS-E. The IMPACT Core Model 11 was applied to the subset of ProTECT control subjects with ICP data, and the resulting predicted probabilities were categorized in deciles. Within each decile, favorable outcome thresholds were chosen to achieve an approximate 50% favorable outcome classification; the resulting categories and thresholds were then revised to achieve a more logical and clinically relevant definition.
As illustrated in this table, a limitation of the sliding dichotomy is that although it tailors the definition of favorable outcome according to injury severity, all scores meeting the criteria of favorable outcome are considered equal. As an extreme example, for a subject having high probability of poor outcome (>0.56), an outcome at six months of upper severe disability is considered equally favorable as an outcome of upper good recovery. From a clinical and statistical perspective, this represents a loss of information as a GOS-E of 8 is clearly more favorable than 4, and all TBI patients and clinicians would assign higher utility to the near perfect outcome.
A potential solution to this limitation of the sliding dichotomy is to score the GOS-E as the distance from the cutoff for favorable/poor outcome as shown in Table 2. Unlike the sliding dichotomy, the sliding score treats all favorable outcome values differently—that is, a trial participant who recovers to upper good recovery receives one point more than a subject with lower good recovery. At the extreme, for a subject with high probability of poor outcome (>0.56), an outcome of upper good recovery scores four points more than an outcome of upper severe disability.
Scoring of the Glasgow Outcome Scale-Extended Using the Proposed Sliding Score

This sliding scoring system leads to a better representation of the magnitude of change; it reflects the movement along the scale and also allows those more grossly affected potentially to contribute more to the primary outcome. This scoring system yields a range from −5 to +4 and approximates a continuous outcome that reflects differences between GOS-E levels more precisely than the sliding dichotomy. The primary statistical analysis of the sliding score for a two-arm clinical trial would be a two-sample t test. In the HOBIT trial, which involves eight arms, the primary model would remain a Bayesian hierarchical EMAX dose-response model but with a normal distribution model.
Results
Scoring on observed clinical trial data
To assess the statistical properties of the proposed scoring system, data from the completed ProTECT III trial were used. The probability of poor outcome according to the IMPACT core model was calculated, and subjects were assigned a prognosis category according to the thresholds shown in Table 1. Figure 1 shows the joint frequency of this prognosis level, defined using the predicted probability of poor outcome according to the IMPACT core model, and GOS-E, as well as the frequency of GOS-E conditional on prognosis, by randomized treatment assignment.
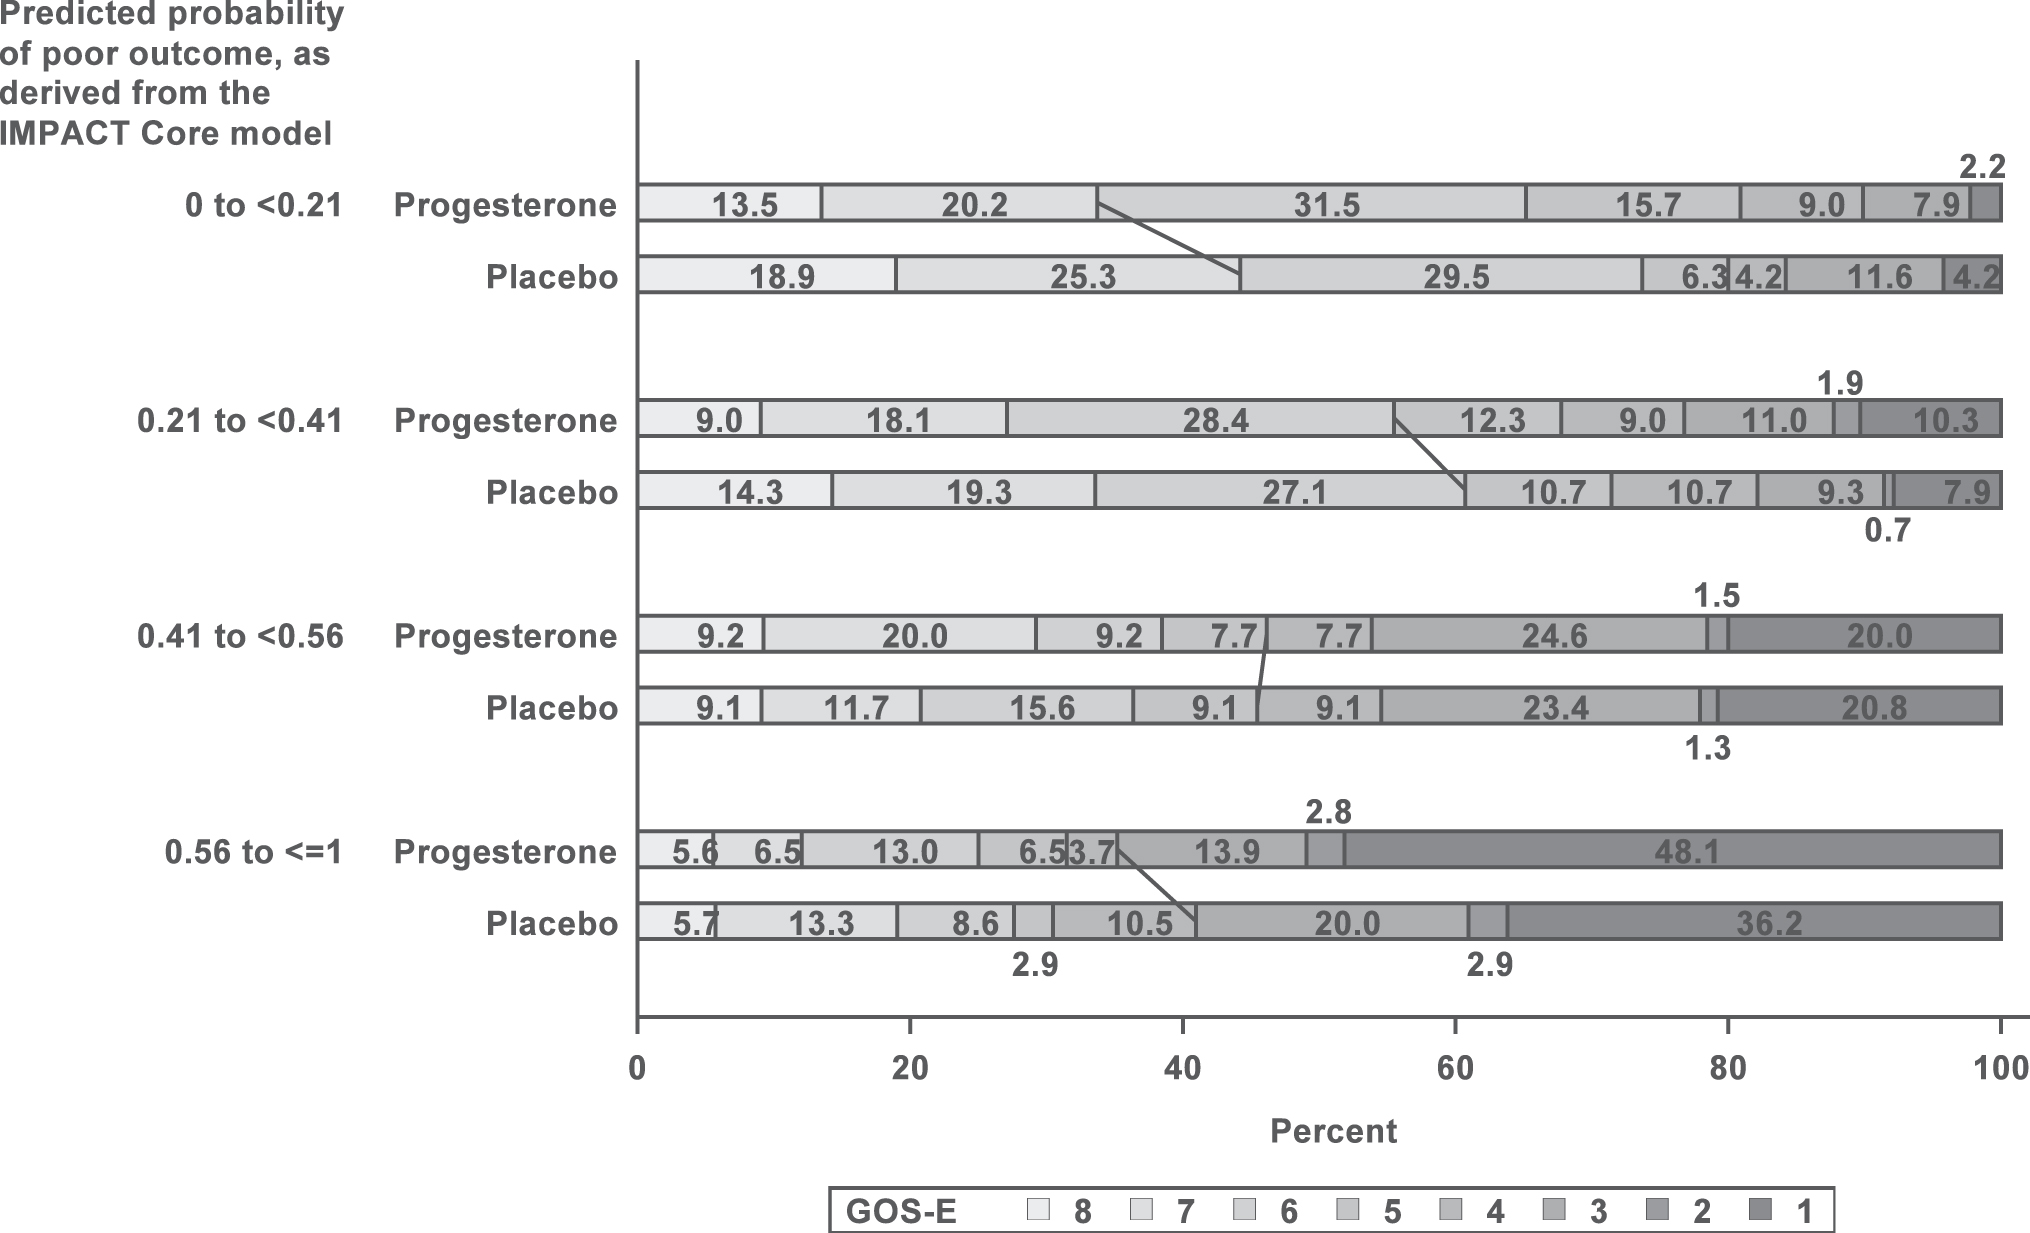
Distribution of the Glasgow Outcome Scale-Extended (GOS-E) values by prognosis level in ProTECT III. Prognosis is defined using the probability of poor outcome derived from the IMPACT core model as shown in Table 1. A total of 834 subjects are included, with n = 417 in the progesterone group and n = 417 in the placebo. The graph reflects slightly better overall recovery for placebo relative to progesterone.
Overall, the GOS-E outcome is summarized based on the sliding dichotomy as having a rate of favorable outcome of 44.1% in the progesterone group and 49.2% in the placebo group. Using the proposed sliding scoring system, this translated to a mean score of
Figure 2 suggests a normal distribution for the sliding score. Thus, a normal distribution model and a standard deviation of approximately 2 can be used to design future trials in similar patient populations using the sliding scoring method.
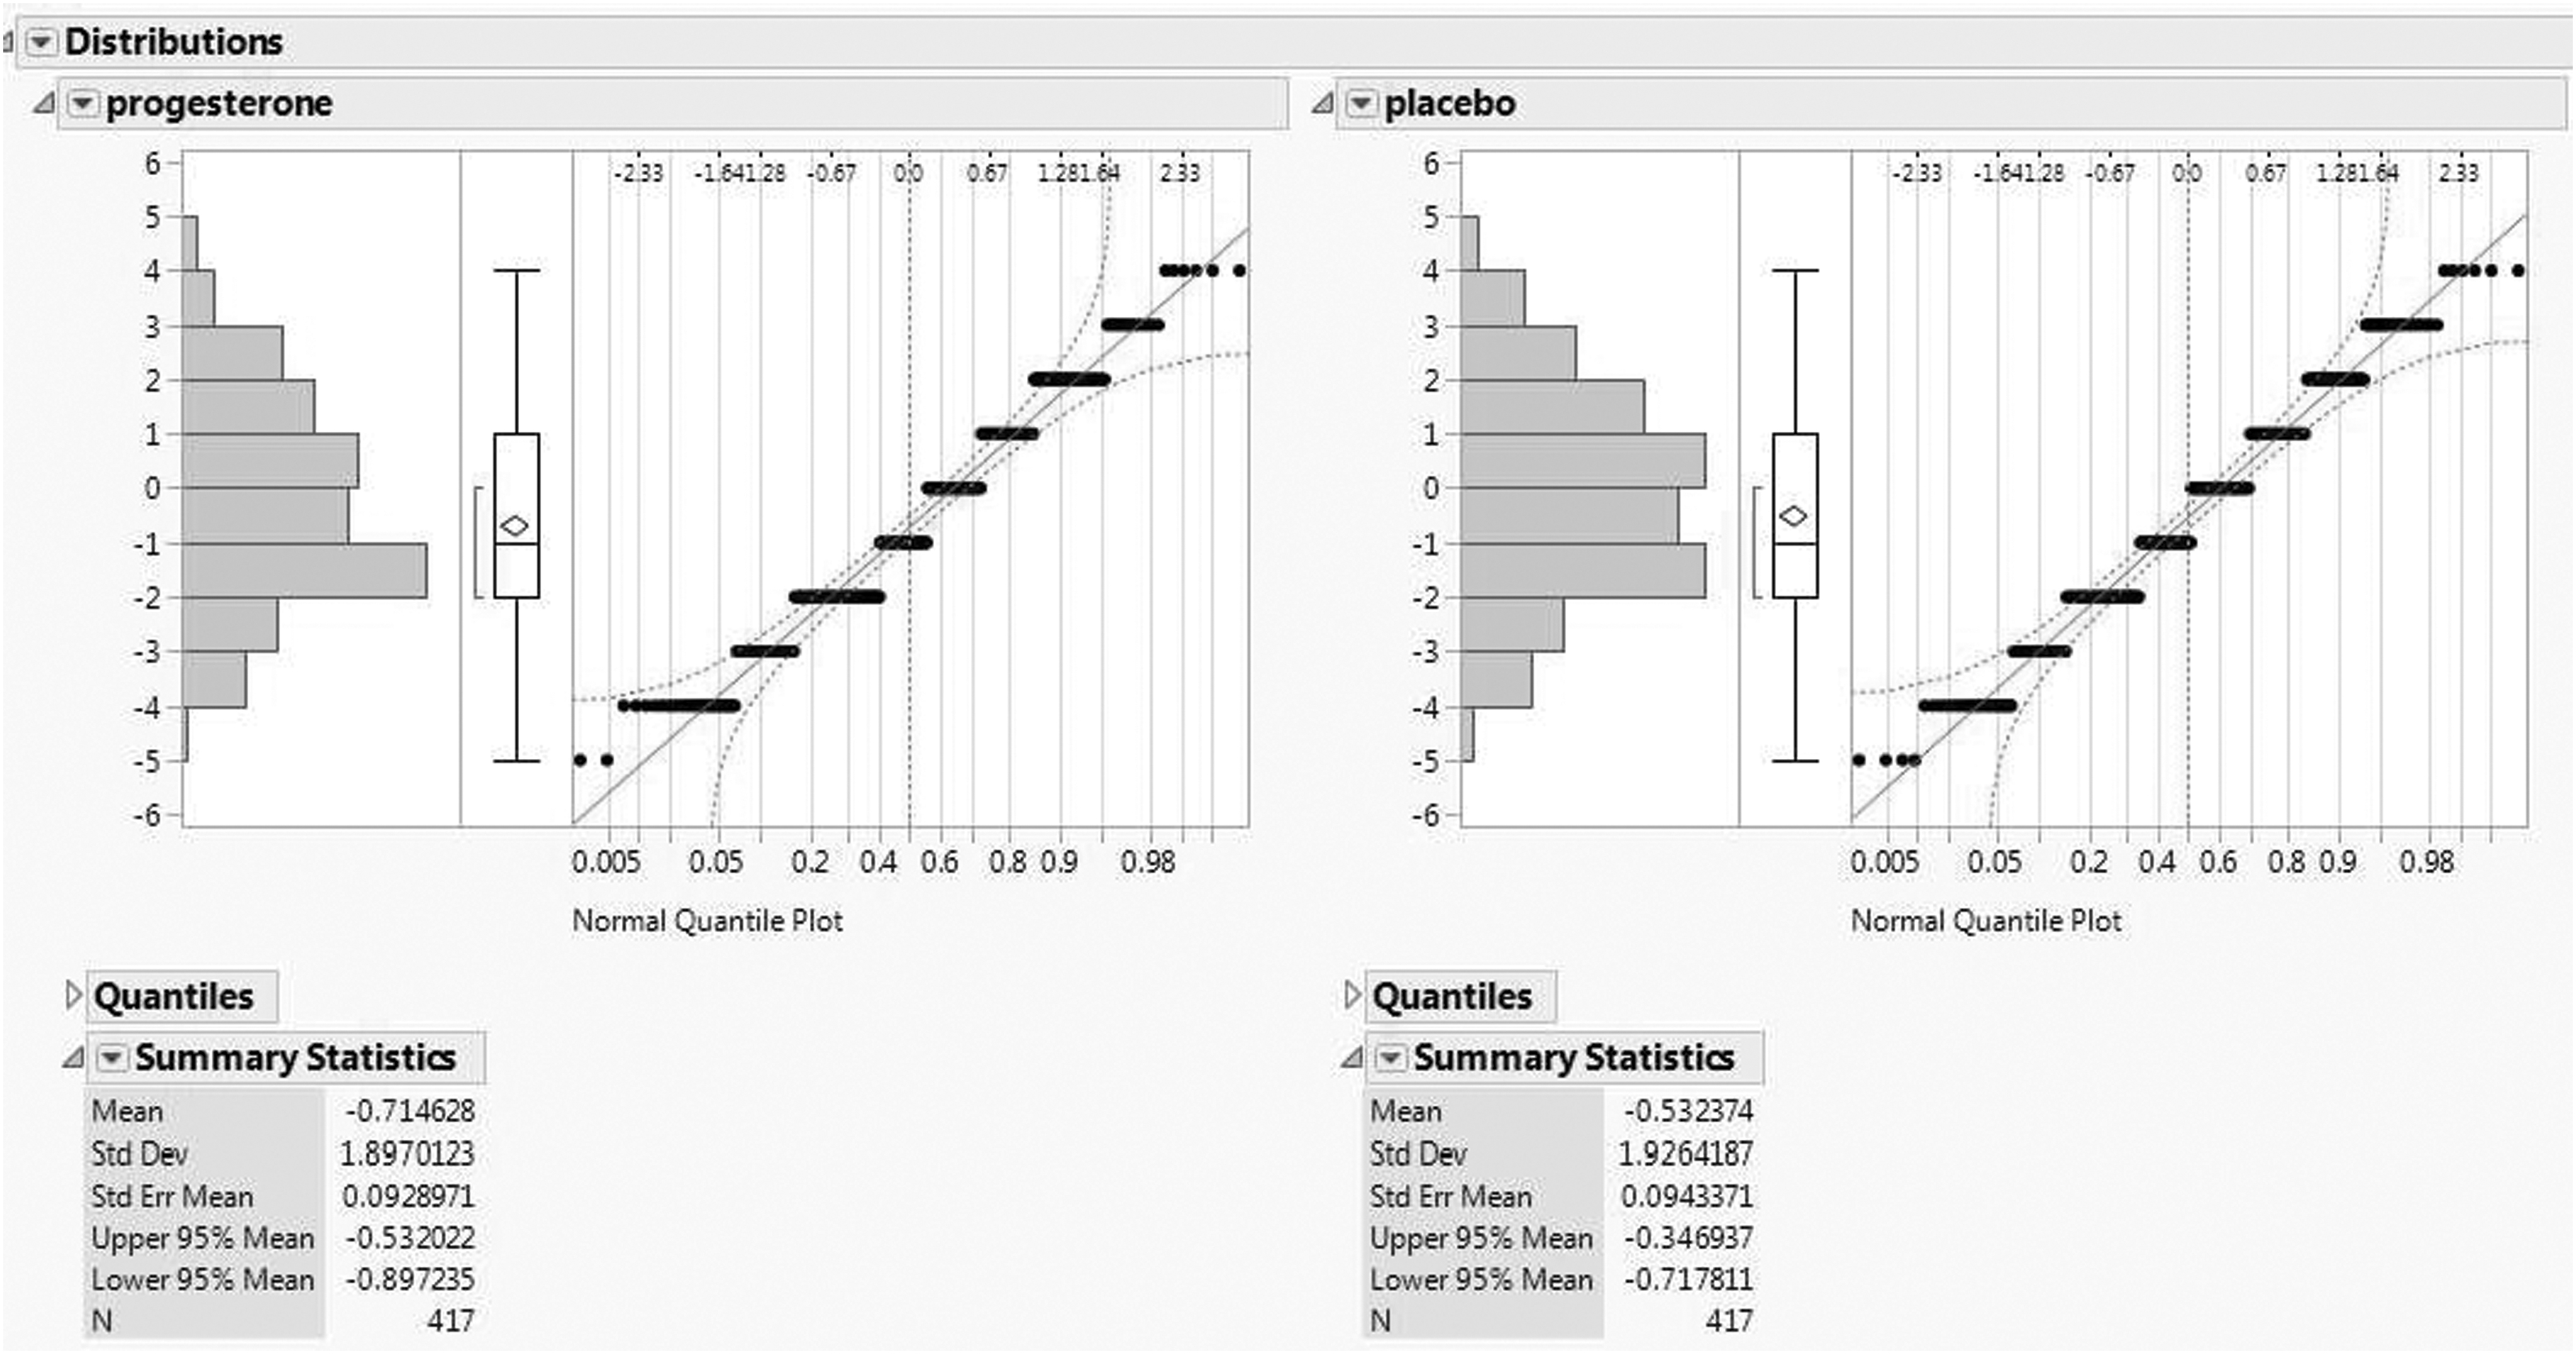
Distribution of the Glasgow Outcome Scale-Extended (GOS-E) values after applying the sliding scoring to the data from ProTECT III clinical trial. There was n = 417 in the progesterone group and n = 417 in the placebo group for a total of 834 subjects, and the normal quantile plots indicate a normal distribution is a very reasonable assumption allowing parametric tests such as the two-sample t test to be an appropriate statistical model.
Power and sample size
Using the distribution of outcomes from the ProTECT III trial, sample size estimates and potential power for the BOOST-3 and HOBIT trials were generated. As noted previously, for the BOOST-3 protocol, the primary end-point is defined as favorable outcome at six months post-randomization, where favorable outcome is defined according to the sliding dichotomy of the GOS-E as described above. Based on a pre-specified clinically relevant effect size of 10% absolute difference in favorable outcome proportions (e.g., 0.5 and 0.6 favorable responses in the two arms), a two-sided type I error probability of 0.05, and 85% power, the base (before inflation for interim analysis, losses to follow-up, etc.) sample size for the study is 888 subjects.
Note that a favorable outcome on the sliding dichotomy can be similarly defined using the sliding score, via outcomes of 0 or greater. Given a normal distribution as suggested in Figure 2, the proportion of favorable outcomes can be calculated as the area under the normal curve greater than or equal to 0. For a specified mean in the jth arm
This probability can be obtained from many standard statistical software packages as well as spread sheet software such as Excel (e.g., via the ‘ = NORM.DIST()’ function). Mean and standard deviation arguments are used to specify the relevant normal distribution, and the cumulative argument is used to generate the area under the curve to the left of 0. An inverse calculation allows one to formulate the mean as a function of the SD and the proportion of favorable responses
Recall that the BOOST-3 sample size justification stipulated favorable outcome rates of P1 = 0.5 and P2 = 0.6 in the two treatment arms. Assuming a SD of 2 as in Figure 2 and applying the algebraic formula for
Alternatively, if indeed if there were 888 subjects as in the proposed BOOST-3 study, the power of the study would increase to 96%. The power calculations for BOOST-3 were replicated by sampling, with replacement, 10,000 data sets directly from ProTECT III and shifting to obtain the between group effect size. For each dataset, a two-sample t test was calculated. This resulted in very similar power (85.5% and 97.0%, respectively).
Unlike the BOOST-3 trial of superiority, the HOBIT trial is a Phase II study and is aimed at choosing the best dose to move forward to a confirmatory Phase III trial. Simulation studies for the HOBIT design were conducted using several scenarios and potential effects to elucidate the power and average sample size for each scenario. The simulations are described briefly; further details can be obtained in a simulation report by contacting the authors.
For each of the effects, we generated data according to those truths and ran through the design. We repeated this process 10,000 times to create multiple “virtual trials,” and we recorded the behavior of each trial. Among the scenarios assessed, there included a null effect, a small effect over control, a medium effect over control, and a large effect over control. Given a maximum sample size of N = 200, the average sample sizes under these four scenarios were 183, 184, 172, and 155, respectively. In addition, a harmful scenario whereby the treatment was worse than the control was also simulated, and results indicate that the average sample size for this scenario was 169.
Finally, the type I error probability (incorrectly identifying treatment[s] to success that are truly no better than control) for the complete null scenario (“none”) was 0.21. With regard to power, a maximum sample size of N = 200 under the HOBIT design provides at least 77% power when there is improvement (effect) in favorable GOS-E outcomes for active arms over control. If the treatment arms have a medium or large effect over control, the power is, respectively, 92% and 98%. If the active arms have no improvement (e.g., none) or are worse than control (e.g., harmful), then the early futility rates are, respectively, 29% and 53%.
Using the transformed outcome whereby the clinically relevant effect size based on the sliding score of the GOS-E, the power increases from 77% to at least 83% when there is improvement (effect) in favorable GOS-E outcomes for active arms over control. If the active arms have medium or large effects over control, the power increases from 92% and 98% to 95% and 99%, respectively. In addition, the average required sample sizes also decrease when using the transformed outcome. For the null, small, medium, and large effect scenarios, the average sample sizes become 181 182, 167, and 149, respectively.
In addition to sample size and power comparisons, because HOBIT is a dose selection study, it is also important to assess the probability of selecting the best dose (e.g., the power in the previous paragraphs is the probability of selecting a better dose; here we are selecting the best dose). Using simulation scenarios as described above, the probability of selecting the best dose using the study defined sliding dichotomy outcome is compared with that for the proposed sliding scoring. Figure 3 displays this comparison. Under the proposed continuous scoring, there is an increase in the probability of selecting the best dose for all scenarios with improvement increasing as the effect of the treatment compared with the control increases.
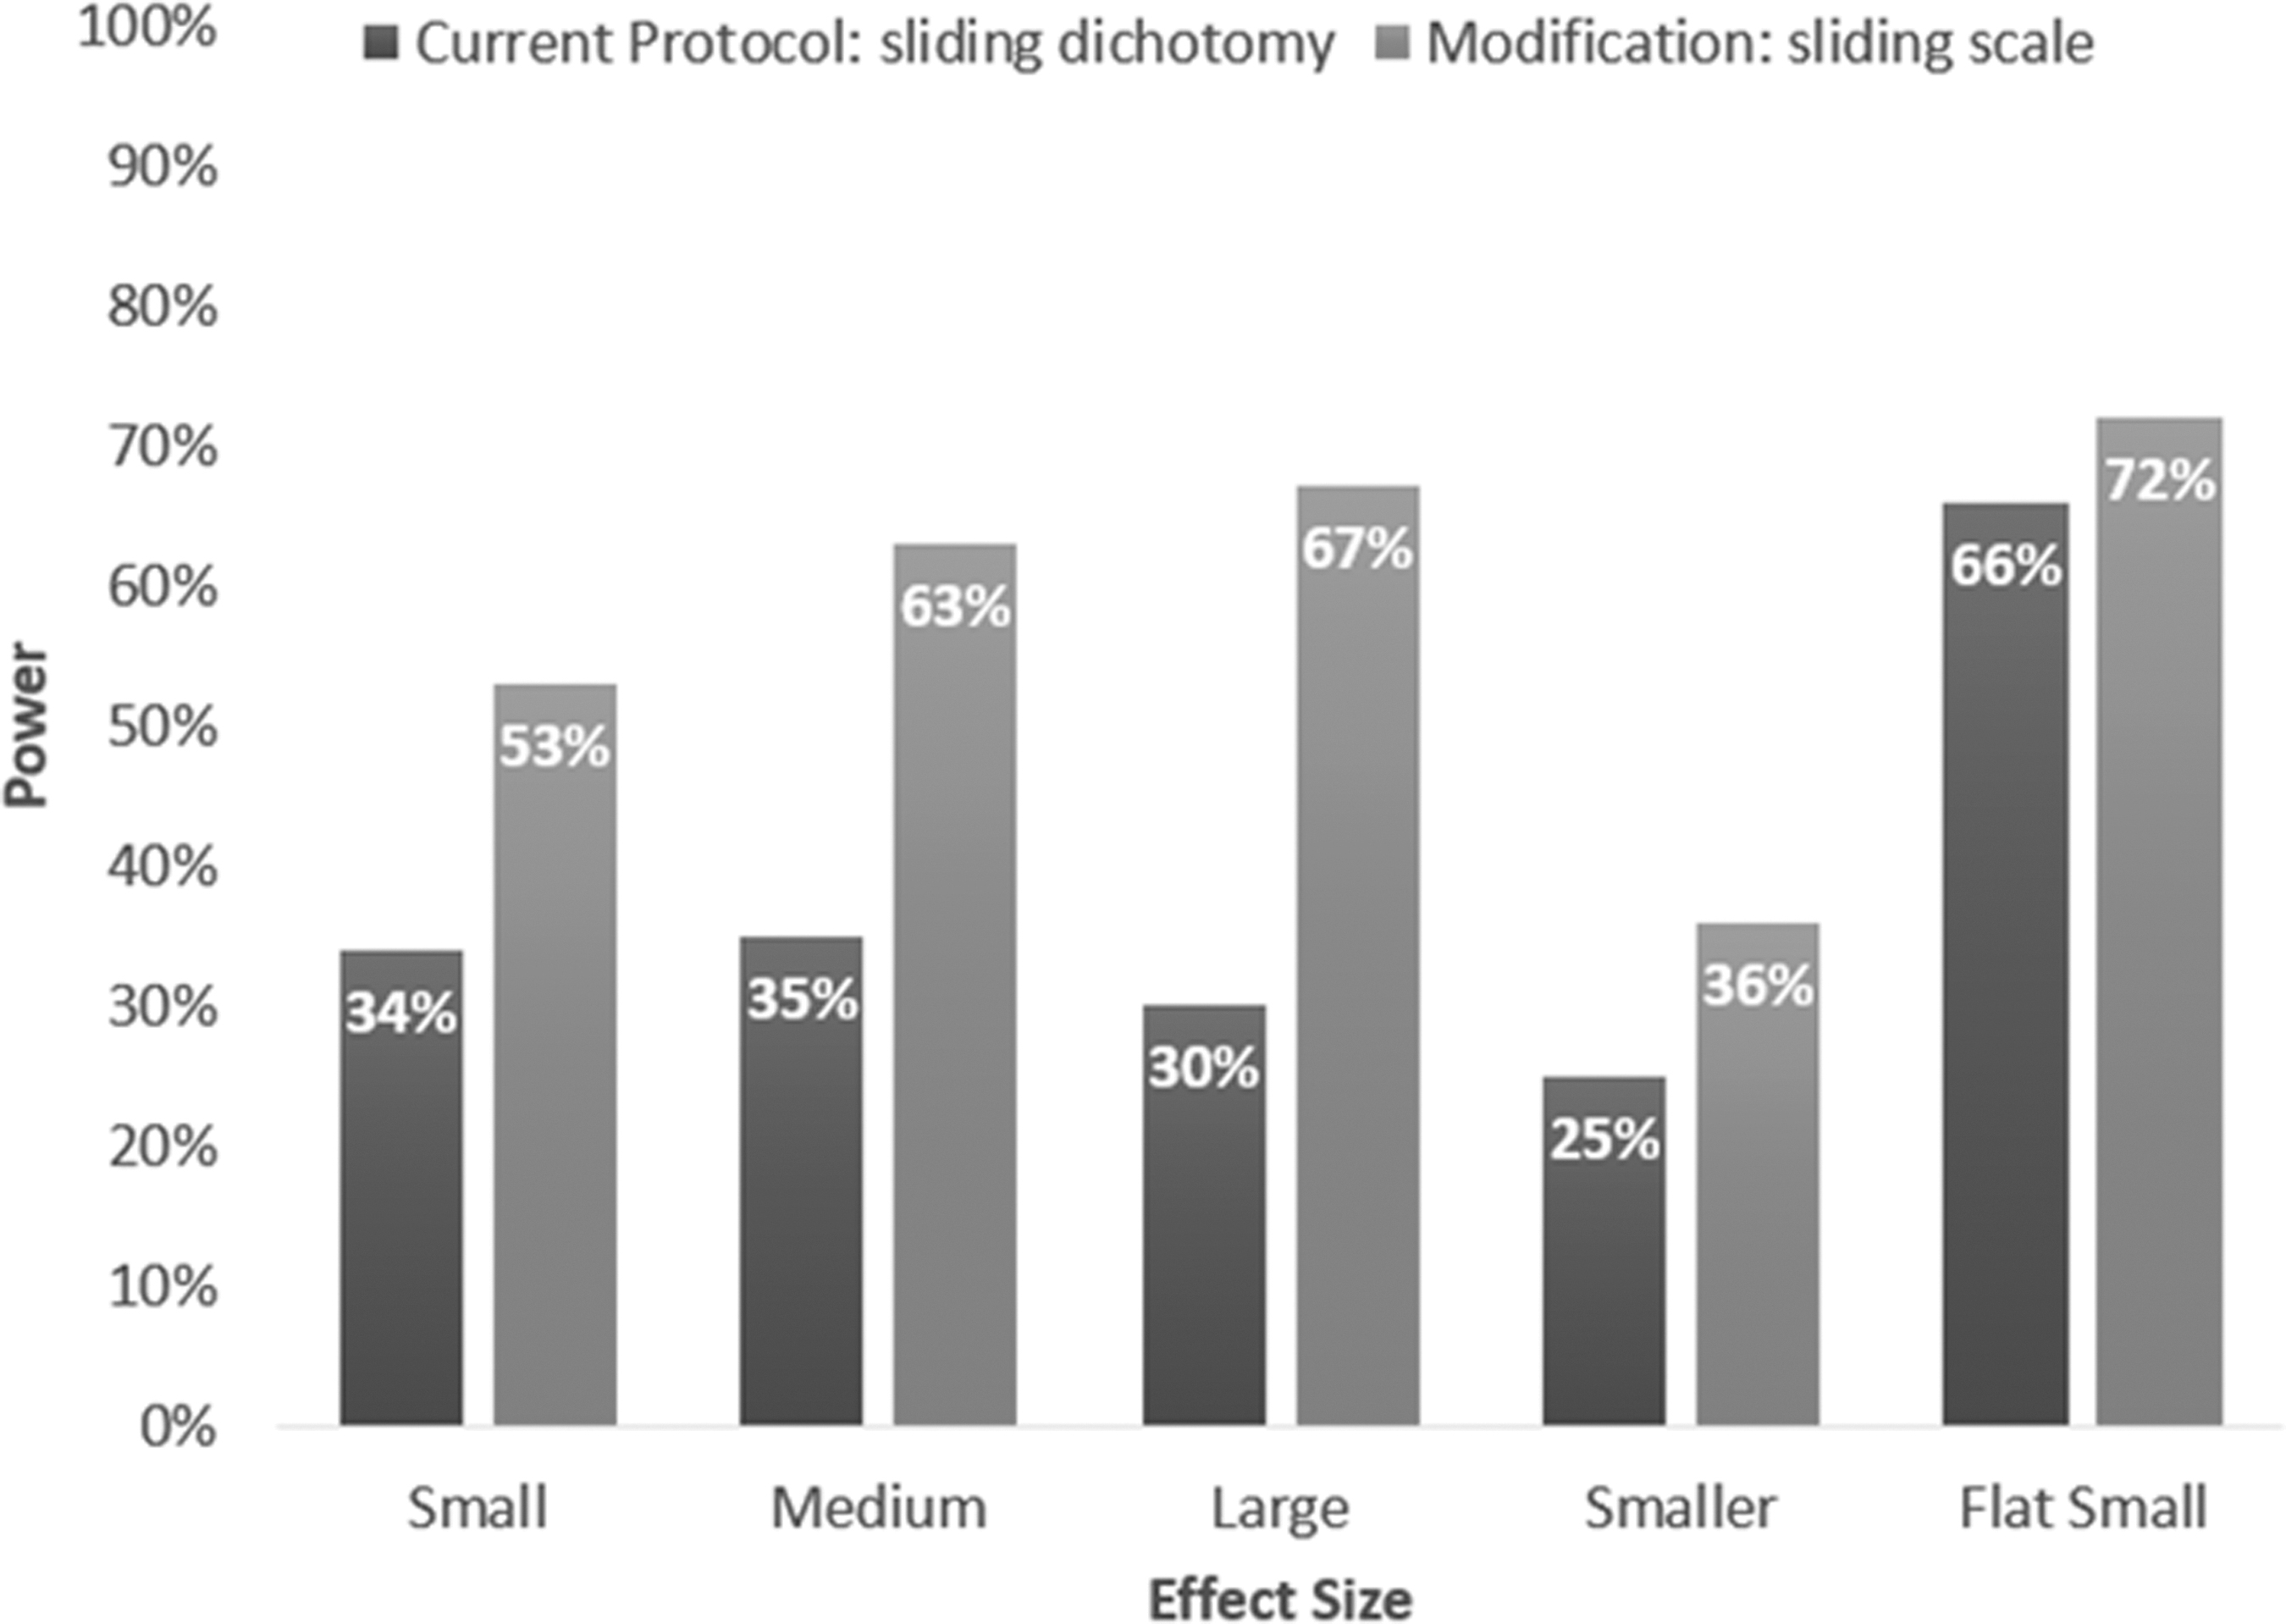
This represents the probability of selecting the best dose by different end-points. Specific trial design operating characteristics using the sliding dichotomous scale with a binomial distribution versus sliding score with a normal distribution. The trial is the HOBIT trial that has one control arm versus seven active arms. Both trial designs have the same Type I error rate, but the sliding scoring approach results in larger probabilities of selecting the best arm to move forward to a phase III trial, supporting the sliding scoring as appealing (all designs have the same Type I error of ∼20%—aggressive Phase II trial).
Discussion
A sliding scoring of the GOS-E has been developed in an attempt to quantify and score the entire scale while at the same time adjusting for severity. This is an improvement over the sliding dichotomy scale that scores all values above the favorable cut-point the same. The sliding score of the GOS-E was applied to data from the ProTECT III study, and it was found that, within the two arms, the scores follow an approximate normal distribution. This is promising for utilizing normal distribution models for designing future clinical trials. Simulations showed that converting to the sliding score from the dichotomous creates meaningful improvements of efficiencies in the trial.
The proposed scoring system represents a compromise between the traditional ordinal outcome scale and the binary interpretation (either fixed or sliding). A potential criticism of both the sliding dichotomy and the proposed sliding score pertains to the nature in which the prognosis categories, and corresponding favorable cut-point, are defined; pre-specification is key, to avoid the perception of bias associated with allowing the same data to both drive the decision-making and the analysis.
For BOOST-3 and HOBIT, the trials motivating this work, the number and definition of the prognosis categories was pre-specified in the trial design, using data from the previously completed ProTECT trial. Alali and coworkers 13 suggest that the power of the sliding dichotomy increases with the number of prognostic categories; however, the improvement in power suggested here exceeds that associated with the increase from three to 10 categories (1–5% improvement) reported.
There are alternative analytic approaches (e.g., ordinal regression and rank-based comparisons) that do not suffer from the loss of information imposed by the fixed and sliding dichotomies. The GOS-E is an ordinal measure, and the distance between any two consecutive categories may not be consistent. The proposed sliding score is also ordinal; however, the interpretation of the sliding scale as the number of levels above the favorable cut-point mitigates this concern somewhat. If a subject scores a +2, one knows that the subject scored two levels above the favorable cut-point.
Ordinal models for this illustration were not chosen for two reasons. First, the sliding score is straightforward to interpret. Further, as shown in previous research, 7 ordinal analysis yields only a slight improvement in power (85 to 87% power). A comparison of these alternatives is beyond the scope of this article. Although post hoc analysis of the ProTECT trial data suggests normality of the sliding score, this may not be the case for future trials; however, normality of the underlying score is not required, because the sliding analysis described here is supported by the Central Limit Theorem for sufficiently large sample sizes.
The proposed scoring system has some limitations. The score is defined as the distance from the cutoff for favorable/poor outcome. The inherent assumption is that each improvement from one level of the GOS-E to the next is of equal clinical importance, and the resulting effect sizes should be considered in this context. One could consider alternative weightings for the sliding score, as was done on the utility-weighted modified Rankin scale. 7 .An effect size of 0.5, meaning that the intervention yields scores 0.5 levels above the favorable cut-point, may reach statistical significance with a given sample size, but the clinical significance of improvement change, which equates to less than 1 level on the scale, may not be obvious.
The fixed and sliding dichotomies demonstrate a clear advantage here, in that the effect size is interpretable regardless of its magnitude. The magnitude of the advantage, however, may depend on the relevant phase of study; the clinical meaning of a binary favorable outcome may be more desirable for clinicians interpreting the results of a definitive Phase 3 trial, whereas the more sensitive sliding score approach may be more useful to scientists and trialists planning the next phase of study. The proposed scoring system is based on the interplay between two ordinal variables; future studies may consider alternative scoring as well as alternative severity definitions, which may affect performance.
Conclusion
Going from sliding dichotomy to sliding scoring of the GOS-E has an impact on power and sample size calculations for a variety of severe TBI clinical trial designs. In our two-armed fixed trial design example, the power improves from 85% to 96%. In a seven-arm adaptive trial design, the probability of choosing the correct arm improves tremendously—for example, from 30% to 67%. We recommend that future clinical trials on severe TBI should consider designs and analyses that utilize the sliding scoring of the GOS-E rather than the sliding dichotomized GOS-E.
Footnotes
Acknowledgments
Partially supported by grants from the National Institute of Neurological Disorders and Stroke of the National Institutes of Health (U01NS095926, U01NS095814, U01NS099046, U24NS100655, 5U01NS062778).
Funding Information
During the conduct of the study, Dr. Yeatts and Dr. Martin report grants to the Medical University of South Carolina from National Institutes of Health, Dr. Meurer and Dr. Silbergleit report grants to the University of Michigan from National Institutes of Health, Dr. Barsan reports grants to the University of Michigan from NIH (NINDS, NHLBI), Dr. Korley reports grants to the University of Michigan from the National Institutes of Health and the Robert Wood Johnson Foundation, Dr. Gajewski reports grants to the University of Kansas Medical Center from National Institutes of Health.
Author Disclosure Statement
No competing financial interests exist.