
Abstract
Mild traumatic brain injury (mTBI) is common and can lead to persistent cognitive and behavioral symptoms. Although diffusion tensor imaging (DTI) has demonstrated some sensitivity to changes in white matter following mTBI, recent studies have suggested that more complex geometric models of diffusion, including the neurite orientation dispersion and density imaging (NODDI) model, may be more sensitive and specific. Here, we evaluate microstructural changes in white matter following mTBI using DTI and NODDI in a mouse model, and compare the time course of these changes to behavioral impairment and recovery. We also assess volumetric changes for a comprehensive picture of the structural alterations in the brain and histological staining to identify cellular changes that may contribute to the differences detected in the imaging data. Increased orientation dispersion index (ODI) was observed in the optic tracts of mTBI mice compared with shams. Changes in fractional anisotropy (FA) were not statistically significant. Volume deficits were detected in the optic tract as well as in several gray matter regions: the lateral geniculate nuclei of the thalamus, the entorhinal cortex, and the superior colliculi. Glial fibrillary acidic protein (GFAP) and ionized calcium binding adaptor molecule 1 (Iba1) staining was increased in the optic tracts of mTBI brains, and this staining correlated with ODI values. A transient impairment in working memory was observed, which resolved by 6 weeks, whereas increased ODI, GFAP, and Iba1 persisted to 18 weeks post-injury. We conclude that the optic tracts are particularly vulnerable to damage from the closed-skull impact model used in this study, and that ODI may be a more sensitive metric to this damage than FA. Differences in ODI and in histological measures of astrogliosis, neuroinflammation, and axonal degeneration persist beyond behavioral impairment in this model.
Introduction
Mild traumatic brain injury (mTBI), which includes concussion, represents 80–90% of all traumatic brain injuries and is a leading cause of disability worldwide. 1,2 The symptoms of mTBI vary widely in both manifestation and severity, and can be physical, cognitive, and emotional in nature. Although most of those who incur an mTBI recover within a couple of weeks, as many as one third continue to experience symptoms for months or even years, a condition often referred to as post-concussion syndrome. 3,4 Currently, conventional imaging techniques (computed tomography [CT], T1- and T2-weighted magnetic resonance imaging [MRI]) can be used to rule out hemorrhage and skull fracture, 5 but are unable to detect the subtle pathology of mTBI, and, therefore, diagnosis and treatment options are based solely on symptoms.
The brain's white matter is known to be particularly vulnerable to damage from TBI, and white matter injury has been observed across the spectrum of injury severity in post-mortem tissue. 6 Animal studies using a variety of models (e.g., fluid percussion, 7 weight drop, 8 and closed-skull controlled impact 9 –11 ) have shown histological evidence of axonal injury and degeneration using beta-amyloid precursor protein (βAPP) immunoreactivity and silver staining, as well as neuroinflammation in the white matter. 7,8,10 –12 Additionally, several studies have used immunohistochemistry and/or electron microscopy to demonstrate myelin pathology following mTBI. 13 –15 White matter damage following mTBI has also been observed post-mortem in humans, 16,17 although human histological data is much more extensive for more severe TBI.
The development and application of imaging methods with the sensitivity and specificity to detect and describe mTBI white matter pathology has the potential to play an important prognostic role, to guide treatment, and to evaluate emerging treatments. Diffusion tensor imaging (DTI) is sensitive to white matter microstructure and has demonstrated some sensitivity to changes in white matter following mTBI. Fractional anisotropy (FA) is often used as an indicator of white matter integrity, with axial (AD) and radial (RD) diffusivities often assumed to reflect axonal and myelin aspects, respectively. Although differences in these metrics have been observed following mTBI, the magnitude, direction, locations, and duration of these changes have been inconsistent among studies. 18 –22 This lack of consensus is likely in part because of the inherent simplicity and non-specificity of the diffusion tensor model, which has limiting fundamental assumptions and output metrics that can be affected by many different factors. The application of more advanced diffusion models may provide improved specificity for assessment of mTBI.
The neurite orientation dispersion and density imaging (NODDI) model is a multi-compartment geometric model of diffusion that may be more specific to different types of cellular changes than standard DTI, as it employs a more physically relevant model of tissue microstructure. 23 The two most common metrics extracted from the NODDI model are the intra-cellular volume fraction, which reflects neurite density, and the orientation dispersion index (ODI), which is a metric between 0 and 1 that represents the spatial variation in the direction of intra-cellular diffusion, and reflects neurite dispersion.
Recently, a handful of studies have applied NODDI to examine white matter changes following mTBI. 24 –27 The general finding has been that although ODI is inversely correlated with FA, 23 the NODDI metrics may be more sensitive and are likely influenced by different factors than the DTI metrics, potentially providing more useful diagnostic information. Although these studies have shown that NODDI may be more sensitive to white matter changes following mTBI, it is not possible to evaluate the underlying structural changes that are reflected in the NODDI metrics in humans. Mouse models allow for the use of histological methods to investigate the cellular processes that contribute to the MRI measures. Further, pre-clinical models allow the time course of changes following injury to be characterized completely, and avoid many of the confounds of human studies, such as variability associated with age, injury mechanism, injury location and severity, time since injury, and comorbidities. To our knowledge, this is the first study to apply NODDI to a pre-clinical model of mTBI.
The primary objective of this study was to evaluate microstructural changes in white matter following mTBI in a mouse model using DTI and NODDI. Volumetric changes were also assessed to provide a comprehensive picture of the structural alterations in the brain. As mTBI studies in humans have observed that changes in DTI metrics may persist beyond symptom resolution, 19 we also endeavored to characterize the time course of behavioral impairment and recovery to complement the imaging results. Further, we used immunohistochemistry to identify cellular changes that may contribute to the differences detected in the imaging data.
Methods
Animals and experimental timeline
All animal work was approved by the Centre for Phenogenomics (TCP) Animal Care Committee. Male C57BL6/J mice (TCP in-house colony) received an mTBI or sham surgery at 8 weeks of age (n = 15/group/time point [120 mice total]). The mice underwent 5 days of behavioral testing beginning at 3 days, or 6, 12, or 18 weeks post-injury. Following the final behavioral testing session, 13 of the mice/group/time point (except that there were 12 mTBI mice at 18 weeks because 1 died during surgery) were fixed via transcardial perfusion for ex vivo MRI and subsequent histological processing (the other 2 mice/group/time point [16 mice] were prepared differently for another study not included in this manuscript). The mice were housed three per cage with mTBI and sham animals housed together. All of the mice from a given cage underwent the procedures on the same days.
mTBI procedure
mTBI, classified as mild based on the absence of injury apparent on T2-weighted MRI and standard hematoxylin and eosin (H&E) histology collected during the model optimization, was induced using a closed-skull impact. Mice were anesthetized using isoflurane (4% for induction, 2–2.5% for maintenance) and secured in a stereotactic frame using non-rupture ear bars (Stoelting Co., USA). An electromagnetically driven controlled cortical impact device (ImpactOne, Leica Biosystems, Canada) was used to deliver an impact to the exposed skull centered on the parietal bone (1.8 mm right of midline, midway between bregma and lambda) with a 5-mm metal tip to a compression depth of 1.2 mm at 2 m/sec with a dwell time of 200 ms. The impactor was rotated by 8 degrees in order for the impact to be delivered perpendicularly to the skull. Isoflurane was suspended for 30 sec prior to the impact and until breathing resumed. The duration of apnea following the impact was measured (average 74 ± 31 sec, range 22–140 sec). Sham animals underwent the same procedure, including analgesia, equivalent anaesthesia (isoflurane was suspended for 1 min at an equivalent time during the procedure to mimic the impact timing), and skull exposure, but did not receive the impact. Analgesia was provided via 0.1 mL 0.1% xylocaine (with epinephrine) injected under the scalp prior to the incision, 0.1 mL 0.125% bupivacaine injected under the scalp following suturing, and 0.05 mg/kg buprenorphine administered subcutaneously at the beginning of the surgical procedure, 8–12 h later, and then again at 24 h post-surgery if needed (∼10% of the mTBI mice). All mice received a subcutaneous injection of lactated Ringers with 5% dextrose at 24 h post-surgery for hydration and nutrition support and to keep the injection schedule consistent for all mice.
Behavioral testing
Behavioral tests were conducted in the following order over 5 consecutive days (one test per day) to assess functional impairment after mTBI: (1) the open field test, in which the ambulatory time and the time spent in the center of the field during the first 5 min of the 20-min test were measured to assess locomotor activity and anxiety-like behaviors, respectively; (2) the Y-maze spontaneous alternation test, in which the number of successful alternations, defined as entering the three arms of the maze consecutively without a repeated arm visit, were counted over a 5-min period to assess spatial working memory; (3) the light/dark test, in which the amount of time spent in the dark, avoiding the brightly lit side of the arena, was measured over a 5-min period as an additional measure of anxiety-like behavior; (4) the tail suspension test, in which the time spent immobile while being suspended by the tail was measured over a 6-min period to assess despair/depressive-like behavior; and (5) the pre-pulse inhibition test, in which the startle response to 100-dB white noise preceded by lower-intensity pre-pulses (70, 75, 80, or 80 dB) was measured over a 30-min testing period to assess sensorimotor gating. Additional details about the behavioral testing protocols are included in the supplementary information (Fig. S1). The SmithKline Beecham, Harwell, Imperial College, Royal London Hospital, phenotype assessment (SHIRPA) standardized screening protocol was also conducted on the 1st day of testing in order to assess the general health status of the mice. 28 The experimenter performing the behavioral tests (M.M.) was blinded to group (mTBI or sham) whenever possible (mouse identifiers did not include group) and experimenter bias was minimized by using computerized automated testing paradigms.
Behavioral data from the open field test, the Y-maze, the light/dark test, and the tail suspension test were analyzed using linear mixed-effects models with group and time as covariates and including a group-by-time interaction term as well as random intercepts for each cage to account for common factors affecting mice that were housed together. For the pre-pulse inhibition test, a group-by-time-by-intensity interaction model was used, with random intercepts for both pre-pulse intensity and cage. The Satterthwaite approximation was used to estimate the degrees of freedom and p values. Where significant interactions were found, post-hoc linear mixed effects models were used to compare mTBI and sham groups at each time point separately. P values <0.1 are reported.
Perfusion fixation
Following the final behavioral testing session, the mice were perfusion fixed as described previously. 29,30 Briefly, the mice were anesthetized with an intraperitoneal injection of 120 mg/kg ketamine and 12 mg/kg xylazine and perfused transcardially at 1 mL/min with 30 mL phosphate buffered saline (PBS) containing 1 μL/mL heparin and 2 mM gadoteridol (ProHance®, Bracco Diagnostics, USA) followed by 30 mL 4% paraformaldehyde (PFA) in PBS containing 2 mM gadoteridol. The brains were left in the skulls and post-fixed overnight in 4% PFA with 2 mM gadoteridol and then left for at least 1 month in PBS containing 2 mM gadoteridol and 0.02% sodium azide before MRI. 31
MRI acquisition
Ex vivo imaging was performed on a 7-T Agilent MRI system using a custom-built solenoid radiofrequency (RF) coil array with the capability of imaging up to 16 samples at once. 32 The brains were immersed in fluorocarbon fluid (Fluorinert, 3M) and imaged using a multi-shell diffusion-weighted imaging protocol with fast spin-echo readout and the following parameters: 30 directions (equally distributed on a sphere) at b = 7300 mm2/sec, 20 directions at b = 5070 mm2/sec, 15 directions at b = 2080 mm2/sec and 5 b = 0 images; 100 μm isotropic resolution; diffusion gradient duration (δ) = 9 ms; interval between diffusion gradients (Δ) = 17 ms; repetition time (TR)/first echo time (TE)/echo spacing (ESP)/echo train length (ETL) = 400 ms/38 ms/8 ms/6; scan time ∼22 h. A short phase measurement scan was acquired at the end of each imaging session to enable the removal of spurious phase caused by gradient imperfections and eddy currents that can lead to image artefacts. This phase was removed from the acquired k-space data prior to image reconstruction, and resulted in significant reduction of artefacts. 33 Representative images are shown in Figure S2.
MRI data processing and analysis
Following correction for diffusion gradient non-linearity bias, the data were fit with the tensor model using DSI Studio (
The five b = 0 images for each mouse were averaged and then registered together to yield a study average image using an automated linear and non-linear registration pipeline. 41,42 The transformations from this registration were then applied to the DTI and NODDI metric maps to bring these maps into the common space. Structural atlases were created for each brain using the multiple automatically generated templates (MAGeT) brain segmentation algorithm. 43,44 Comparison between mTBI and sham groups was performed for each metric at each voxel in the brain and for each structure in the atlas. Additionally, to assess volume differences between mTBI and sham groups, the determinant of the Jacobian matrix was computed for each transformation between the b = 0 images and the common space, providing a measure of the local volume change at every voxel. The volumes of each atlas structure were calculated by summation of voxels across the atlas structures in each segmented brain image.
For all imaging measures, statistical comparisons were initially made between mTBI and sham groups using a linear mixed-effects model with group and time as covariates, including a group-by-time interaction term and random intercepts for each cage to account for common factors affecting mice that were housed together. As no group-by-time interactions were observed, a simpler model without the interaction term was used for the statistical analyses presented here. As with the behavioral data, the Satterthwaite approximation was used to estimate degrees of freedom. Correction for multiple comparisons was performed using the false discovery rate (FDR) method 45 and results at a q-value <0.2 are reported. For clearer visualization of the fixed group effects, the data presented in the plots in this manuscript were adjusted by the random intercepts for each cage. All statistical analyses were performed using R 46 with image analysis conducted using the RMINC package. 47
Immunohistochemical staining
Three mice per group per time point were chosen for histological analysis. In order to ensure that these samples were well representative of the groups, the samples were chosen based on ODI values in the right optic tract: (1) the one closest to the median, (2) the one closest to the first quartile above the median, and (3) the one closest to the first quartile below the median. In preparation for immunohistochemical staining, the brains were dissected and cryoprotected by soaking in 15% sucrose in PBS for 1 day followed by 2 days in 30% sucrose in PBS. The brains were then cryosectioned at 40 μm thick in a 1:5 series beginning 280 μm before the anterior edge of the 5-mm impact and extending to 280 μm beyond the posterior edge of the impact. Adjacent sections centered about sections corresponding to regions of interest (ROI) identified in the MRI data were immunostained for glial fibrillary acidic protein (GFAP), an astrocyte marker to visualize astrogliosis, or ionized calcium binding adaptor molecule 1 (Iba1), a marker for microglia to visualize neuroinflammation. Additional adjacent sections were stained for visualization of axonal degeneration using the FD Neurosilver Kit II (FD Neurotechnologies Inc.) following the protocol provided with the kit. For immunostaining, the sections were stained free floating in 12-well plates with four sections/well. Matched mTBI and sham samples were stained on the same day. Antigen retrieval was performed by incubation in sodium citrate buffer (pH 6) for 20 min at 90°C and then allowing the sections to cool in the buffer for 20 min. The sections were permeabilized by washing with 0.1% Triton-X-100 in PBS for 5 min, endogenous peroxidases were quenched by incubating with 0.3% H2O2 for 30 min followed by three 5-min washes with 0.1% Triton-X-100, and then non-specific secondary antibody binding was blocked by incubating with 5% normal goat serum (Jackson ImmunoResearch) for 1 h. The primary antibodies (rabbit anti-GFAP at 1:4000 [Dako Z0334] or rabbit anti-Iba1 at 1:6000 [Wako 019-19741]) were then applied for overnight incubation at 4°C. Following washing with PBS, biotinylated goat anti-rabbit secondary antibody (Jackson ImmunoResearch, 1:4000) was applied for 2 h at room temperature with 1% normal goat serum. Following washing, the sections were incubated with ExtrAvidin Peroxidase (Sigma, 1:1500 in PBS) for 1 h, washed, and then reacted with DAB (Vector Labs) for 1 min. Stained sections were mounted on gelatin-coated slides and allowed to dry overnight, then cleared and mounted with Cytoseal 60 (Thermo Scientific Richard-Allan Scientific, USA).
Histology quantification
Brightfield images of GFAP-, Iba1-, and Neurosilver-stained sections of the optic tracts were acquired at 10 × magnification on a Nikon Eclipse Ni-U microscope with the same exposure time, light brightness, and white balance settings for all images. For quantification of GFAP and Iba1 staining (no quantification of Neurosilver staining was conducted), images were also acquired of the hippocampus that were used to determine an appropriate threshold for defining positive stain, as this part of the brain provided images that had relatively even representation of pixel intensities covering the full range from background to dark positive stain. Staining quantification was performed using Fiji (ImageJ). 48 The images were converted to 8-bit gray scale, and background subtraction was performed using the sliding paraboloid method with a rolling ball radius of 100 pixels. Thresholds defining positive stain were determined from the average threshold obtained using the default IsoData method on the hippocampus images from each staining date (at least 20 images per staining date) and the appropriate date-specific threshold was applied to each optic tract image. ROIs were manually drawn by an experimenter blinded to group (L.M.G.) in the optic tracts in which the area fraction of positive stain was measured. One or two sections were included per sample per stain, depending on the section location relative to the corresponding MRI slice location (∼1.6 mm posterior to bregma) and if more than one section was used, an average was calculated such that each sample was represented by a single number. Statistical comparison between mTBI and sham groups (collapsed across time as no group-by-time interaction was observed in the MRI analyses and the number of samples per time point for the histological analysis was small) was performed with the non-parametric Mann–Whitney U test. Correlation analyses were used to assess the relationship between MRI metrics (ODI and FA) and staining (GFAP and Iba1) in the optic tracts. The ipsilateral and contralateral sides were correlated separately to ensure that the data points used in the correlations were independent. Correlations with p < 0.1 are reported.
Results
ODI is increased in the optic tracts after mTBI
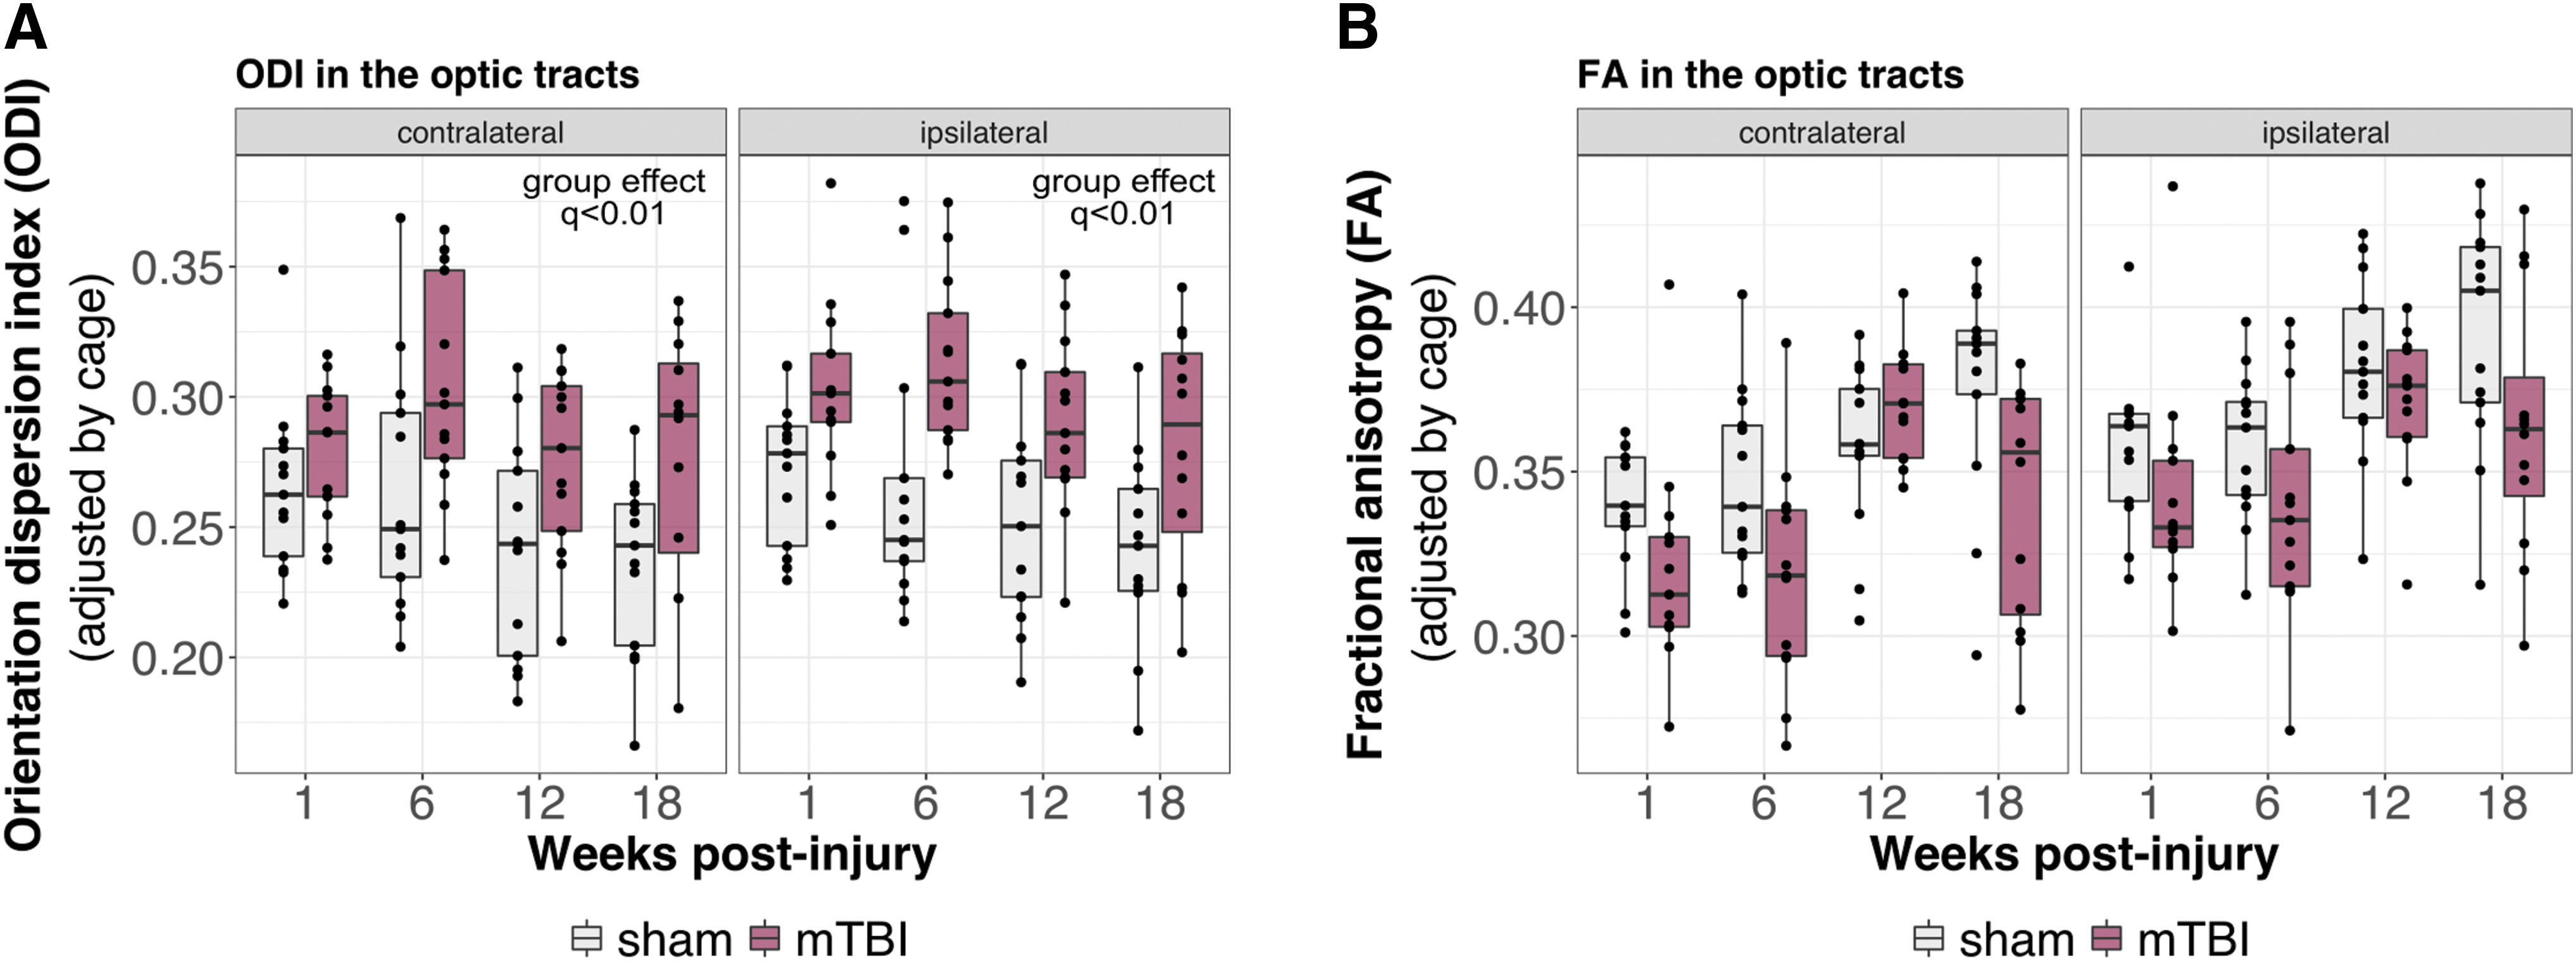
A voxel-by-voxel comparison between mTBI and sham brains revealed increased ODI in voxels restricted to the optic tracts following mTBI (Fig. 1A; mTBI vs. sham effect independent of time, thresholded at q < 0.2). These differences were sufficient to result in significantly increased ODI in the left and right optic tracts when evaluated as whole structures (Fig. 2A; mTBI vs. sham effect independent of time, q < 0.01). Plots of ODI across time reveal higher ODI in the optic tracts of mTBI brains at all time points, and to a greater degree on the side ipsilateral to the impact. Decreased FA was also observed in the optic tracts (Fig. 2B), but did not reach statistical significance, suggesting that ODI may be a more sensitive metric to the pathology present in the optic tracts following mTBI. A group-by-time interaction was not observed, suggesting no recovery of the microstructure following injury over the observed time frame. Voxelwise comparison of ODI and FA between mTBI and sham brains at the individual time points is shown in Figure S3. Plots of DTI and NODDI metrics other than FA and ODI in the optic tracts are shown in Figure S4.
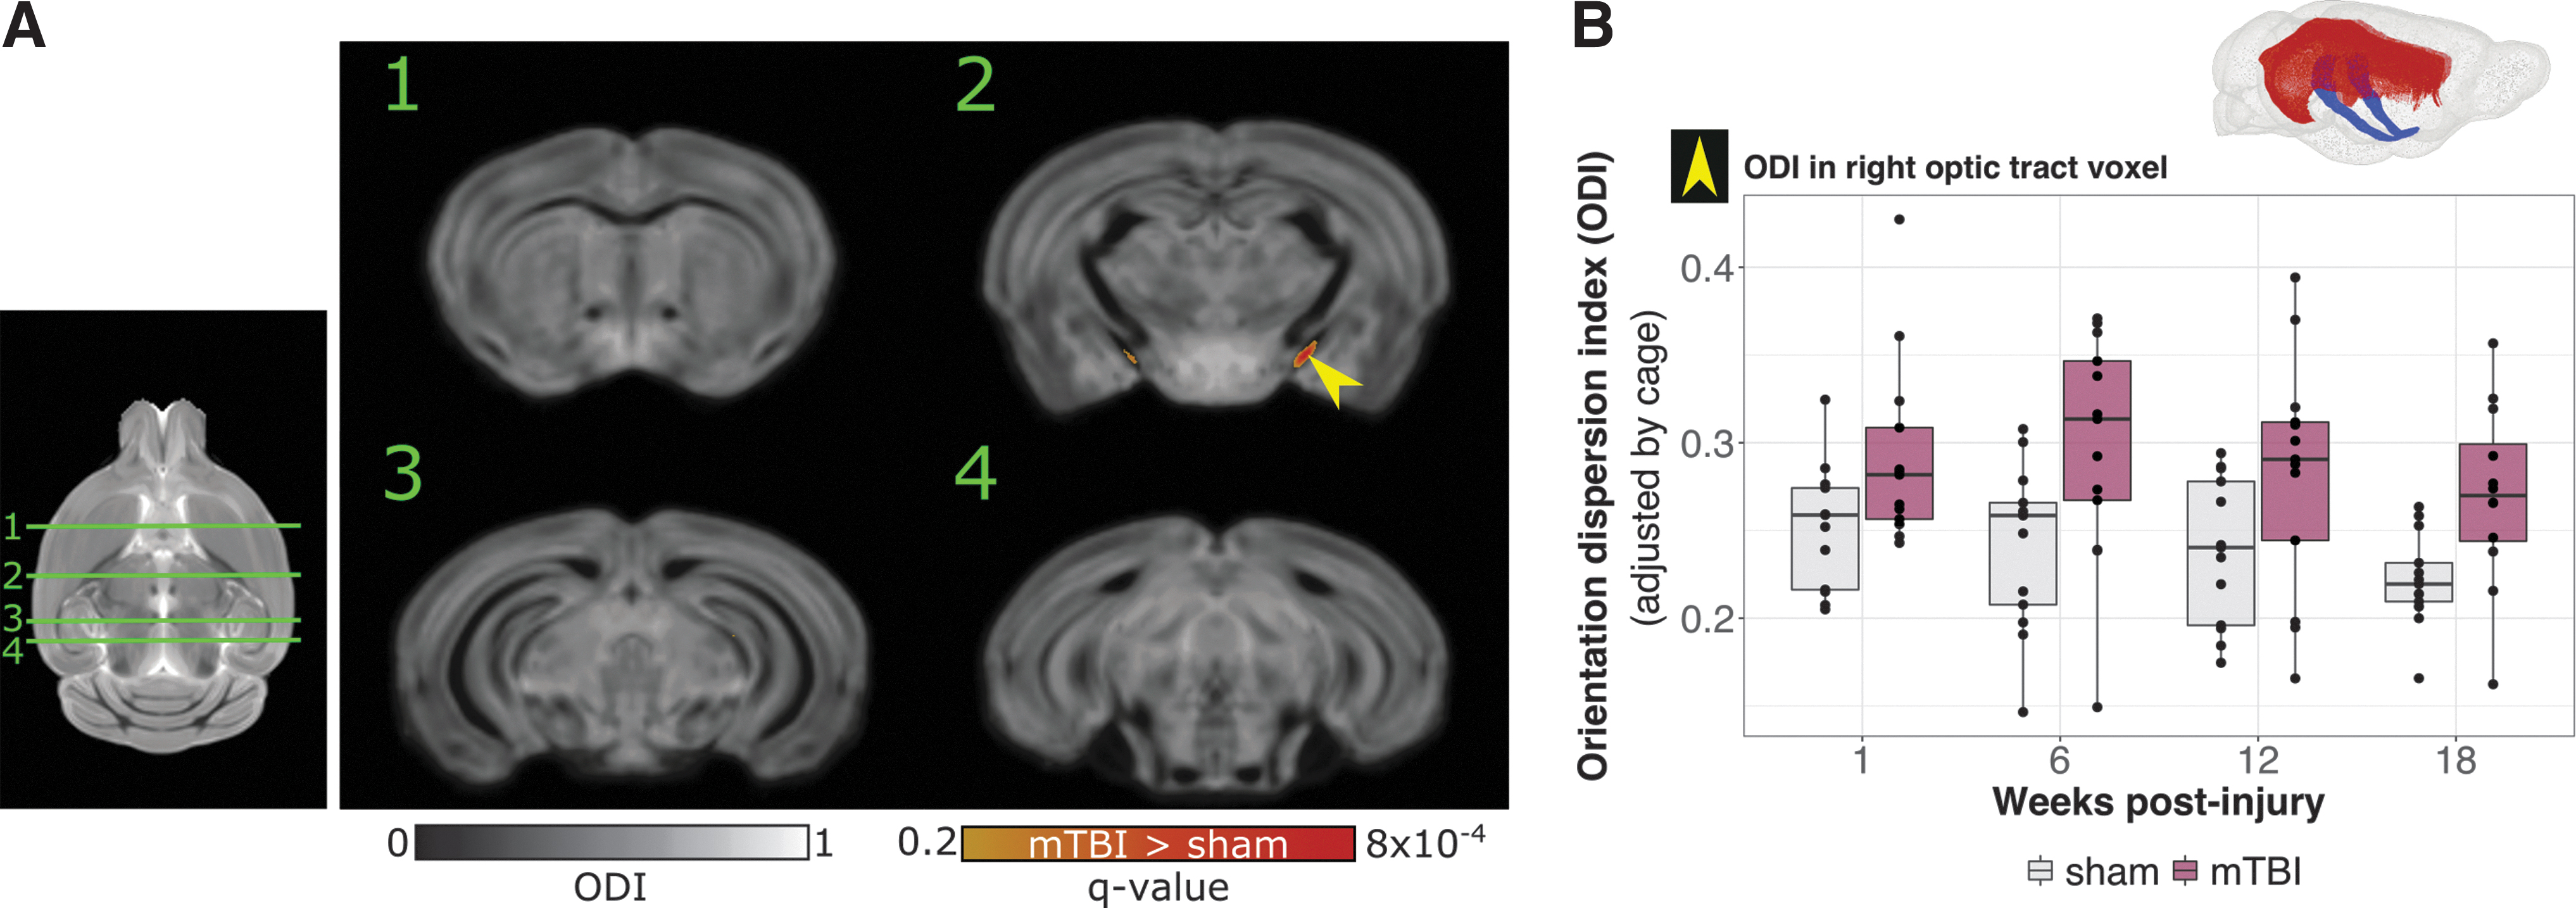
Orientation dispersion index (ODI) differences in mild traumatic brain injury (mTBI) versus sham brains.
mTBI leads to volume decreases in the optic tract, lateral geniculate nuclei (LGN), superior colliculus, and entorhinal cortex
Volume differences were observed in the contralateral optic tract (Fig. 3F) and in several gray matter regions (Fig. 3A–E). mTBI brains were found to be smaller than sham brains in voxels within the LGN of the thalamus, the ipsilateral entorhinal cortex, and the superior colliculi (Fig. 3A; mTBI vs. sham effect independent of time, thresholded at q < 0.2). Although a significant interaction between group and time was not detected, the evolution of volume differences over time can be visualized in the statistics maps that show voxelwise volume differences between mTBI and sham mice at individual time points (Fig. 3B; mTBI vs. sham effect at each time point separately, thresholded at uncorrected p < 0.01) and corresponding plots of individual voxels within the different regions (Fig. 3C–E).

Volume differences between mild traumatic brain injury (mTBI) and sham brains.
mTBI causes a transient impairment in working memory
The Y-maze spontaneous alternation task was used to assess working memory post-mTBI at 4 days, or 6, 12, or 18 weeks post-injury. Statistical comparison between mTBI and sham mice revealed significant group (p = 0.012) and time (p = 0.017) effects and a group-by-time interaction (p = 0.083) in the number of successful alternations performed during the test. Post-hoc linear mixed effects models at the individual time points revealed that the impaired performance on the test was transient, with mTBI mice having fewer successful alternations at 4 days post-injury (p = 0.078), which normalized at the other time points (Fig. 4). No significant differences were observed between mTBI and sham mice on any of the other behavioral assessments that were conducted (SHIRPA, open field, light/dark test, tail suspension, and pre-pulse inhibition; Fig. S1).

Y-maze spontaneous alternation task in mild traumatic brain injury (mTBI) and sham mice. mTBI mice performed fewer successful alternations at 4 days than shams (*p < 0.1). This difference was transient, and resolved by 6 weeks post-injury (group-by-time interaction, p < 0.1).
Astrogliosis and neuroinflammation may contribute to increased ODI following mTBI
Increased GFAP, Iba1, and Neurosilver staining was observed in the optic tracts following mTBI (Fig. 5). The fractional area of positive GFAP staining in the optic tracts was significantly higher in mTBI brains than in shams (group difference collapsed across time, p < 0.001) with the difference appearing to emerge at 6 weeks and persisting to 18 weeks (Fig. 5B). Iba1 staining in the optic tracts was also increased in mTBI brains compared with shams (group difference collapsed across time, p < 0.0001), although in this case the increased staining could be detected starting at the 1-week time point (Fig. 5C).
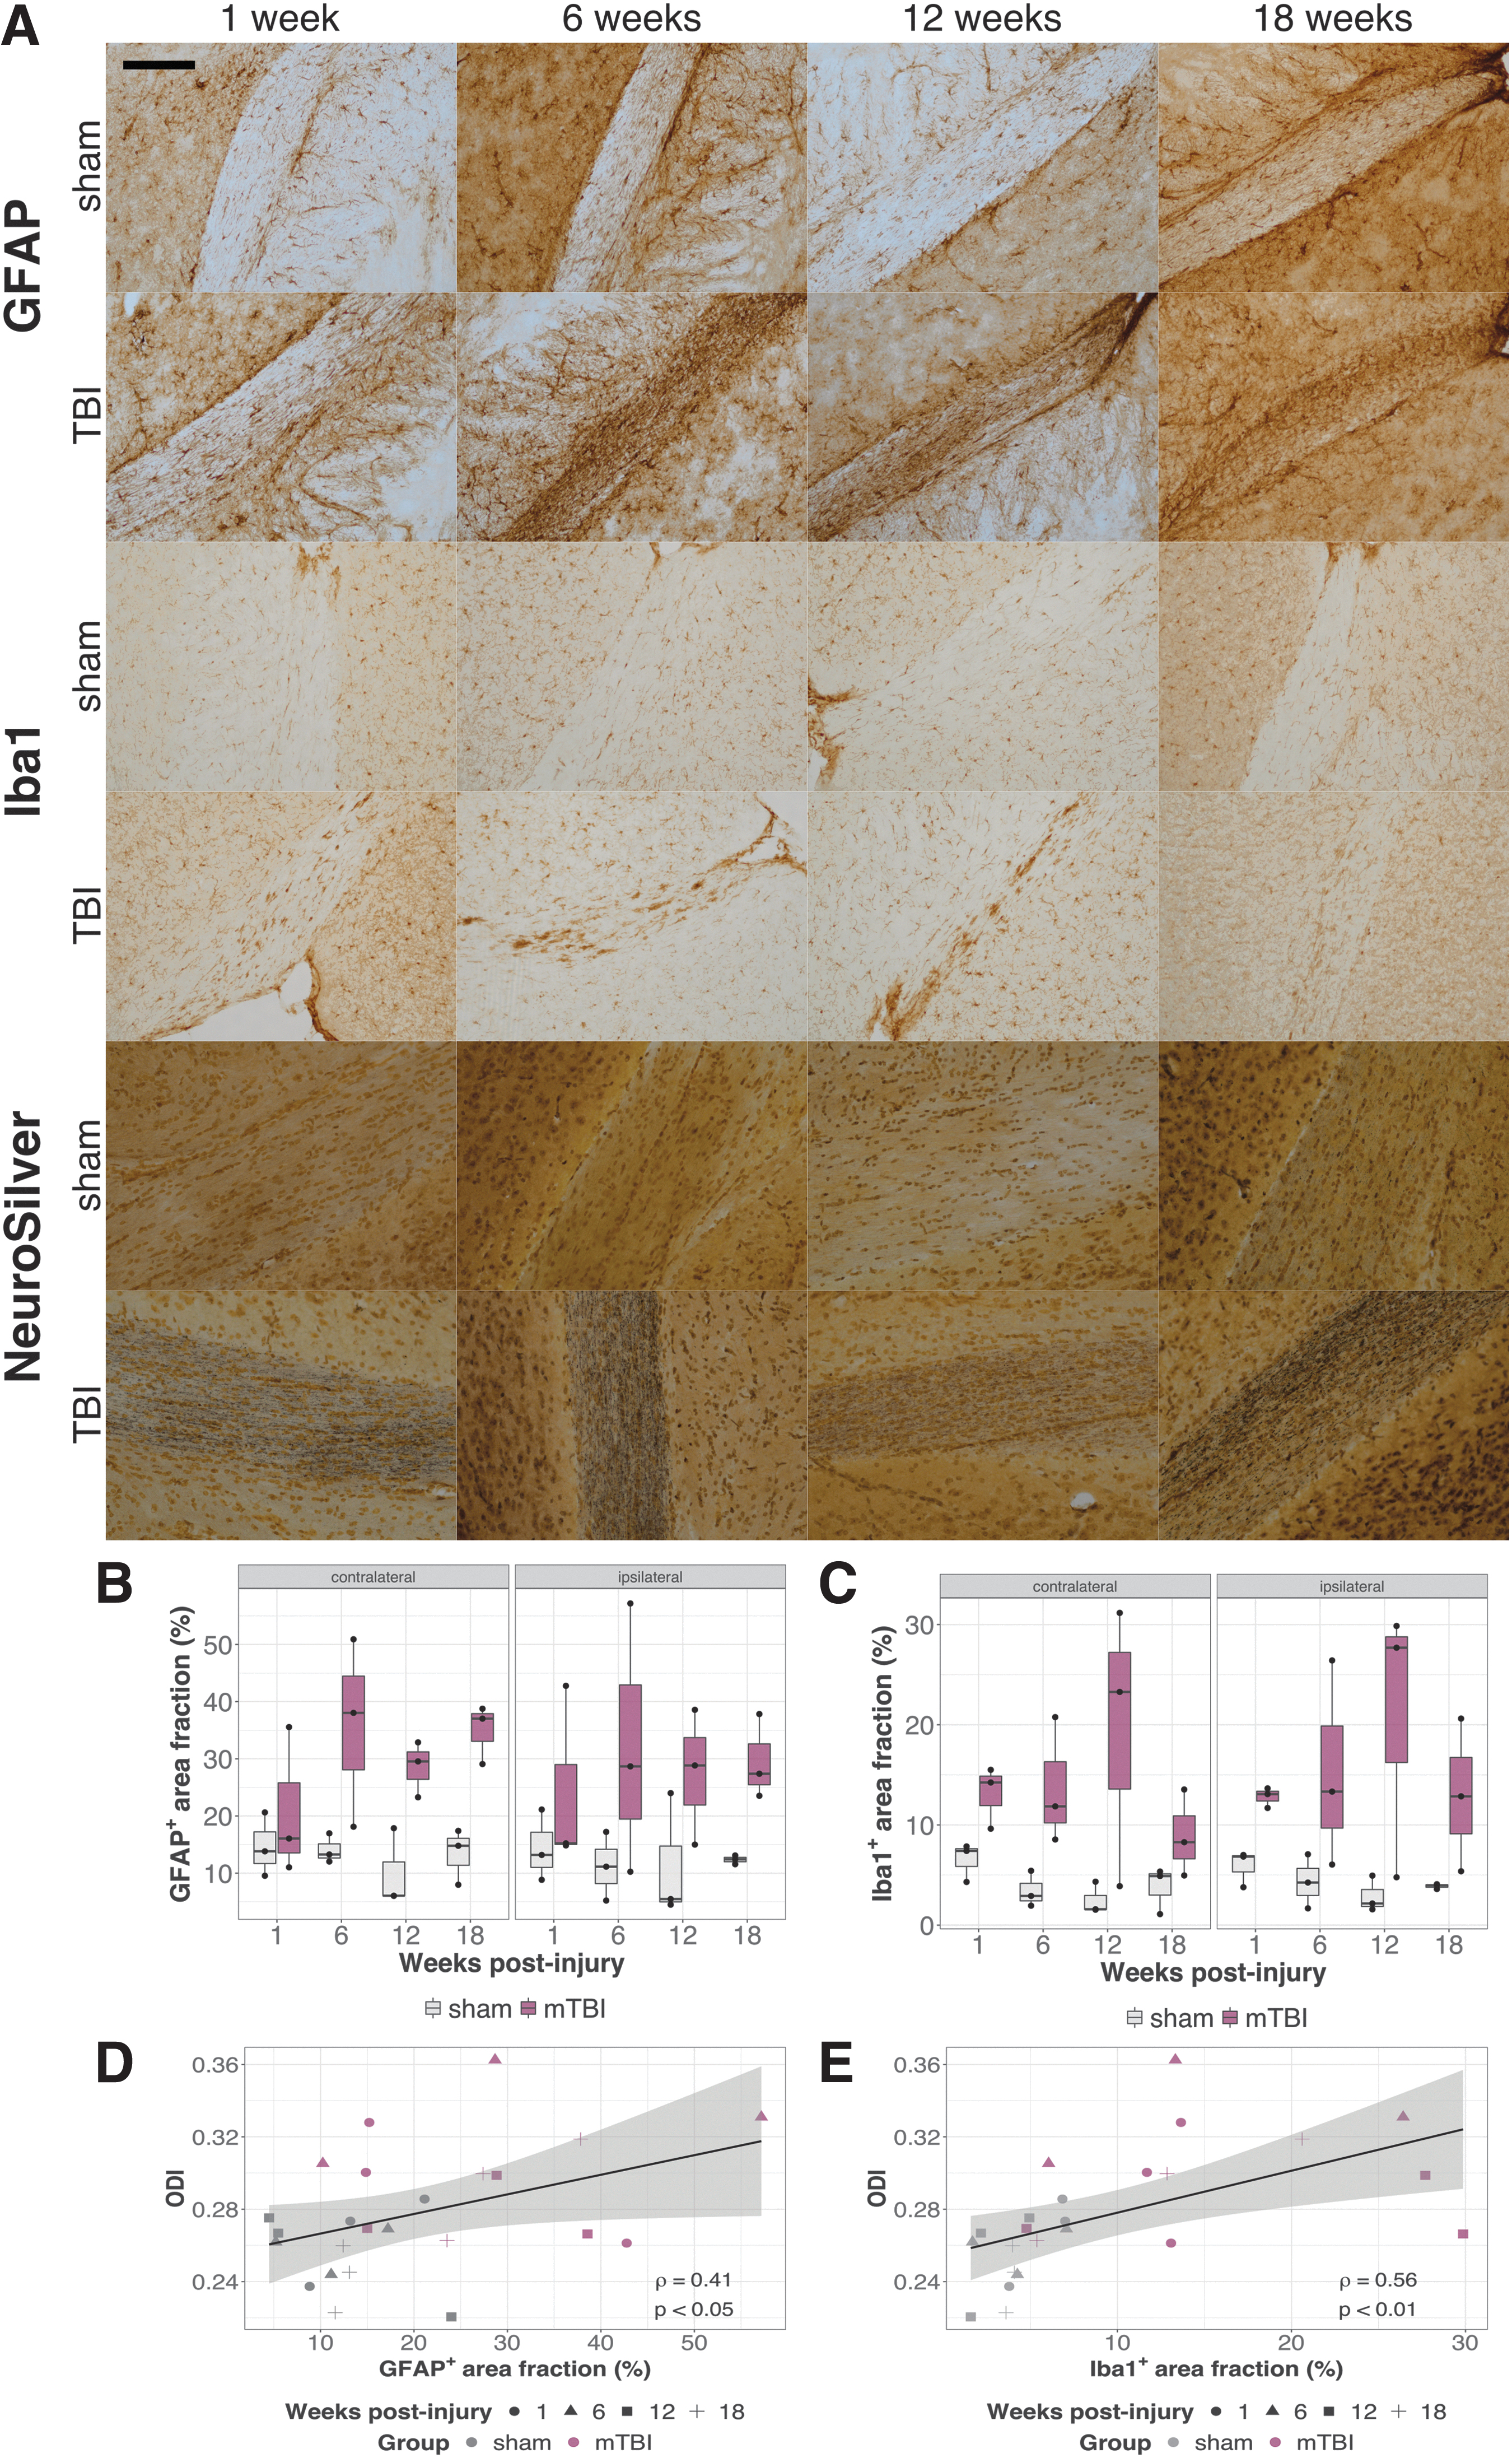
Neuroinflammation and axonal degeneration in the optic tracts post-mild traumatic brain injury (mTBI).
The temporal pattern of the GFAP and Iba1 staining in the optic tracts appeared similar to the ODI changes and indeed, the staining was found to correlate with ODI (Fig. 5D,E [ipsilateral optic tracts]; Pearson's correlation coefficients ρ = 0.41, p < 0.05 for GFAP and ρ = 0.56, p < 0.01 for Iba1). The correlations of FA with either GFAP or Iba1 staining were not statistically significant (Fig. S5; ρ ≈ −0.2, p > 0.15).
Discussion
Here we demonstrate that a single-impact closed-skull model of mTBI produces white matter injury detectable with advanced diffusion MRI, which corresponds to glial reactivity. The behavioral impairment is subtle and transient, with impaired performance on the Y-maze at 4 days post-injury, which resolves by 6 weeks. Although the Y-maze is most often considered a test for working memory, it may also be interpreted as a test of attention. Our results are consistent with what has been reported in clinical mTBI studies, in which transient impairments in working memory and attention are among the most commonly reported cognitive impairments following mTBI. 49
Our imaging results suggest that the optic tracts are particularly vulnerable to injury in this model. We show significantly increased ODI in the optic tracts, particularly in the more ventral regions. Although we also see possible FA changes in and near the optic tracts, the spatial pattern appears to be slightly different, with FA differences perhaps being more prominent in the dorsomedial part of the optic tracts (Fig. S3). This specific vulnerability of the optic tracts has also been noted in several other pre-clinical mTBI studies. 10,50,51 In these studies, evidence of damage in the optic tract was observed using silver staining and GFAP immunoreactivity, demonstrating neural degeneration and astrogliosis, consistent with what we observe. Haber and coworkers 50 also observed decreased FA in the optic tract and other white matter regions that were positive for silver stain.
There are several possible mechanisms for the damage to the optic tracts in this model. As suggested by Evanson and coworkers, 51 with this being a closed-skull impact, the optic nerve may sustain a direct crush injury at the point where it passes through the optic canal, as this space may be compressed during the impact. Alternatively, or perhaps additionally, the geometry of the optic tracts, which are long tracts that traverse the brain in all three planes, may make these tracts particularly susceptible to stretching and shearing forces from the impact. Also, characteristics of the axons (e.g., size, distribution) and the myelin structure (e.g., density, thickness) in the optic tracts, may make them more vulnerable to damage. Although traumatic optic neuropathy (direct or indirect injury to the optic nerve) is usually associated with more severe TBI, vision problems are common following mTBI as well. 52,53 We did not observe any obvious visual impairments in these mice, but more sensitive characterization of their vision may be necessary if behavioral tasks involving visual cues are to be conducted.
Our data suggest that ODI may be a more sensitive metric than FA to the changes in the optic tracts in this model. Although one interpretation of increased ODI following injury is that it reflects increased dispersion of axons, one might expect FA to be similarly sensitive to this type of change. Changes in ODI may also be related to changes in the space surrounding the axons. We found that ODI correlated with GFAP and Iba1 staining. The infiltration of inflammatory cells (including activated astrocytes and microglia) into the optic tract would be expected to alter the diffusion of water in the area surrounding the axons. These cells have cellular processes (extensions) that are distributed irregularly in space and may therefore affect ODI similarly to an increase in neurite (axon) dispersion. The increased ODI in our study is likely to have been at least partially attributable to the infiltration of these cells responding to injury in the optic tract. This is in agreement with a recent study that measured the effects of manipulating microglial density on ODI and noted increased ODI with increased microglial density. 54 Other novel diffusion-weighted imaging techniques have also been shown to have greater sensitivity or specificity than standard DTI for investigating changes following mTBI. Tractography conducted using constrained spherical deconvolution of diffusion-weighted images is better able to resolve regions of crossing fibers than DTI. Additionally, the apparent fiber density measure obtained from this technique, as well as related track-weighted imaging metrics, such as the mean track curvature and track density, have shown sensitivity to changes post-TBI and detected a greater number of voxels affected by TBI than standard DTI metrics in a rat fluid percussion model. 55 –57 Although diffusion kurtosis imaging and the derived white matter tract integrity model appear to have relatively low sensitivity, changes in intra-axonal diffusivity may be more specific to axonal injury. 58,59 It is possible that each of these techniques is sensitive to different aspects of the pathological changes following mTBI, and that the application of mathematical models and validation with histological techniques will be necessary to characterize the specificity of each of the measures.
Not only was ODI altered in the optic tracts, but the volume of the contralateral optic tract was also found to be lower in mTBI brains than in shams. Interestingly, we also observed volume differences in gray matter regions of the visual pathway, specifically the lateral geniculate nuclei of the thalamus and the superior colliculus. It is possible that the volume loss in these structures is directly related to the structural changes and volume loss in the optic tracts, as these regions are both directly innervated by the optic tracts. The other region where we observed volume loss following mTBI was the entorhinal cortex. This structure is involved in navigation and memory, and given the role of the superior colliculus in integrating visual input with motion, as well as attention, the changes in these two structures may be relevant to the impairment in performance on the Y-maze that we observed. These structural results suggest that further characterization of attention and executive function, as well as visual processing, in this model may reveal other impairments.
There are several important considerations for interpreting the data from this study. Although the particular mTBI model was chosen for its high reproducibility and flexibility, it does require surgery and anesthesia, both of which can influence behavior and MRI. The inclusion of the surgical sham group served to mediate these effects, but it should be noted that other models that avoid these confounds are available and may yield different behavioral and/or MRI phenotypes. 60,61 The behavioral deficit that we observed was subtle, and recovered by 6 weeks, whereas MRI and histological changes persisted. However, it is possible that impairment would be more apparent in other behavioral domains. Further, the study was conducted using only male mice. As it is becoming increasingly evident that mTBI affects males and females differently, the results from this study may not generalize to females, and it is important that further studies include both sexes. 62 –64
The imaging in this study was performed ex vivo in a cross-sectional design. Although the cross-sectional design has the advantage of enabling histological analysis and MRI on the same brains, the diffusion of water in ex vivo tissue is different than it would be in vivo, and some of the contributions to diffusion MRI metrics in vivo may be absent ex vivo (and vice versa). The ex vivo protocol, however, allowed for full-brain coverage at high isotropic spatial resolution with three diffusion-weighted shells. For future in vivo studies, comparable multi-shell data could be collected with the application of acceleration techniques (e.g., parallel imaging; echo planar imaging). 65 –67 This acquisition would use a two-dimensional (2D) sequence with partial brain coverage and two diffusion-weighted shells, and would have reduced spatial resolution.
The mouse model has significant mechanical considerations when compared with the human model. The mouse brain has less white matter and is much smaller than the human brain, and would therefore require unrealizable acceleration to transfer the amount of energy usually involved in human concussions. Additionally, the mouse brain lacks the space surrounding the brain that is present in human heads and known to be a major factor in concussion injury. Nevertheless, the mouse model is valuable for studying how the brain reacts to damage at the cellular and molecular level and how changes following injury can be detected with non-invasive imaging.
Conclusion
In conclusion, NODDI is sensitive to white matter pathology following mTBI in a mouse model, and provides information not obtained from conventional DTI. Our data support continued development and validation of non-invasive MRI techniques in order to increase the specificity of the techniques to the various pathological features that are a result of mTBI. The identification of new tools for detecting and characterizing the brain damage caused by mTBI are necessary to be able to reliably predict who will recover and who will go on to experience persistent symptoms.
Footnotes
Acknowledgments
We thank Dr. Edward Dixon for his technical guidance and advice when we were establishing our controlled cortical impact model, and Parandis Kazemi for her assistance with the optimization of the surgical model used in this study.
Funding Information
This work was supported by an award from The Scottish Rite Charitable Foundation of Canada (ID#19119). MRI scan costs were covered by the Mouse Brain Imaging for Neurodevelopmental Disorders Platform Support Grant from Brain Canada and the Azrieli Foundation.
Author Disclosure Statement
No competing financial interests exist.
Supplementary Material
Supplementary Figure S1
Supplementary Figure S2
Supplementary Figure S3
Supplementary Figure S4
Supplementary Figure S5
References
Supplementary Material
Please find the following supplemental material available below.
For Open Access articles published under a Creative Commons License, all supplemental material carries the same license as the article it is associated with.
For non-Open Access articles published, all supplemental material carries a non-exclusive license, and permission requests for re-use of supplemental material or any part of supplemental material shall be sent directly to the copyright owner as specified in the copyright notice associated with the article.