




Abstract
Early prognostic information in cases of severe spinal cord injury can aid treatment planning and stratification for clinical trials. Analysis of intraparenchymal signal change on magnetic resonance imaging has been suggested to inform outcome prediction in traumatic spinal cord injury. We hypothesized that intraparenchymal T2-weighted hypointensity would be associated with a lower potential for functional recovery and a higher risk of progressive neurological deterioration in dogs with acute, severe, naturally occurring spinal cord injury. Our objectives were to: 1) demonstrate capacity for machine-learning criteria to identify clinically relevant regions of hypointensity and 2) compare clinical outcomes for cases with and without such regions. A total of 95 dogs with complete spinal cord injury were evaluated. An image classification system, based on Speeded-Up Robust Features (SURF), was trained to recognize individual axial T2-weighted slices that contained hypointensity. The presence of such slices in a given transverse series was correlated with a lower chance of functional recovery (odds ratio [OR], 0.08; confidence interval [CI], 0.02–0.38; p < 10–3) and with a higher risk of neurological deterioration (OR, 0.14; 95% CI, 0.05–0.42; p < 10–3). Identification of intraparenchymal T2-weighted hypointensity in severe, naturally occurring spinal cord injury may be assisted by an image classification tool and is correlated with functional recovery.
Introduction
Initial clinical evaluation of neurological status continues to be one of the simplest and most effective prognostic tools in cases of acute, severe spinal cord injury. Functional grading scales such as the American Spinal Injury Association Impairment Scale (AIS) in humans 1,2 and the Modified Frankel Score (MFS 3,4 ) in dogs are routinely used as the basis of discussion of likely outcomes with patients and owners, respectively. However, such early assessment may be unreliable. 5,6 Further, within the subgroup of patients with the most severe injuries, long-term functional outcome remains highly variable. 7,8 The search for diagnostic markers that can increase early information about functional outcome for all cases of spinal cord injury, but especially for the most acute and severe cases, continues and has often focused on magnetic resonance (MR) imaging parameters. 9 –11
In imaging, the majority of biomarkers have been developed for cervical spinal cord injuries, 9,10,12 although they have been generalized to thoracic and thoracolumbar application in some studies. 12,13 Recently, some commonly investigated features, including longitudinal extent of spinal cord T2 signal abnormality and maximum compressive scores, have been found to have mixed reliability in meta-analyses of human clinical data. 10 These same features have also shown mixed reliability in the context of canine spinal cord injury, 8,14 –17 which occurs most often in the thoracolumbar region, and have not been shown to provide additional predictive power beyond that afforded by application of functional grading scale alone. 16 There is growing evidence that axial image evaluation of spinal cord injury, in humans 11,18 –20 and in dogs, 21 may be associated with outcome. In particular, identification of intraparenchymal hypointensity on T2-weighted axial images has been shown to correlate with functional outcome in human cervical 11,20,22 –24 thoracic, and thoracolumbar 12,13 spinal cord injury.
One complicating factor in the clinical application of imaging biomarkers is the challenge of ensuring that the proposed criteria will be applied similarly by all observers, or even by the same observer uniformly across viewings. This may be measured experimentally as inter- and intraobserver agreement 21 and has been evaluated extensively with respect to judgment of compression 25 –30 ; however, in experimental reports of intramedullary signal change, irreducible variability between observers is often resolved by discussion and consensus 12,31,32 or addition of a tie-breaker observer, 20 which may not always be possible in emergencies. Further, some proposed biomarkers require multiple forms of advanced imaging 33,34 or specialized imaging sequences, 31,32,35,36 which may further limit generalized clinical application. Use of machine-assisted pattern recognition, for instance through an image classifier, may offer a means to standardize application of image feature criteria to MR data.
In this report, we examined axial T2-weighted images collected during routine evaluation of spinal cord injury in dogs presenting for complete motor and sensory loss below the level of a lesion with the epicenter between the T3 and L6 spinal cord segments (MFS 0, 4 most similar to AIS-A). We used a simple support vector machine (SVM) multi-class image classifier based on a Speeded-Up Robust Features (SURF) algorithm 37 for feature extraction to identify areas of intraparenchymal hypointensity that were likely to correlate with intramedullary hemorrhage. 38 –40 We then explored the association between classifier identification of this image pattern and functional outcome in 95 dogs. Our findings provide new evidence regarding the relationship between identification of intraparenchymal hypointensity on T2-weighted axial images and functional outcome in cases of severe spinal cord injury.
Methods
Case selection
Medical records were retrospectively reviewed, and new admissions were prospectively followed, for dogs presenting to the Texas A&M Veterinary Teaching Hospital between July 2011 and April 2019. To be included in this cohort, dogs had to be diagnosed with non-traumatic compressive spinal cord injury between T3 and L6 based upon MR imaging (MRI), which resulted in complete motor and sensory loss below the lesion. Injuries in this region typically occur because of acute intervertebral disc herniation resulting in a mixed compressive and contusive injury 41 –43 and are the most common cause of spinal cord injury in dogs. Included dogs had spinal cord dysfunction limited to the compressed regions of neuroparenchyma, without additional functional loss that could suggest that a progressive myelopathy consistent with ascending-descending (A-D) myelomalacia (see below) was already developing. Additionally, included dogs had to receive decompressive surgery or be euthanized with subsequent necropsy within 1 week of MRI. Breed, age (in years), sex and neuter status, time from onset of paraplegia to MRI, site of compression, and outcome were recorded for each included case. Times were binned into categories of <12 hours, 12–24 hours, 24–48 hours, or >48 hours.
Definition of ascending-descending myelomalacia
Approximately 10–20% 44 –47 of dogs with complete spinal cord injury resulting from acute compression by herniated intervertebral disc material will develop progressive A-D hemorrhagic necrosis of the spinal cord between 1 and 5 days after injury, 44 regardless of intervention. This condition is known as A-D myelomalacia. 44,46,48 Signs of ascending myelomalacia were defined as progressively bilaterally ascending cutaneus trunci muscle reflex 46,49,50 cutoff, hypoventilation, and development of truncal weakness and tetraparesis, with or without Horner's syndrome. Signs of descending myelomalacia were defined as progressive reduction and loss of abdominal tone, hindlimb reflexes, perineal reflex, and tail or anal tone occurring subsequent to initial presentation but within the first 7 days after injury. Pathologically defined myelomalacia was considered to be hemorrhagic necrosis within the medullary cavity of the spinal cord (see below).
Definition of outcome
Dogs that developed clinical signs of A-D myelomalacia after MRI, or those found to have myelomalacia on necropsy, were considered to have developed myelomalacia. Dogs with no signs indicative of A-D myelomalacia between surgery and follow-up phone conversation at least 4 weeks post-operatively, or at 4-to 6-week recheck examination, were considered not to have myelomalacia. Dogs that continued to have neurological examination findings consistent with complete motor and sensory loss at 4- to 6-week recheck or beyond were considered to have no recovery, given that the majority of dogs with complete injuries show some functional recovery by 42 days. 8,41 Dogs that showed at least three grades of improvement on MFS (were non-ambulatory with voluntary movement or were ambulatory) at 4- to 6-week recheck were considered to have recovered. Dogs with <4 weeks of follow-up time and no clinical or pathological identification of myelomalacia were excluded from recovery analyses.
Magnetic resonance imaging
All MRI studies were performed on a Siemens 3.0T Verio system (Siemens Medical Solutions USA, Inc., Malvern, PA) on dogs under general anesthesia and positioned in sternal recumbency. A standard series of images was obtained for all dogs; all evaluations, both human and computational, were made using T2-weighted images acquired with the parameters given in Supplementary Table S1. Cases for which complete T2-weighted sagittal and axial series were not available for review were excluded.
Observer evaluation of magnetic resonance imaging
For all analyses of hypointensity recognition in entire MRIs with human observers, two trained observers independently reviewed MRI studies from cases that had been anonymized and randomized. They were given access to T2-weighted axial and sagittal series from each case and allowed to use both in their judgments. Percent agreement was measured as the proportion of cases for which the observers made the same judgment of present or absent. Cohen's kappa value was computed by hand for two-category agreement as K = (pobs - pexp)/(1 - pexp), where pobs is the agreement between the two observers, and pexp is the agreement expected by chance (0.5).
Present/absent judgment
The observers were both board-certified radiologists who were aware that the purpose of the study was to identify possible imaging biomarkers correlated with outcome in dogs with severe spinal cord injury. The length of intramedullary T2-weighted hyperintensity associated with the site of subsequent surgical decompression was measured as a proportion of the length of the L2 vertebral body using both axial and sagittal images. 21 The presence or absence of intramedullary T2-weighted hypointensity, identified on either sagittal or axial images, was also recorded, as well as whether each observer was certain or uncertain of the present/absent judgment.
Qualified present/absent judgment
Two additional independent observers, one neurologist and one radiologist, reviewed the same cases described above using both axial and sagittal series. These observers were given similar information about the purpose of the study to that given to the other pair. The observers were not asked to record their certainty.
To qualify as “hypointensity present,” the following criteria needed to be met: Region of hypointensity >2 mm maximal diameter in axial plane Signal intensity of hypointense region similar to that of cortical bone Hypointensity located or extending cranial or caudal to the region of extradural spinal cord compression
Preparation of images for classification
T2-weighted axial images were used. OsiriX MD 10.0.4 was used for hand segmentation of the spinal cord by drawing a polygonal region of interest (ROI) around the spinal cord in each slice. ROIs were exported to Matlab (R2019a; The MathWorks, Inc., Natick, MA) for further application to the DICOM images. For each axial image, the ROI was applied to the DICOM image, and all pixels outside the ROI were set to null (NaN). The image was then cropped to remove the majority of null pixels. Each image was scaled by bilinear interpolation (each pixel value is a weighted average of pixels in a 2 × 2 neighborhood) to a uniform size of 62 × 50 pixels. Next, each image was z-scored on a standardized scale from 0 to 255 and stored as a Portable Network Graphics (bitmap of indexed colors) file.
Feature extraction
Features were identified from each of the images using the SURF algorithm as implemented in the Matlab Computer Vision Toolbox (The MathWorks, Inc.). A grid step size of 4 × 4 pixels was selected to balance reliable feature identification and computational efficiency and used to determine locations for feature extraction, with multi-scale features (pixel widths [32, 64, 96, and 128]). Features were rotation invariant. 51 Vocabulary sizes of 100, 500, and 1000 were explored. 52
Confirmation of discriminability
The resulting representations of the images in feature space were visualized using t-distributed stochastic neighbor embedding (t-SNE 53 ; as implemented in the Matlab Statistics and Machine Learning Toolbox; The MathWorks, Inc.), with relative distance between images calculated as Euclidean distance. Over multiple repetitions, one or more separable clusters were defined by unsupervised spectral clustering 54 when cluster number was allowed to vary from 1 to 8.
Validation of clustering
For 95 dogs, a random selection of two thirds of the images (3006) was evaluated over 6 repetitions. This fraction was chosen based on an estimated 2–3% of slices containing intramedullary hypointensity. After initial unsupervised clustering on all images, the class label for each image was taken to be the cluster index assigned unequivocally to the image in unsupervised clustering. Ten-fold stratified cross-validation was used to validate the cluster identity. 55 .
Global scoring of spinal cord magnetic resonance imaging using classifier output
For all spinal cord MRIs, each T2-weighted axial series was converted to a string of image categories, as determined by the image classifier. Image pre-processing was identical to that described for the images used in classifier development.
The association between the fraction of each image category present and clinical outcome was evaluated by a Kruskal-Wallis test implemented in Matlab (The MathWorks, Inc.).
Between-group difference evaluation
The proportion of dogs recovering or developing progressive neurological deterioration as a function of the presence or absence of intramedullary hypointensity was compared using Fisher's exact test, as was the comparison of lesion epicenter location. The difference in interval between onset of paraplegia and MRI was assessed using the Wilcoxon rank-sum (Mann-Whitney U) test.
Pathological evaluation of spinal cord
All dogs presented for necropsy were euthanized using overdose of pentobarbital. Necropsy was performed within 24 h (usually within 12 h) of euthanasia. The spinal cord was removed entire and fixed in formalin immediately. Gross observation of the spinal cord reported as areas of softening and red-purple intramedullary discoloration were taken as evidence of myelomalacia, with or without hemorrhage within the central canal. When performed, histopathological findings of acute intraparenchymal necrosis and hemorrhage, with or without vascular necrosis, were taken as evidence of myelomalacia. 56 –58
Statistical analysis
Unless otherwise stated, statistical analysis was carried out using built-in functions in Matlab (R2019a; The MathWorks, Inc., Natick, MA).
Differences in proportions were assessed with Fisher's exact test or Chi-squared test, as appropriate for the cell size.
Cohen's Kappa statistic was calculated as k = (p_o−p_e)/(1−p_e), where p_o is the agreement between raters, and p_e is the hypothetical agreement by chance.
Odds ratio (OR) was calculated as (a/c)/(b/d), where a/c is the odds of the poorer outcome in cases where hypointensity was identified, and b/d is the odds of the poorer outcome in cases where hypointensity was not identified. The 95% confidence interval (CI) of the OR was calcuated as CI = exp(ln(OR) ± Zalpha/2*sqrt(1/a + 1/b + 1/c + 1/d )), where Zalpha/2 was taken to be 1.96, reflecting an alpha of 0.05.
Results
Study population characteristics
A total of 95 dogs meeting the inclusion criteria were identified. The most common breed was the Miniature Dachshund (61 of 95; 64%). The median age of the dogs was 5 years (range, 2–13). There were 42 neutered males, 32 neutered females, 14 intact males, and 7 intact females. The majority of dogs had MRI performed between 12 and 48 h after onset of paraplegia (12–24 h, 50 of 95 [53%]; 24–48 h, 24 of 95 [25%]). Ten dogs had spinal cord compression from intervertebral disc herniation between the L3 and L6 vertebral bodies; the remaining 85 dogs had compression between T3 and L3. Overall, 24 dogs (25%) developed A-D myelomalacia (see Methods), 54 dogs (57%) showed functional recovery, and 17 (18%) dogs continued to have clinical examinations consistent with complete motor and sensory loss at last available recheck.
Observer identification of intramedullary signal change
A subset of 49 MRIs of the 95 identified cases (see Methods) were used for human observer classification. Of these, 12 (24%) developed A-D myelomalacia, 26 (53%) showed functional recovery, and 11 (22%) continued to have clinical examinations consistent with complete motor and sensory loss. The first pair of observers agreed that there was abnormal T2-weighted hyperintensity in 48 of 49 spinal cords. The range of T2-weighted hyperintensity length ratios was 1.4–15.9 (median, 5.9) for observer 1 and 0.0–13.7 (median, 4.6) for observer 2. Their scores were correlated (R = 0.77), but had a mean difference of 1.35 × the length of L2 (Fig. 1).
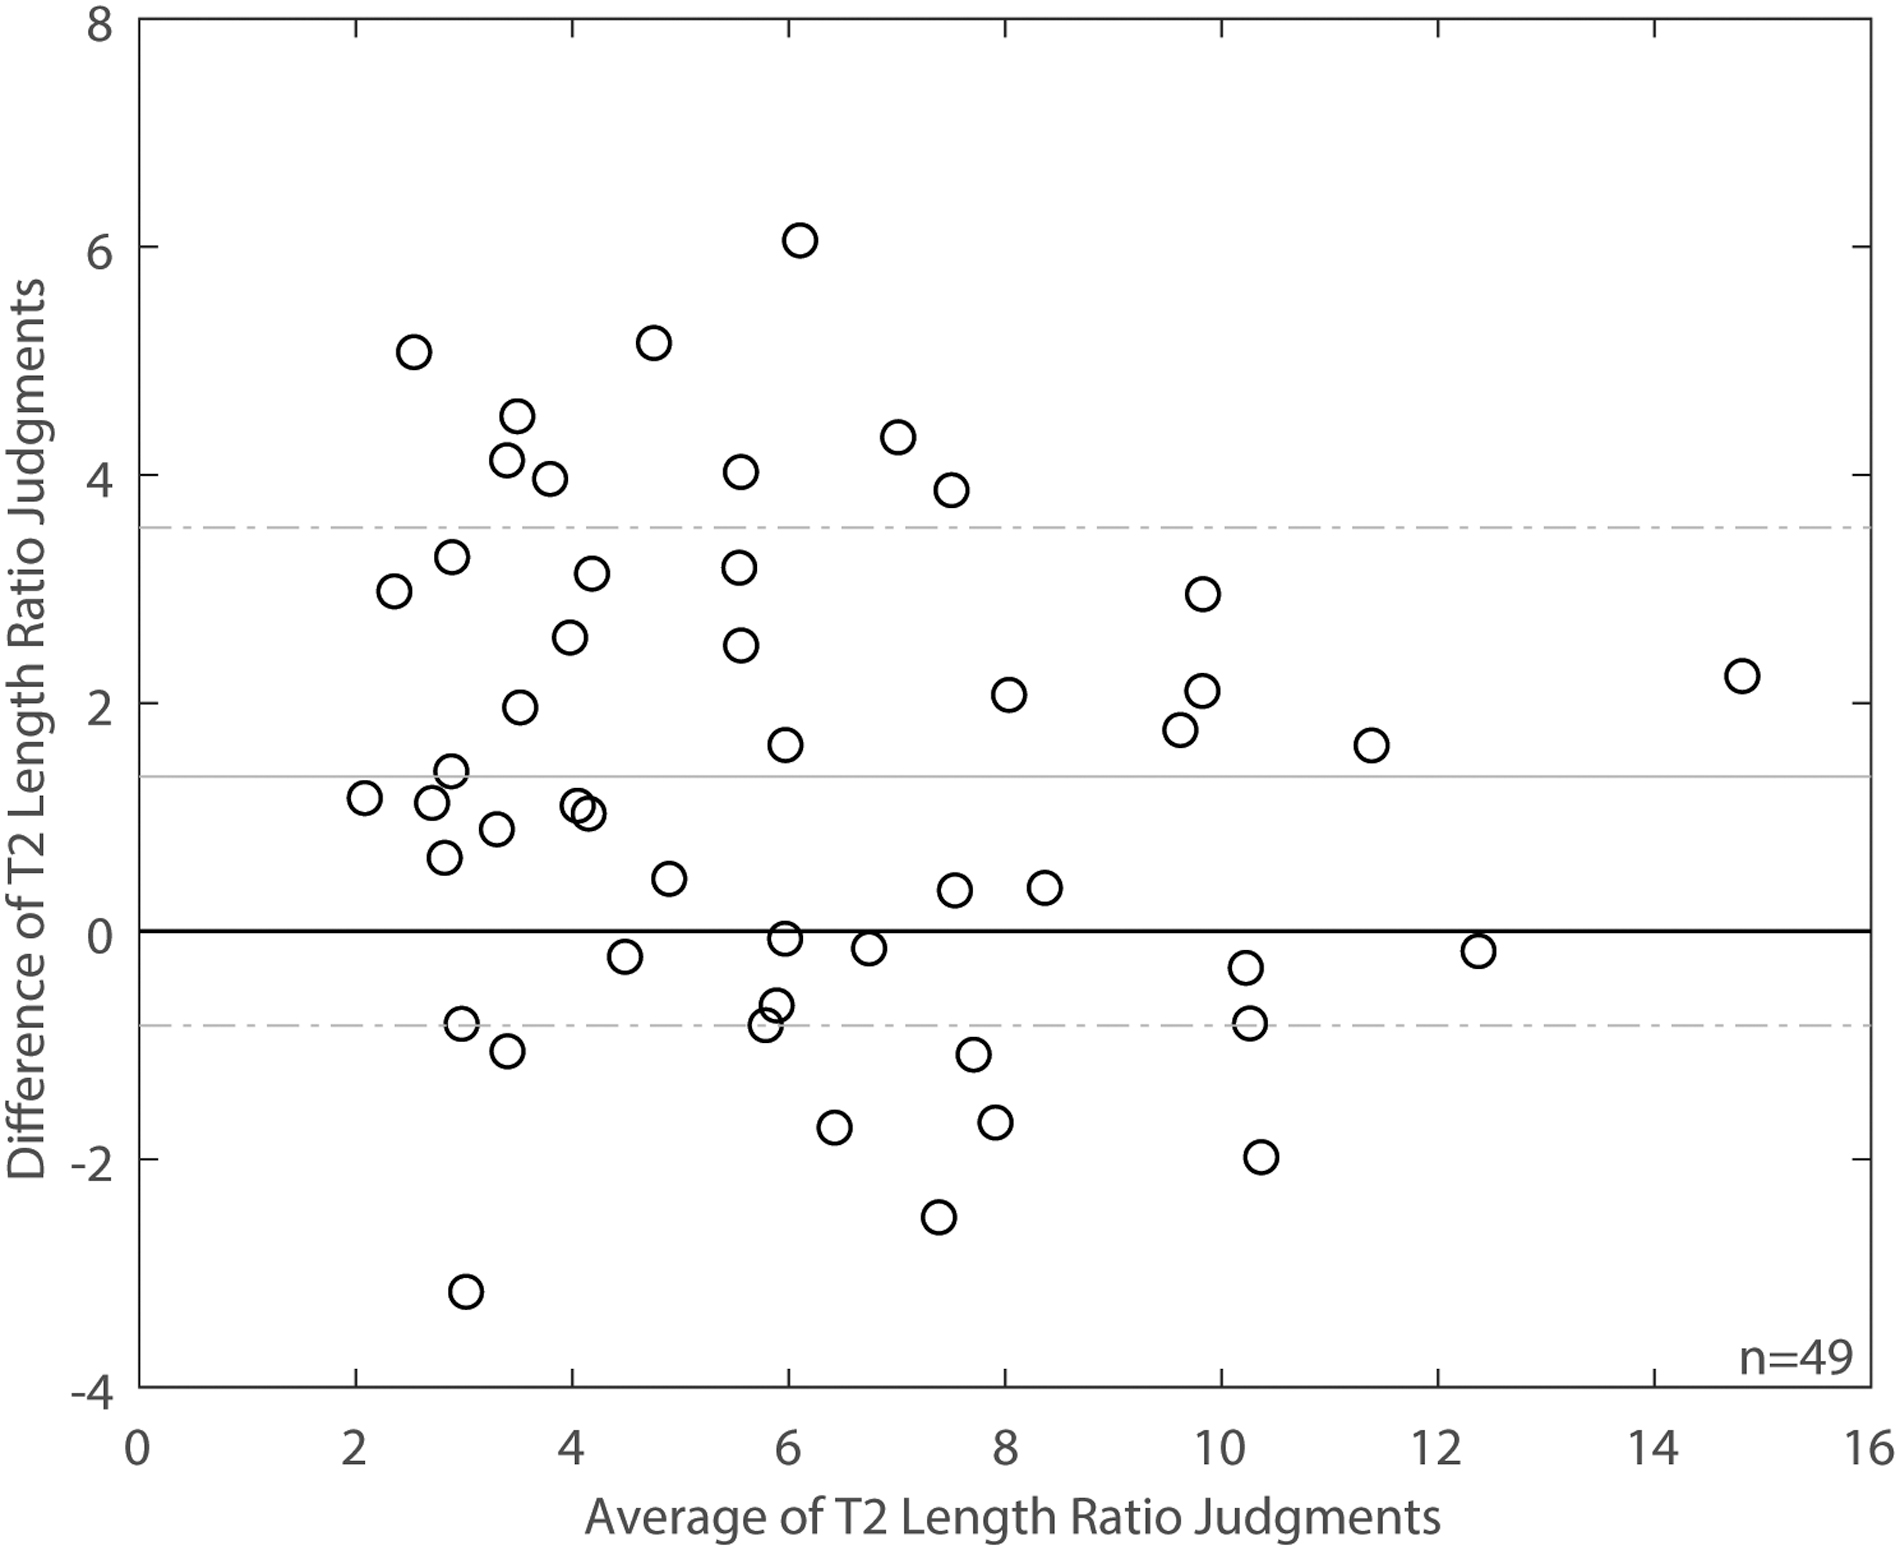
Bland-Altman plot for T2 length ratio judgments from two independent observers. Each circle shows the difference in the length ratios given by each observer for a single spinal cord on the y-axis and the average of the length ratios of the two observers for the same spinal cord on the x-axis. The solid horizontal line marks no difference between the observers' measurements. The solid gray lines show the mean difference between the observers' measurements. The dashed gray lines show ± one standard deviation from the mean difference.
When asked to decide whether there was at least one pixel of T2-weighted hypointensity in any image of each spinal cord, observers agreed on a positive answer in 44 of 49 cords and on a negative answer in 1 of 49 (92% agreement; K = 0.84). In contrast, when asked how certain they were in identifying hypointensity, there was much greater disagreement; they were both certain that there was hypointensity in 16 of 49 cords, both certain that there was no hypointensity in 1 of 49 cords, and both were uncertain about hypointensity in 14 of 49 cords (63% agreement with certainty; K = 0.26).
In an attempt to improve specificity of the judgment of hypointensity, two other observers reviewed the same 49 MRIs using a written set of criteria provided by the first two observers (see Methods). The second pair of observers agreed that there was hypointensity meeting the criteria in 12 spinal cords, and that it was absent in 22 (69% agreement; K = 0.39).
Classifier training and optimization
Spectral clustering identified two clusters in repeated unsupervised clustering of subsets of the data. Average silhouette score 59 for the optimal cluster number (2 in all cases) was 0.22 ± 0.04. Percent overlap in identity within the two clusters was evaluated over six repetitions. Low-dimensional representations of the identified clusters are shown in Figure 2. Across repetitions, 2899 of 3006 (96%) of images were always included in the major cluster (pattern 1). Seventy-five of 3006 (2.5%) were always included in the minor cluster (pattern 2). Thirty-two of 3006 (1%) of images were inconsistently clustered. Representative images reliably assigned to the minor cluster (pattern 2) are shown in Figure 3.
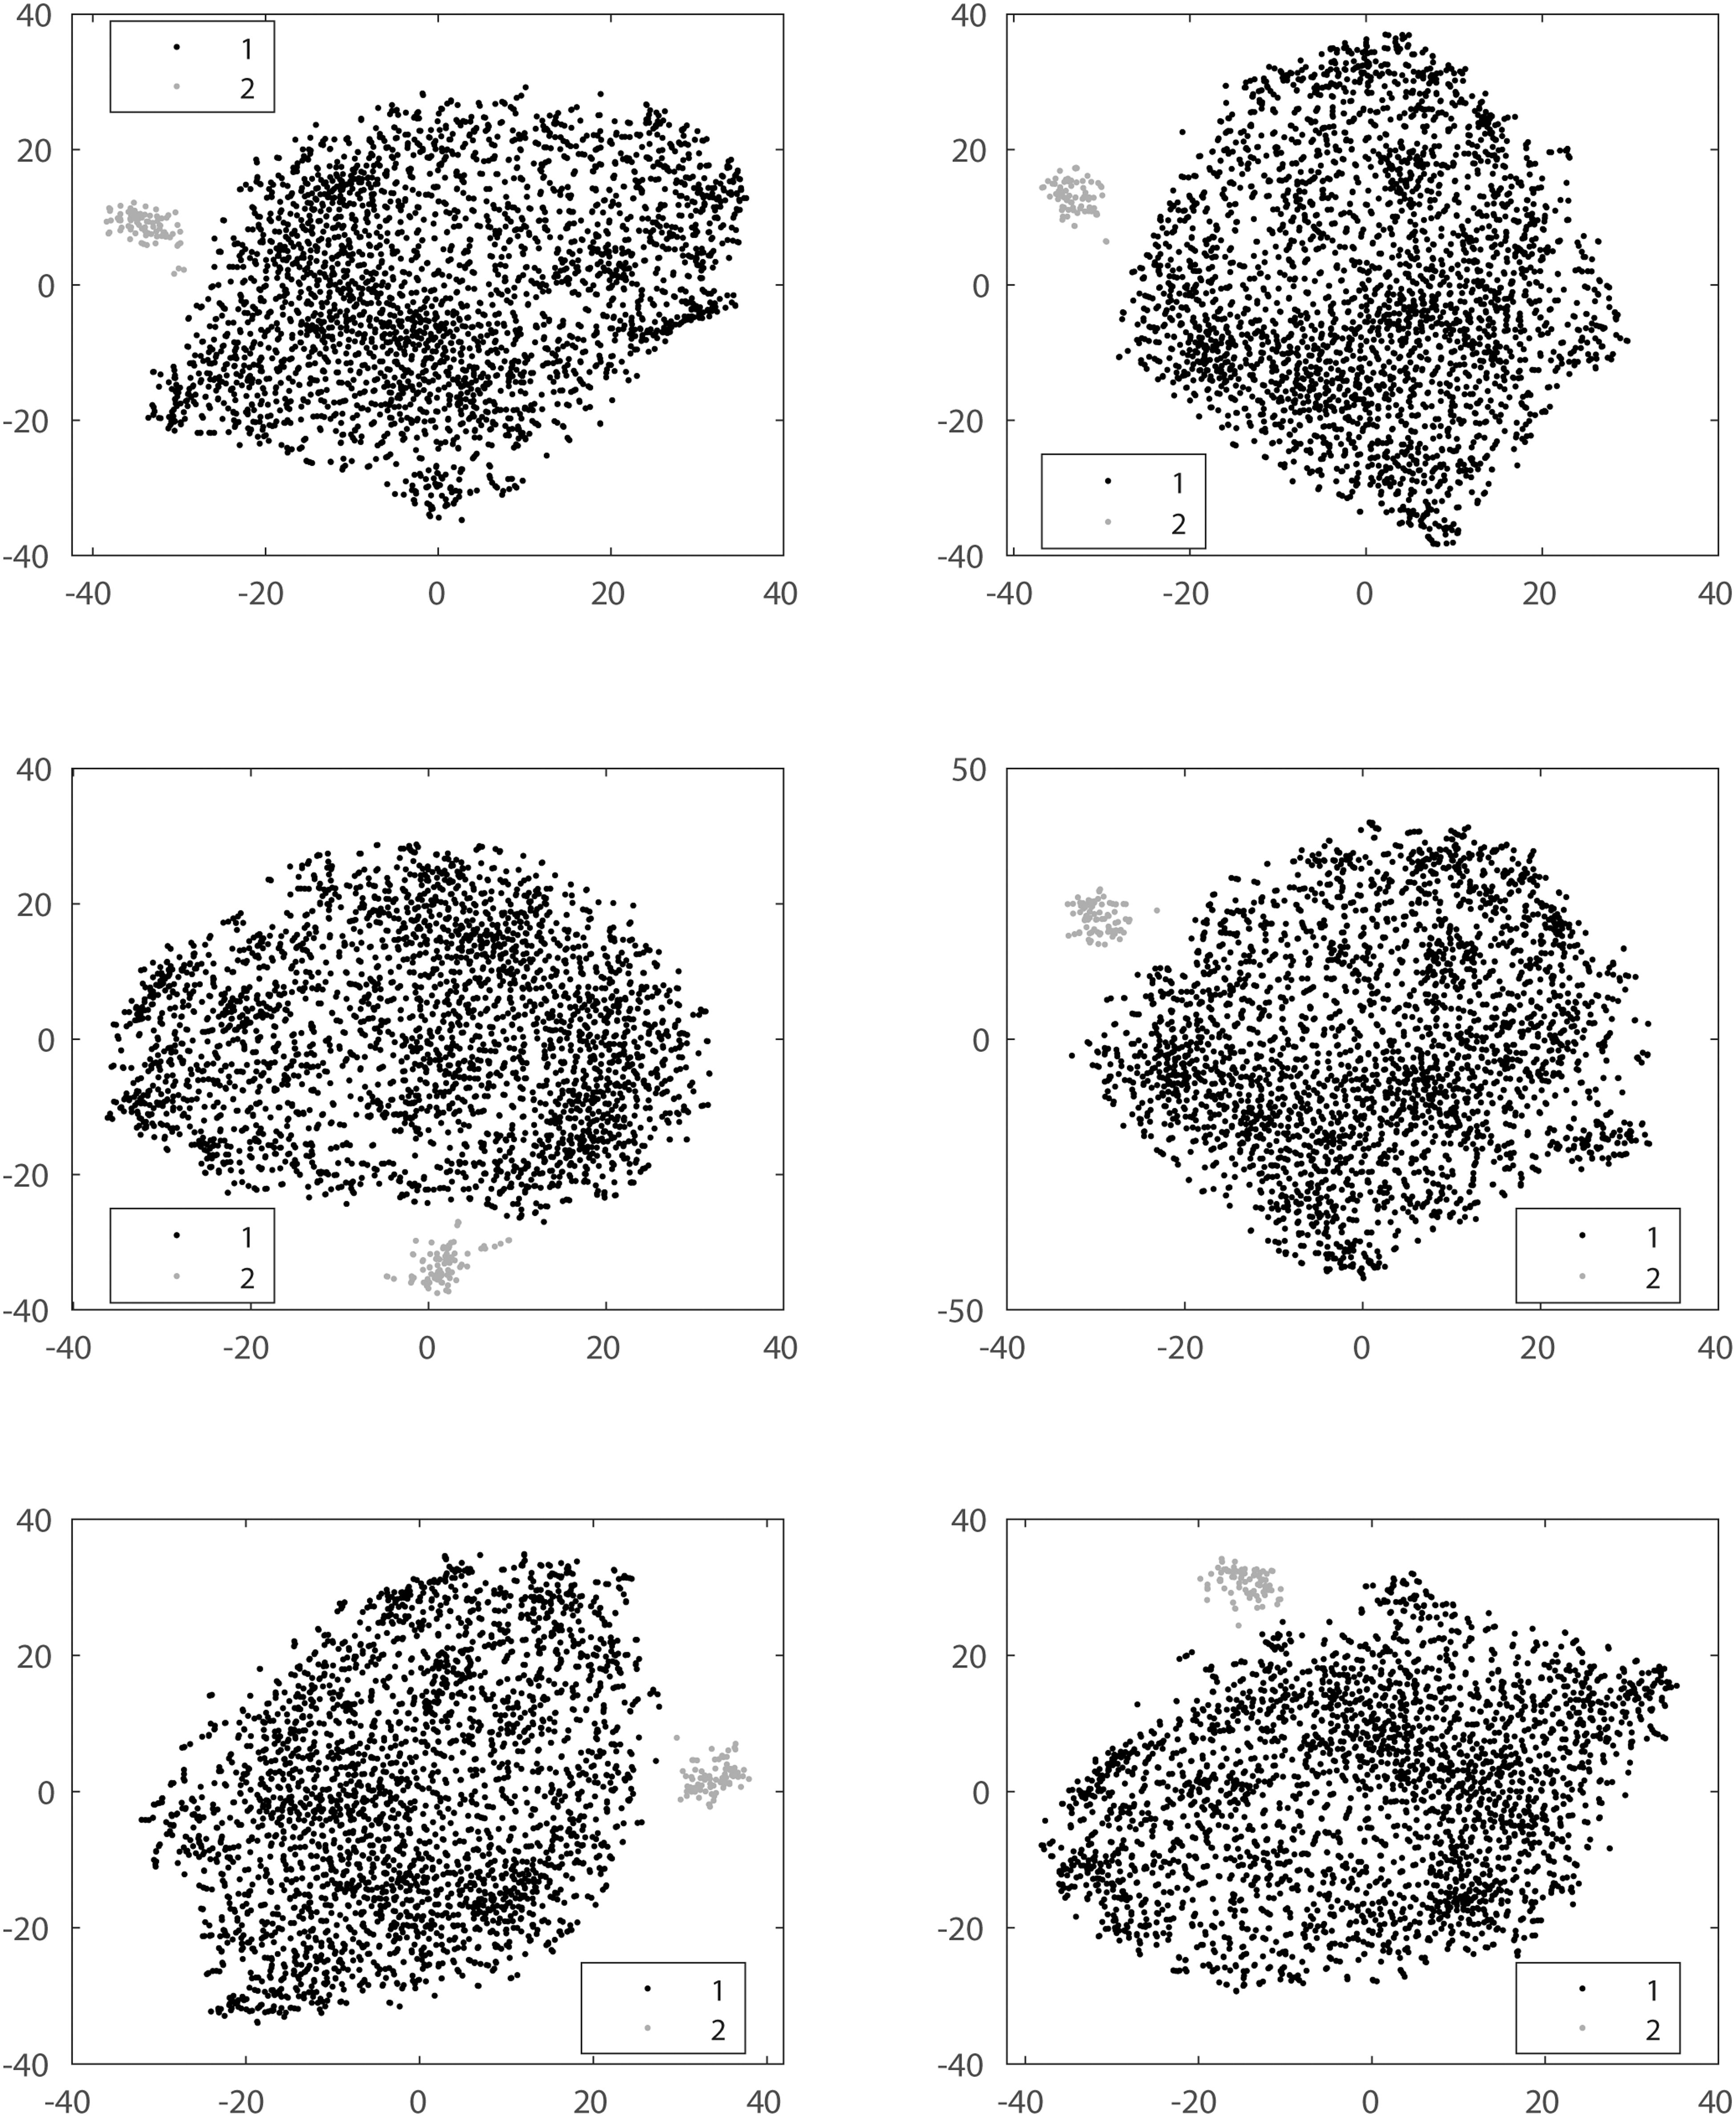
Example t-distributed stochastic nearest neighbor plots of a low-dimensional representation of a randomly selected subset of 3306 images encoded in 500-dimensional feature space by an unsupervised SURF feature extractor. SURF, Speeded-Up Robust Features.
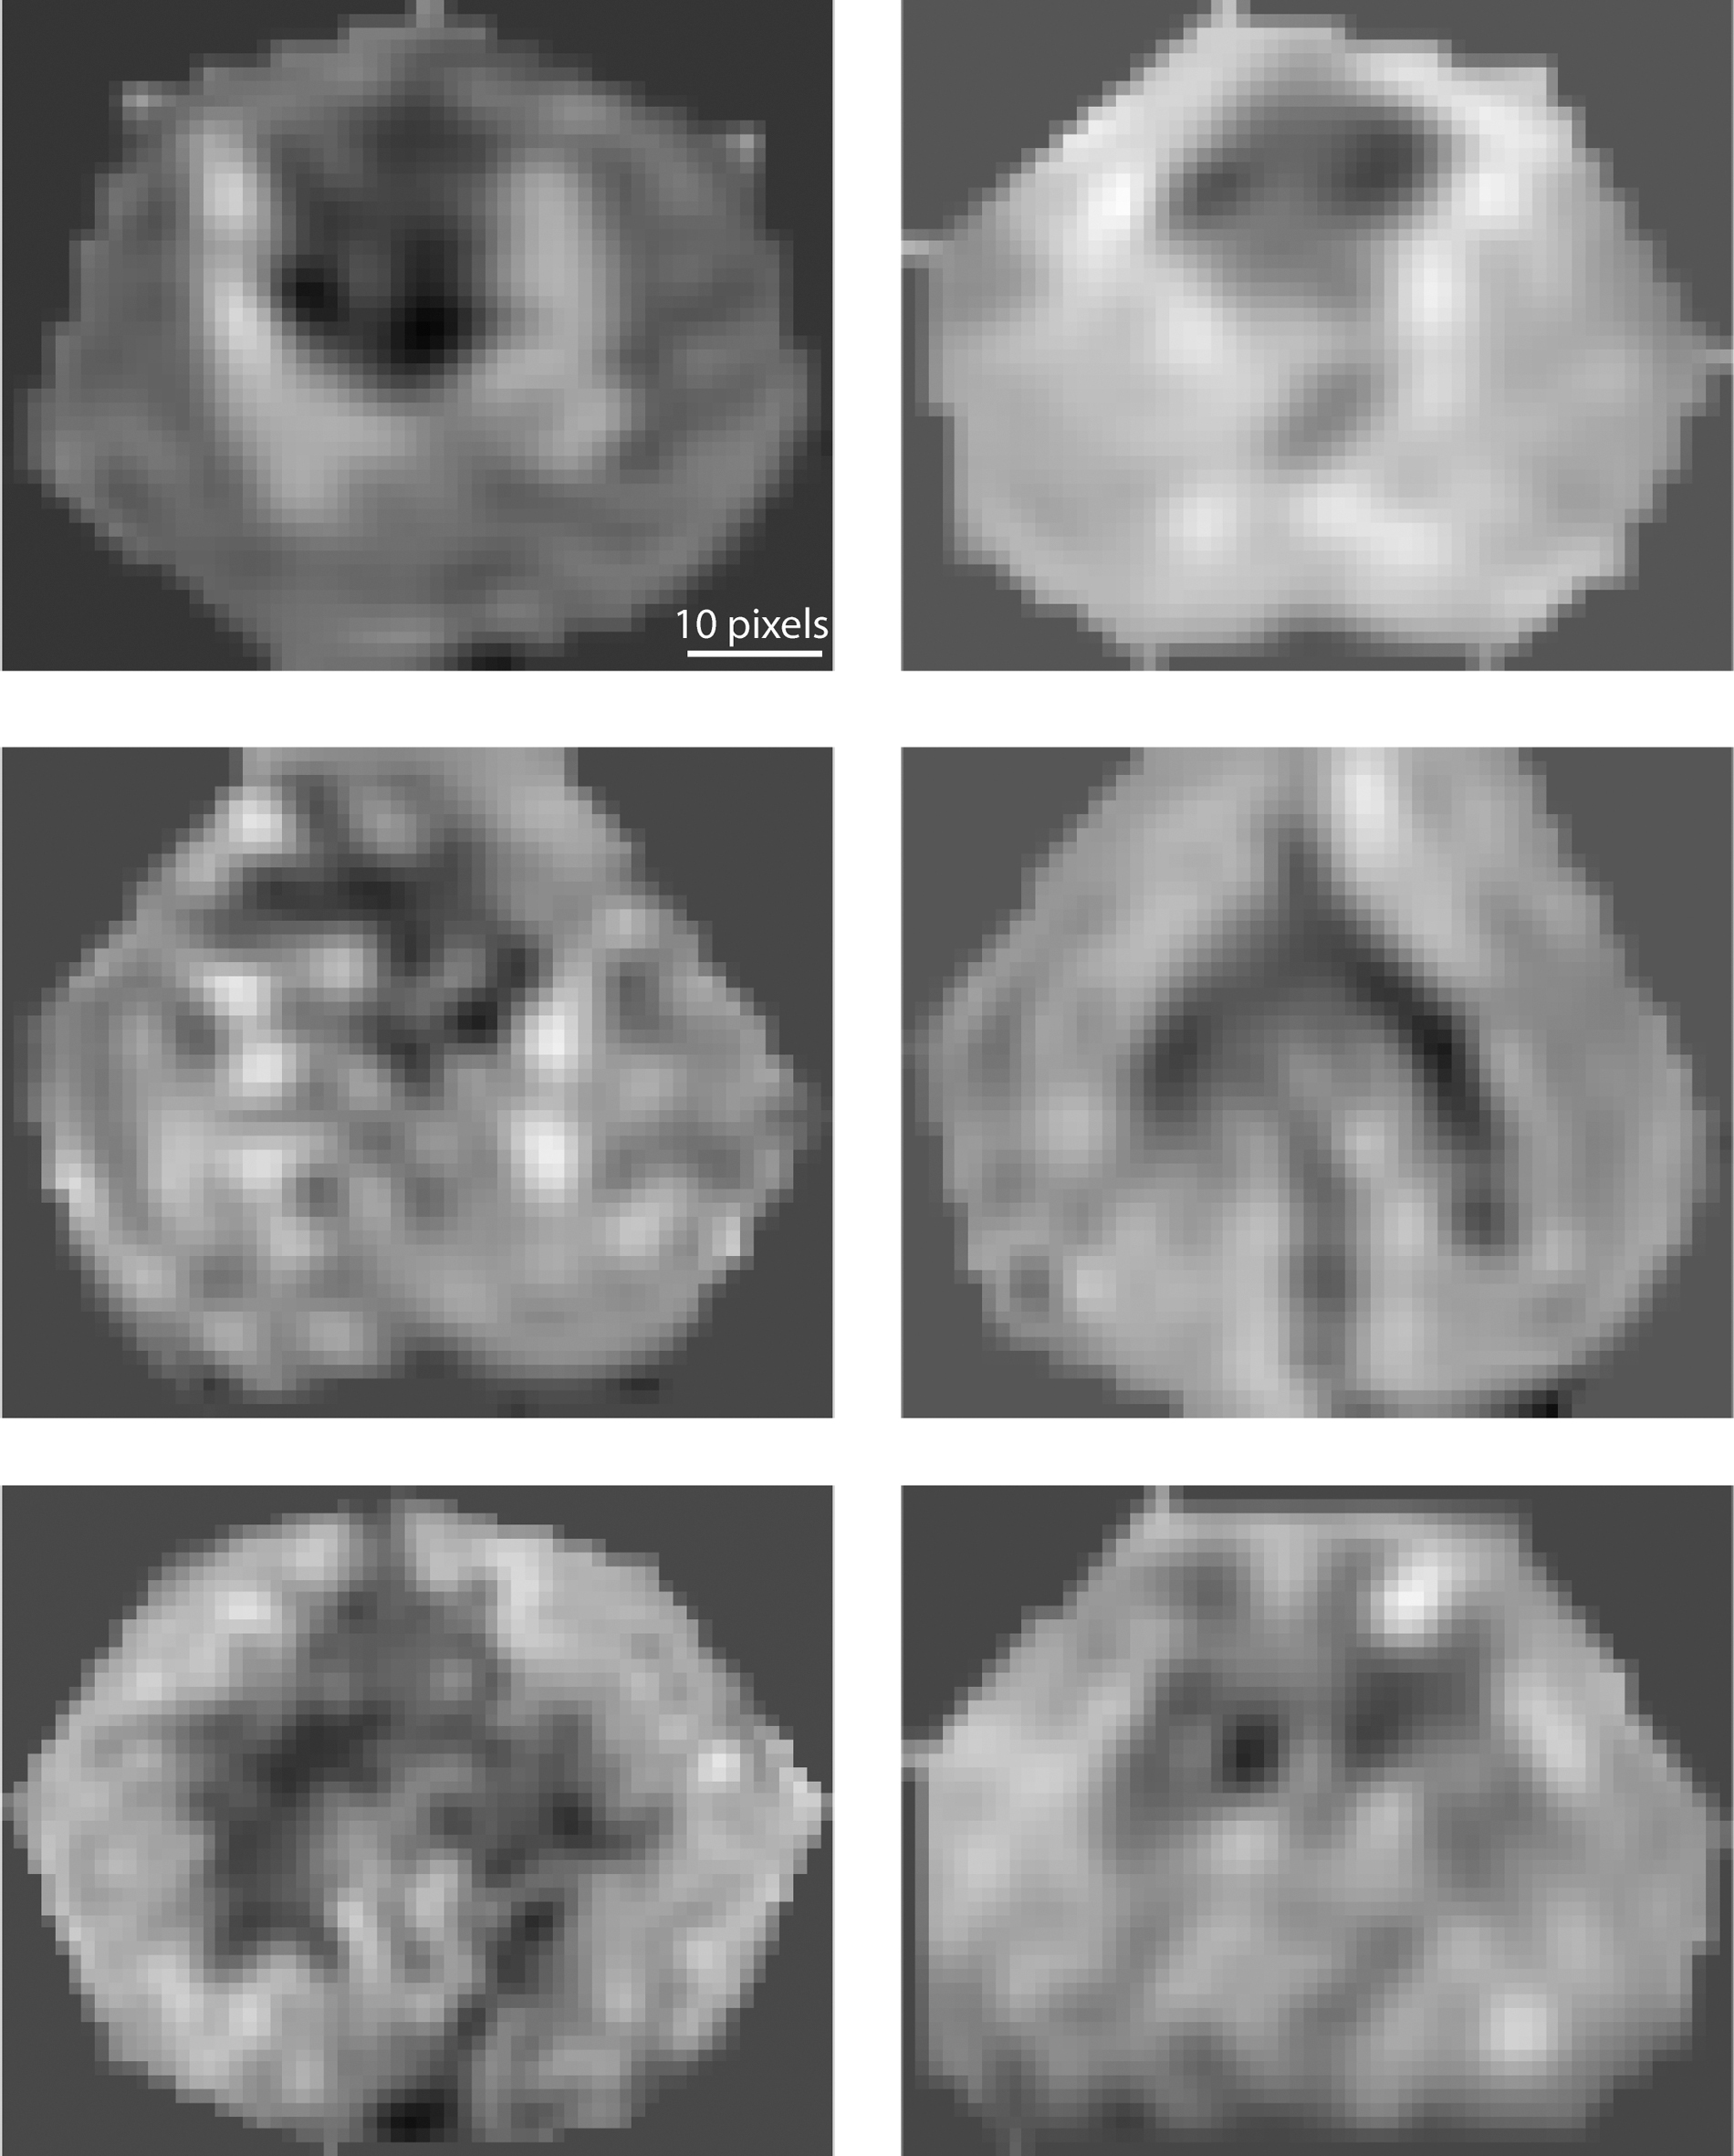
Representative examples of images reliably clustered into the minority (pattern 2) by spectral clustering using repeated feature extraction on 3306 axial T2-weighted images. Scale bar is 10 pixels.
Initial classifier performance was then assessed using only those images that were consistently classified to the same cluster upon every selection, using 10-fold stratified cross-validation of these 2974 images. Each training partition consisted of 2676 or 2677 images, and each test partition consisted of 297 or 298 images. The resulting average confusion matrices are shown in Table 1. The average precision for the test sets was 1.0, the average recall was 0.92, and average F1 was 0.96.
Average Confusion Matrix for 10-Fold Stratified Cross-Validation on Images Reliably Classified as Either Pattern 1 or Pattern 2
Relationship between classifier output and outcome
For all spinal cords from enrolled dogs (n = 95), each axial image from the T2-weighted spinal MRI was assigned to one of two patterns according to a classifier trained on the subset of images that were reliably clustered in either the major or minor cluster. The proportion of dogs in which pattern 2 was identified was examined as a function of outcome. The majority (14 of 24; 58%) of dogs that developed A-D myelomalacia had pattern 2 identified, whereas 4 of 17 (24%) of dogs that did not recover ambulation, and just 2 of 54 (4%) of dogs that recovered to ambulate, showed this pattern. Therefore, the proportion of dogs showing pattern 2 was associated with both the development of A-D myelomalacia (odds ratio [OR], 0.14; confidence interval [CI], 0.05–0.42; p < 10–3) and failure to recover ambulation (OR, 0.08; 95% CI 0.02–0.38); p < 10–3) by Fisher's exact test. The fraction of T2-weighted images categorized into each group was calculated. There was a significantly greater proportion of pattern 2 identified in dogs that developed A-D myelomalacia (median 2.5% vs. median 0%; p < 0.05) or failed to recover (median 5% vs. median 11%; p < 10–3), as defined in the Methods.
Necropsy-confirmed ascending-descending myelomalacia
Eight of 24 (33%) dogs that developed A-D myelomalacia had complete necropsy performed at median 2 days after MRI (range, 0–6). All dogs (8 of 8; 100%) had pathological evidence of myelomalacia recorded at necropsy (see Methods). All dogs (8 of 8; 100%) had pattern 2 identified by the classifier in their T2-weighted axial MRI images.
Relationship between classifier output and clinical characteristics
There was a difference in the coarsely binned interval from the onset of paraplegia to imaging time for cords in which intramedullary hypointensity was identified (p = 0.02), with the majority of cases in which hypointensity was identified being imaged >24 h after onset of paraplegia and the majority of cases in which hypointensity was not identified being imaged <24 h after onset of paraplegia. Six of 7 cases for which no hypointensity was identified but that developed myelomalacia were imaged <24 h from the onset of paraplegia.
There was no relationship between the location of the compressive intervertebral disc herniation and identification of intramedullary hypointensity by the classifier (8 of 73 between T3 and L3 vs. 2 of 22 between L3 and L6; p = 1.0).
Discussion
In our sample population, 57% recovered ambulation and 25% developed progressive neurological deterioration despite treatment (A-D myelomalacia), similar to previous reports. 8,46,60,61 Our results show that, compared to the population of all dogs presenting for complete motor and sensory loss, intramedullary hypointensity identified on standard T2-weighted axial imaging is associated with a lower probability of recovery and a higher probability of developing A-D myelomalacia after standard surgical intervention. It is well accepted in imaging of acute, traumatic spinal cord injury in humans that areas of relative hypointensity within the parenchyma on T2-weighted MR represent areas of hemorrhage. 24,62,63 Likewise, a direct correlation between intramedullary hypointensity on T2-weighted images and histopathologically confirmed hemorrhagic myelomalacia 39 or hemorrhage 38,40 has been shown in rodent spinal cord injury using high-field MRI.
Although there is less known about the histopathological correlates of T2-weighted intramedullary hypointensity in dog spinal cord injury, we believe it is also likely to represent hemorrhage in this species, for several reasons. First, the anatomical distribution (dorsal to the central canal, tracking through the gray matter) matches the distribution of hemorrhagic myelomalacia described in pathological studies of canine spinal cord. 48,56,57 Second, other confirmed cases of intramedullary spinal cord hemorrhage have demonstrated areas of intraparenchymal T2-weighted hypointensity. 64 –67 Third, 8 of 8 dogs from our data set that had necropsy confirmation of myelomalacia also had hypointensity identified by the classifier on MRI.
Several studies have indicated that hypointense foci in the spinal cord parenchyma can be reliably identified on axial T2-weighted images using a visual-verbal scale 18,20,22 and correlate with poor functional outcome, although recovery is possible in some cases in which hemorrhage is identified. 68,69 Human studies show mixed results when intramedullary lesion length and intramedullary hemorrhage are compared as predictors of functional outcome, with several showing important correlation of hemorrhage with outcome 12,19,20,22.23,31,70,71 (but see Aarabi and colleagues 72 ). Recent reviews and meta-analyses conclude that there is moderate evidence against the prognostic importance of edema length and for the prognostic importance of hemorrhage in human spinal cord injury. 9 –11
Our data demonstrate that intramedullary hypointensity on T2-weighted axial images can be reliably distinguished from other patterns and represents a distinct image class that can be recognized by an automated SVM image classification system. The axial images containing hypointensity could be segregated from other axial images by a feature detector that relied on identification of rotation- and scale-invariant features in grayscale images. Training of the feature extractor resulted in reliable identification of axial slices containing intramedullary hypointensity. Unlike verbal descriptors, 73 the features produced by the classifier can be recreated in multiple hospitals without introducing interobserver variability; also, once trained, the classifier exhibits no intraobserver variability.
One possible limitation of this approach is that the impact of scan-acquisition parameters on classifier performance have not been evaluated. In human spinal cord injury, automated classification of lesion severity on T2-weighted images, including detection of intramedullary hypointensity in the severity score, correlates with motor score at discharge. 13 Other recent publications have investigated the use of machine-assisted strategies to recognize nervous system hemorrhage. 74,75
Consistent application is one of the major challenges to widespread implementation of imaging biomarkers, and is limited in assessment of T2-weighted hyperintensities in axial and sagittal images in canine spinal cord. 21 In previous studies of imaging biomarkers of canine spinal cord, a variety of methods were used to achieve consensus, some of which were unspecified. 15,16,45,76,77 Similarly variable methods have been used in human studies. 12,23,24,31,57,78 –80 Few studies have looked specifically at interobserver reliability of these measures (but see Talbott and colleagues 18 ). Some of the variability in the prognostic reliability of intramedullary hemorrhage across studies may reflect differences in the definition of the feature (e.g., a simple present/absent judgment vs. a volume estimate). Differences in the application of imaging biomarkers between observers, or even between viewings by the same observer, may alter their association with outcome.
In our study, the difference between observer judgments of T2-weighted hyperintensity length ratios was on the same scale as the mean length assigned, indicating high inter-rater variability in the judgment of this feature on our images, despite allowing use of axial images. 21 Additionally, our data show that recognition of intramedullary hypo intensity by human observers may be influenced by the verbal directions given. Good inter-rater agreement can be achieved for directions that emphasize sensitivity (please note all hypointensity), but this results in a non-specific application of the rule in which hypointensity is always identified. Observers showed poor or barely fair agreement when greater certainty or specificity was stipulated.
Intramedullary hypointensity may take some time after injury to develop, but it can be observed before clinical signs of A-D myelomalacia appear in dogs. Human studies have related intramedullary hemorrhage to poor functional outcome in spinal cord injury from within 8 h, 81 within 24 h, 78,79 and in a large, prospective cohort imaged between 24 and 48 h after injury. 23 Though the detection of intramedullary hypointensity is likely an indicator of poor prognosis at any time point, our data suggest that dogs imaged <24 h from the onset of paraplegia may be less likely to have detectable hypointensity, potentially decreasing its prognostic sensitivity in the early post-injury period.
It is overwhelmingly likely that no single prognostic indicator will be so accurate that case management should be made based on that indicator alone. Nevertheless, the more reliable, independent indicators of outcome we can validate in our patient population, the more likely we are, as clinicians, to be able to help clients and patients with expectation management during the early aftermath of acute spinal cord injury.
Finally, our data provide evidence that intramedullary hemorrhage after spinal cord injury is associated with poor functional outcome in dogs. Our new approach to imaging analysis could assist with early identification of dogs that may be at higher risk of non-recovery or development of A-D myelomalacia. Together with the high rate of naturally occurring spinal cord injury in this species, this then provides a means to stratify and thereby increase efficiency of opportunities for non-human clinical testing of novel therapeutics.
Footnotes
Acknowledgments
The authors acknowledge Dr. Maya Krasnow, Dr. Melissa Andruzzi, Dr. Joseph Mankin, and Dr. Sharon Kerwin for contributions to clinical assessment and management of the dogs in the sample population.
Funding Information
No funding was received.
Author Disclosure Statement
No competing financial interests exist.
References
Supplementary Material
Please find the following supplemental material available below.
For Open Access articles published under a Creative Commons License, all supplemental material carries the same license as the article it is associated with.
For non-Open Access articles published, all supplemental material carries a non-exclusive license, and permission requests for re-use of supplemental material or any part of supplemental material shall be sent directly to the copyright owner as specified in the copyright notice associated with the article.
