
Abstract
Traumatic brain injury (TBI) is an extremely complex condition due to heterogeneity in injury mechanism, underlying conditions, and secondary injury. Pre-clinical and clinical researchers face challenges with reproducibility that negatively impact translation and therapeutic development for improved TBI patient outcomes. To address this challenge, TBI Pre-clinical Working Groups expanded upon previous efforts and developed common data elements (CDEs) to describe the most frequently used experimental parameters. The working groups created 913 CDEs to describe study metadata, animal characteristics, animal history, injury models, and behavioral tests. Use cases applied a set of commonly used CDEs to address and evaluate the degree of missing data resulting from combining legacy data from different laboratories for two different outcome measures (Morris water maze [MWM]; RotorRod/Rotarod). Data were cleaned and harmonized to Form Structures containing the relevant CDEs and subjected to missing value analysis. For the MWM dataset (358 animals from five studies, 44 CDEs), 50% of the CDEs contained at least one missing value, while for the Rotarod dataset (97 animals from three studies, 48 CDEs), over 60% of CDEs contained at least one missing value. Overall, 35% of values were missing across the MWM dataset, and 33% of values were missing for the Rotarod dataset, demonstrating both the feasibility and the challenge of combining legacy datasets using CDEs. The CDEs and the associated forms created here are available to the broader pre-clinical research community to promote consistent and comprehensive data acquisition, as well as to facilitate data sharing and formation of data repositories. In addition to addressing the challenge of standardization in TBI pre-clinical studies, this effort is intended to bring attention to the discrepancies in assessment and outcome metrics among pre-clinical laboratories and ultimately accelerate translation to clinical research.
Introduction
Development of novel therapeutics to treat diseases and disorders of the central nervous system (CNS) is an extremely challenging research endeavor. The difficulty and complexity of successful therapeutic translation is illustrated by the United States Food and Drug Administration's (FDA) relatively low approval rate for new CNS drugs in recent years (e.g., 8% from 2010–2014). 1 Research to develop novel pharmacological interventions for the treatment of traumatic brain injury (TBI) faces similar challenges. Despite decades of pre-clinical TBI research and demonstration of successful treatments in animal models, the field is still plagued by poor clinical translation. 2,3 In fact, despite the success of many pre-clinical studies and over 30 clinical trials, no TBI drug treatments have graduated out of phase III trials to FDA approval. 2,4 This lack of translation continues to spark an active international discussion in which TBI researchers are seeking to develop strategies to improve translation from bench to bedside. Among these considerations, many elements of translational science are being actively considered, including improving clinical trial design, 2 improving definition of patient heterogeneity, 5 and improving the rigor and reproducibility of pre-clinical studies. 6
Indeed, there has been a clarion call from the biomedical research community to raise standards for pre-clinical research by improving rigor, reproducibility, and transparency, 7 –11 and efforts to do this for TBI research are ongoing. 12 –15 Specific areas for research design attention include improving the statistical power of pre-clinical studies, reducing risk of exaggerated effect sizes and low reproducibility, 16 improving internal and external validity in pre-clinical research, 17 and the use of techniques to limit bias. 18 Similarly, better reporting and sharing of key experimental variables are needed to increase reproducibility and provide more robust pre-clinical platforms. 12,13,19 –21 Another concern raised with pre-clinical research is that many animal studies typically have low statistical power, 16 and reporting of key methodological variables is varied, with many studies not reporting those key variables. 22 –25 To this end, there have been several initiatives in pre-clinical research communities, including TBI, 12 spinal cord injury (SCI), 21 and epilepsy 26 –28 to develop common data elements (CDEs).
CDEs facilitate standardization of datasets and database creation, enabling investigators to systematically collect, analyze, report, and share data across the research community. A data element (DE) is a logical unit of data pertaining to a single measure or piece of information that supports a measure, such that each DE is reduced to a single parameter, with multiple attributes, or descriptors. Expert consensus for a set of DEs that have common data structures for a given research field gives rise to CDEs, which provide reference content standards and can be assembled into a data dictionary. CDEs are identified by a variable name that will be linked to the piece of data in the dataset, in addition to other attributes, such as a title, description, unit of measure, permissible values, type of element (e.g., numeric, alphanumeric), instructions, and references. Data collection Form Structures are then built from CDEs to facilitate systematic assembly of data. See Supplementary Table S1 for a glossary of related terms. CDE standards are intended to be dynamic and can evolve over time, ultimately promoting consistent and universal data collection and reporting.
In this report, we expand upon the previous TBI pre-clinical CDE initiative12 to better define and harmonize experimental variables and data across individual studies and among laboratories. Specifically, we provide updates on the development of pre-clinical TBI CDEs, making new data collection tools available for the pre-clinical TBI research community, and demonstrate proof-of-concept use case studies that examine data missingness across multiple experiments from different laboratories. We posit that the use of CDEs to more carefully define the experimental variables will provide a standard lexicon for researchers and improve the rigor, reproducibility and ultimately the translational potential of pre-clinical research in TBI.
Methods
CDE development
Initial efforts in the pre-clinical TBI CDE initiative identified 167 CDEs describing animal characteristics, animal history, assessments and outcome measures, and pre-clinical TBI injury models. 12 Here, we further develop and expand upon these CDEs, define new CDEs, provide the CDE Data Dictionary and Form Structures online, and demonstrate the use of these tools in a missing value analysis of two different multi-study datasets (Fig. 1). Working groups of content experts were formed to develop the CDEs and guide a utilization process. Three working groups were formed: 1) General Health and Affective Disturbances; 2) Cognitive and Motor Function; and 3) Large Animals Outcomes. Each group had co-chairs and met bi-monthly for approximately 12 months, with monthly meetings of the chairs and agency facilitators. Some working group members were part of the previous pre-clinical CDE initiative; new members were chosen for this expanded effort to ensure further diversity of expertise. National Institutes of Health (NIH) and Department of Defense representatives facilitated the process and also provided perspective from the clinical CDE effort. 29,30
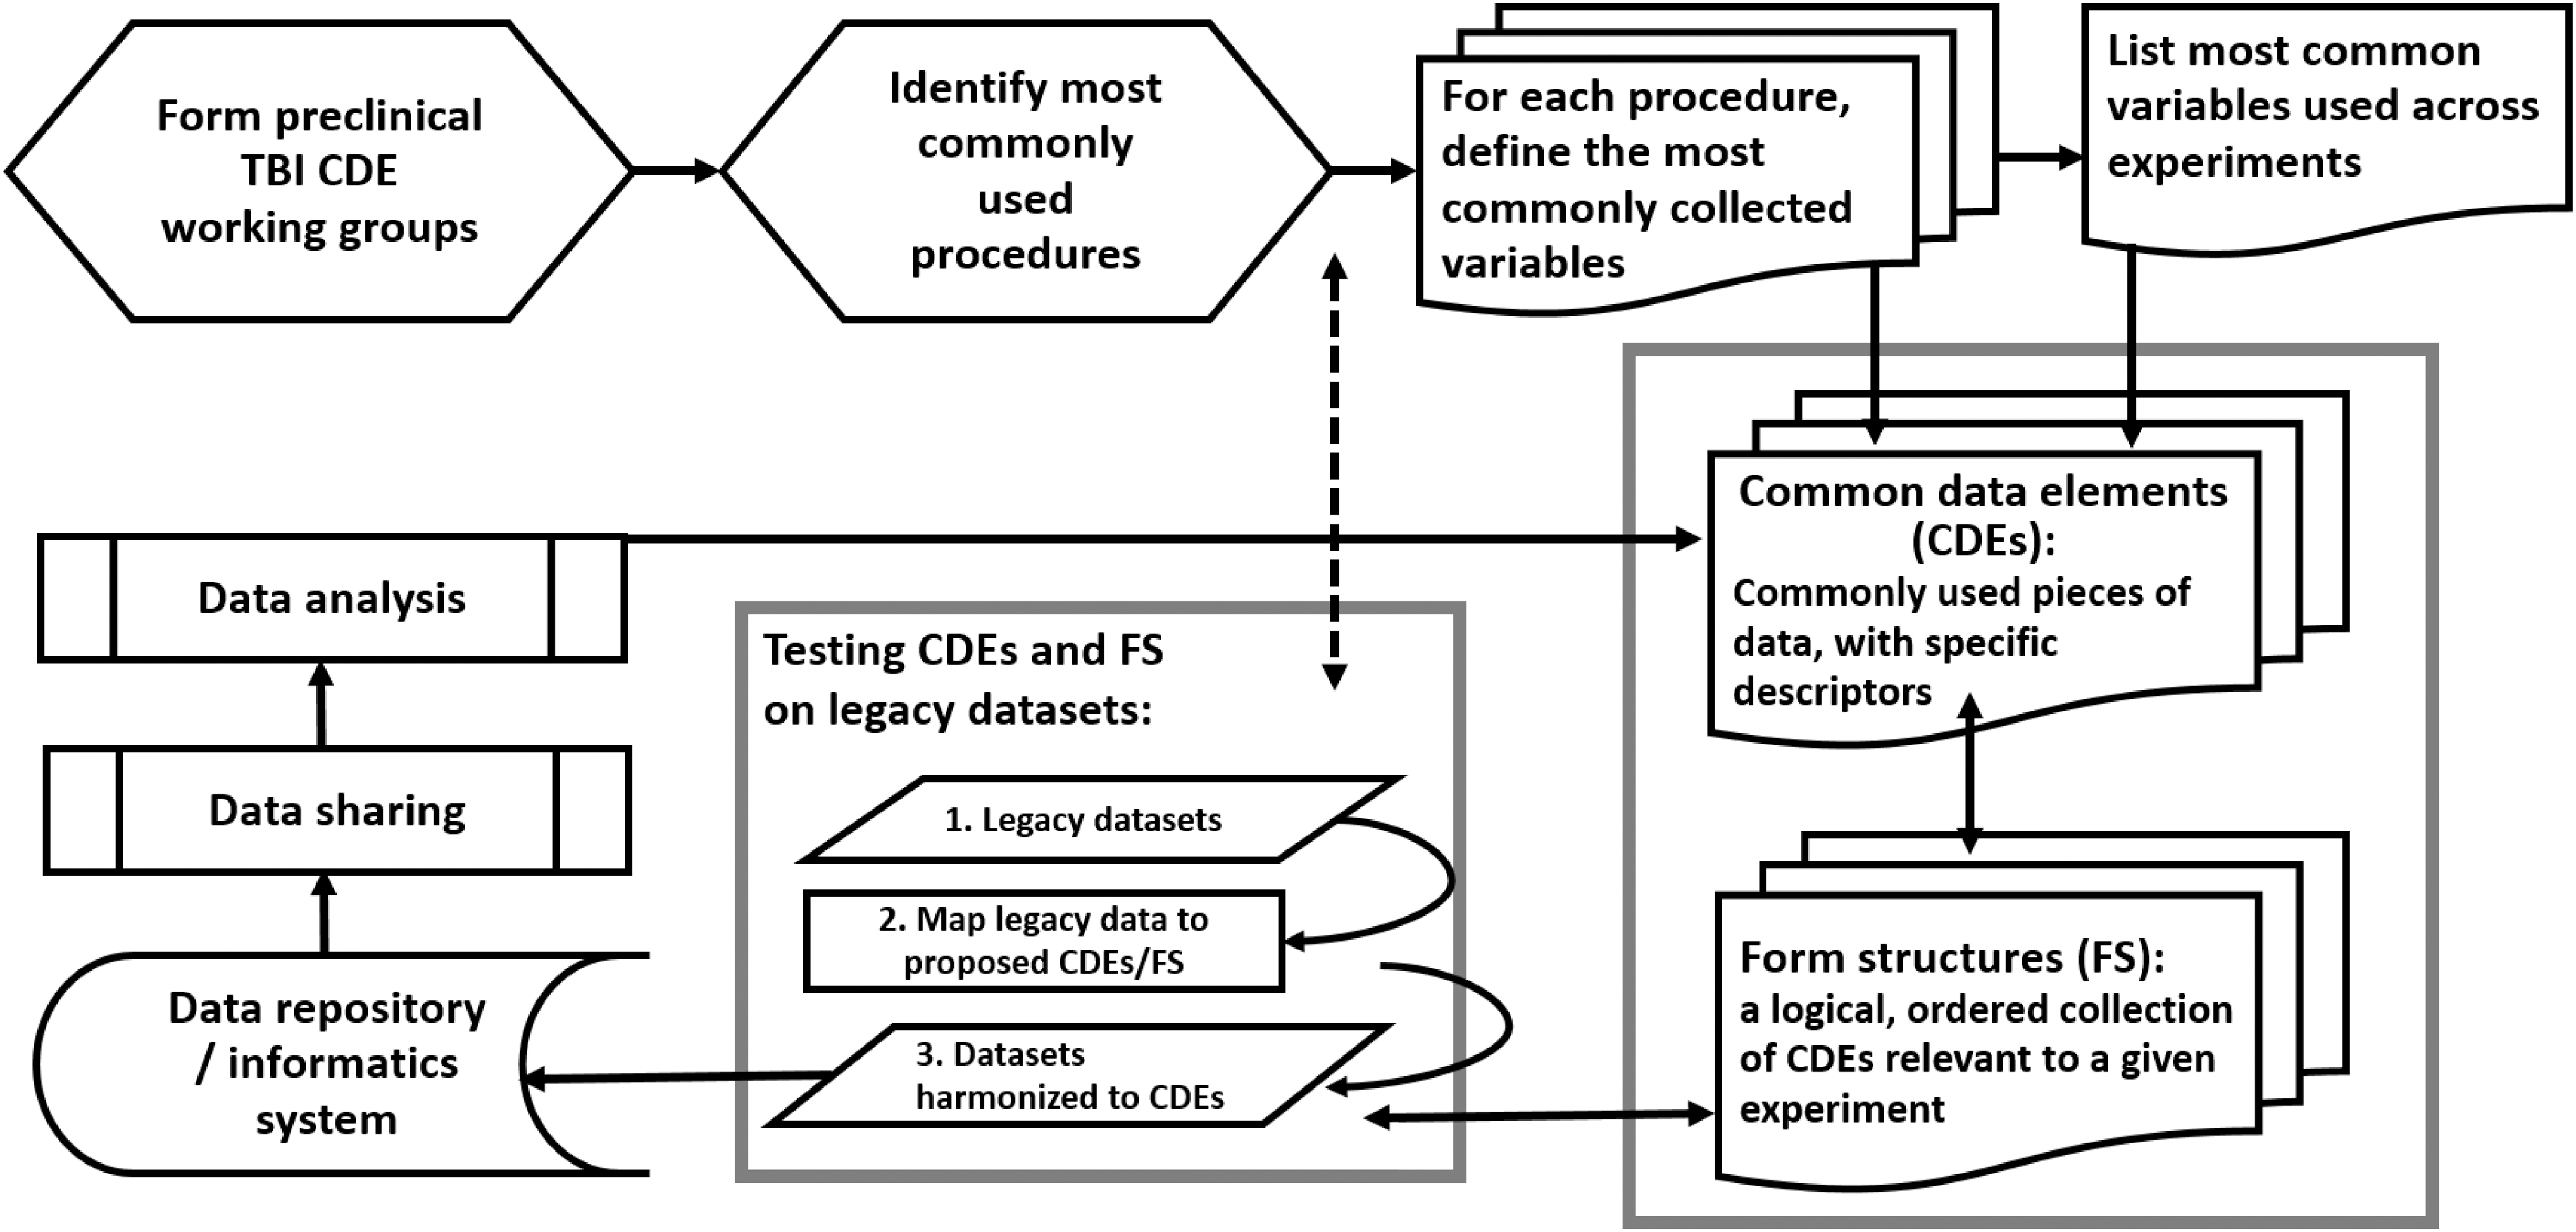
Pre-clinical Traumatic Brain Injury (TBI) Common Data Element (CDE) Working Group Workflow Process. Working groups were formed to identify the most commonly used procedures in pre-clinical TBI research. The most commonly collected variables were identified as well as those that were commonly used across experimental procedures. These variables were defined into CDEs and then logical groups of CDEs were made into Form Structures (FS). Once FS were created, reviews of the CDEs prompted revisions, such as clarification of permissible values or consistency with similar CDEs. Legacy data were cleaned and mapped to the CDEs and harmonized within FS. The final FS were validated in and uploaded to a data repository. Data can then be shared and analysis can be performed. Further iterative changes to CDEs are made continually during the process. The demonstration of the platform using legacy data is invaluable to the process and permits improvements to be made based on real-world scenarios.
Working group members focused on identification of data elements that are relevant to pre-clinical TBI studies by drawing from their own expertise and the literature, specifically concentrating on the frequency of use among different research groups and how often a particular outcome measure or variable appeared in published studies. Where appropriate, pre-clinical CDEs were defined in parallel with companion clinical CDEs, to maximize translatability (e.g., Injury Elapsed Time). At least two working group members collaborated on the initial draft and several rounds of group discussion and edits were conducted. The resulting CDEs were available for two rounds of public review (
The resulting set of 913 unique CDEs consists of data elements from three general groups: Animal and Study Metadata, Injury Models, and Assessments and Outcomes (Fig. 2). CDEs are described by 18 attributes (variable name, description, datatype, permissible values, etc.). The Animal and Study Metadata CDEs are comprised of a Main Group of eight CDEs that are intended to be included in every form, Animal Characteristics (six CDEs), Animal History (71 CDEs), and All Tests Common (e.g., test equipment information, room environment variables) (84 CDEs; Table 1). The remaining CDEs are distributed among the Injury Models and the Assessments and Outcomes. For this effort, five injury models were completed (205 CDEs) as well as CDEs for General Health and Neurological Function (six assessments, 93 CDEs), Affective Disturbance: Depression/Anxiety (10 tests, 293 CDEs)/Social Interaction (five tests, 361 CDEs), Cognition and Motor: Learning/Memory (seven tests, 306 CDEs)/Sensory/Motor (eight tests, 199 CDEs), and Large Animal Outcomes (three tests, 115 CDEs; Fig. 2). Note that there are repeated (or reused) CDEs among the various tests due to cross cutting common CDEs; therefore, the number of CDE from these groupings exceeds the count of 913. Collectively, the CDEs make up the pre-clinical CDE data dictionary, which is available through the CDE Repository at the National Library of Medicine within the NINDS collection (NLM:
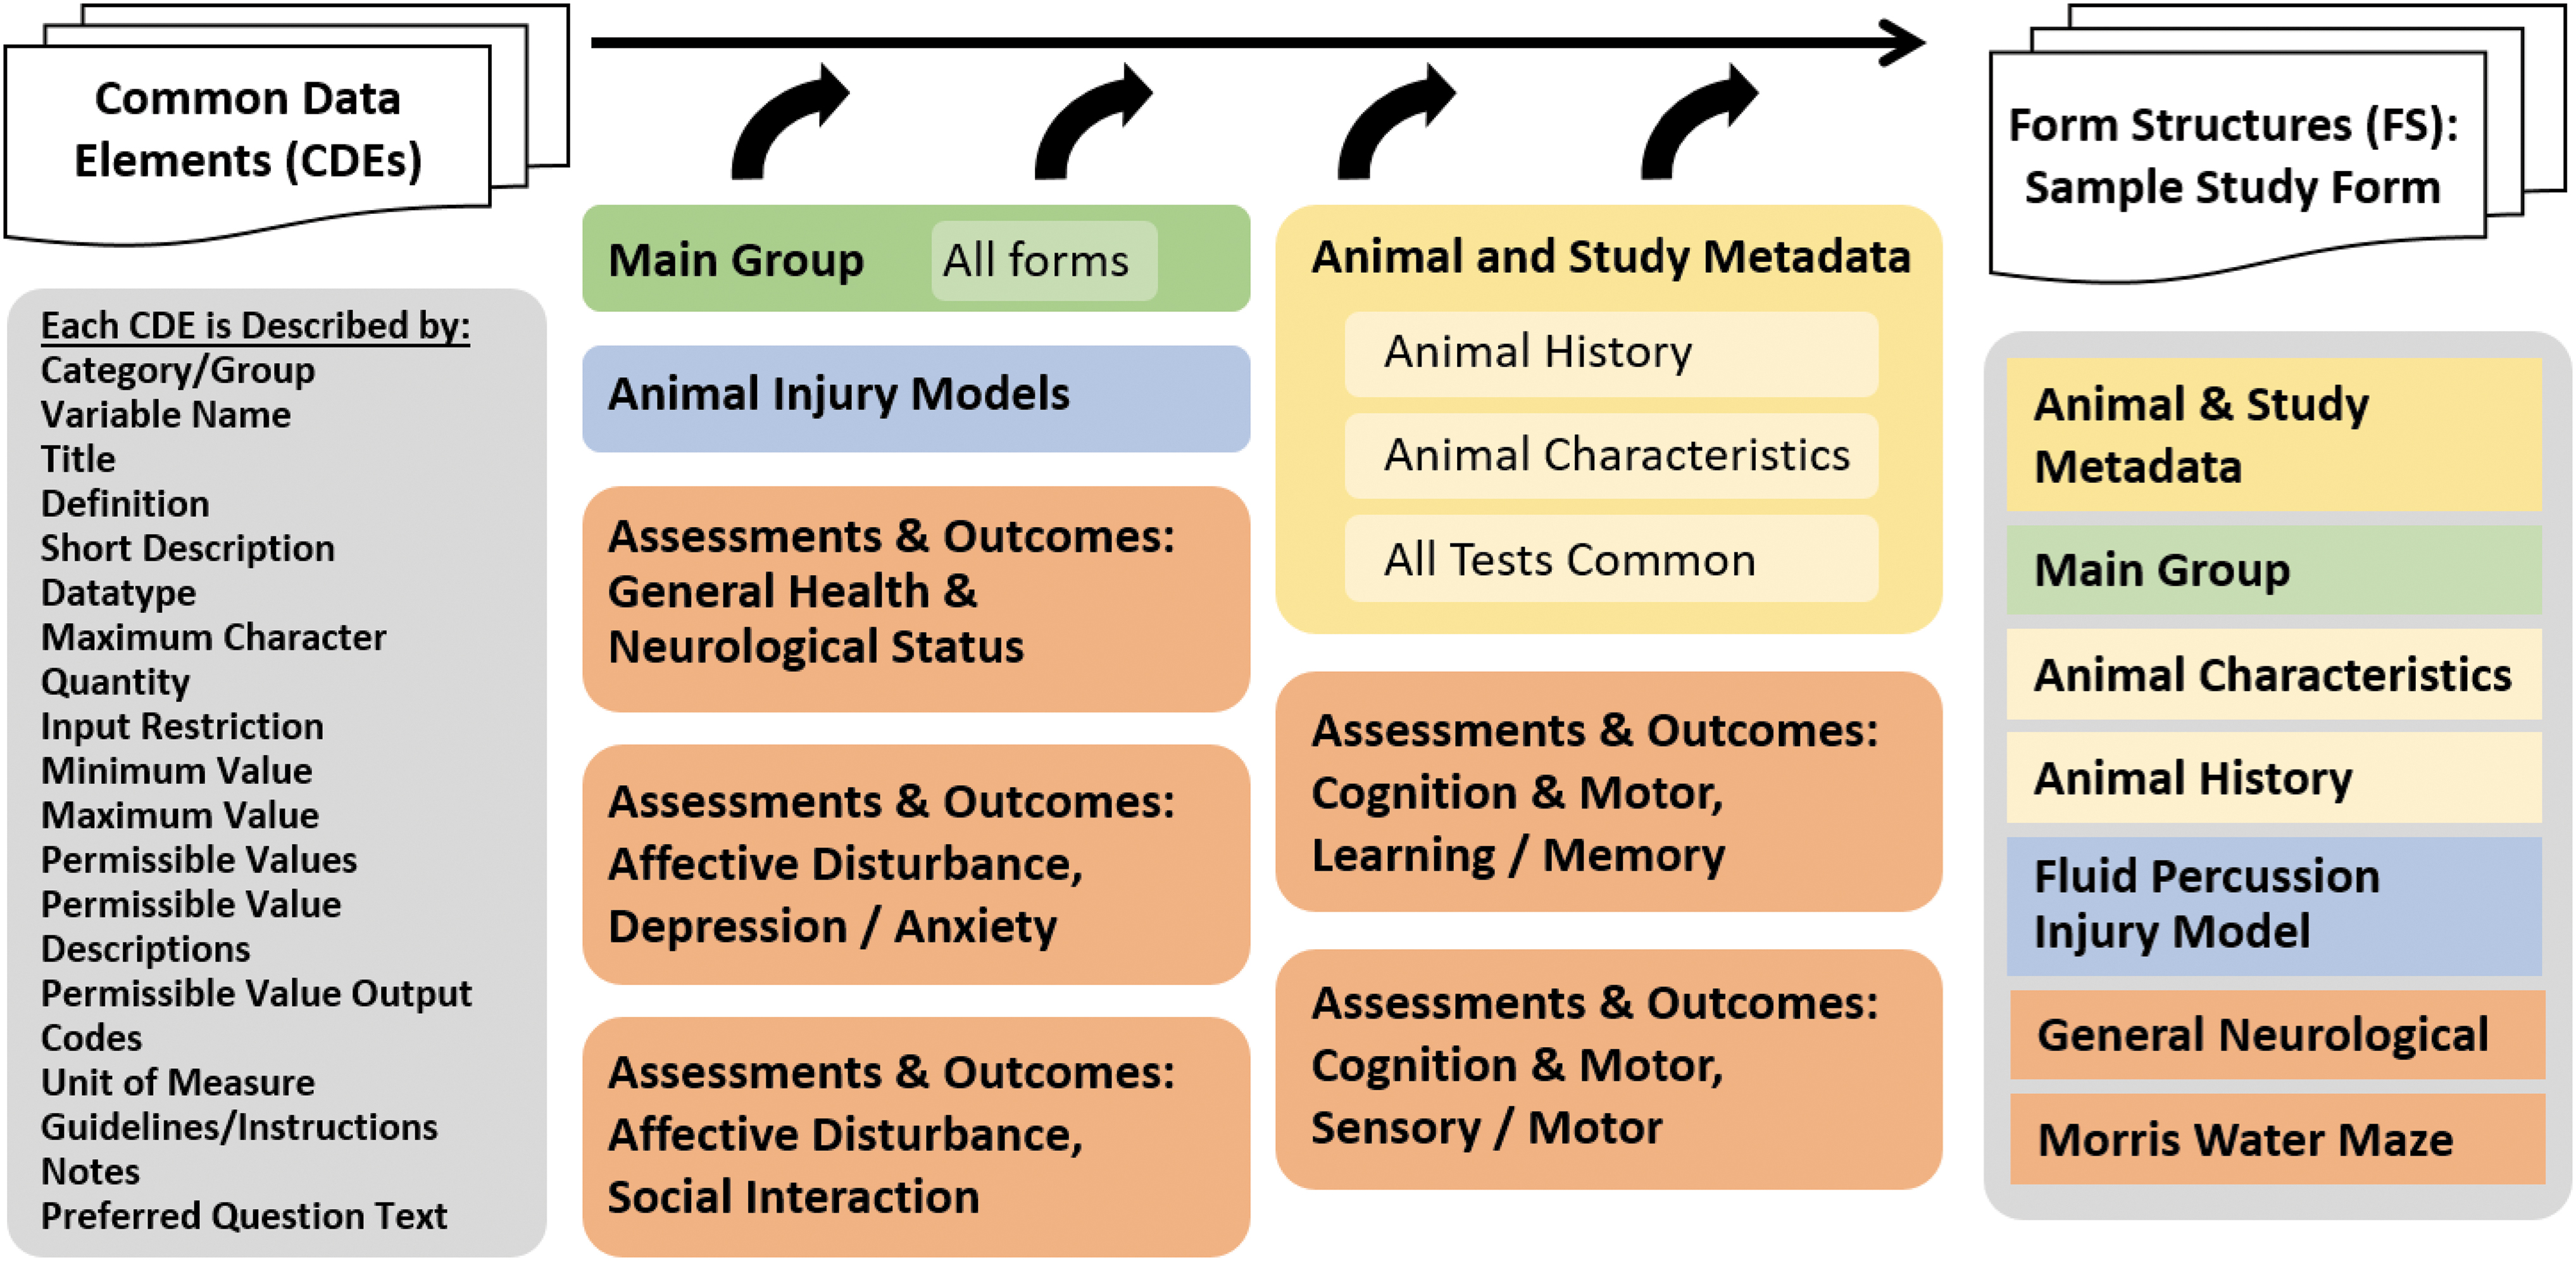
Pre-clinical Traumatic Brain Injury (TBI) Common Data Element (CDE) Groups and Form Structure Procedure. The CDEs are described by a set of attributes (left) that described the data element, inform the user about the input format and permissible values, units of measure and similar information necessary to ensure consistent data entry. In addition, there are instructions, guidelines, and references as appropriate. CDEs are organized into several groupings, shown in the center. The Main Group is intended to go on every form and considered essential to every pre-clinical study. The Animal and Study Metadata includes groups on Animal History, Animal Characteristics, and All Tests Common. The Injury Models CDEs are organized by injury model type, but forms may contain other elements, such as Animal History and All Tests Common. Form Structures can then be built from the various groups of CDEs. For example, a FS for a study that uses fluid percussion injury and Morris water maze would be built from the building blocks in the various forms. Color image is available online.
General Study and Animal Subject Metadata
CDEs are shown by the variable name, short description, and permissible values, which are three of the 18 attributes. Main Group CDEs are given; these CDEs are intended to be included in every Form Structure. Selected CDEs from the Animal Characteristics and Animal History groups are also shown. Note that some CDEs that may fit in a particular CDE grouping (e.g., Animal Characteristics) are considered part of the required Main group (e.g., Animal Species, Animal Sex). *Other; Other,specify designation requires a corresponding CDE with “Variable Name Other.” ǂFor CDEs needing a unit of measure, there is a corresponding CDE for “Variable Name Unit of Measure.”
CDEs, Common Data Elements.
The Forms (or Form Structures, FS) are analogous to clinical Case Report Forms (CRFs) and are comprised of selected CDEs, with a corresponding data dictionary that defines the CDEs. At the Form level, CDEs are designated as Required, Recommended, or Optional, to indicate the level of need for data harmonization among datasets. There are Categories/Groups in some of the FS to organize related subsets of CDEs (e.g., Software and Scoring, Testing Conditions). FS are created using the building blocks from the Main group of CDEs and relevant CDEs from the Animal and Study Metadata groups, Injury Models, and Assessments and Outcomes (Fig. 2). Many CDEs appear in more than one FS to maintain a common lexicon across FS, and therefore the total number of CDEs among the 46 FS created is 1664 (Table 2). For example, the Animal Characteristics FS contains CDEs from the Main Group and the Animal Characteristics CDEs, for a total of 13 CDEs. Similarly, each of the Injury Models and Assessments and Outcomes have FS with groups of CDEs specific to that model or test as well as CDEs from the Main Group, Animal Characteristics, Animal History, and All Test Common group (e.g., Light Dark Cycle Type, Trial Number). For the purposes of community dissemination, the 46 FS created are posted in the CDE Repository for download and use in several different export formats (e.g., REDCap, FHIR, JSON) (
Form Structures
The 46 Form Structures that were developed are shown here. The form category is given along with the form name, the general description, and number of CDEs. Note that the total number of elements among all the forms (1664) is more than the number of unique CDEs (913) because of CDEs used across forms.
CDEs, Common Data Elements, PTST, post-traumatic stress disorder.
Use case dataset: Selection and characteristics
To demonstrate the utility of the CDEs, we gathered datasets from several laboratories from working group members and colleagues and piloted the workflow process, from data cleaning, harmonization, and submission, to export for analysis. Analysis included two proof-of-concept use case studies: 1) rat studies from multiple labs using different injury models (fluid percussion injury, FPI; controlled cortical impact, CCI; and penetrating ballistic-like brain injury, PBBI) and the same primary outcome measure (Morris water maze, MWM); and 2) a smaller dataset that used the same injury model (FPI) and the same primary outcome measure (RotorRod or Rotarod). The selection criteria for the datasets included: 1) that the study was already published or derived from published studies; 2) data were available in electronic format; 3) rodent injury models covered in the CDEs were used; and 4) either MWM or Rotarod was a primary outcome measure. There were six different labs and seven different datasets, including the following: 1) MWM: five datasets for MWM, all rat studies, three injury models (CCI, FPI, PBBI), total of 358 subjects, 44 total CDEs for each dataset, with 1851 total cases (animals x behavior trials/animal) and 85,146 total values (cases x #CDEs); and 2) Rotarod: three datasets for Rotarod/Rotor Rod, two mice and one rat, both FPI injury model, total of 97 subjects, with 453 total cases (animals × behavior trials/animal) and 21,744 total values (cases × #CDEs) and 48 total CDEs (see Supplementary Table S2 for summary of lab information). We refer to these datasets as legacy data.
Data cleaning and harmonization
Prior to uploading the data, legacy data underwent cleaning and data harmonization according to CDE definitions. Cleaning included various procedures, such as a simple search and replace (e.g., “rat” to “rats”), spell check, removing extra spaces, etc. The dates were converted to ISO 8601 format, and the injury elapsed time data were recalculated from hours to minutes to correspond with the CDE definition. In addition, some reasonable extrapolations were done, mostly for behavioral tests dates. For example, since the behavioral tests were all done at a specific number of days post-injury, as defined in the study design, if we knew the date of injury, and if the behavioral test dates were not available, we extrapolated these dates based on the study design information. Files were manually checked for values that appeared incorrect (e.g., out of normal range) and if confirmed wrong or inconclusive, were removed from the submission. Legacy data were entered into the appropriate spreadsheet (i.e., FS, comma-separated value [csv] format), and harmonized to the corresponding CDEs. Harmonization entailed mapping (or matching) the collected data categories to the appropriate CDEs and entering the values into the corresponding column in the spreadsheet. Some data pieces were further separated into basic units to facilitate mapping to the simplest CDE level (e.g., 50 mg/kg intraperitoneally is a dose quantity, a dose unit, and a dose route).
Form generation and data submission
The finalized sets of CDEs for MWM and Rotarod were gathered into the logical FS. The FS for MWM contained 44 CDEs, where 20 CDEs were created specifically to capture key parameters of the MWM test and 24 CDEs were taken from the set of variables commonly used across multiple studies (Supplementary Table S3). The CDEs include, among others, injury group (e.g., injured, sham, naïve), time elapsed since injury, species, sex, injury date, tank diameter, water depth, water and room temperature, platform height, duration of each trial, swim speed, latency, and percent time in target quadrant. Overall, for MWM, there were 6 CDEs associated with “data collected” (i.e., dependent variables), with the remaining 38 CDEs from independent variables related to animal and experimental descriptors. The number of rows assigned to each subject equaled the number of days the animal underwent water maze assessment, so that the latency to find the platform on each day of testing was entered in a single column for the corresponding CDE. For example, if there were 4 days of MWM acquisition testing followed by a probe trial on Day 5, there were five rows for each subject. Similarly, the set of CDEs in the Rotarod FS includes 48 CDEs, where 15 CDEs were created specifically to capture key parameters of the Rotarod test, and 33 CDEs were taken from the set of variables commonly used across multiple pre-clinical TBI experiments (Supplementary Table S4). The Rotarod FS contained three CDEs in the “data collected” category and 45 CDEs associated with animal and experimental independent variables.
Each animal subject was assigned a Globally Unique Identifier (GUID), provided by Federal Interagency Traumatic Brain Injury Research (FITBIR) Operations, that was entered into the FS in addition to the subject ID that was given by the investigator. Once the data were mapped into the FS and cleaned, the FS was validated and submitted to the FITBIR demo site (a temporary workspace for the working group and pilot study) using the validation and submission tools on the FITBIR website.
Statistical analysis
We determined how well CDEs aligned on each uploaded dataset by performing a descriptive missing value analysis (MVA module; SPSS v.25, IBM), which analyzes the extent to which data were complete, and the nature of the “missingness.” 21,31 Each cell was categorized as “complete” if it contained a value within the cell of the uploaded spreadsheet. Data cells were categorized as “missing values” if they did not contain a value within the cell in the uploaded spreadsheet. This is the foundation of the statistical method known as “missing values analysis” where the pattern of missingness is characterized, and mitigation strategies can be devised to recover missing data, or fill in (impute), or estimate missing values within a particular confidence interval. 31 Each dataset (MWM, Rotarod) represents a number of studies within and across labs. As discussed above, the data were structured so that repeated measures were on separate rows of the dataset. Thus, each animal had multiple rows associated with it. Each of these rows are referred to in this missing values analysis as “cases.” To accurately assess the extent of completion, all identifying/demographic values that would not vary across time (e.g., sex) for each animal were repeated. The level of completion was assessed in three dimensions: the number of variables that had complete data across cases, the number of cases with complete data across all variables, and the total number of values that were completed (variables × cases). Finally, the number of variables in each dataset for which there were no data across all cases was reported.
Results
Missing data analysis: Morris water maze
Analysis of data missingness across the full set of data elements for MWM data pooled across the five contributing laboratories are shown in Figure 3. Analysis across data elements revealed that 50% of the MWM data elements were complete, indicating that a half of data elements (spreadsheet columns) contained at least 1 missing value. Analysis of cases (individual animals at individual time-points; spreadsheet rows) revealed that 100% of the animals had at least one missing data element. Yet, when considering the total number of values (data 1elements x cases), a minority of values were missing (35.25%). Examination of the overall matrix of (data elements × cases) revealed that several variables were not being collected at all in these legacy studies. Out of 20 MWM specific CDEs, five CDEs contained no data for all the MWM studies, indicating that 25% of CDEs defined specifically for MWM were not being used at all, including three intended for data collection and two describing MWM test parameters or equipment specifics. Out of 24 cross-cutting CDEs, eight had blank data across all MWM studies (38%), including two from the Main group (animal birthdate and injury date time), two from equipment info (test computer and apparatus model), as well as elements for room illumination level, time point before injury, and alternative (other) elements. In addition, there were 11 distinct patterns of missingness that could be identified in the MWM dataset. This suggests that many of the workgroup-defined MWM data elements are not in common use by the TBI labs participating in the current pilot study. However, there were a number of elements that were collected universally across labs, suggesting feasibility of implementing CDEs for MWM in legacy datasets. The missing percentage for each CDE in the MWM missing value analysis is in Supplementary Table S3.
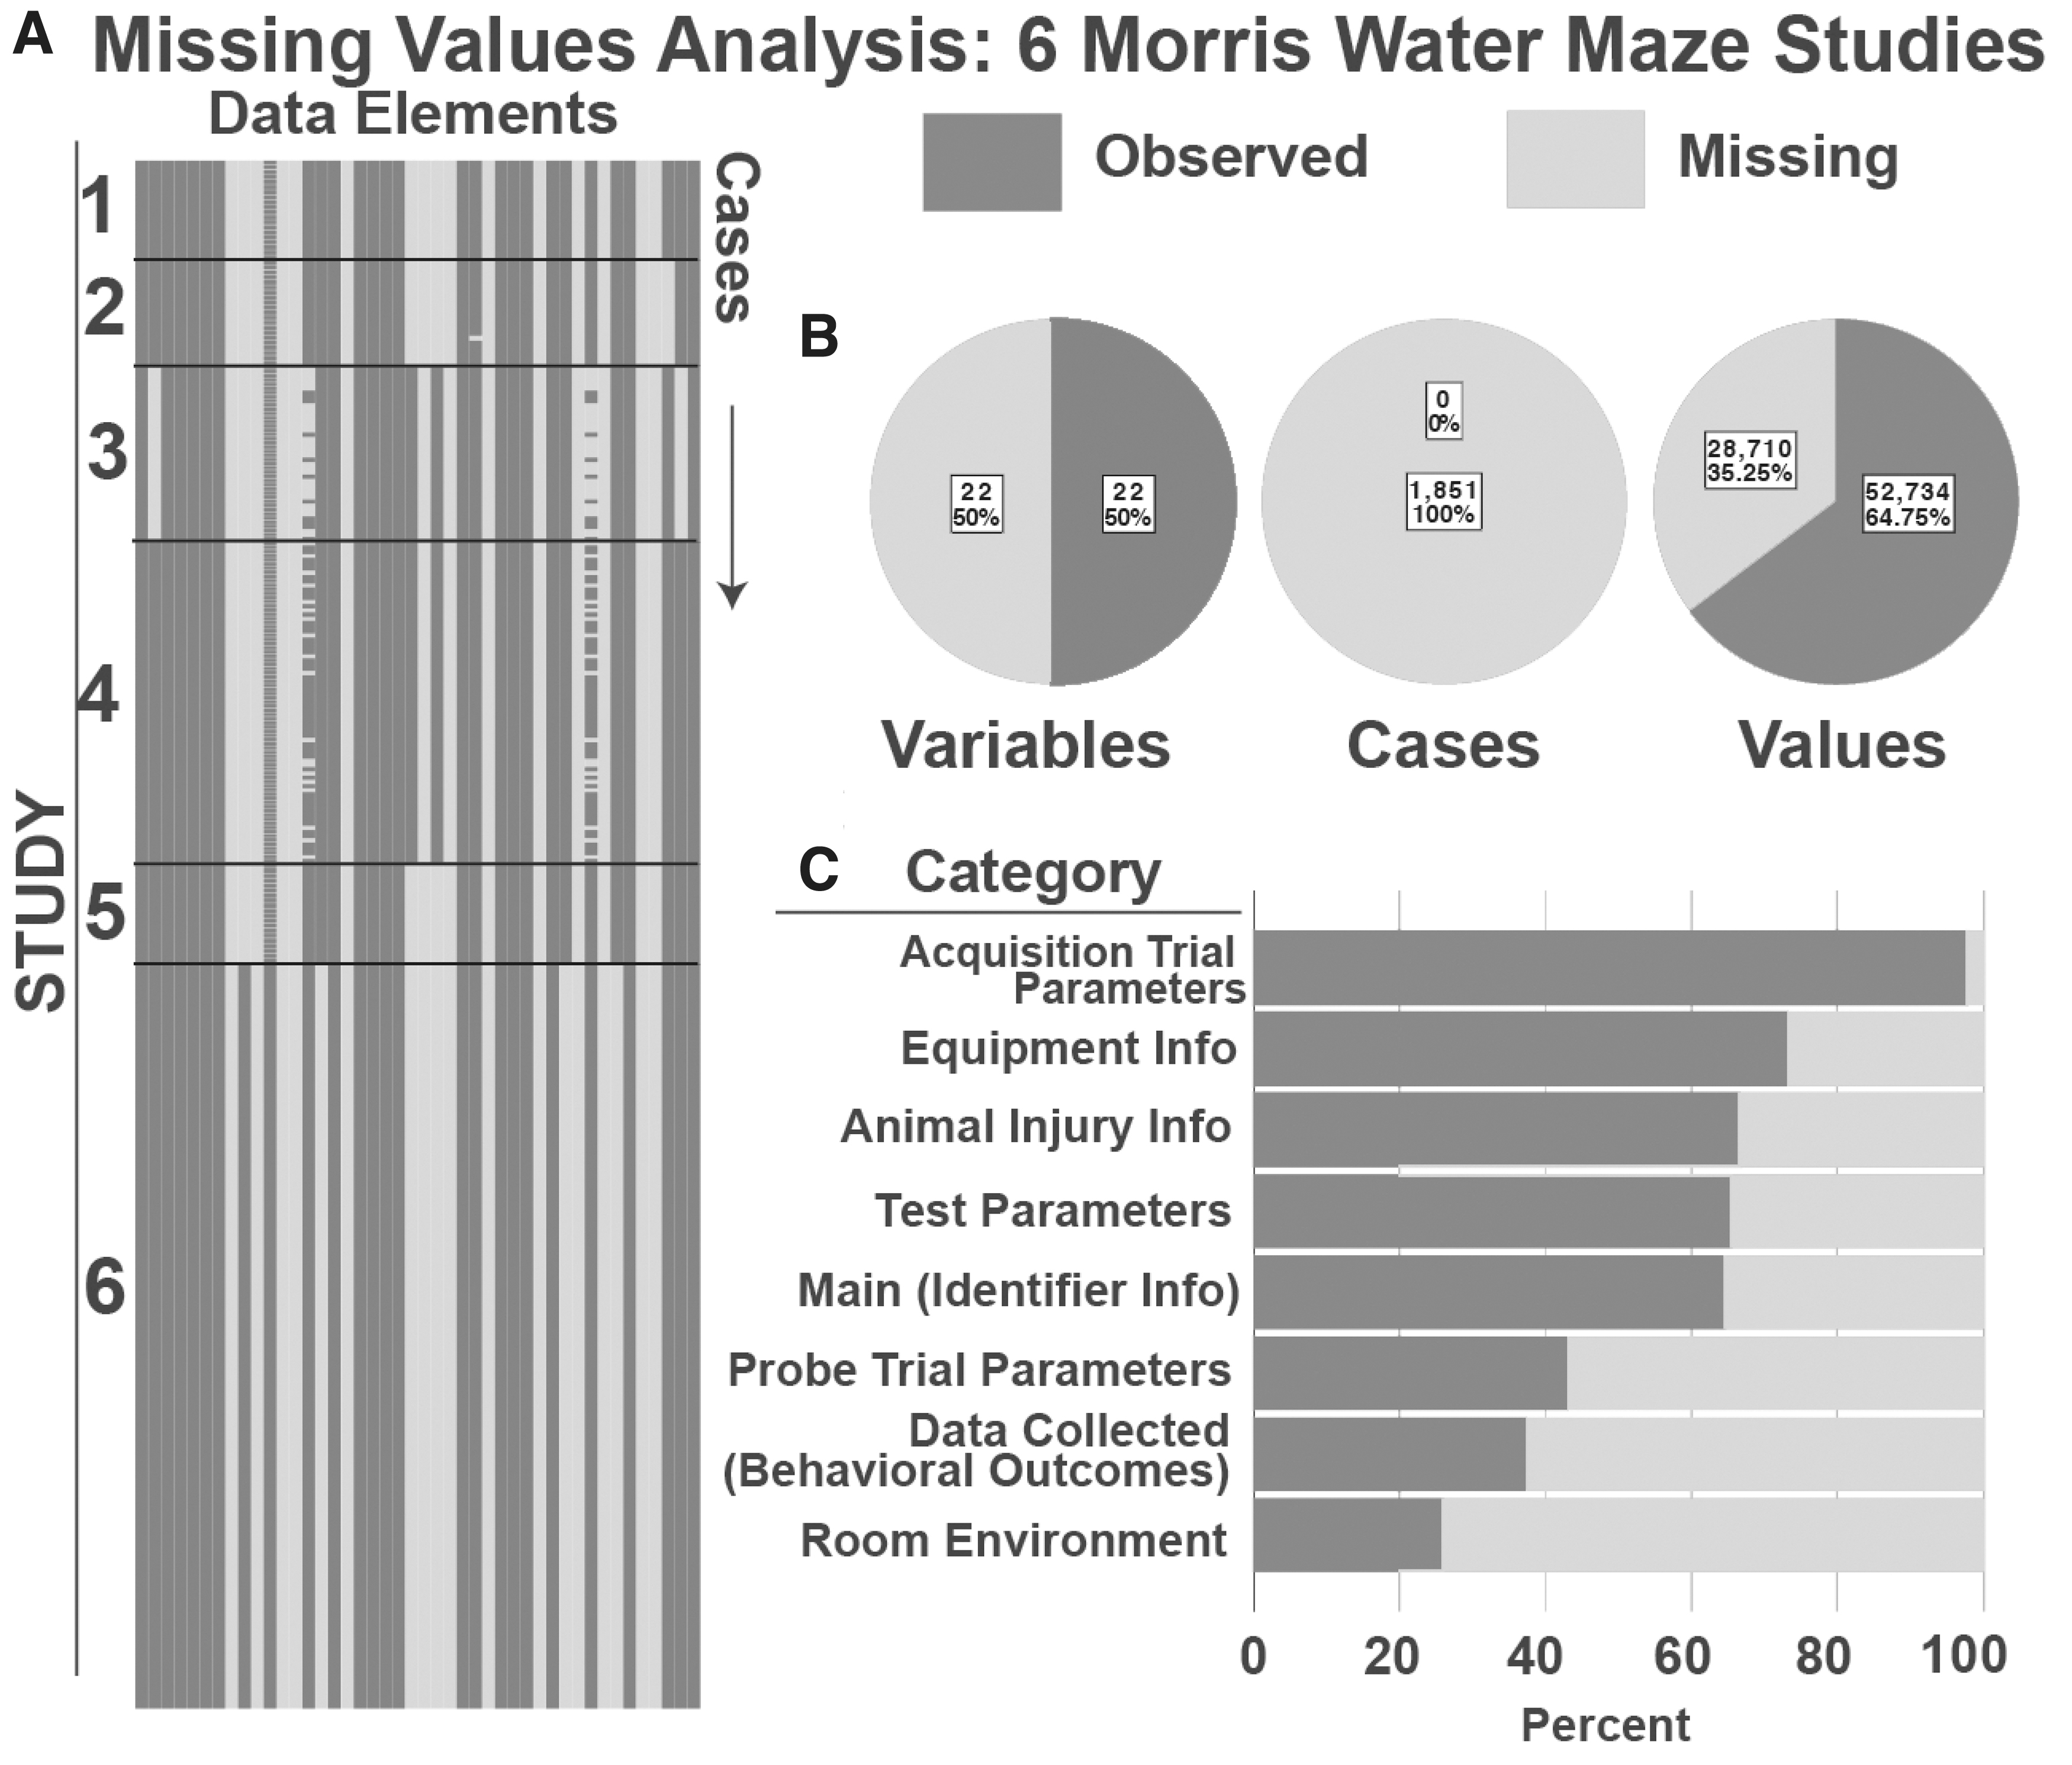
Missing Values Analysis for Morris Water Maze (MWM) Studies.
Missing data analysis: Rotarod
Analysis of data missingness across the full set of data elements for Rotarod data pooled across the two contributing laboratories are shown in Figure 4. Analysis across data elements revealed that 39.6% of the Rotarod data elements were complete, indicating that a majority (60.4%) of data elements (spreadsheet columns) contained at least one missing value. Analysis of cases (individual animals at individual time-points; spreadsheet rows) revealed that 100% of the animals had at least one missing data element. Analysis of the total number of values (data elements × cases) revealed that 33.18% were missing across the three studies. Examination of the overall matrix (data elements × cases) revealed 6 different distinct patterns of missingness, and that several variables were not collected. From the CDE use perspective, out of 15 Rotarod specific CDEs, only three had all blank data for all Rotarod studies, indicating that 20% of these CDEs were not used in legacy studies. Out of 33 CDEs commonly used across multiple pre-clinical tests, eight had blank data across all Rotarod studies, which is 24% of all the CDEs in the Rotarod forms. Of the 24 elements that contained at least one missing value, three were CDEs in the “data collected” category, including the Rotarod RPM value (100% missing), the Rotarod mean distance value (53.6% missing), and the Rotarod latency time (2% missing), with the other 21 missing CDEs being variables associated with groups such as animal information (e.g., animal birthdate) and experimental variables (e.g., trial duration value). The CDEs with 100% missing values included three Rotarod specific variables, five animal information variables, two test parameter variables, two equipment information variables, and one room environment variable. Overall, this analysis suggests that most of the workgroup-defined Rotarod data elements were in common use for this pilot study, although additional legacy datasets should be queried to establish consensus. The missing percentage for each CDE in the Rotarod missing value analysis is in Supplementary Table S4.
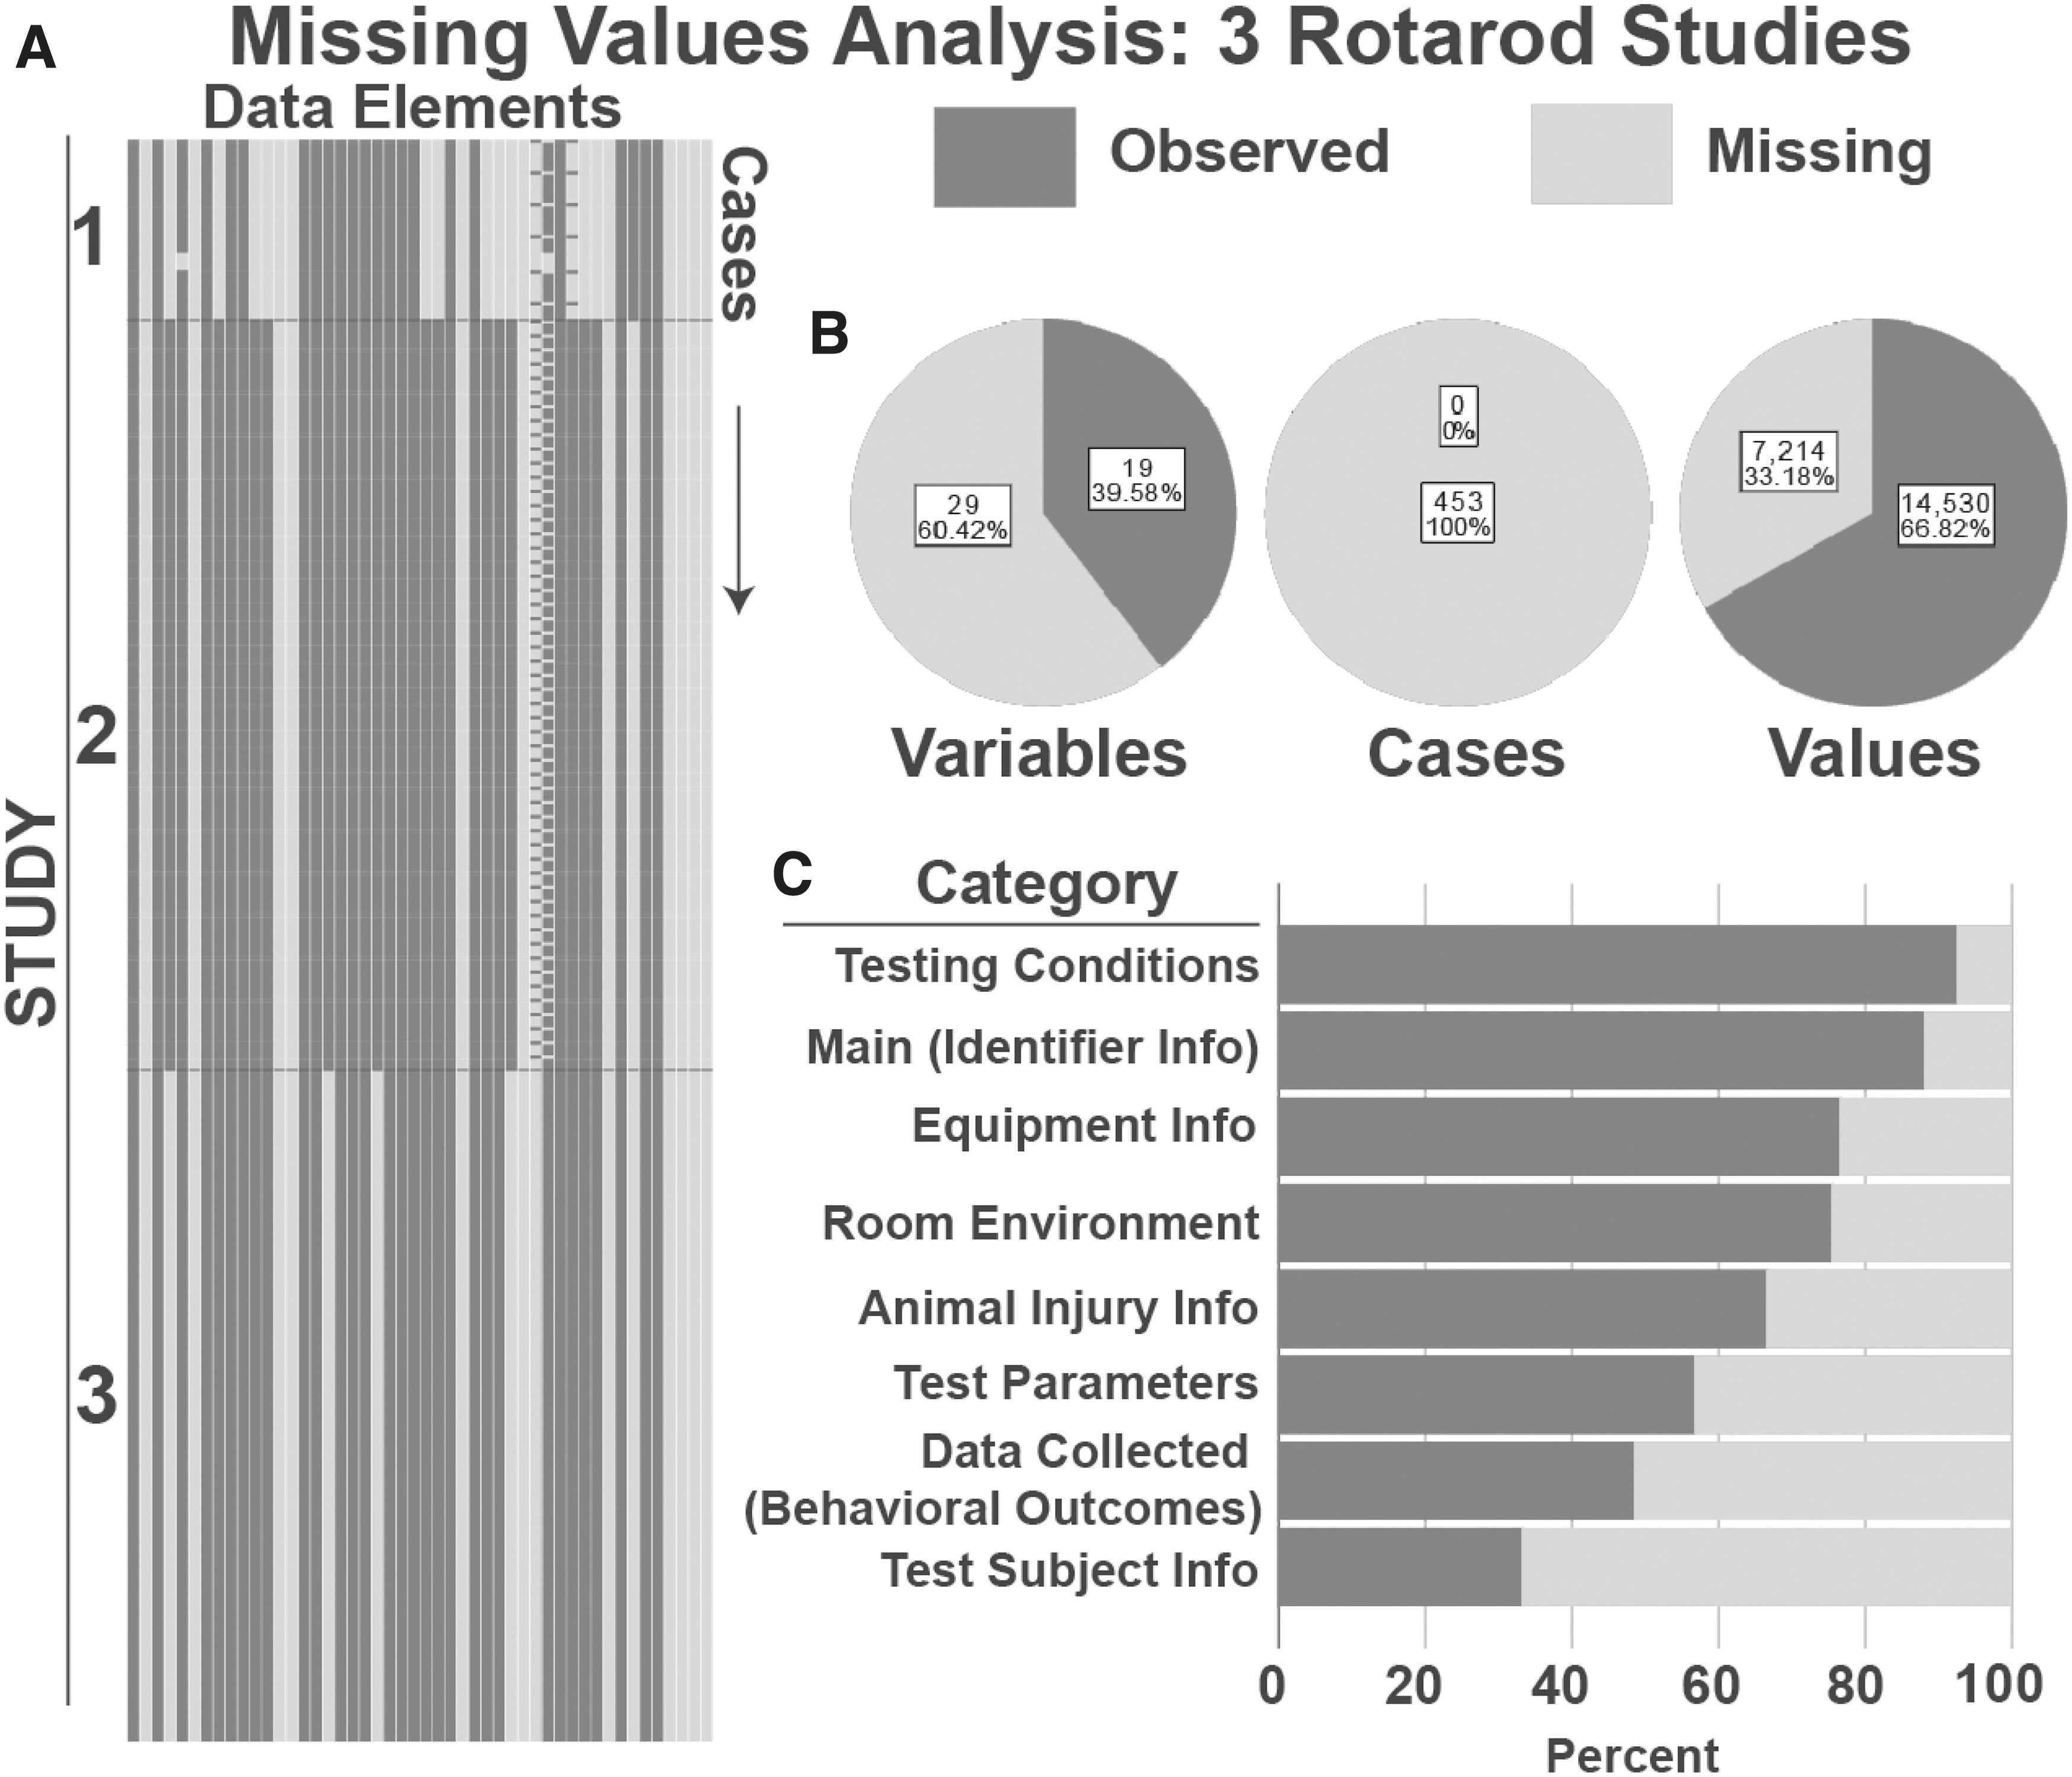
Missing Values Analysis for Rotarod Studies.
Discussion
We present the development of CDEs for TBI pre-clinical research and demonstrate the feasibility and utility of managing and sharing data using the CDE platform. Working groups met regularly and focused on refining previously defined data elements, incorporating additional core CDEs, and creating new CDEs for commonly used behavioral outcome measures. In selecting and defining the CDEs, the working groups considered the level of experimental detail that is commonly reported across studies, variables necessary for improved reporting rigor, as well as details that may enhance inter-investigator data harmonization moving forward. The result was 913 CDEs and 46 forms, all of which can be used by the TBI research community to analyze legacy data and for design of prospective studies.
In order to demonstrate utility of the CDEs, we collected seven pre-clinical datasets for two behavioral outcome measurements from six different laboratories and conducted a proof-of-concept exercise to map legacy data to the CDEs, upload the Form Structures to a data repository, and analyze the data for missing values among the datasets. In both datasets, at least half of the CDEs had at least one missing value and 100% of the animal subjects had a least one missing CDE, which is not surprising given the number of CDEs in the FS (44 for MWM and 48 for Rotarod) and multiple trials per animal. When considering all the elements (i.e., values) across a dataset (number of subjects × number of CDEs × number of trials), only 35% of the MWM FS data elements were missing, and 33% of the Rotarod FS data elements were missing, indicating that investigators have a substantial common set of CDEs but that there are also a number of elements identified by the working groups that were not used or reported as part of the legacy dataset.
It is not surprising that any given laboratory does not include all the data elements recommended by a group of peer experts. Working group discussions focused on the ideal set of variables for TBI studies, focusing on common behavioral tests. Development of a comprehensive data dictionary ensures that common language is proposed to the research community. As an ontology evolves refinement of the CDEs will ensure that unnecessary or arbitrary data elements are removed and pertinent elements are added. It should be noted that several variables restrict responses to a set of pre-defined values (e.g., animal injury models, housing conditions) to permit standardization of terms and ease of searches. In these cases, it is typical to include a companion “other” element with a free form text box to allow for nonstandard data entry (e.g., AnimalHousingTyp and AnimalHousingTypOTH). The MWM FS contained two of these (both with 100% missing values) and the Rotarod FS contained five “other” CDEs, with three of them having 100% missing values, inflating the true missing elements slightly.
With respect to CDEs not being used consistently across labs in this analysis, it is possible that the CDEs were not anticipated to be used in the original study. Most of the CDEs in the FS were associated with independent variables, especially those describing the test parameters, test conditions, and equipment. It is worthy to note that the Rotarod datasets were mostly from the same laboratory (two of three, or 88% of the cases), and while the percentage of missing CDEs was lower than in the MWM dataset, likely due to laboratory specific protocols, the percentage of missing values was similar. The patterns of missingness enabled us to examine consistency among datasets as well as the degree of congruency between working group emphasis and actual use. These observations may provide a guide for further work to understand the sources of missing data (e.g., protocol differences, differences in data retention standards across studies).
Missing value analyses can define and highlight numerous systematic patterns of missingness. With larger datasets it may be possible to use advanced analytical tools like machine learning to identify missing data patterns and discover the source of data missingness to improve coherence across labs. There are many tools for dealing with missing values among datasets. 31 –33 For example, tools such as the Little's test 31 allow automated data screening to determine whether missing data can be explained by other key variables and thus data are ‘not missing at random’ (NMAR). If so, these key sources of missingness can then become points for quality improvement in data collection protocols. On the other hand, if data missingness is unrelated to variables of key importance, data can be considered “missing at random” (MAR) and it may be possible to use advanced permutation methods to estimate missing values and fill in (impute) values within a specified margin of uncertainty as a preprocessing step prior to carrying out further statistical analysis. If missing data patterns are completely uncorrelated to any other variable within a dataset, they can be considered ‘missing completely at random’ (MCAR) which allows for a wide range of statistical approaches that can help harmonize data using various data-synthesis approaches (e.g., multiple imputation, expectation maximization). Large datasets (e.g., 100 studies with 10,000 subjects) are required to begin these analyses. While we chose to use a missing value analysis to demonstrate use of the pre-clinical CDEs on combined datasets, there are several other possible analyses that could take advantage of these tools (see CDE Use Cases box).
While we used the FITBIR platform for this feasibility study, there are no plans to open up a pre-clinical FITBIR data repository, but rather we provide tools (CDEs, forms) that could be used in an individual laboratory or with another data repository (e.g.,
CDE Use Cases
Case 1 : Reproducing methods between laboratories. A TBI investigator is unable to reproduce the degree of MWM deficits using the same injury model and species reported in a previously published study. The investigator queries a research database that uses CDEs and finds several TBI studies using MWM. No differences were found in how the experimental TBI was produced or cortical lesion volumes, indicating a comparable injury severity, but it was discovered that the published study utilized a 6ft diameter water tank while the investigator's tank was 3ft in diameter. After switching to the larger size tank, the new MWM data were then similar to the published study.
Case 2: Checking novelty. An investigator reads about an interesting drug from another field and wants to determine if it has been studied in TBI. After finding no published citations, she searches a preclinical CDE database and discovers unpublished findings that show no therapeutic efficacy. She examines the CDEs closely and observes that the treatment window may not have been optimal for the target mechanism. The investigator designs a new experiment based on this information
Case 3: Metaanalyses. An investigator is testing the efficacy of a particular drug on cognitive performance after several TBI preclinical studies published results using different behavioral assays and dosing parameters with varying degrees of post-injury efficacy. To gain statistical power to detect drug efficacy, the investigator performs a metaanalysis on the combined results from multiple studies that have been uploaded into a CDE database.
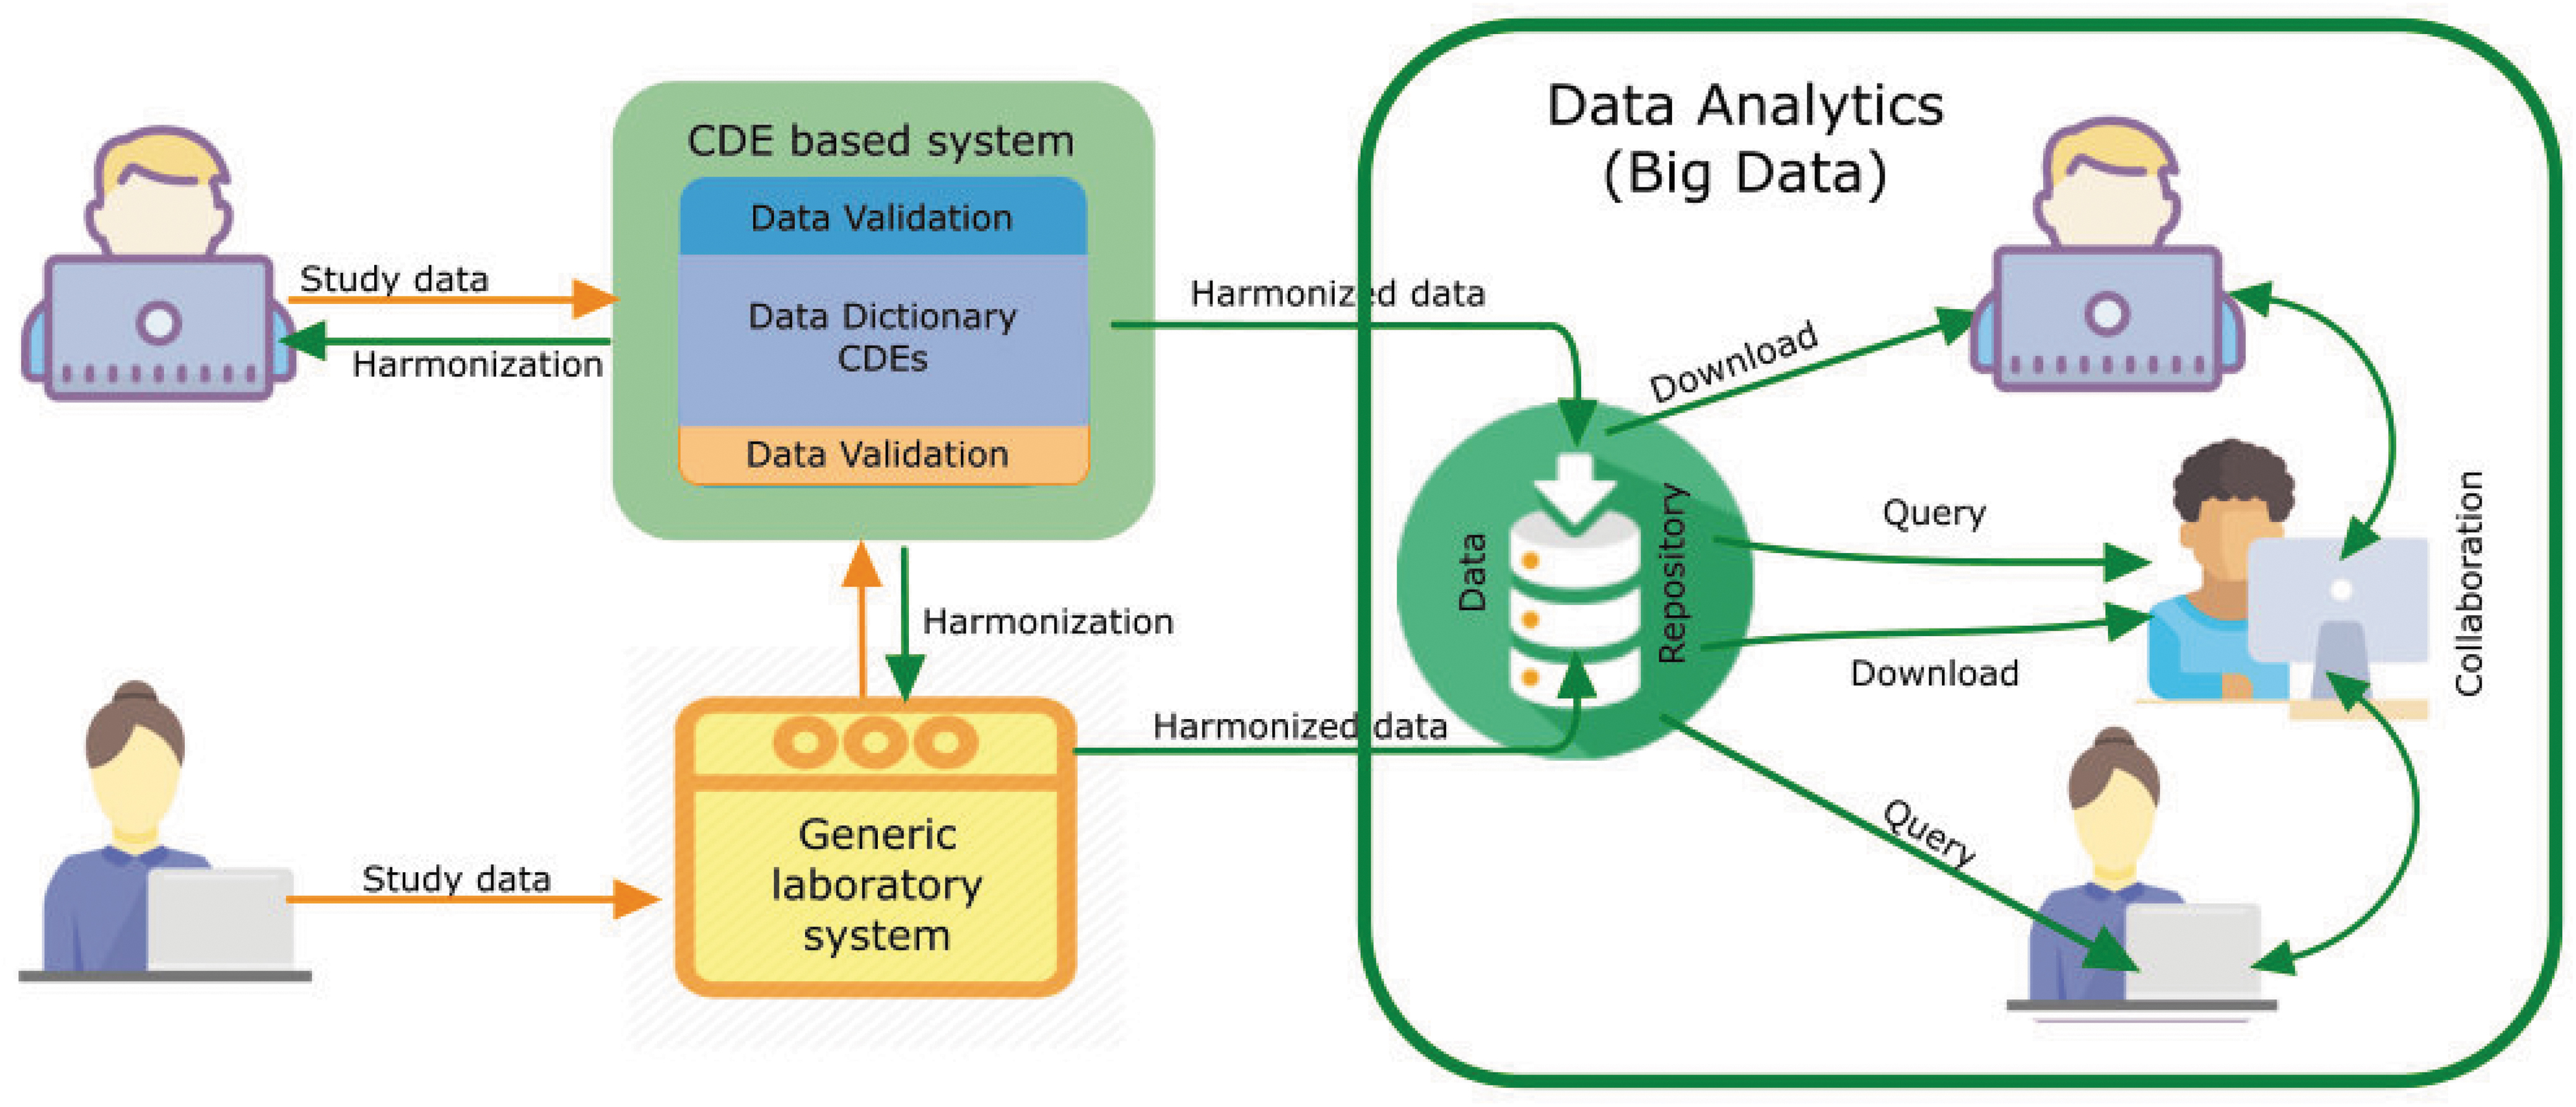
CDE Use in Data Analytics. CDEs can work prospectively and retrospectively / independently. The top left scenario depicts a user who may work prospectively with a CDE based structured system, while the user on the bottom left may use independent, laboratory specific data collection systems, which are then harmonized with existing CDEs. These harmonized data can then be used by a variety of big data platforms. The use of CDE based informatic systems in research can facilitate data harmonization, thus easing cross study comparisons, data aggregation and meta-analyses, simplifying staff training and study operations, improving overall study efficiency, and promoting interoperability between different systems. Color image is available online.
Pre-clinical TBI research has many potential sources of variability from animal models to behavior assay procedures, which can be captured through the use of CDEs. The use of multiple animal models in the TBI pre-clinical community can be advantageous to represent clinical heterogeneity but comes with an enormous variability in injury model parameters among labs and operators. There is a need to accurately and thoroughly report the details of the injury model and animal procedures for induction of TBI in order to identify potential confounders in the response. 19,34 Sources of heterogeneity in injury response can also arise from animal strain, animal vendor, and genetic and physiological differences—all of which can be captured in CDEs. Other within laboratory and between laboratory sources of variability (some less studied), including husbandry conditions, procedure time of day, protocol execution, lab environmental conditions, measurement technique, and general procedural differences (e.g., length of anesthesia) are also likely to affect experimental outcomes and, if not reported, could reduce reproducibility of the results.
Designing studies in the context of CDEs and corresponding forms for data collection will result in more thorough reporting of methods, including experimental injury parameters and outcome measures. 38 Better definition of variables will provide TBI researchers with tools to evaluate the impact of experimental factors that may be important to the research design, as well as to consider key research design elements that may explain differences in results from study to study. 39 However, it is acknowledged that rigor does not necessarily result in reproducibility, but it does allow the research community to identify factors that may explain heterogeneity.
Importantly, CDE creation is not intended to dictate how procedures and outcomes are performed or collected, but rather to provide a set of standardized, flexible tools to assemble the data. Over-standardization may contribute to results that may be more reflective of differences between laboratories and animal phenotypes rather than genuine scientific findings. 35 Some recent work suggests that heterogeneity may improve reproducibility. In an analysis of single- versus multi-laboratory studies across 13 different interventions in pre-clinical models of stroke, breast cancer, and myocardial infarction, multi-laboratory studies predicted effect size up to 42% more accurately. 36 Thoughtful standardization of some model parameters and careful implementation of deliberate heterogeneity may improve reproducibility and validity of pre-clinical results. 37
The use of CDEs within and across laboratories is not without challenges. As we observed, mapping legacy data to defined CDEs is time consuming and is largely a manual process. With respect to data sharing, maintenance of data repositories is not trivial and requires data science expertise and financial resources. In addition to FITBIR (
While the working group focused on small animal behavioral outcomes, it is recommended that future efforts continue development of CDEs for large animal injury models, as such models become more widely used (see Supplementary Fig. S1 for a pilot missing value analysis in porcine TBI model). Large animals, such as the pig, are a necessary piece of the translation pipeline and can better model human neuroanatomy and physiology, compared with rodents. Other domains that will require attention in CDE development include histopathology, physiological measurements (e.g., blood gases, blood pressure, heart rate, electroencephalogram, sleep), biofluid biomarkers, imaging, pharmacokinetics, and molecular and neurochemical assays. The broader goal of the working group was to continue the dialogue with the basic and clinical research communities to maximize the impact of pre-clinical data harmonization and guide the trajectory to purposeful translation.
In summary, it is expected that the development of CDEs for pre-clinical TBI research will help to establish a well-define lexicon for the collection, reporting, and sharing of pre-clinical data with the goal of enhancing rigor, reproducibility, and transparency and to account for difference within and between laboratories. Better reporting will facilitate comparison of results between studies, duplication of published studies and confirmation of findings, possibly revealing new interpretation and hypothesis generation. The prospect of using the tools described here is expected to foster large collaborative efforts that require data sharing, such as prospective multi-site studies, meta-analyses, and data-based modeling efforts, ultimately improving the translation of pre-clinical findings to clinical studies and treatments for TBI.
Footnotes
Acknowledgments
We thank the investigators who contributed data to the project (in addition to author contributors): Shaun Carlson, University of Pittsburgh, Anthony Kline, University of Pittsburgh, Rachel K. Rowe, University of Arizona, and Deborah Shear, Walter Reed Army Institute of Research; Stephen Ahlers, Naval Medical Research Center contributed to CDEs development, Matthew McAuliffe and the BRICS staff contributed the FITBIR infrastructure.
Funding Information
Authors acknowledge NIH National Institute of Neurological Disorders and Stroke (NINDS, R21 NS096515-02S1 (JL), R01 NS091062-03S1 (CED)), NIH Center for Information Technology (CIT) and Biomedical Research Informatics Computing System (BRICS), and the Department of Defense for technical and financial contribution to the FITBIR program.
Author Disclosure Statement
A.S. Galanopoulou is co-Editor in Chief of Epilepsia Open and has received royalties for publications from Elsevier and Morgan & Claypool publishers. No competing financial interests exist.
Supplementary Material
Supplementary Figure S1
Supplementary Table S1
Supplementary Table S2
Supplementary Table S3
Supplementary Table S4
References
Supplementary Material
Please find the following supplemental material available below.
For Open Access articles published under a Creative Commons License, all supplemental material carries the same license as the article it is associated with.
For non-Open Access articles published, all supplemental material carries a non-exclusive license, and permission requests for re-use of supplemental material or any part of supplemental material shall be sent directly to the copyright owner as specified in the copyright notice associated with the article.