




Abstract
Spinal cord injury (SCI) is commonly caused by traumatic mechanical damage. Although numerical models can help predict the mechanics of SCI without putting the subjects in danger, previous studies did not focus on alternations in cerebrospinal fluid (CSF) pressure and did not account for the presence of epidural fat. This study aims to numerically compare the mechanical behavior of the human spine when subjected to contusion and burst fracture with varying CSF pressure, either normal or elevated pressure that represents intracranial hypertension. An additional aim is to find out how the presence of the fat in the model affects the SCI calculations. CSF and epidural fat were modeled as smoothed-particle hydrodynamics (SPH) and the soft tissues were modeled as hyperelastic. This approach made it possible to account for CSF pressure alteration and its effect on the cord. Validation models resulted in good correlation with previous numerical and experimental studies. The results were able to capture the fluid dynamics of the CSF while demonstrating a considerable change in the stresses of the spinal cord. The comparison of the CSF pressures demonstrated that SCI in patients with elevated pressure and in regions where insufficient epidural fat exists might lead to higher spinal cord stresses. Yet, in regions with enough fat, the fat can absorb energy and counteract the effect of the elevated pressure. These results indicate important aspects that need to be accounted for in future numerical models of SCI while also demonstrating how the injury might be aggravated by preexisting conditions.
Introduction
Traumatic spinal cord injury (SCI) is caused by mechanical damage in 83% of cases, or ∼12–33 yearly incidences per 1,000,000 people. 1,2 The mechanical responses during such injury involves the entire spine, including the vertebral column, and the cord inside it. The cord is immersed by cerebrospinal fluid (CSF) that acts as a protecting shock absorber. 3,4 Therefore, the response of the CSF cannot be ignored when considering the mechanics of the spinal cord. 5 We hypothesize that alterations in the CSF properties should have direct mechanical influence on its shock-absorbing capabilities. An example for such an alternation is an abnormally high CSF pressure, also known as idiopathic intracranial hypertension (IIH). 6
Although SCI biomechanics have previously been studied by in-vitro and in-vivo animal experiments, it is generally considered not possible to study it clinically. Numerical models can help predict mechanical details without putting the subjects in danger and while examining the effect of specific parameters. Early finite element analyses (FEA) of SCI modeled the flexion and extension of cervical spine 7 and burst fracture process. 8 –10 However, these studies either ignored the CSF 8,10 or simplified it as an elastic structure. 7,9
With increasing computational power, fluid–structure interaction simulations became more common. Simulations of CSF interaction with either the brain 11,12 or the cord 5,13 confirmed its shock-absorption function. Persson and coworkers 5 modeled the CSF by Arbitrary Lagrangian-Eulerian Method to calculate the response to bone fragment hitting the cord as a result of burst fracture. Similar methods were also used in later studies by other groups. 14 –17 Smoothed particle hydrodynamics (SPH), a meshless numerical method, was previously suggested to be preferred when modeling SCI with the CSF. 15 Russell and coworkers 18 presented the first use of this method for SCI simulations. They modeled both contusion and dislocation in the rat cervical spine and concluded that SPH usage for CSF is feasible. They suggested that SPH usage may be valuable in human SCI models, where the CSF's shock-absorption function is more significant. 18 This functionality has been demonstrated by Toma and coworkers 19,20 in brain injury models. Recently, Jannesar and coworkers 21 employed the SPH method to study SCI in non-human primates and compared subject-specific models. Still, none of the previous numerical SCI studies focused on the fluid dynamics of the CSF and none included the epidural fat. 22,23
There is a need for better understanding of SCI biomechanics and of how CSF pressure may affect it. The current study aims to numerically compare the mechanical behavior of the human spine when subjected to contusion and burst fracture with varying CSF pressures, either normal or elevated. Another aim is to find how the presence of epidural fat in the model affects the SCI calculations.
Methods
This research employs numerical methods to study the behavior of the spinal cord under dynamic loads and with different CSF pressures. Thus, the models focus more on the cord and its surrounding tissues and less on the vertebrae and discs. The models were solved explicitly, because of the highly dynamic nature of this case, with Radioss (Altair Engineering), a solver that previously showed good results in SCI modeling. 15,16,24 The meshless SPH method was employed for the CSF and the epidural fat. In SPH, the fluids are represented as Lagrangian particles; thus, the structural and flow solvers can directly transfer forces and coupling is not needed. The model included the cord (white, gray, and pia matters), CSF, dural sac, epidural fat, and the spinal column (vertebrae, discs, and ligaments).
Modeling details
We focused on the thoracic region, where burst fractures are common 25 and the amount of epidural fat is significant. 26 Although the model included only the T4-T7 region to save calculation time, the anatomy was initially constructed for all the 12 thoracic vertebrae (Fig. 1). The anatomical geometries of the vertebral column and the cord were obtained from the open BodyParts3D/Anatomography database. 27 The column included reconstructed human vertebrae and intervertebral discs from three-dimensional (3D) scans. In this study, vertebrae were considered as rigid bodies with exterior shell elements for contact purposes and with moments of inertia and centers of mass that were calculated based on previously published vertebrae masses. 28 The spinal cord geometry, separated into white and gray matter, was built by constructing sections in the direction of the original cord's geometry. 27 However, the internal structures of the gray and white matter were created in Solidworks (Dassault Systèmes) based on published anatomical dimensions and images 29 –32 (Fig. 1). The geometry was meshed in HyperMesh (Altair Engineering) with tetrahedrons and the white and gray matter shared mesh on their interface. The pia matter was defined on the outer layer of the cord with shell elements of 0.2 mm thickness. 33 The dural sac was also created based on previously published measurements, 29,30 with a homogenous thickness of 0.3 mm. 34 The discs were constructed based on known dimensions 27 and a 0.73 ratio between the dimensions of the disc and the nucleus pulposus. 35 The annulus fibrosus was modeled as five layers separated by ground substance. 36 The discs and the vertebral bodies shared meshes on their common surfaces. The ligaments (intertransverse, interspinous, ligamentum flavum, and posterior longitudinal) were based on the geometry of the vertebrae or the spinal canal, with known cross-sectional dimensions. 37 More details on the mesh and materials are given in Table 1 and Supplementary Appendix SA.
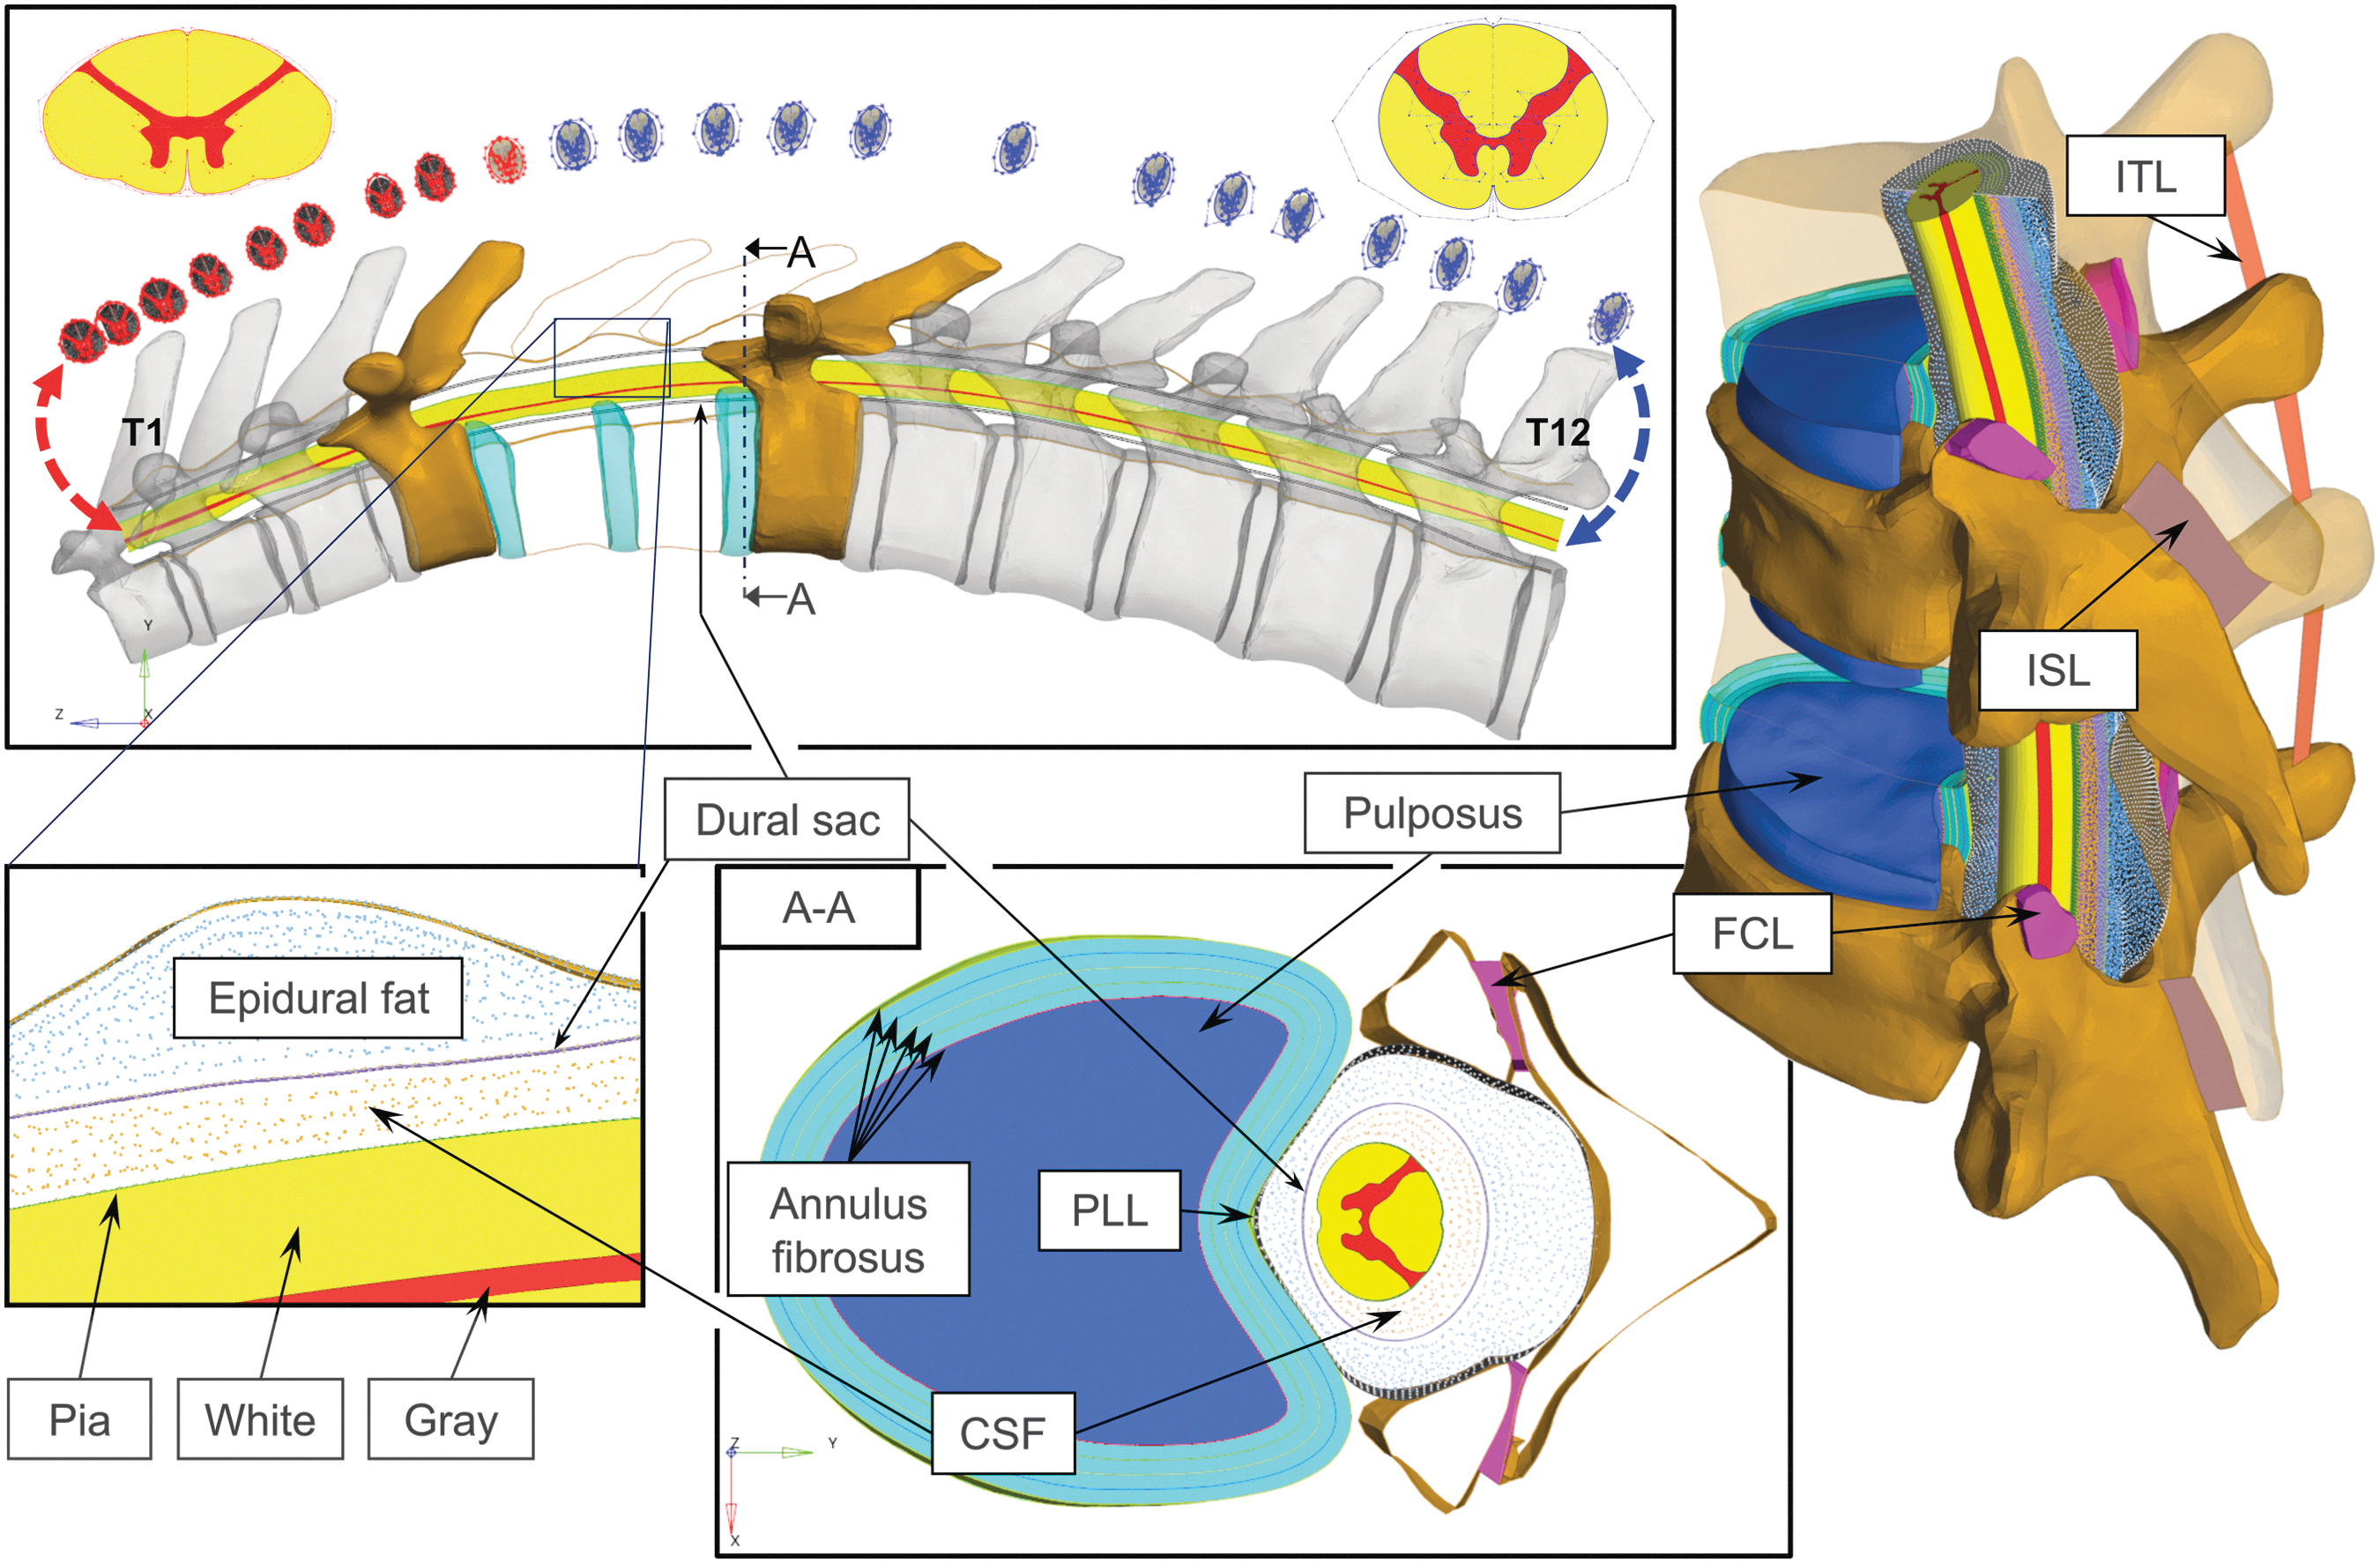
Description of the full T4-T7 vertebrae model and its parts. CSF, cerebrospinal fluid; FCL, facet capsular ligament; ISL, interspinous ligament; ITL, intertransverse ligament; PLL, posterior longitudinal ligament. Color image is available online.
CSF, cerebrospinal fluid; FCL, facet capsular ligament; ISL, interspinous ligament; ITL, intertransverse ligament; LF, ligamentum flavum; PLL, posterior longitudinal ligament; SPH, smoothed particle hydrodynamics.
In this study, SPH was used for both the CSF and the epidural fat. The CSF was enclosed between the pia and dura matter and the fat's geometry was created by FEA to virtually fill the epidural space between the dura and the vertebrae. 22 Therefore, the dural sac was in contact with both SPH matters on both of its sides. The particles were seeded with a homogeneous distance distribution. The SPH smoothing lengths were defined as 0.55 and 0.7 mm for the CSF and fat, respectively, based on the longest distance between neighboring particles. The smoothing length ensured interparticle force transmission at a non-zero gap, and, therefore, these forces acted as a contact even if there was a distance between the walls. Becaues the fluids were incompressible, artificial quadratic and linear bulk viscosities were set to 20 and 10, respectively. 38 The SPH models were validated and pressure stability was verified in Supplementary Appendices SB and SC.
Models of contusive and burst fracture SCI
Two models were simulated with different boundary conditions. The first model represented contusive SCI, and it was simplified by modeling only the dural canal. This model included the white, gray, and pia matter of the spinal cord as well as the CSF and the dural sac. The top and bottom boundaries of the dural sac were fixed, and frictionless contact was defined between the sac and a rear stationary wall. The dural canal was hit by an impactor with a mass of 7.22g and a velocity of 4.5 m/sec (“pellet 1” of Persson and coworkers 5 ), as shown in the left panel of Figure 2. The second model represented burst fracture SCI and it comprised of all the previously described components, including the vertebrae, discs, and ligaments. The burst fracture SCI was modeled as an impact by a fragment of the T5 vertebra (right panel of Fig. 2), to be consistent with the previous model. The mass of the fragment was calculated based on its relative volume and an initial velocity of 10 m/sec was set for it. 16 Other components were not constrained by any boundary conditions except contacts.
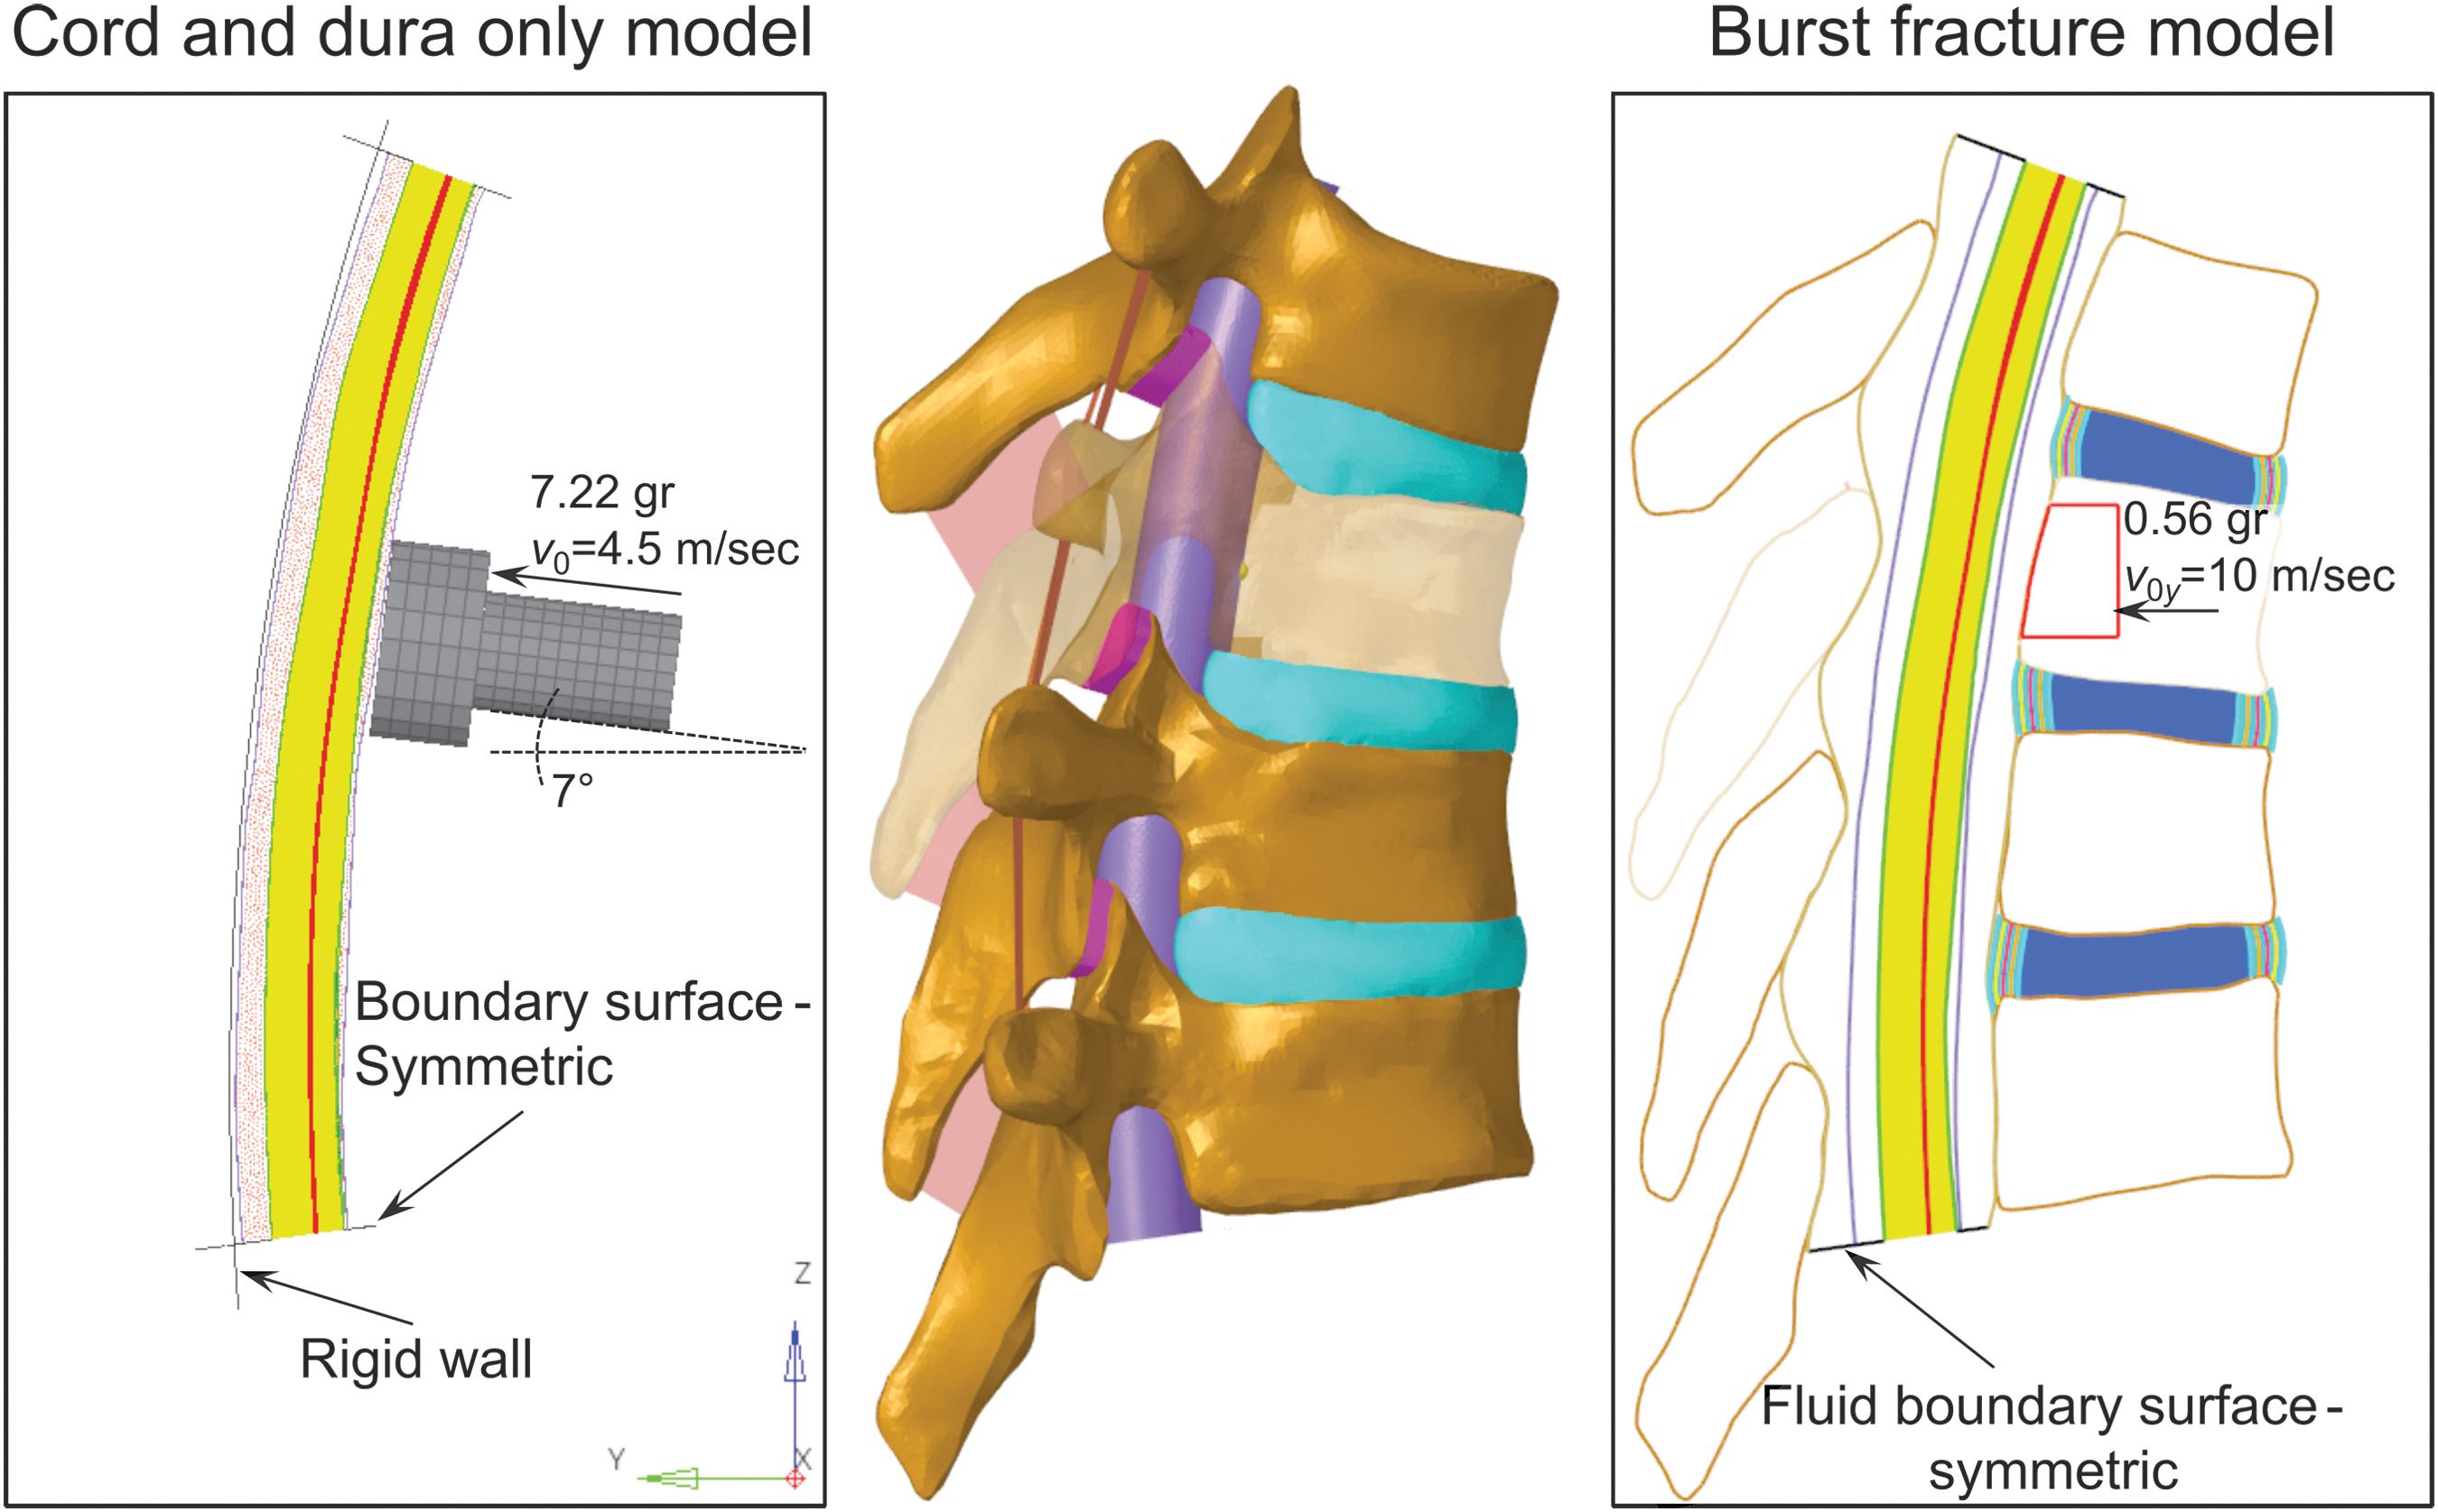
The two types of spinal cord injury (SCI) models in the study. In the middle, the anatomy that the models represent is shown with transparent T5 vertebra, hidden epidural fat, and posterior longitudinal ligament. Left: Contusive SCI model with dural canal only and with boundary conditions of the impactor. Right: Burst fracture SCI model with all the parts and with boundary conditions of the T5 fragment. Color image is available online.
The same boundary conditions were defined for the SPH fluids in both models. The no-slip condition was satisfied by connecting particles to the neighboring mesh nodes of the structures. This definition also helped ensuring SPH stability, as recently found in the work of Duckworth and coworkers. 39 Penalty contact with variable stiffness was also defined to prevent penetration into the mesh walls. To prevent the fluids from flowing through the top and bottom boundaries, caps were constructed there, having the same properties as the ligamentum flavum to absorb some of the CSF pressure wave caused by the impact. The initial gauge pressure of the CSF was set to 0, 20, or 50 mm Hg, to represent healthy conditions, IHH, or an extremely high pressure, respectively. Although the extreme pressure is physiological (Lundberg A wave 40 ), such a high pressure lasts for a very short time and it was mainly modeled to improve the observed correlations between the pressure and stress/strain results. The reference pressure was 5 mm Hg. Because the SPH pressure requires time from stabilization, the impacts were modeled 10 ms after the beginning of the solution, was was enough time to ensure stable pressure (see Supplementary Appendix SC). For clarity, all the presented times are the times passed since the impact and not since the beginning of the solution.
Results
The results are presented in the following sections for the two types of models. First, contusive SCI, modeled as an impactor hit to the dural canal, was examined with normal, high, and extreme CSF pressures. Then, burst fracture SCI was examined in the full model with the spinal column, with the three pressures, and with or without the epidural fat.
Dural canal only model: The effect CSF pressure on the mechanical response to contusive SCI
Figure 3 presents particle traces at the y-z cross-section of the spine in the high CSF pressure model, 1.2 msec after the impact. The deformation in y axis, the direction of the impactor's motion, is intentionally not presented in the bottom zoom-in panels for easier observation. The traces, indicated on the velocity profiles, show a fully developed flow with maximum velocity at the center of the section and similar velocity magnitudes in both lateral locations. It should be noticed that the dural sac and pia matter move, and that the CSF has the same velocity on the shared interfaces. Figure 4 compares traces of six particles through time under normal and high CSF pressures on x-y cross-section. In the high CSF pressure case, there was a small CSF motion prior to the impact, as can be seen in the top row, which describe the time of impact. As time passes, the cord becomes closer to the top of the dural sac (Δy decreases) and the dural canal becomes wider (Δx increases), causing the particles to stream into the wider region. As the impactor bounces back from the dural sac (t = 8 msec), particles tend to loop toward their initial positions in a vortical behavior.
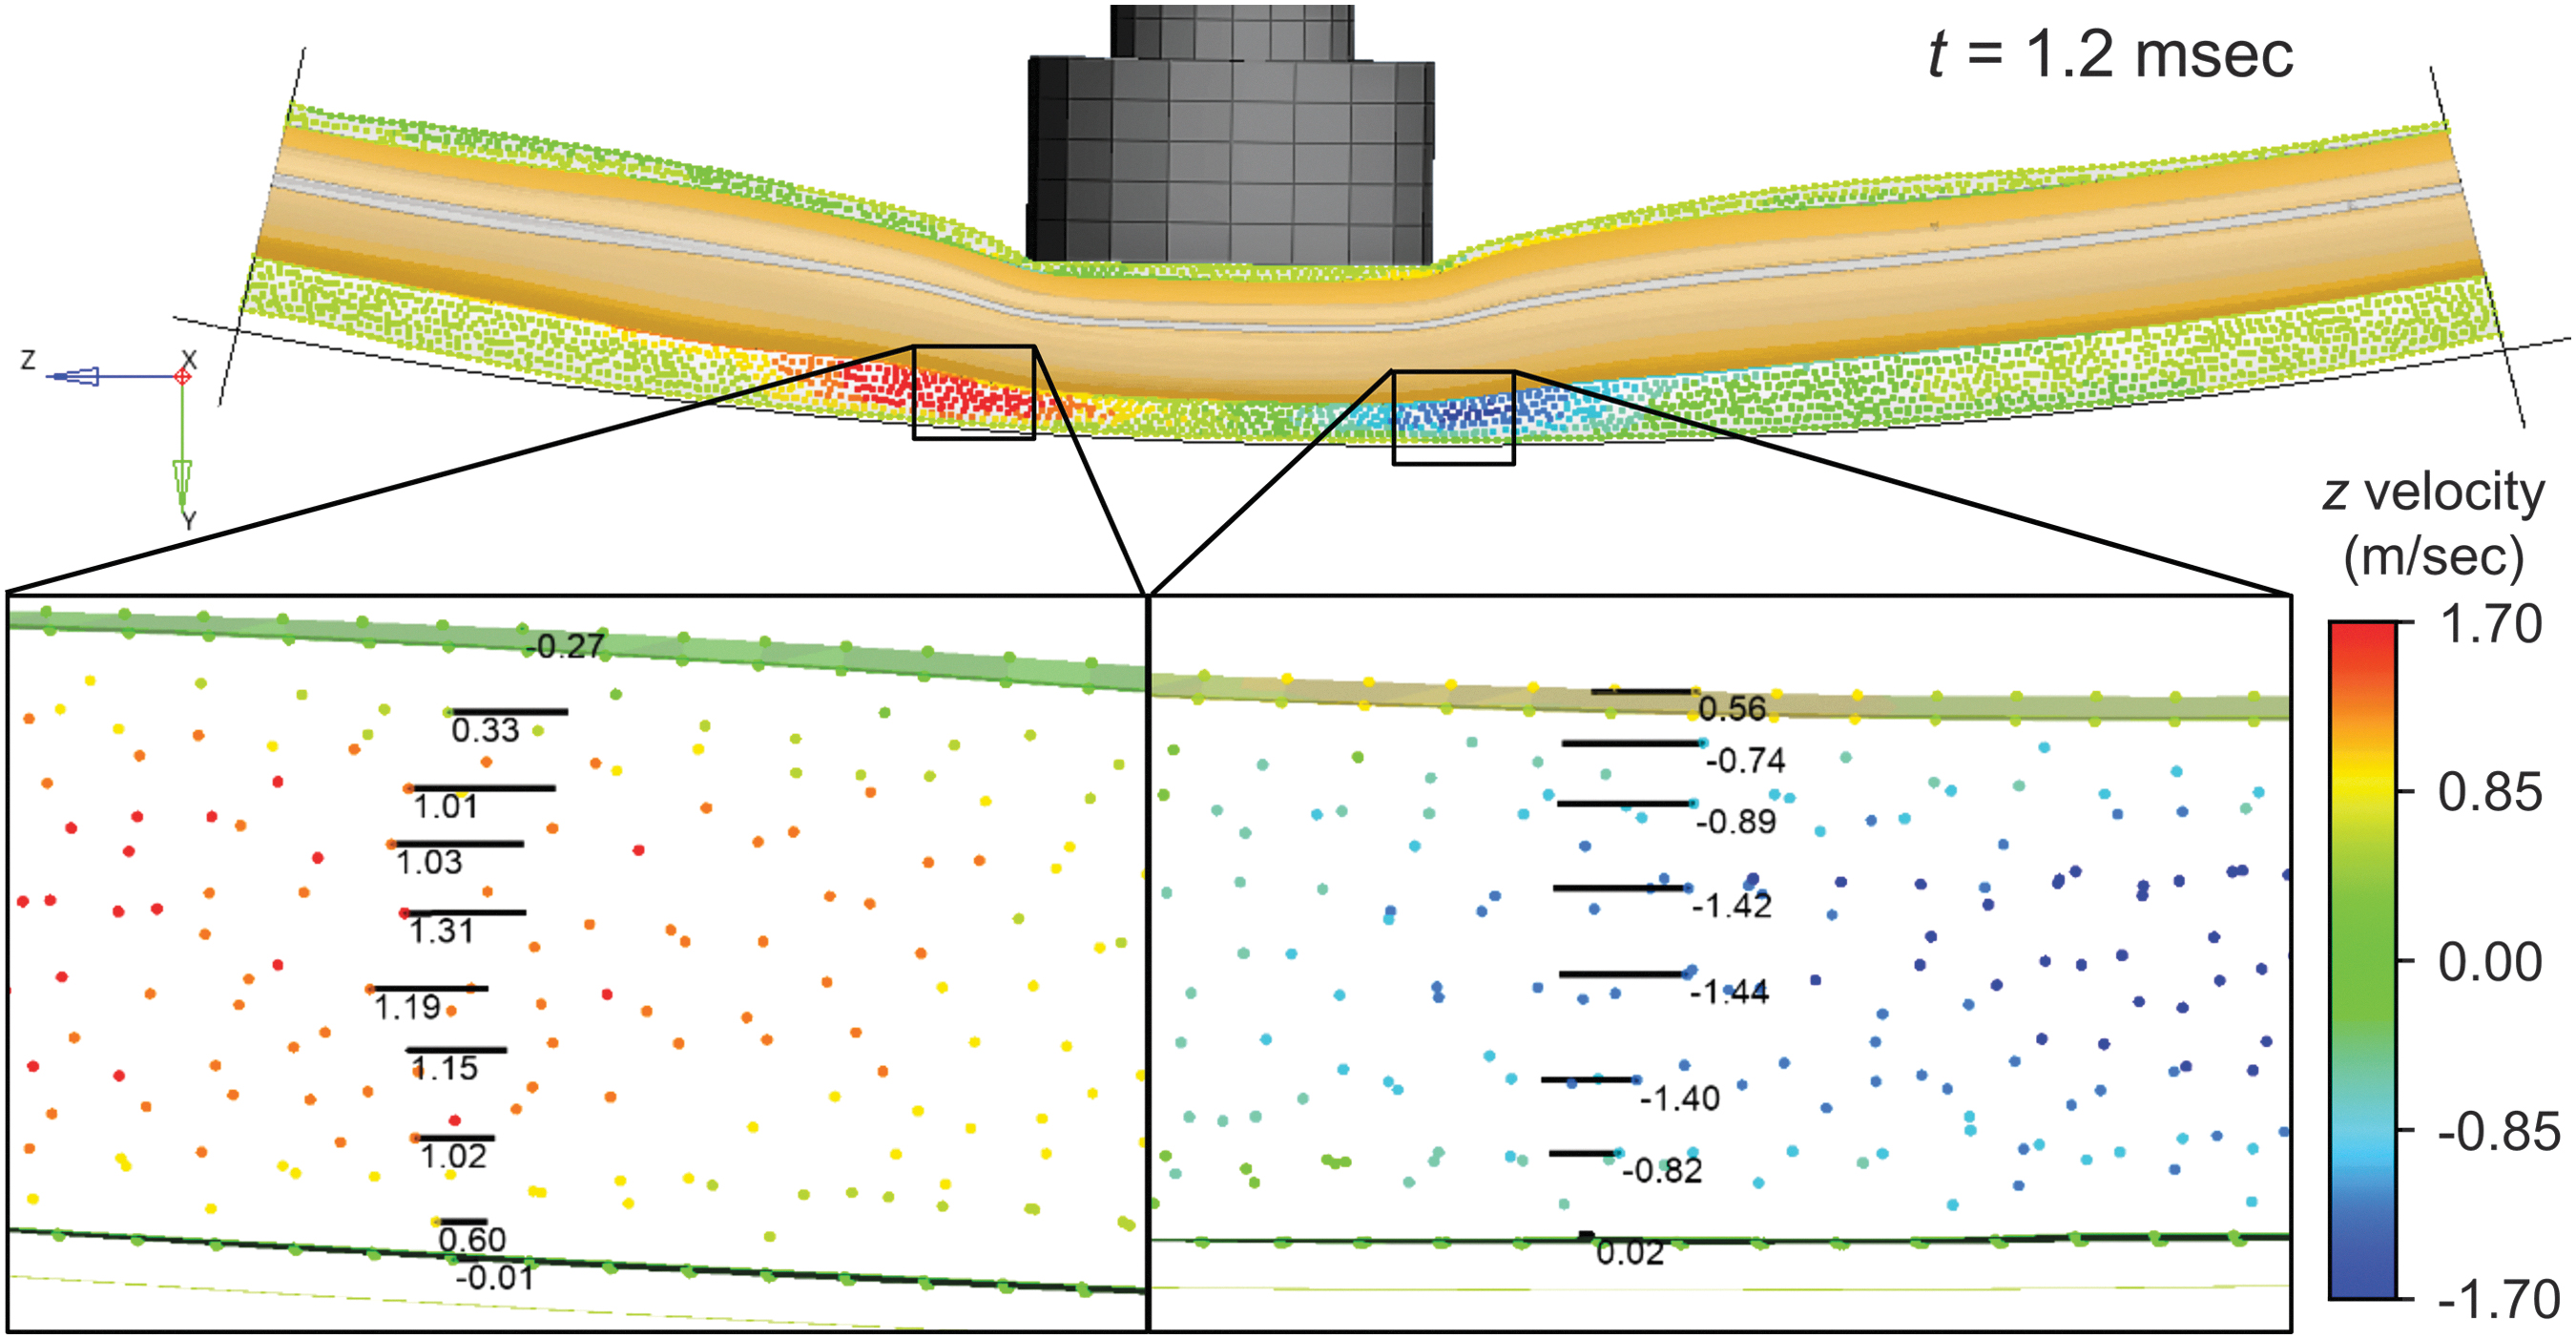
Particle behavior during contusive impact in the high cerebrospinal fluid (CSF) pressure model and at t = 1.2 msec. A side view section is presented with particle traces in the zoom-in panels (bottom) on both lateral sides of the impact location. The velocities are shown in m/sec. Color image is available online.
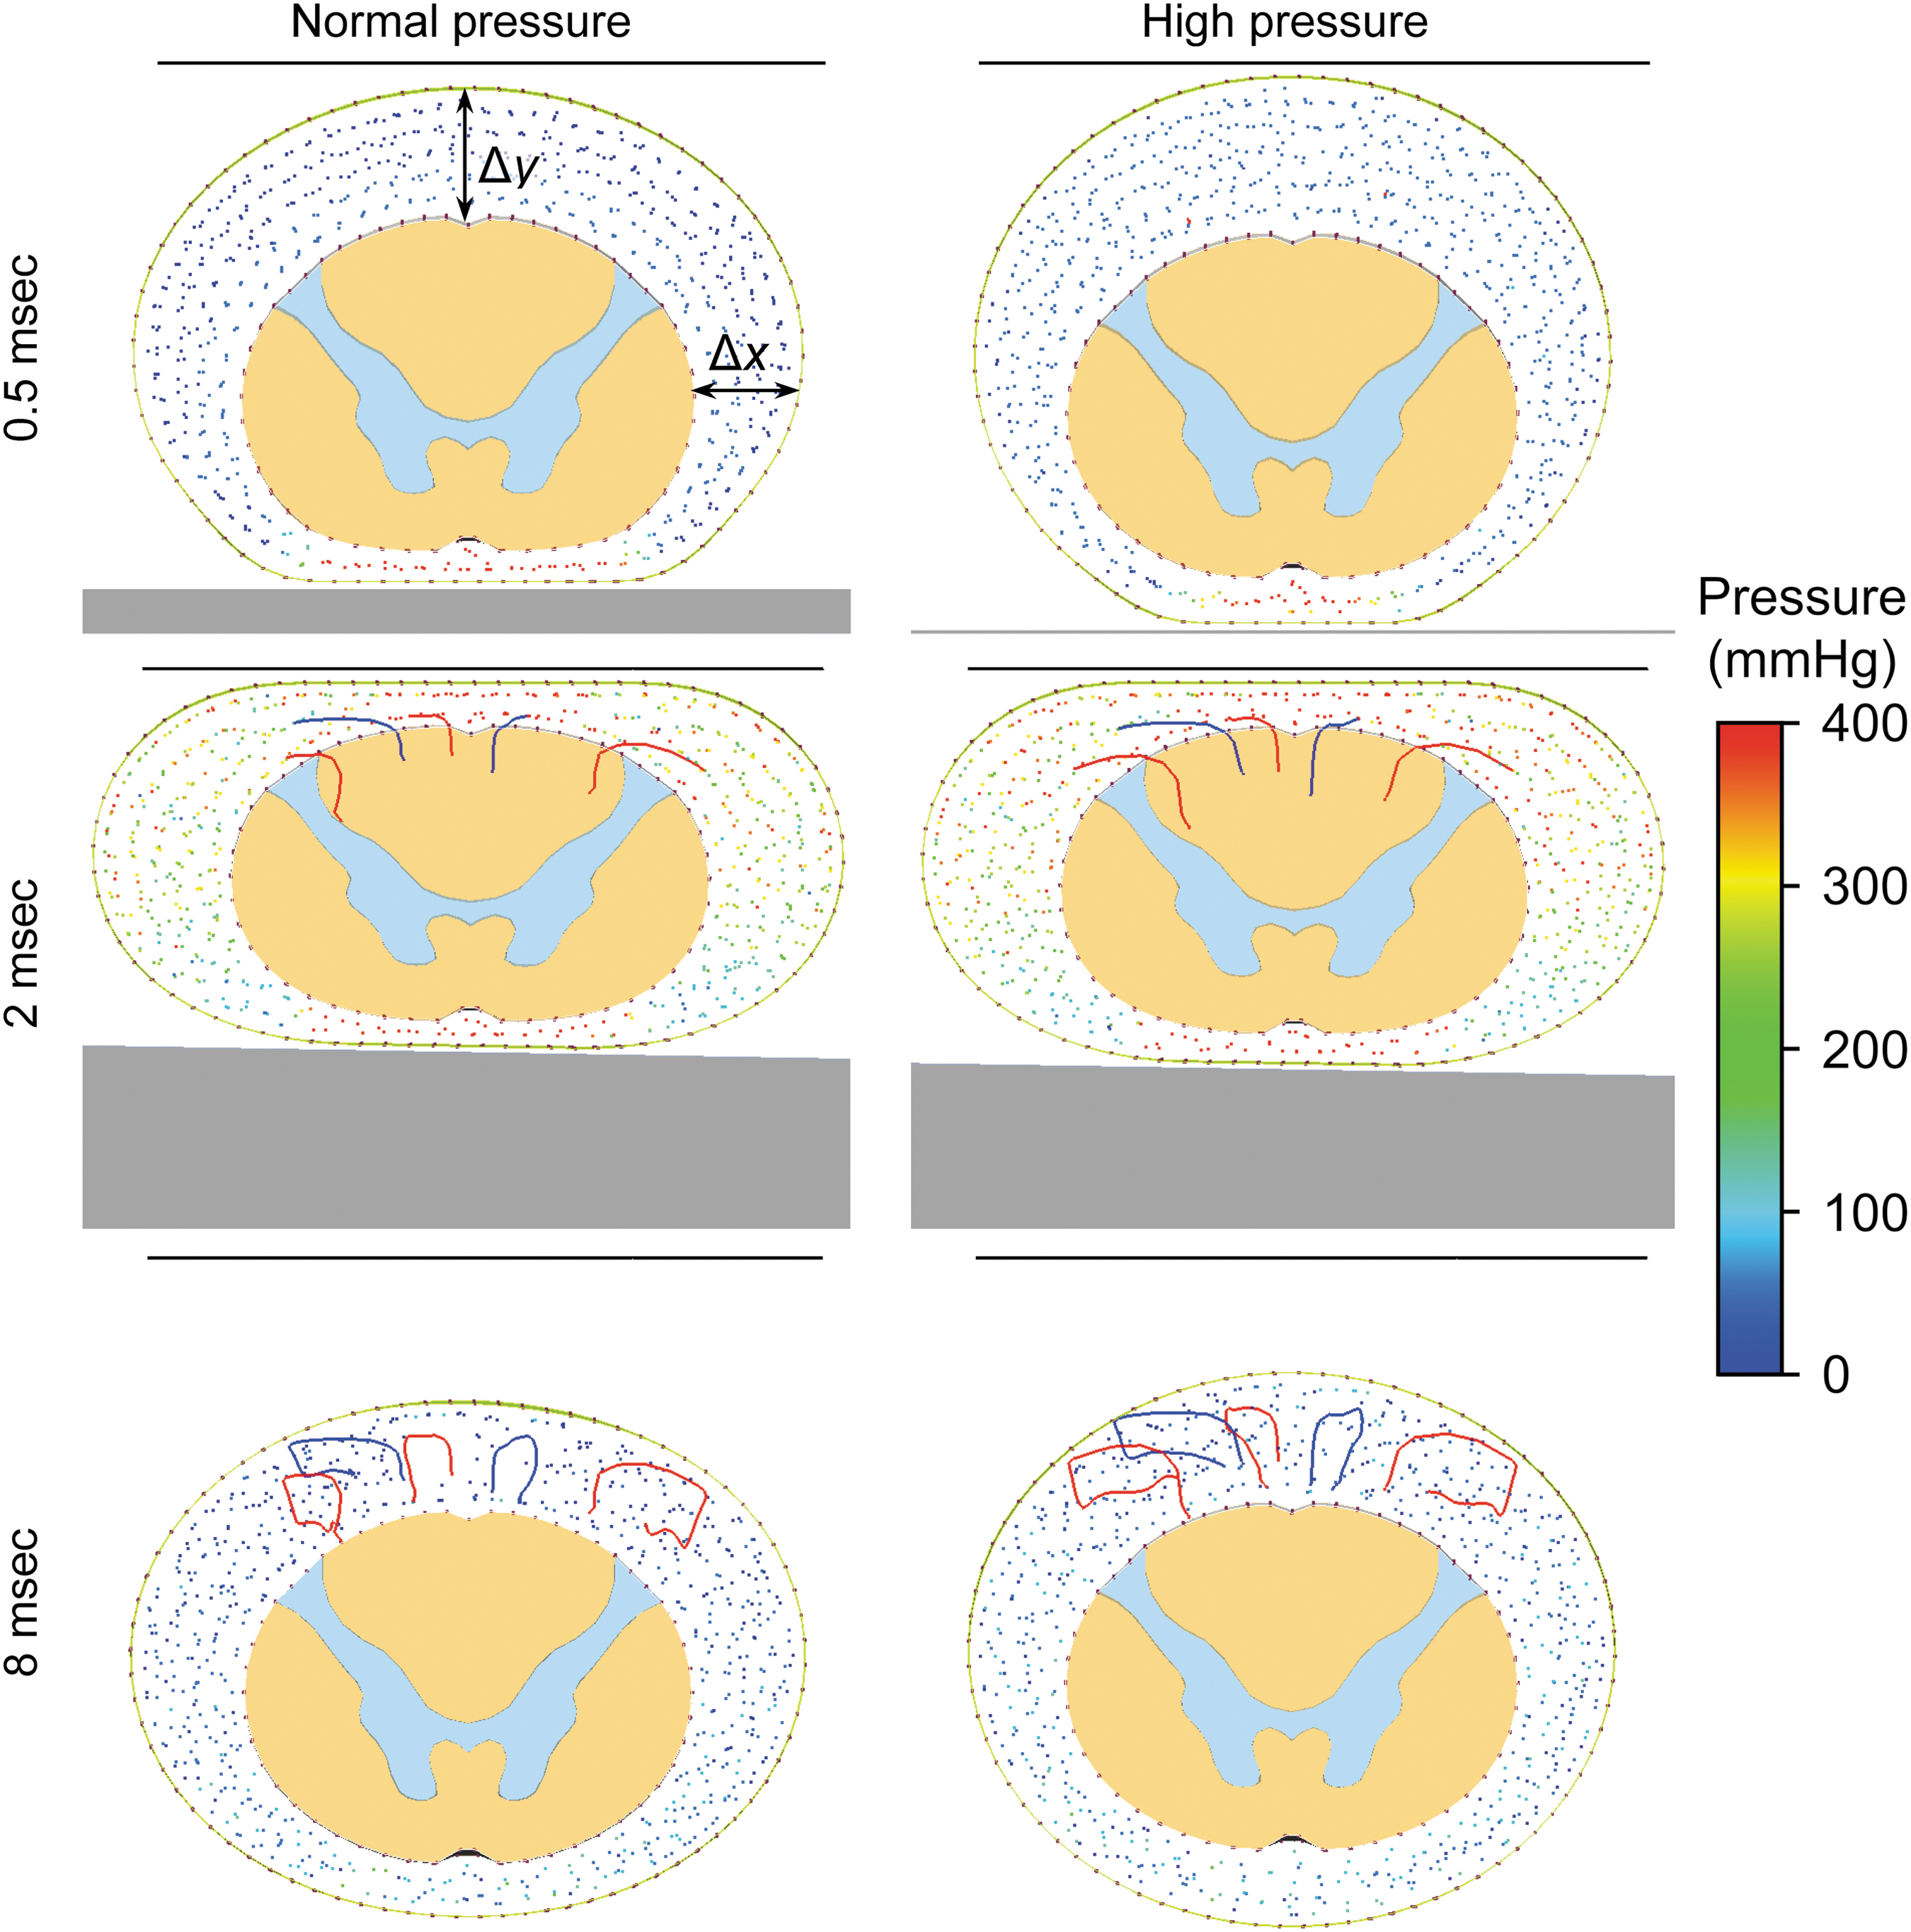
Particle behavior during contusive impact in the normal and high cerebrospinal fluid (CSF) pressure models. Trajectories of six particles are presented as traces through time on x-y cross-section. Color image is available online.
As can be seen from the initial state in Figure 4, the dural sac under high CSF pressure is rounder than with normal pressure. In the high CSF pressure case, the transverse dimension (horizontal width) is 5% smaller and the sagittal dimension (vertical height) is 7% larger. Further, the changes of these dimensions over time (Fig. 5, top) show that with high CSF pressure, the transverse and sagittal dimensions need to have larger normalized displacements in order to reach a shape similar to normal during maximum compression at t = 2 msec (also seen in Fig. 4). On the other hand, the dimensions of the cord are similar in both cases (Fig. 4), and the changes of these dimensions over time (Fig. 5, bottom) are also similar, but with slightly higher relative changes in the model of normal pressure. Figure 6 compares the strains and stresses in the cord on the plane of a T5 vertebra, which is the symmetry plane of the impactor, 0.6 msec after the impact. The maximum calculated von Mises stresses increased with the CSF pressure. The stresses in the gray and white matters increased by 14% and 13.5% in the high-pressure model and by 17.7% and 23.5% in the more extreme-pressure model, both with respect to the normal pressure. A similar trend was also observed in the calculated strains.
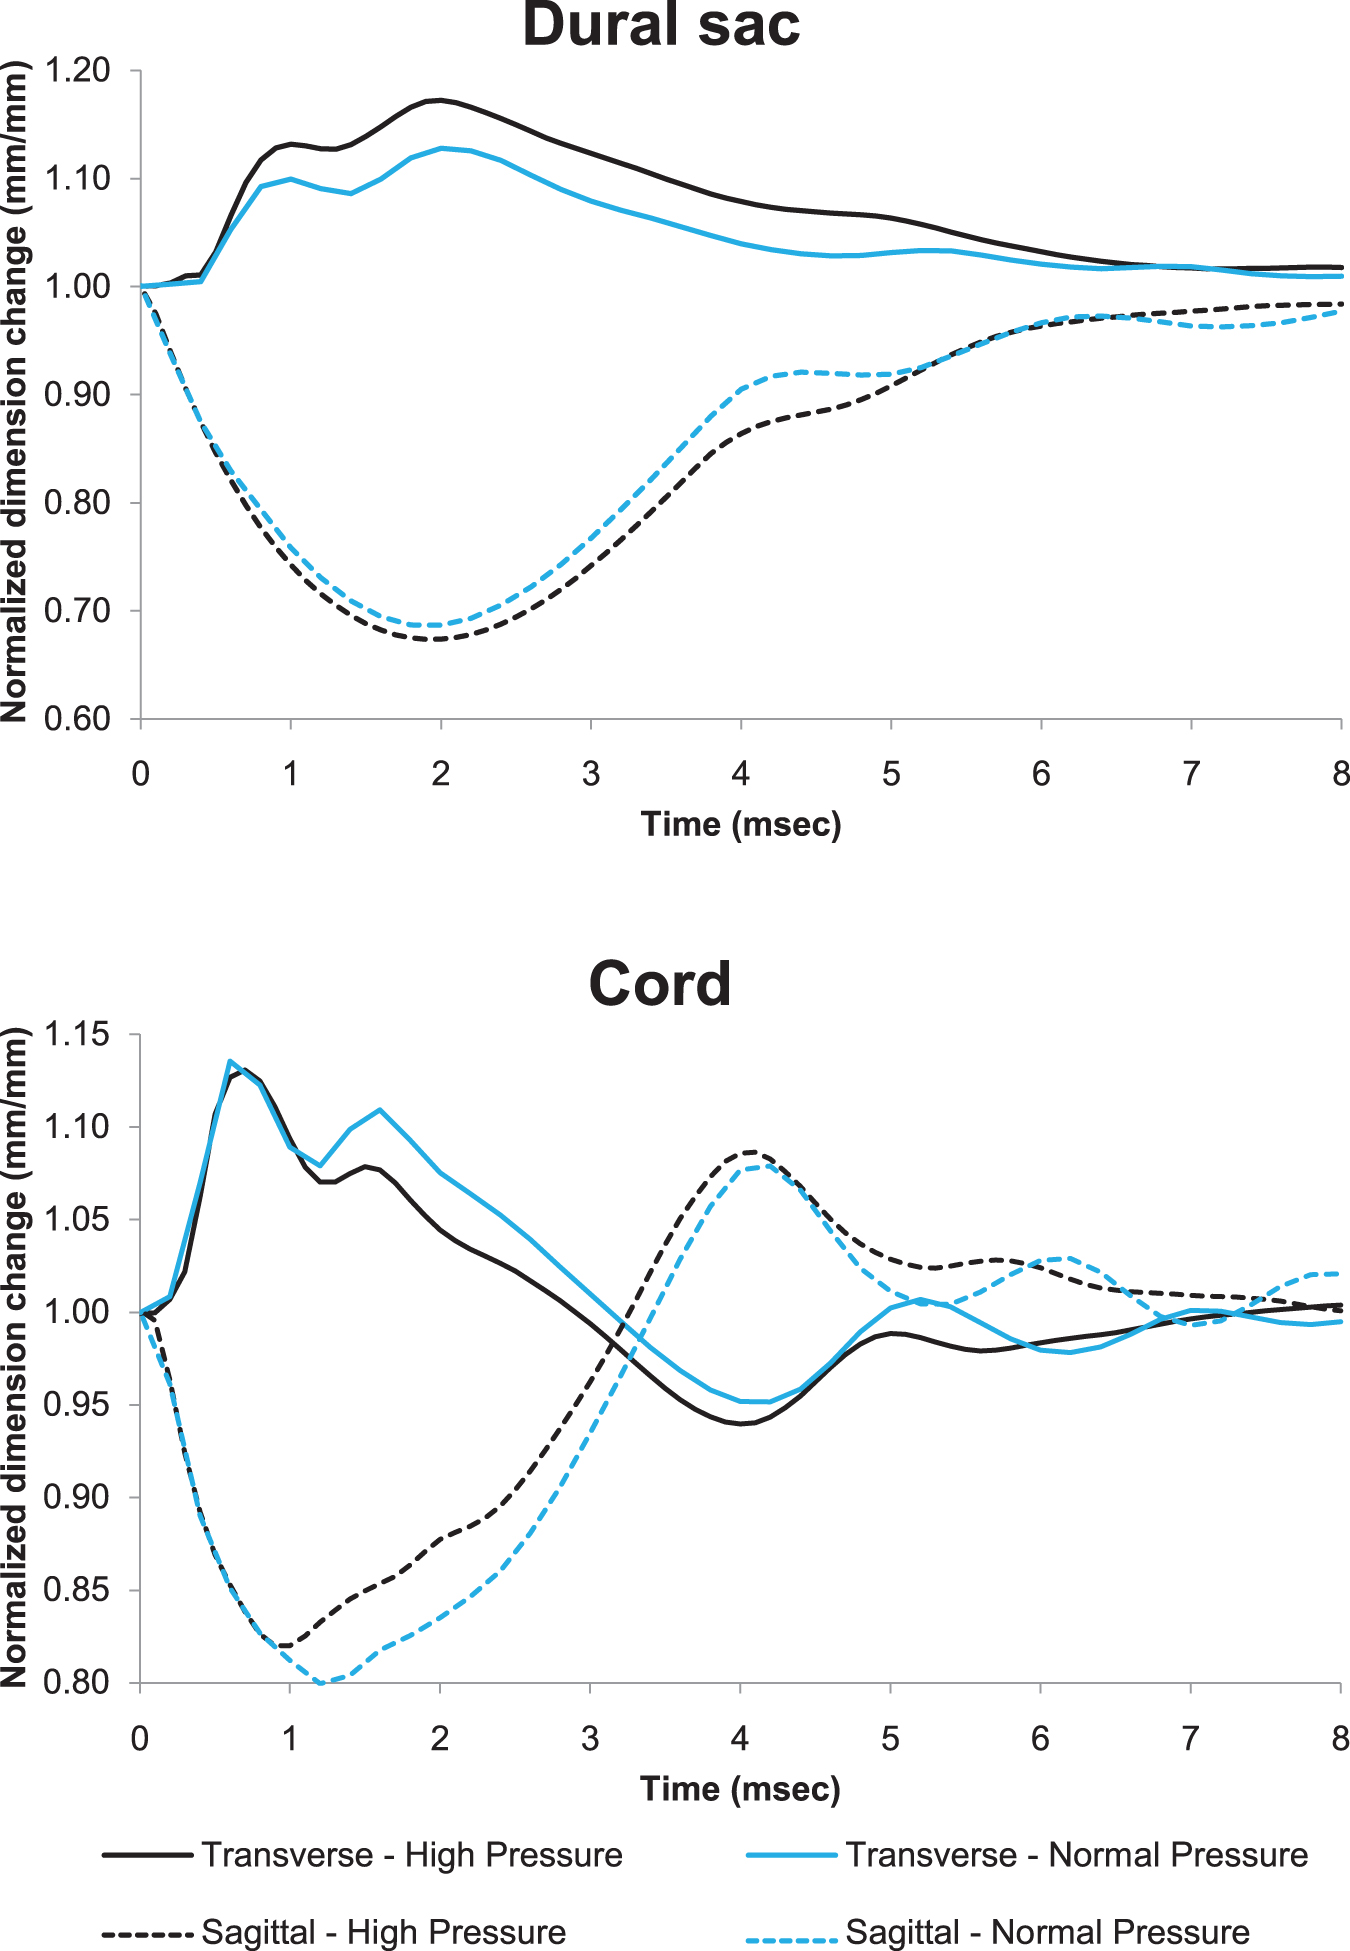
Normalized transverse and sagittal dimension changes in contusive impact models with normal and high cerebrospinal fluid (CSF) pressures. Color image is available online.

von Mises strain and stress distributions in the cord during contusive impact in the normal, high, and extreme cerebrospinal fluid (CSF) pressure models and at t = 0.6 msec (maximum deformation). Color image is available online.
Full model: The effect of CSF pressure and epidural fat on the mechanical response to burst fracture SCI
Figure 7 shows the stress distribution in the spinal cord and at several times for the normal pressure model of burst fracture. At time of t = 0.6 msec, the fragment decelerated to zero velocity and 0.4 msec later the stress in the cord reached its peak magnitude near the lower part of the T5 fragment. The stresses then propagated like a wave, away from the impact location, both upwards and downwards, and the magnitude in the impact location started to decline. At t = 2 msec, the stress wave traveled back to the impact location and the stresses there again reached the values found at t = 1 msec. A comparison among the normal, high, and extreme pressures with and without fat is presented in Figure 8 at a T5 cross-section plane. In the model with the fat, the epidural fat was maximally compressed by the fragment at t = 0.6 msec. Unlike the previous section, here, the maximum von Mises strain in the cord decreased with the increase of the CSF pressure, from 25.2% to 24% and 23.8% under normal, high, and extreme pressure, respectively.
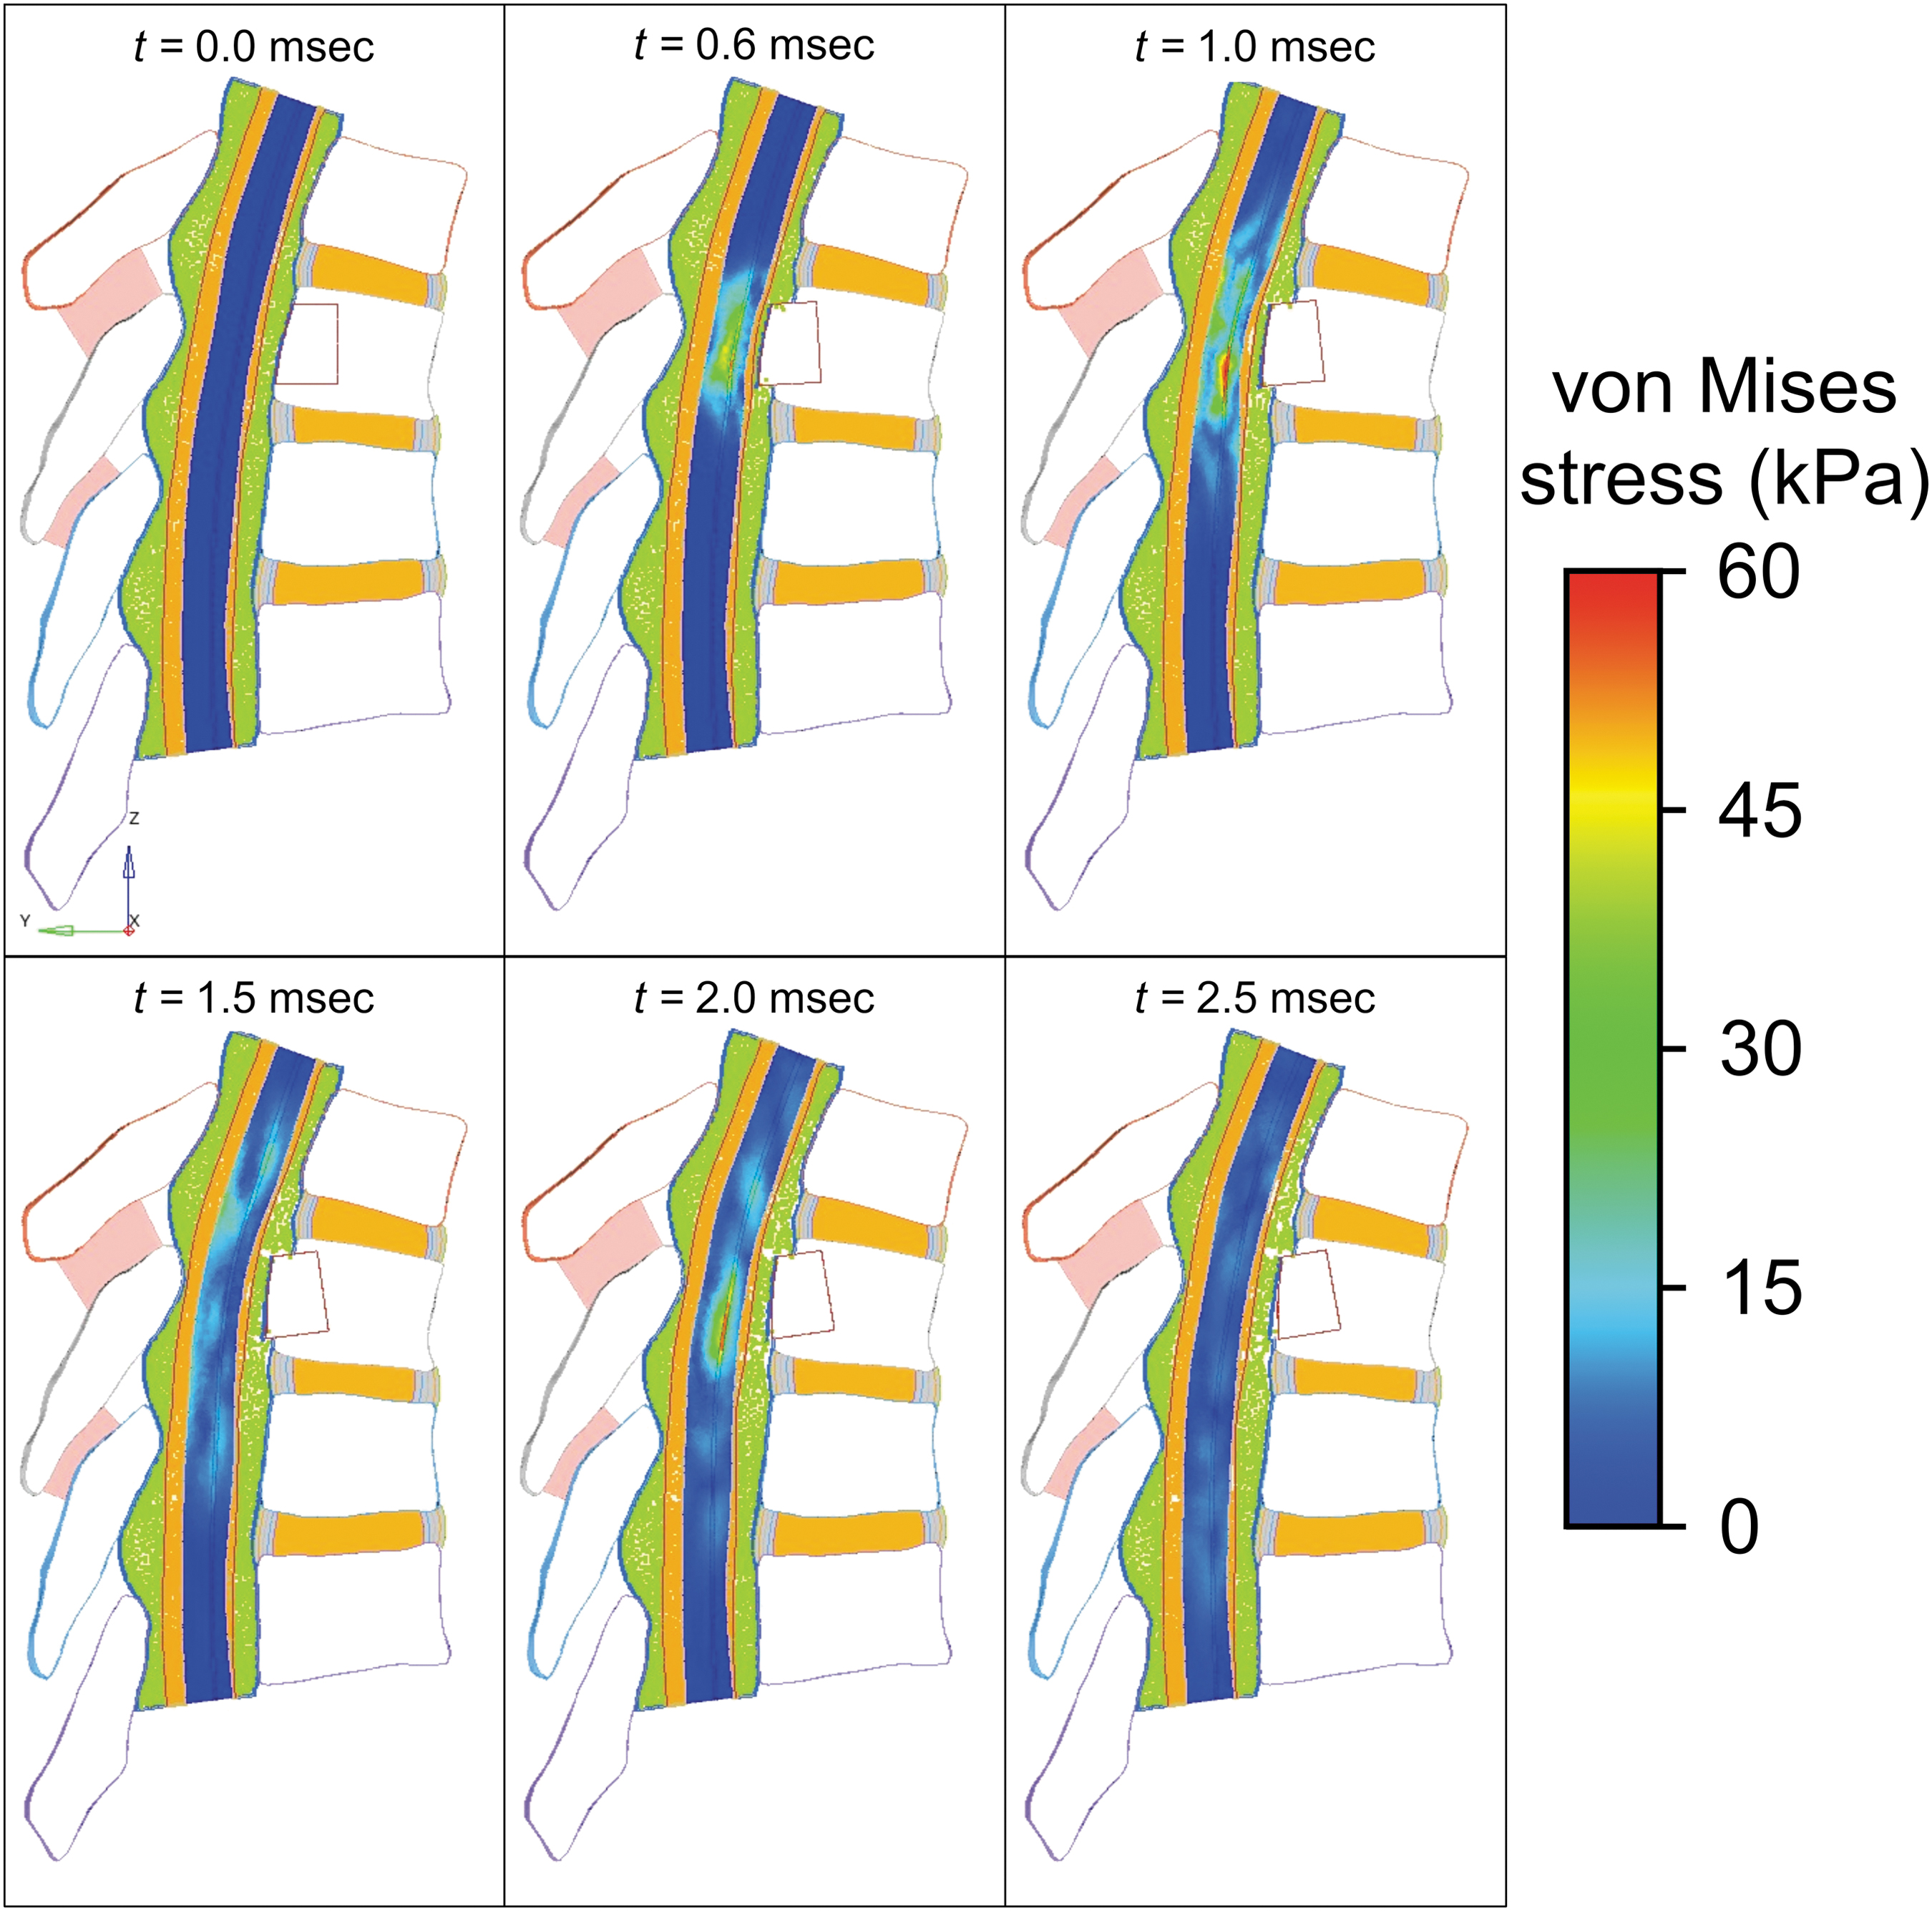
von Mises stress distribution in the spinal cord during burst fracture (T5 fragment) impact with normal cerebrospinal fluid (CSF) pressure. First 2.5 msec of the results. Color image is available online.
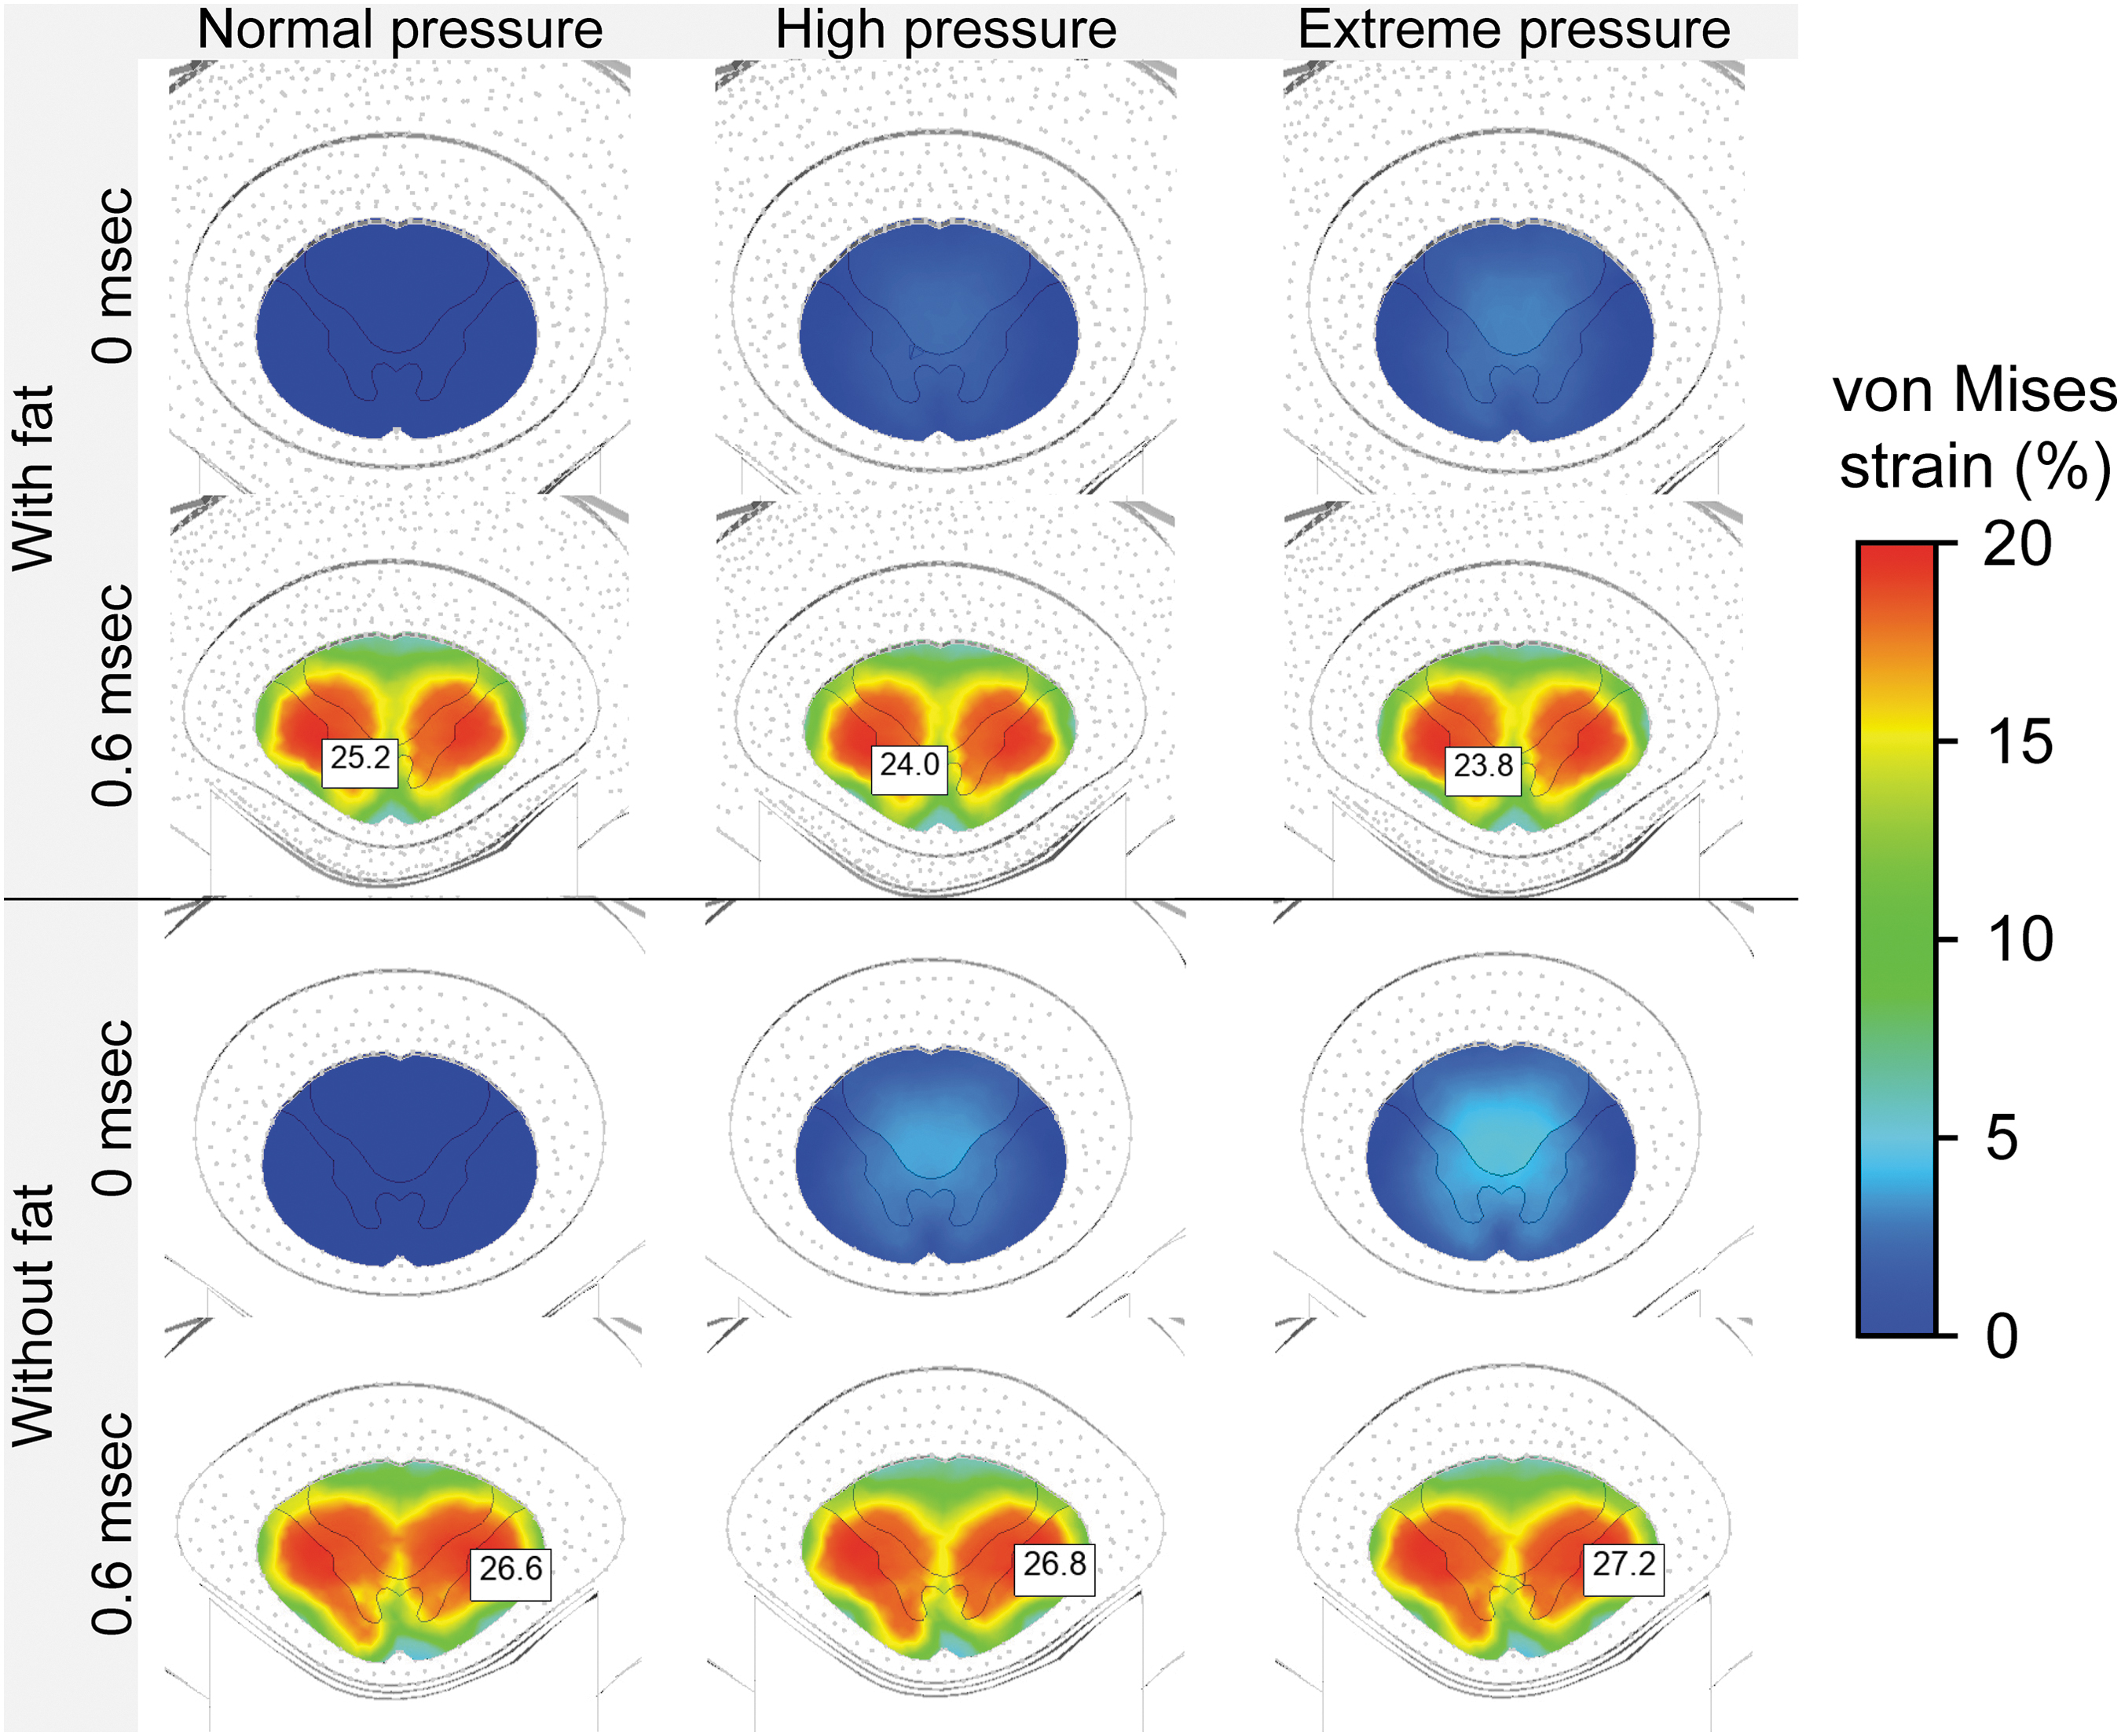
von Mises strain distributions in the spinal cord during burst fracture (T5 fragment) impact with normal (left), high (middle), and extreme (right) cerebrospinal fluid (CSF) pressures and with (top) or without (bottom) epidural fat. Color image is available online.
When simulating the burst fracture without the fat, the maximum strain increased with the pressure, from 26.6% to 26.8% and 27.2%, as in the previous section were there was no fat. The effect of the inclusion of the fat can also be seen from the kinetic energy of the fragment, as shown in Figure 9 for the case with normal pressure. Although both results started from the same energy (28 mJ), the fat absorbed more of the fragment's energy, dropping to 17 mJ compared with 22 mJ without fat. Afterwards, until t = 0.24 msec, the energy remained stable without the fat when the energy with the fat decreased. Still, both models reached minimum energy at a similar time after the impact.

Kinetic energy of the T5 fragment during burst fracture impact with and without epidural fat and with normal cerebrospinal fluid.
Discussion
This study presented numerical models of SCI where the CSF was modeled by SPH. We compared three simplified models of contusive SCI with varying CSF pressure and six more elaborated models of burst fracture, with three CSF pressures and with or without epidural fat. Therefore, we studied two effects that have not been studied before: the effect of pathological elevated pressure, and the effect of epidural fat inclusion in numerical models. The models were validated with previous studies (Supplementary Appendices SB and SC) to ensure that that novel pressure alteration was physical.
The dural canal only model of contusive SCI, represented by an impactor hit, was simplified by ignoring the vertebral column. The SPH particle dynamics showed that under both normal and high CSF pressure the particle paths formed vortical loops (Fig. 4). Although the behaviors are similar, the loops in the high-pressure case are more closed. This difference is not related to the time passed since the impact, because the particles were already stagnant. For example, in the 7.5 ≤ t ≤ 8 msec period they traveled only one sixth of the distance relative to 6 ≤ t ≤ 6.5 msec. These flow patterns are related to the changes in the shape of the dural sac and the cord over time (Fig. 5). For example, the transverse dimension of the dural sac increased by 17.8% with IIH compared with only 12.9% with normal CSF pressure. The sagittal dimensions narrowed by 34% and 31%, respectively. Therefore, the high-pressure case slightly exceeded the 33.5% value that is correlated with higher risk of neurological deficit. 41 These changes, together with the minor differences in the cord's dimensions, directly affected the CSF mass conservation, specially, particles flew from the narrower regions to those that were getting expanded. The stress and strain increased with the CSF pressure (Fig. 6). The maximum strains in all three cases exceeded the axonal strain of 34% which indicates a 90% probability of injury. 42 Thus, the increased strains in the higher pressure cases further support the higher risk of neurological deficit. The maximum stress values are concentrated in the center of the cord, with higher values in the gray matter than in the white matter.
The full model of burst fracture SCI clearly demonstrated that epidural fat, which was not included in previous SCI biomechanical models, seems essential for the calculation of strains in the cord (Fig. 8). In the models without fat, the same trend from the simpler dural canal model was observed and the strains in the cord increased with the CSF pressure (Fig. 8). However, the opposite trend was found when the fat was included in the model, indicating that the fat counteracts the effect of elevated CSF pressure itself. These findings emphasize that it is essential to account for the surrounding epidural fat in order to calculate the strains and stresses in the cord during SCI. Additionally, the energy absorption capabilities of the fat were demonstrated by the reduced fragment's kinetic energy for the entire time (Fig. 9). Because the energy in the model without the fat remains stable for a longer time (0.02 < t < 0.24 msec), it also decreases faster afterwards, demonstrating that in this case the energy absorption is less efficient.
Although we presented SCI models with details that were not accounted for before, there are still several limitations that should be mentioned. Although mesh refinement was checked for the FEA, it was not possible to rigorously check the SPH particle distribution because it is greatly related to the kernel approximation. Still, our validations (Supplementary Appendices SB and SC) indicate that the results of our models are physically sound. Therefore, we can trust the trends found from our comparisons among models with similar particle distributions. Additionally, because momentum conservation is not stable in SPH – it is coupled with the pressure, and we had to use caps to prevent flow out of the boundaries – we focused only on the pressure near the impact. Still, stability in the tension of the SPH particles was verified in Supplementary Appendix SA.2. The models did not include denticulate ligaments, nerve roots, and epidural blood vessels because previous studies suggested that they have limited significance in the thoracic region. 43 The fat's geometry was created by FEA to fill the epidural space and was not based on scans. Although it is the first time such representation is used for mechanical models, it is based on previous FEA models of neurostimulation. 22,23 Although it was established that spinal cord properties depend on the loading rate, 21,44 because it was a comparable study, we simplified our model and used the common hyperelastic behavior. 5,15,16,24,45 Finally, the model is not patient specific and is not intended for quantitative predictions of spinal cord damage, but the presented parametric comparison should indicate the correct trends of the effects of elevated CSF pressure or the presence of fat. In our future studies, we plan to improve the models by simulating patient-specific cases and employing visco-hyperelastic behavior.
Conclusions
In summary, the comparison of three CSF pressures demonstrated that SCI in patients with IHH and in regions where insufficient epidural fat exists, might lead to higher spinal cord stresses; therefore, the injury might aggravate by preexisting conditions. Yet, in regions with enough fat, the fat can absorb energy and counteract the effect of the elevated pressure. Therefore, it is important to account for the fat in future numerical models of SCI.
Footnotes
Funding Information
The authors received no funding.
Author Disclosure Statement
No competing financial interests exist.
Supplementary Material
Supplementary Appendix SA
Supplementary Appendix SB
Supplementary Appendix SC
References
Supplementary Material
Please find the following supplemental material available below.
For Open Access articles published under a Creative Commons License, all supplemental material carries the same license as the article it is associated with.
For non-Open Access articles published, all supplemental material carries a non-exclusive license, and permission requests for re-use of supplemental material or any part of supplemental material shall be sent directly to the copyright owner as specified in the copyright notice associated with the article.
