




Abstract
We investigated the topology of structural brain connectivity networks and its association with outcome after mild traumatic brain injury, a major cause of permanent disability. Eighty-five patients with mild traumatic brain injury underwent magnetic resonance imaging (MRI) twice, about three weeks and eight months after injury, and 30 age-matched orthopedic trauma control subjects were scanned. Outcome was assessed with Extended Glasgow Outcome Scale on average eight months after injury. We performed constrained spherical deconvolution-based probabilistic streamlines tractography on diffusion MRI data and parcellated cortical and subcortical gray matter into 84 regions based on T1-weighted data to reconstruct structural brain connectivity networks weighted by the number of streamlines. Graph theoretical methods were employed to measure network properties in both patients and controls, and correlations between these properties and outcome were calculated. We found no global differences in the network properties between patients with mild traumatic brain injury and orthopedic control subjects at either stage. We found significantly increased betweenness centrality of the right pars opercularis in the chronic stage compared with control subjects, however. Further, both global and local network properties correlated significantly with outcome. Higher normalized global efficiency, degree, and strength as well as lower small-worldness were associated with better outcome. Correlations between the outcome and the local network properties were the most prominent in the left putamen and the left postcentral gyrus. Our results indicate that both global and local network properties provide valuable information about the outcome already in the acute/subacute stage and, therefore, are promising biomarkers for prognostic purposes in mild traumatic brain injury.
Introduction
Traumatic brain injury (TBI) refers to brain injury caused by an external force that alter brain structure or function. 1 Patients who have TBI often face cognitive impairments—for instance, attention or memory deficits. 2 The mechanisms of these alterations and impairments are still not adequately known, however. Almost 90% of TBIs are considered to be mild (mTBI), and it leads to the highest number of permanent disability among all patients with TBI. 2
Diffuse axonal injury (DAI) is the principal pathophysiological mechanism in patients with mild TBI and is often not detected with conventional computed tomography (CT) or magnetic resonance imaging (MRI). 3 Diffusion MRI (dMRI) is an advanced imaging technique that can detect DAI with higher sensitivity. 4 Most commonly, dMRI data are analyzed by using diffusion tensor imaging (DTI). 5 More advanced techniques, however, such as constrained spherical deconvolution (CSD), 6 allow more reliable reconstruction of white matter pathways of the brain in vivo. 7,8 The DTI-based methods have been used in a number of studies to investigate white matter structural pathology at acute/subacute and chronic stages of TBI. 9 –11
Diffusion MRI can be used to investigate structural connectivity networks of the brain. 12 These networks can be reconstructed based on probabilistic streamlines tractography 6,7 performed on dMRI data and gray matter parcellation 13 performed on T1-weighted MRI data. Graph theoretical analysis can then be performed to investigate global and local properties of these networks. 12 Graph theoretical analyses of structural brain networks are reproducible 14 and have been used successfully in studying various brain diseases. 15 –17
Because of the inconsistent findings regarding microstructural white matter alterations in mTBI, 18,19 studying the structural brain connectivity network could improve the detection of white matter connectivity alterations after mTBI, in contrast to microstructural metrics, 20 but so far, insufficient data preclude better understanding of TBI on structural brain connectivity at connectome level. 21 Recent studies in children and adults have shown that the structural connectivity network is altered after TBI, 20 –24 and efforts have been made to identify DAI using brain network disruptions. 25
A recent meta-analysis mostly in moderate-to-severe TBI showed an increased characteristic path length, indicating decreased integration of the structural brain connectivity networks in TBI. 26 Methods used were different from ours, however; many of the previous structural brain connectivity studies in mTBI were performed with tensor-based tractography, and in only one of them was CSD used. 20
In the present study, we investigated structural brain connectivity networks by using graph theoretical methods at the acute/subacute and chronic stages of mTBI compared with patients with orthopedic injuries without TBI. In addition, the association between the graph theoretical properties and outcome measured with the Glasgow Outcome Scale-Extended (GOSE) was investigated. Based on previous studies mostly in moderate-to-severe TBI, 26 we expected to find decreased integration of the networks and/or a significant relationship with outcome.
Methods
Participants
Eighty-five patients with mTBI (age 47 ± 20 years) and 30 age-matched (age 50 ± 20 years) orthopedic injury controls were recruited and underwent MRI scanning between December 2011 and April 2014 at the Turku University Hospital, Finland, as part of the Evidence-based Diagnostic and Treatment Planning Solution for Traumatic Brain Injuries (TBIcare) project funded by the European Union. A more detailed description of the study population has been published previously. 27
All patients were treated according to the local protocols based on existing international guidelines and recommendations. 28 Patients with mTBI underwent head MRI scanning during the acute/subacute stage at about three weeks and again in the chronic stage at about eight months after the injury (Table 1). One subject from each stage and one control subject had to be removed from further analyses because of acquisition artifacts that severely affected the registration between the T1-weighted and dMRI data.
Cohort Demographics
Acute/subacute: patients underwent head magnetic resonance imaging (MRI) in the acute/subacute phase; Chronic: patients underwent head MRI in the chronic phase; Controls: control patients with orthopedic injuries without traumatic brain injury (TBI); Admission Glasgow Coma Scale (GCS), worst GCS score between the scene of accident to hospital (range: 3–15); Admission GCS motor score, worst motor component score of GCS score between the scene of accident to hospital (range 1–6); Isolated TBI, patients with TBI without extracranial injuries; computed tomography (CT)-negative, patients without traumatic intracranial injuries on admission head CT; CT-positive, patients with traumatic intracranial injuries on admission head CT; Admitted, admitted to the hospital because of TBI; Discharged, discharged from the hospital after evaluation and follow-up because of TBI from the emergency department; Time to MRI, days from injury to head MRI; GOSE, Glasgow Outcome Scale-Extended. SD, standard deviation.
Patients who underwent acute/subacute phase head MRI are included in the chronic phase group. The p values are from Student t test with comparisons of means from *acute phase patients and controls and **chronic phase patients and controls.
Altogether, 39 patients had visible CT abnormalities. Of those, 10 had severe disability as an outcome, four had acute subdural hematoma, three had contusion, and six had MRI findings suggesting diffuse axonal injury. Because the number of control subjects was significantly lower than the number of patients with mTBI, we chose to use a single scan from the 30 control subjects, although 21 of them were scanned twice. We based our decision on these three facts: there were no scanner upgrades performed during the study, timing of the first scans overlaps both with subacute/acute and chronic scans of the patients, and the test-retest reproducibility of the methods used was excellent. 14 To confirm that the previous results were valid also for our suboptimal acquisition protocol, we performed a small test-retest reproducibility study in this sample.
The Ethical committee of the Hospital district of Southwest Finland approved this study (decision 68/180/2011), and written consents were obtained from participants according to the World Medical Association's Declaration of Helsinki.
Procedure
Patients with a clinical diagnosis of TBI with the Glasgow Coma Scale (GCS) scores between 13 and 15 were included in this study. The GCS scores were assessed at the scene of the accident and at the emergency department of Turku University Hospital. Lowest recorded GCS score was used to classify the patients. Other inclusion criteria were as follows: age ≥18 years, and a clinical indication for acute head CT according to National Institute for Health and Care Excellence (NICE) criteria.
Exclusion criteria were: blast-induced or penetrating injury, chronic subdural hematoma, inability to live independently because of pre-existing brain disease, TBI or suspected TBI not needing head CT, more than two weeks from the injury, not speaking native language, and no consent obtained. Extracranial orthopedic injuries were permitted in the mTBI patient group. The control group consisted of patients with acute orthopedic non-trivial trauma without any signs of an acute alteration in brain function, previous central nervous system disease, or a history of previous non-concussional TBI.
Patient outcome was assessed by the same experienced neurologist at the time of the later MRI scan (on average, 8.3 months post-injury) using the GOSE. 29 The 36-Item Short Form Health Survey (SF-36) was used to evaluate the overall health, including mental aspects. 30 We used Fazekas grading, 31 an indicator of small vessel disease in the brain, to account for white matter hyperintensities. The patients were classified based on their Marshall scores into CT-positive (Marshall score >1) and CT-negative (Marshall score = 1) groups. 32
Data acquisition
The MRI data were obtained from all subjects with a Siemens Magnetom Trio 3T scanner (Siemens Healthcare, Erlangen, Germany). The diffusion-weighted (DW)-MRI data were acquired using spin-echo echo-planar imaging with a repetition time of 11.7 sec, an echo time of 106 msec, a field of view of 192 × 192 mm, a voxel size of 2 × 2 × 2 mm, and a b-value of 1000 sec/mm2 applied in 64 directions. One non-DW image was acquired. The T1-weighted images were acquired using magnetization-prepared rapid acquisition with gradient echo with an echo time of 2.98 msec, a flip angle of 9 degrees, and a voxel size of 1 × 1 × 1 mm.
Image processing
The DW-MRI data were pre-processed by denoising 33 the raw data and subsequently correcting for bias field, 34 subject motion, 35 and eddy current induced distortions 36 by using MRtrix37 and Functional Magnetic Resonance Imaging of the Brain Software Library (FSL) 37 version 5.0.11. Average motion between volumes was calculated for each acquisition and subject, and no outlier slices were detected. 36 Finally, DW data were non-linearly registered to T1-weighted data to account for echo planar imaging distortions. 38
We estimated fiber orientation distributions with CSD by using up to sixth order spherical harmonics and performed probabilistic streamline tractography in MRtrix3. 6,7 Anatomically constrained tractography was used to generate 10 million anatomically feasible streamlines by seeding from the gray matter-white matter interface. 39
Cortical parcellation of the T1-weighted images was performed in FreeSurfer 13 by using the Desikan-Killiany atlas 40 combined with the subcortical structures from FSL's FIRST. 41 This resulted in a total of 84 gray matter areas forming the nodes of the structural brain connectivity network. Finally, the reconstructed streamlines were assigned to the respective gray matter areas based on their end-points resulting in an 84 × 84 connectivity matrix weighted by the number of streamlines, as shown in Figure 1.
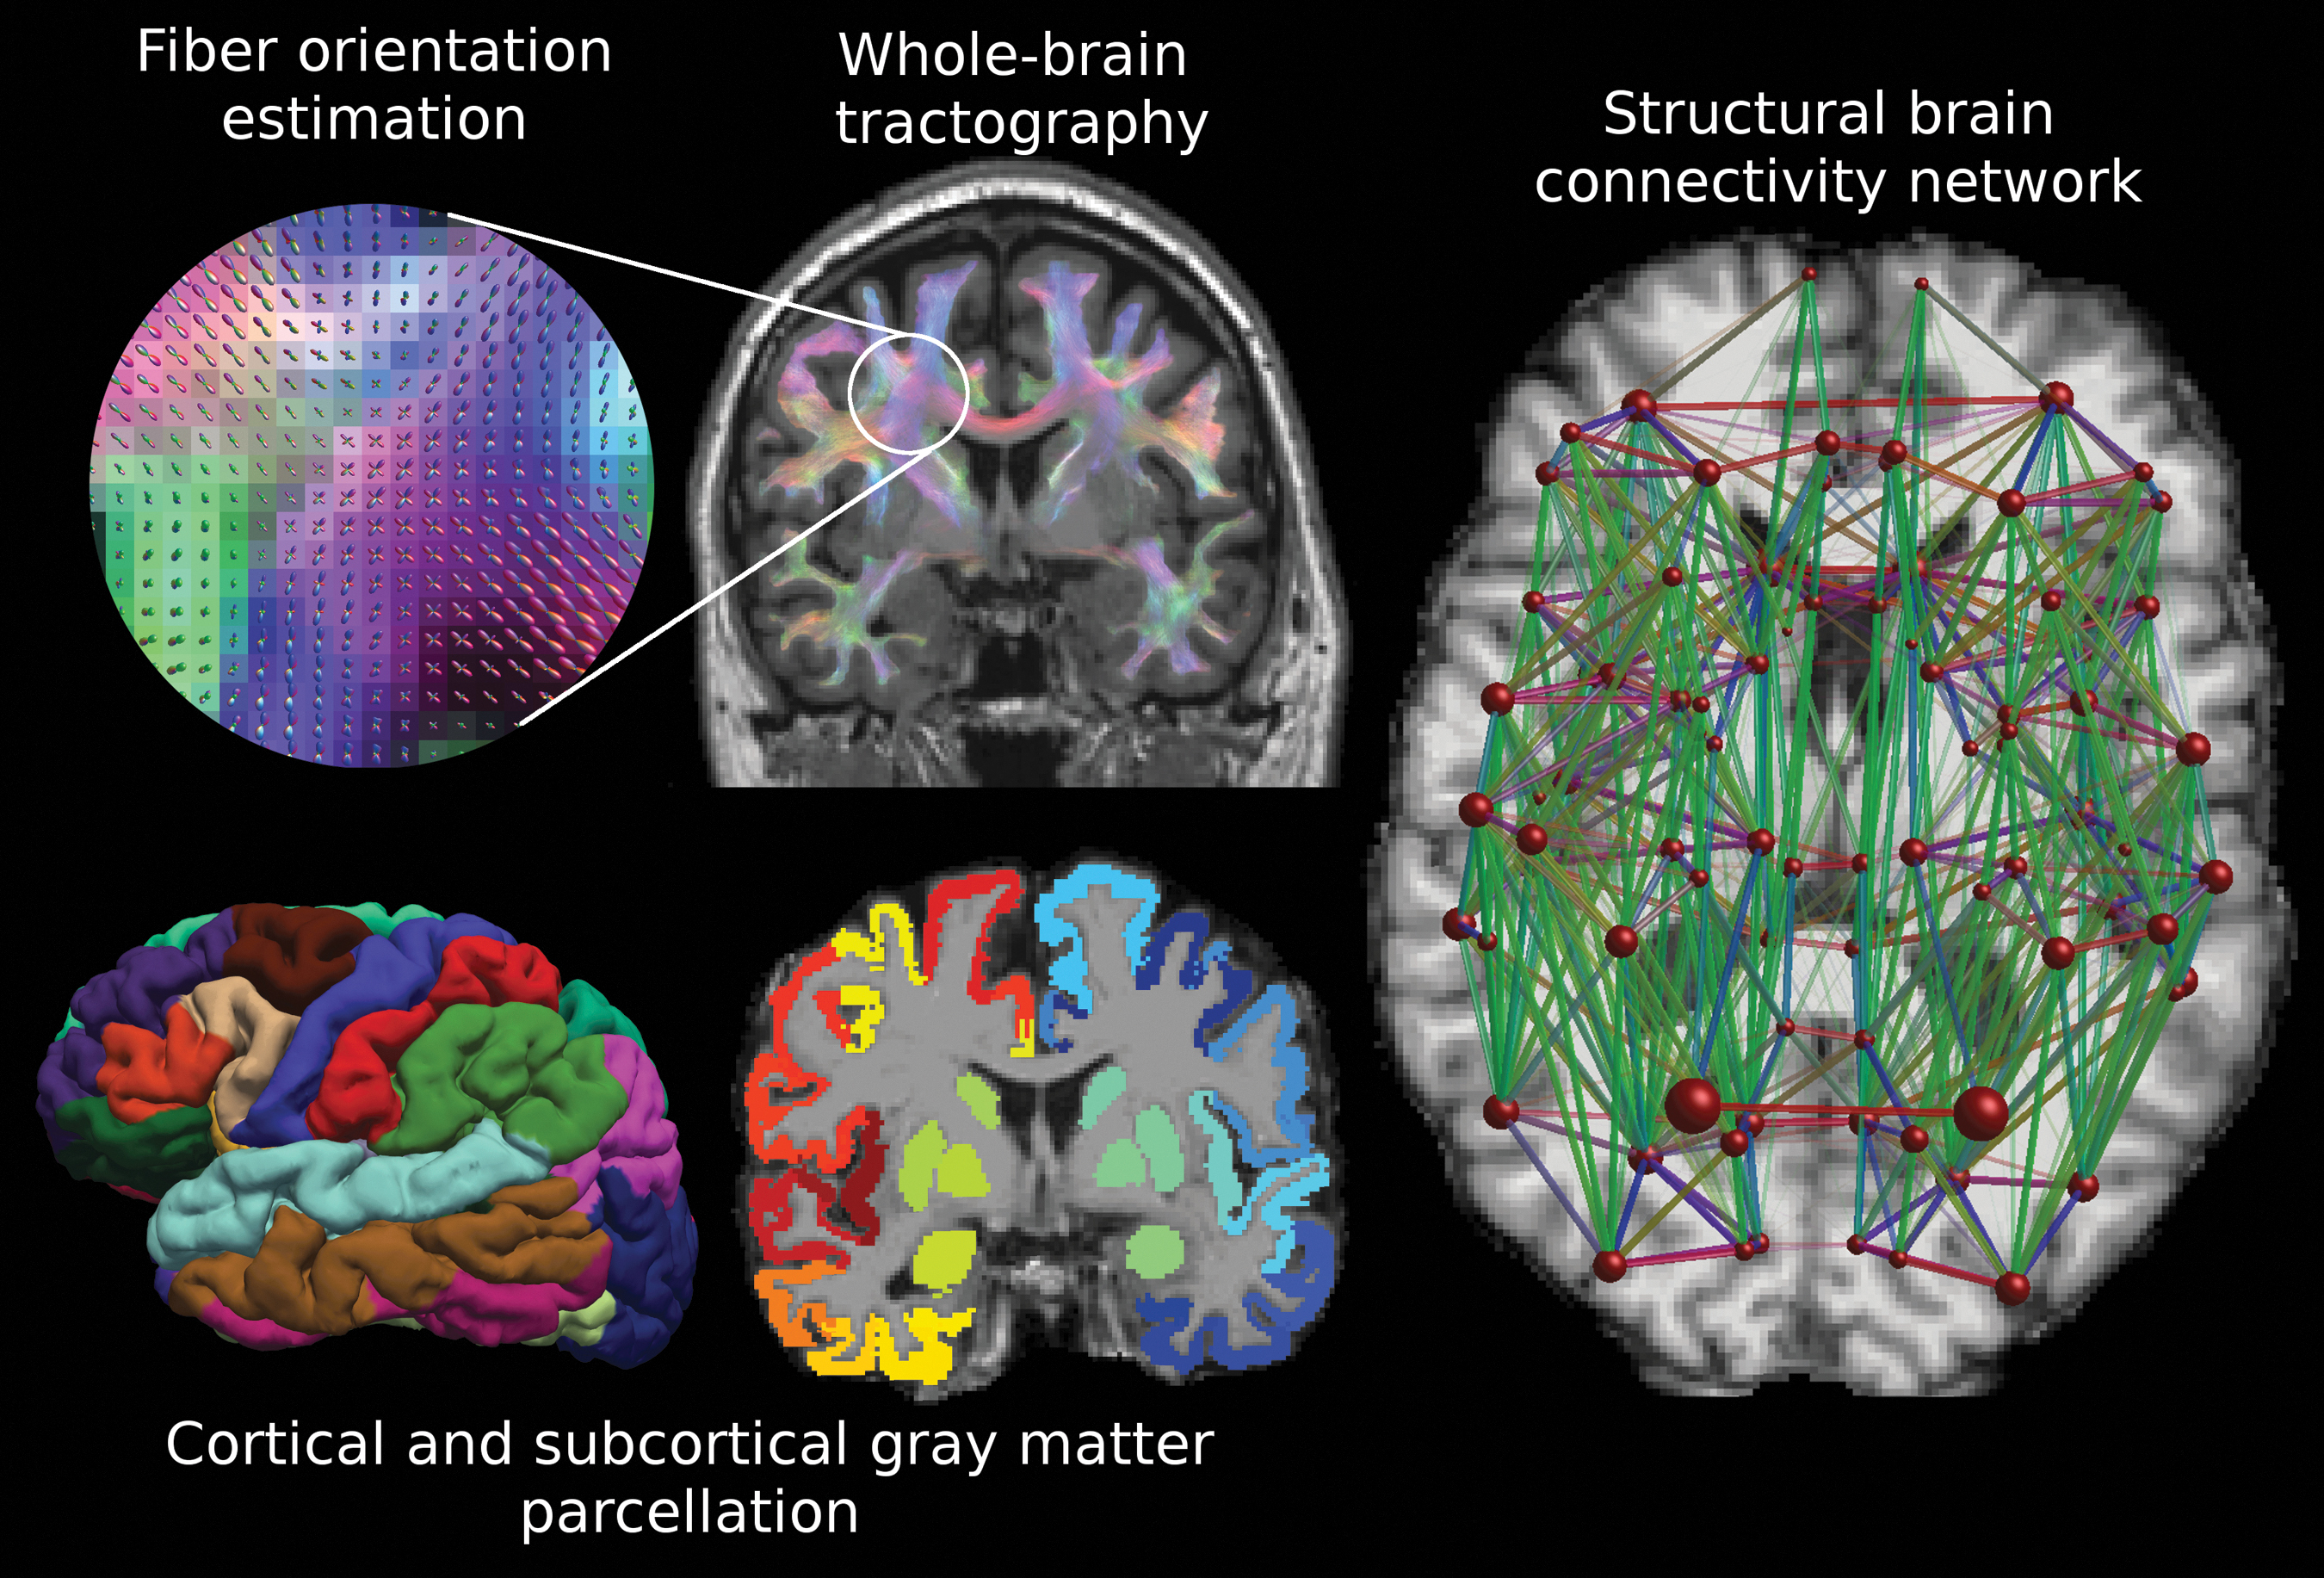
Reconstruction of the structural brain networks. First, the fiber orientation distributions are estimated with, for instance, constrained spherical deconvolution, and whole-brain probabilistic streamlines tractography is performed. Cortical and subcortical gray matter parcellation is performed on the T1-weighted data. The 84 gray matter areas become the nodes in the structural brain connectivity network, and the edges are weighted based on the number of streamlines connecting a pair of nodes. The size of the nodes corresponds to the volume of the gray matter area and the size of the edges corresponds to the number of streamlines. The colors of the whole-brain tractography and the network edges correspond to the directionally encoded color convention (green: anterior-posterior, red: right-left, blue: superior-inferior). Color image is available online.
Graph theoretical analysis
The structural brain connectivity networks were investigated by using graph theoretical analysis with the Brain Connectivity Toolbox 42 and customized Matlab (Mathworks Inc., Natick MA) scripts. We investigated seven global network properties: average betweenness centrality, normalized clustering coefficient, normalized global efficiency, normalized characteristic path length, small-worldness, average degree, and average strength; and three local network properties: betweenness centrality, local efficiency, and node strength.
The network properties were selected based on previous studies 14,26 to build a complete view into the network topology, including integration, segregation, and centrality properties. 12 These properties are explained in more detail in Table 2. We chose not to threshold the networks weighted by the number of streamlines, because Civier and coworkers 43 showed recently no beneficial effect of thresholding. Normalization of the network metrics, however, was performed by generating 100 randomized networks for each subject in our data with equal weight, degree, and strength distributions. 44 Then, the graph theoretical properties were divided with the corresponding average properties calculated from the randomized networks.
Because network density has been suggested to play a significant role in graph theoretical analyses, 45 we investigated whether there would be differences in the density of the networks despite the fact that we generated the same number of streamlines for each subject. The brain connectivity networks were visualized with BrainNet Viewer. 46
Statistical analyses
Statistical analyses were performed in SPSS (version 27, SPSS IBM, New York, NY). Generalized linear models were used to analyze the differences between patients and controls, and a p value below 0.05 was considered to be statistically significant. Partial Pearson correlation coefficients between the seven global and three local network properties and GOSE were calculated. Bonferroni correction for multiple comparisons was used to account for the family-wise error rate (FWE) with N = 7 for the global and N = 84 for the local network properties, resulting in the following FWE-corrected significance thresholds:
Sensitivity analyses
We performed several sensitivity analyses to test the robustness of our results to various sample and imaging factors. These analyses included the use of CT-positivity, average movement between volumes, and time after injury as additional covariates. In addition, we divided the patients with mTBI into two groups based on their outcome (GOSE 7 or 8 and GOSE <7) and their CT findings (CT-positive and CT-negative patients) and analyzed the differences between these groups and compared with control subjects.
Post hoc analyses
As a post hoc analysis, after reviewing the local group differences, we decided to investigate the Pearson correlation coefficient between the mental health of the subjects assessed with SF-36 and the local betweenness centrality of a single region, shown previously to be linked to mental health.
Results
Reproducibility of the graph theoretical analyses
Reproducibility of the global network metrics was excellent (intraclass correlation coefficient [ICC] = 0.96–0.98) for the normalized clustering coefficient, normalized global efficiency, degree, and strength, whereas for betweenness centrality, normalized characteristic path length, and small-worldness, it was slightly inferior (ICC = 0.84–0.93) (Supplementary Fig. S1).
Changes in the global and local network properties
No differences in global network measures were found between patients with mTBI and control subjects at either acute/subacute or chronic stages (Supplementary Fig. S2). In addition, after using the CT-positivity as a covariate or by analyzing separately the CT-positive and CT-negative groups, we did not find any group differences compared with orthopedic control subjects.
Changes were found, however, in local network properties between patients with mTBI at both acute/subacute and chronic stages compared with control subjects (Fig. 2 and Supplementary Table S1). We found alterations in betweenness centrality, local efficiency, and strength in several nodes of the brain networks (see Supplementary Table S1). Only an increased betweenness centrality at the right pars opercularis in the chronic stage remained significant, however, after Bonferroni correction for multiple comparisons (marked in red in Fig. 2; see also Supplementary Fig. S3) (p = 0.00045). This difference remained significant also when using CT-positivity (p = 0.000032) or average movement between volumes as a covariate (p = 0.00044) and when analyzing separately the CT-negative patients and control subjects (p = 0.000026). There was no difference, however, when comparing the CT-positive patients with control subjects (p > 0.05).

Significant local group differences (in red) between patients with mild traumatic brain injury (mTBI) and control subjects and partial correlations with outcome (in yellow) in the structural brain connectivity networks (corrected for family-wise error rate). Age, gender, and Fazekas grade were used as covariates. Betweenness centrality of the right pars opercularis was significantly increased in the chronic stage of mTBI compared with orthopedic control subjects. In the acute/subacute stage, strength of the left putamen correlated positively and betweenness centrality of the left postcentral cortex negatively with outcome. In the chronic stage, strength and local efficiency of the left putamen and strength of the left nucleus accumbens and the left parahippocampal cortex correlated positively with outcome. All p values are presented in Supplementary Table S1. Color image is available online.
In addition, we investigated whether the observed difference could be explained by mental health, because the pars opercularis has been associated previously with major depressive disorder. 47 In our sample, however, the betweenness centrality of right pars opercularis was not correlated with mental health assessed with SF-36 (p > 0.05, covarying for age and gender). We also found significantly decreased strength of the left caudal middle frontal gyrus (p = 0.00056) in the chronic stage, but this was only significant when using CT-positivity as a covariate (in addition to age, gender, and Fazekas). There were no significant differences in the density of the networks (see Supplementary Table S2).
Relationship of the global network properties and outcome
We observed that many of the global network properties significantly correlated with the outcome of the patients, measured with GOSE (see Fig. 3 and Table 3). Normalized global efficiency showed a significant positive correlation in both acute/subacute and chronic stages (p < 0.007, FWE-corrected). In addition, a positive correlation between average node strength and outcome and a negative correlation between small-worldness and outcome was observed in the chronic stage (p < 0.007, FWE-corrected). All these correlations remained significant when CT-positivity (Supplementary Table S3A) or average movement between volumes and time after injury were used as covariates (Supplementary Table S3B). In addition, the results remained similar when studying only the CT-positive subjects but did not reach statistical significance in the CT-negative subjects.

Relationship between the global graph theoretical properties and the outcome after mild traumatic brain injury. The partial correlation coefficients and p values after using age, gender, and Fazekas grade as covariates are reported in Table 3. Blue points and regression lines correspond to acute/subacute stage while red points and regression lines correspond to the chronic stage. The shaded area describes the 95% confidence interval for the regression lines. Note that these scatter plots are for visualization only, because they do not take the covariates into account. Color image is available online.
Partial Correlation of Outcome and the Global Network Properties in the Acute/Subacute and Chronic Stages after Mild Traumatic Brain Injury
Outcome was measured with the Glasgow Outcome Scale-Extended (GOSE). The partial correlation coefficients and the corresponding p values are included. Age, gender, and Fazekas grade were used as covariates. Significant p values after Bonferroni correction for multiple comparisons are marked in bold.
Moreover, in the sensitivity analyses performed by grouping the subjects based on GOSE, we found that the normalized global efficiency was decreased (p < 0.007, FWE-corrected) and small-worldness was increased (p < 0.007, FWE-corrected) in patients with mTBI with GOSE <7 compared with GOSE 7 and 8 (Supplementary Fig. S4). There were no significant differences in the network density between the subjects with GOSE 7-8 and GOSE <7.
Relationship of the local network properties and outcome
Significant correlations were found between local network properties and outcome measured with GOSE. Higher local efficiency and strength were associated with better outcome in the left putamen in acute/subacute stage of mTBI (local efficiency: r = 0.39, p = 0.00045; strength: r = 0.48, p = 0.000011) and in the chronic stage (strength: r = 0.40, p = 0.000267). In addition, in the chronic stage, higher strength of the node was associated with better outcome in the left accumbens area (r = 0.40, p = 0.00029) and the left parahippocampal cortex (r = 0.40, p = 0.00023). Moreover, lower betweenness centrality of the left postcentral cortex was associated with better outcome in the acute/subacute stage (r = -0.40, p = 0.00027). The nodes with significant partial correlations between the local network properties and outcome are marked in yellow in Figure 2 and their correlations with outcome are illustrated in Figure 4 (see also Supplementary Table S4).

Scatter plots for the statistically significant local partial correlations with outcome. Age, gender, and Fazekas grade were used as covariates. Blue points and regression lines correspond to the acute/subacute stage while red points and regression lines correspond to the chronic stage. The shaded area visualizes the 95% confidence interval for the regression line. Note, that these scatter plots are for visualization only, because they do not take the covariates into account. Color image is available online.
When using CT-positivity as a covariate, higher local efficiency and strength remained significantly associated with better outcome in the left putamen in the acute/subacute stage of mTBI (local efficiency: r = 0.39, p = 0.0005; strength: r = 0.46, p = 0.00003). In addition, the correlations with the betweenness centrality of the left postcentral gyrus in the acute/subacute stage (r = -0.41, p = 0.0001) and with the left parahippocampal cortex in the chronic stage (r = 0.38, p = 0.0005) remained significant after using CT-positivity as a covariate (Supplementary Table S5). In the CT-negative group, the betweenness centrality of the left postcentral cortex was associated with better outcome in the acute/subacute stage (r = -0.57, p = 0.000046). Other local partial correlations, however, did not reach statistical significance in the CT-negative or CT-positive groups alone.
The correlations of the strength of the left putamen and left parahippocampal cortex and betweenness centrality of the left postcentral cortex remained significant (p < 0.000595, FWE-corrected) when using average movement between volumes and time after injury as covariates (in addition to age and gender).
Group-level analyses based on GOSE showed that the betweenness centrality of the left postcentral cortex was decreased and the strength of the left putamen and left entorhinal cortex was increased in patients with better outcome (p < 0.000595, FWE-corrected) in the acute/subacute stage.
Discussion
Our findings indicate that graph theoretical properties of structural brain connectivity networks in mTBI are not globally altered. This lack of global differences is in line with previous results in structural 20 and functional brain networks. 48
Global and local network properties, however, were significantly associated with patient outcome both at acute/subacute and chronic stages. Increased integration and strength and decreased small-worldness of the networks were related to better outcome. The negative association between small-worldness and outcome might indicate the network to be excessively small-world in subjects with worse outcome. In addition, several local network properties correlated significantly with outcome at both stages. The results of the correlation analyses were confirmed by dividing the patients with mTBI into two groups based on their outcome and performing group-level statistical analyses between these groups. Our findings were not explained by possible differences in network density, 45 because we reconstructed the same number of streamlines for all subjects.
Moreover, local differences in the network measures between patients with mTBI and orthopedic control subjects were observed most prominently in the right pars opercularis at the chronic stage of mTBI. The right pars opercularis, a region that is part of the right homologue of Broca's area, is involved in phonological processing. 49 This brain region has also shown alterations in major depressive disorder 47 and has previously been suggested to be related to apathy, psychomotor slowing, and impaired attention and executive function. 50
We did not find an association, however, between betweenness centrality of the right pars opercularis and general mental health (p > 0.05), which suggests that the observed result may more likely be because of mTBI. In a previous study, eigenvector centrality was found to be decreased in the left temporal pole in mTBI compared with control subjects, 20 but the methods used and the sample were significantly different than in our study.
Most of the graph theoretical studies investigating structural brain network disruptions after TBI have included patients with moderate to severe TBI, 24,51,52 and only a few studies have investigated structural connectivity after mTBI. 20,23,53 Dall'Acqua and associates (2016) 23 and van der Horn and colleagues (2017) 20 showed no statistically significant differences between patients with mTBI and controls in global structural network measures, which is consistent with our findings. Lower memory performance was associated with local betweenness centrality at the subacute stage of mTBI. 20
Although we found no differences in global network measures between patients with mTBI and control subjects, we observed significant correlations between global network measures and TBI outcome at both acute/subacute and chronic stages (Table 3). This is not surprising, because the majority (70.6%) of the patients with mTBI had an outcome from 7 to 8 (out of maximum 8) measured with GOSE, as shown in Table 1. The high percentage of subjects with good outcome could make it difficult to detect the subtle differences between the groups. To our knowledge, the association between the network properties and GOSE following mTBI has not been investigated before.
Further, we found several local network properties that correlated significantly with outcome. Correlations were most prominent in the left putamen, showing that both strength and local efficiency were positively correlated with outcome. Increased strength of the left putamen was confirmed to be related to better outcome in the acute/subacute stage in the group-level analyses based on outcome, but local efficiency did not show significant differences in these analyses.
The putamen and the caudate nucleus form the dorsal striatum, which is the primary input region of the basal ganglia, and is involved in learning, behavior, and motor control. 54 Nucleus accumbens is part of the ventral striatum. The corticostriatal connectivity loop continues back to the cortex via the thalamus. 55 Although differences in the connectivity of the putamen have not been reported previously in TBI or related to its outcome, there is ample evidence about volumetric changes in the putamen in TBI. 56 –58 For instance, bilateral volume losses in the putamen, caudate, and thalamus have been associated with mTBI both two months and one year post-injury. 56
Decreased volume of the putamen has earlier been associated with motor skill deficits after TBI. 57 Moreover, it has been hypothesized that the great number of myelinated fibers traversing through the putamen to the globus pallidus might account for the volumetric changes in the putamen and globus pallidus regions in mTBI. 58
Correlations between global and local graph theoretical properties and outcome imply that structural brain connectivity networks are potential predictors of outcome after mTBI. Network integration (global efficiency) and centrality (degree and strength) were positively correlated and small-worldness was negatively correlated with outcome both in acute/subacute and chronic stages, while segregation (clustering coefficient) of networks was negatively associated with outcome, but only in the chronic stage. Although correlations were generally stronger at the chronic stage, some of these properties could provide valuable information already in the acute/subacute stage of injury. Based on our data, it is not possible to investigate whether these properties were altered already before the injury (predisposing factors for outcome) or whether they are descriptive of the injury itself.
A limitation of this study is the suboptimal DW-MRI acquisition because of the low b-value and only one non-diffusion weighted image. 59 This hindered, for instance, the correction of tractography biases with spherical deconvolution informed filtering of tractograms. 60 –63 In addition, no reverse phase-encoding data were acquired, hindering the use of optimal correction methods for echo-planar imaging distortions 64 and forcing us to correct for these distortions using the second-best approach—non-linear registration. 38 In addition, a multi-shell diffusion MRI acquisition would be able to better characterize white matter tracts, 65 because it would allow the non-white matter partial volume effects to be taken directly into account. 66,67
Handedness of patients was not recorded on recruitment and, thus, we could not investigate the association of the left putamen's structural connectivity and outcome with respect to handedness. Although caution should always be used when interpreting tractography results from the pathological brain, recent study showed that white matter lesions in multiple sclerosis did not hinder the ability to reconstruct anatomically correct fiber tracts. 68
We used patients with acute extracranial orthopedic injuries as controls. The recruitment of control patients was conducted carefully. The possibility of any kind of indirect impacts on the head cannot be ruled out completely, but we meticulously excluded all patients who had suspicions of head injuries, post-traumatic amnesia, loss of consciousness, or confusion.
Concerning our patients with TBI, it should be noted that our study population did not represent a typical mTBI population, but mainly victims from the more severe end of the mTBI spectrum. The severity assessment was based solely on the lowest recorded GCS score from the scene of the accident to the hospital emergency department. There are several ways to classify the severity of TBI and, using other classification criteria, not all of our patients would have been considered mild. We were largely unable to recruit patients outside office hours, which is the reason those who were discharged directly from the emergency department are underrepresented. Therefore, our mTBI cohort also had a higher percentage with CT abnormalities, and many of them were admitted to a ward.
A recent article suggests that patients with orthopedic injuries may show white matter abnormalities compared with healthy controls. 69 Thus, our results also could have been different if compared with healthy controls. The current research setting holds clinical relevance, however. In patients with polytrauma, the presence of mTBI is often challenging to rule out. The current results show that local differences in the network measures may have potential as a diagnostic tool to distinguish between patients with orthopedic injuries without mTBI and patients with mTBI with possible concomitant orthopedic injuries.
Conclusion
We applied graph theoretical analysis to structural brain connectivity networks after mTBI and found no global topological network alterations. Both global and local network properties, however, showed potential to be valuable indicators of outcome after mTBI both in acute/subacute and chronic stages.
Footnotes
Acknowledgments
We gratefully acknowledge the computational resources provided by the Aalto Science-IT project. Authors also express their gratitude to Satu Honkala and other collaborators and participants in this study.
Data are available on reasonable request by contacting the corresponding author.
Funding Information
This study was partly funded by the TBIcare FP7 project. M.M received funding from University of Turku. T.R. received support from the Emil Aaltonen Foundation, the Maud Kuistila Memorial Foundation, and the Finnish Cultural Foundation. J.P.P. received funding from the Academy of Finland (Grant #17379), Government's Special Financial Transfer tied to academic research in Health Sciences (Finland), and Maire Taponen Foundation. V.N. is supported by an Academy of Medical Sciences/The Health Foundation Fellowship.
Author Disclosure Statement
Dr. Frantzen has received speaker's fees from Orion and travel grants from Abbot Finland and Insightec Ltd. Dr. Frantzen is a medical advisor and a Member of the Board at Bonalive Biomaterials Ltd. For the remaining authors, no competing financial interests exist.
Supplementary Material
Supplementary Table S1
Supplementary Table S2
Supplementary Table S3A
Supplementary Table S3B
Supplementary Table S4
Supplementary Table S5
Supplementary Figure S1
Supplementary Figure S2
Supplementary Figure S3
Supplementary Figure S4
References
Supplementary Material
Please find the following supplemental material available below.
For Open Access articles published under a Creative Commons License, all supplemental material carries the same license as the article it is associated with.
For non-Open Access articles published, all supplemental material carries a non-exclusive license, and permission requests for re-use of supplemental material or any part of supplemental material shall be sent directly to the copyright owner as specified in the copyright notice associated with the article.
