




Abstract
Reports estimate between 1.6-3.8 million sports-related concussions occur annually, with 30% occurring in youth male American football athletes. Many studies report neurophysiological changes in these athletes, but the exact reasons for these changes remain elusive. Investigation of injury mechanics highlights a need to address how player position might impact these changes. Here, 55 high school American football athletes (20 linemen; 35 non-linemen) underwent magnetic resonance spectroscopy four times over the course of a football season—once prior to the season (Pre), twice during (In1, In2), and once following (Post) to quantify metabolites (N-acetyl aspartate, choline, creatine, myo-inositol, and glutamate/glutamine) in the dorsolateral prefrontal cortex (DLPFC) and primary motor cortex (M1). Head acceleration events (HAEs) were monitored at each practice and game. Spectroscopic and HAE data were analyzed by imaging session and player position. Linear regression analyses were conducted between metabolite levels and HAEs, and metabolite levels in football athletes were compared with age-and gender-matched non-contact athletes. Across-season (i.e., between Pre and In1, In2, Post), different DLPFC and M1 metabolites decreased (p < 0.05) according to player position (i.e., linemen vs. non-linemen). The majority of regression results involved DLPFC metabolites in linemen, where metabolite levels were higher from Pre to Post, with increasing HAE load. Comparisons with control athletes revealed higher metabolite levels in football athletes both before and after the season. This study highlights the importance of player position when conducting analyses on American football athletes and demonstrates elevated DLPFC and M1 brain metabolites in football athletes compared with control athletes at both Pre and Post, suggesting potential HAE-related neurocompensatory mechanisms.
Introduction
Of the estimated 2.8 million annual traumatic brain injuries (TBIs), including concussions, the highest incidence of contact-related, TBI-associated emergency department visits occurred in those aged 4-24, largely due to participation in sports-related activity. 1 Concussions can result in significant short- and long-term physical, behavioral, and cognitive impairment, 2,3 but collision-sport athletes also regularly experience asymptomatic (“subconcussive”) injuries (i.e., those not producing immediate observable, or noticeable, symptoms). 4 –10 The term injury is used in the context that any physiological abnormality may return to normal following a period of rest from contact activities. These repetitive brain injuries could be argued analogous to other types of strain injuries, like shin splits, which recover if the athlete avoids use of the injured anatomy. Asymptomatic injuries have been implicated in the pathology of chronic traumatic encephalopathy in professional football players. 11,12 Given the greater incidence rate of asymptomatic injuries, combined with their potential to induce impairment (transient or persistent), it is critical to investigate their mechanistic consequences as both a means to assess risk of injury and to quantify the associated pathophysiology.
It has long been hypothesized that the risk of injury (concussive or asymptomatic) is linked to the position an athlete plays. 13 Use of sensors to track head acceleration events (HAEs) allowed Broglio and colleagues to report an average of 652 HAEs over a 14-week period, with linemen experiencing the most impacts among all player positions. 14 Talavage and colleagues reported higher HAE counts in players who did not exhibit clinical impairment but who did show functional impairment, as measured by functional magnetic resonance imaging (fMRI). 15 These impairments are a function of playing style, 16,17 which is tightly coupled to position in American football. 18,19 Therefore, position plays an important role in exposure to HAEs and is expected to affect quantifiable neurophysiological change.
Magnetic resonance spectroscopy (MRS) is a modality used to evaluate concentrations of neurometabolites, including N-acetyl aspartate (NAA), myo-inositol (Ins), creatine (tCr), choline (tCho), and glutamate/glutamine (Glx). In healthy individuals, these metabolites reach mature levels and fluctuate minimally after the age of 4. 20,21 However, metabolite concentrations have been shown to fluctuate in contact sport athletes, even in absence of self-reported symptoms, with such changes correlated to exposure to HAEs exceeding 50 G. 22 Specifically, Poole and colleagues reported decreased Ins, tCr, and Glx in the dorsolateral prefrontal cortex (DLPFC) of high school football athletes across the season of play. 23 Additionally, Ins was higher in these football athletes when compared with controls at baseline (i.e., before contact practices began), but levels subsequently decreased during the season; similar trends were observed for Glx and tCr in the primary motor cortex (M1).
Further, Lin and colleagues found increased levels of Glx and tCho in athletes with a history of repetitive brain injury when compared with age- and weight-matched controls. 24 While these findings indicate changes to brain metabolism in football athletes, results may be confounded by the position an athlete plays—for example, a lineman who experiences lower-magnitude impacts during each play versus a running back who may experience less frequent but high-magnitude impacts. Analysis of HAE and MRS data by player position could provide insight into the metabolic differences that may underlie repetitive brain injury pathophysiology in the absence of clinically observable symptoms. Here, we assessed how HAEs varied by player position in youth American football and how this may influence neurometabolic changes.
Methods
Participants
Seventy-two (72) male, high school American football athletes (aged 14-18 years, mean = 16.1) were recruited from three local high schools to undergo four MRS assessments over the course of the 2016-2017 football season (July 2016-May 2017). Fifty-five athletes completed all four imaging sessions (220 observations); data from these 55 athletes were used in subsequent statistical analyses. Athletes were classified based on their primary team position—linemen (nlinemen = 20) or non-linemen (nnon-linemen = 35; Supplementary Fig. S1). Fourteen non-linemen and seven linemen (21/55) reported a history of diagnosed concussion (HoC); however, no athletes were diagnosed with a concussion during the time in which they were involved in the study. Data acquired from these athletes have not been previously reported.
Fourteen age- and gender-matched non-collision sport athletes (n = 14 males; mean age = 16.2) were included as a control population and recruited from one of the three high schools. Controls were imaged during an adjacent athletic season (2015-2016) using the same imaging protocol and MRI machine, which underwent no hardware or software upgrades in the interim. 22 This study was approved by Purdue University's Institutional Review Board and all athletes provided informed written consent.
Participation schedule
Football athletes' brain chemistry was assessed four times across the season (Fig. 1): once prior to participation (Pre), once each during the first (In1; 2-4 weeks from the start of contact practice) and second (In2; 6-8 weeks from the start of contact practice) halves of the competition season, and once following the competition season (Post; 4-6 weeks following season completion; average = 20.5 weeks from start of contact practice). Test and Re-test scans for controls were collected around their competitive season, just as for the football athletes. Corresponding sports included cross country (n = 5), swimming, (n = 4), track and field (n = 8), basketball (n = 1), and golf (n = 1). The average interval between Test and Re-test was 7 weeks.

Participation schedule for high school American football athletes (n = 55). Football athletes underwent magnetic resonance spectroscopy assessment four times across a single competition season: once prior to the start of contact practice (Pre), once during the first half of the competition season (In1), once during the second half of the competition season (In2), and once approximately 1 month after the end of the competition season (Post). Average inter-assessment intervals are indicated in the figure.
HAE monitoring
HAEs were monitored at all practices and games for football athletes using the xPatch (X2 Biosystems; Seattle, WA). 25 These sensors provide peak translational acceleration (PTA) and peak angular acceleration data (PAA). PTA data were acquired and pruned as previously reported. 22,26 While PAA data were collected, previous testing revealed inadequate frequency responses for the PAA measures; therefore, PAA data were not included in statistical analyses. 25
MRS protocol
MRS data were collected at the Purdue University MRI Facility (West Lafayette, IN). A 3 T General Electric (Waukesha, WI) Signa HDx (software version 16M3) was used with a 16-channel brain array coil (Nova Medical; Wilmington, MA). Data were collected using a single-voxel Point RESolved Spectroscopy (PRESS) sequence (repetition time [TR]/echo time [TE] = 1500/30 msec, 128 averages, volume of interest = 20 mm3). For accurate image registration and segmentation, a 1-mm isotropic resolution T1 scan was acquired using a three-dimensional spoiled gradient recalled echo sequence (TR/TE = 5.7/1.976 msec). First order shimming was conducted using the auto-shimming function with the vendor-supplied (General Electric) PRESS sequence; spectra with full width at half maximum (FWHM) values less than 15 Hz were accepted (a summary table of FWHM values can be found in the Supplementary Methods). 27 PRESS voxels were placed in the DLPFC and M1, as per prior investigations. 11,23,28 The DLPFC voxel was placed in the left hemisphere for all athletes and the M1 voxel was placed in the hemisphere contralateral to the athlete's dominant hand (e.g., left hemisphere for right-handed athletes). Unsuppressed water acquisition was performed to obtain reference water spectra. Details regarding protocol specifics can be found in the Supplementary Methods as per the checklist outlined in Lin and colleagues. 29
To better match voxel placement across sessions, operators were instructed to use the reconstructed voxel placement from Pre as a voxel-placement guide. Because multiple operators imaged participants, voxel placement consequently varied at each session. To ensure consistency, we discarded measurements obtained from voxels achieving less than 30% overlap with Pre (or Test) placement (i.e., equating to a 67% overlap on each side of the cube).
MRS processing
MRS data were pre-processed using in-house MATLAB (MathWorks; Natick, MA) codes following the pipeline described in Bari and colleagues 22 and Poole and colleagues. 23 Pre-processing was implemented in TARQUIN (version 4.3.7) and consisted of eddy current correction, water residual removal using Hankel singular value decomposition, zero-order phase correction, and automatic referencing using zero filling, as well as signal averaging. Metabolites of interest included N-acetyl aspartate (tNAA), myo-inositol (Ins), total choline (tCho), total creatine (tCr), and glutamate/glutamine (Glx). TARQUIN was used to fit metabolites of interest using tissue water as an internal reference. 30 However, corrections must be made for partial volume effects and metabolite and water T1 and T2. Analysis of Functional NeuroImages (AFNI) and FSL were used to generate tissues masks for partial volume corrections of white matter (WM), gray matter (GM), and cerebrospinal fluid (CSF); there were no significant differences in %WM, %GM, or %CSF between sessions (Kruskal Wallis p > 0.05). 31,32 Metabolite concentrations were reported relative to concentrations of tissue water. 30 Voxel overlap for subsequent sessions was calculated by reconstructing and then aligning it with the voxel generated from Pre. Examples of raw, unfiltered spectra from DLPFC and M1 can be found in Supplementary Figure S2.
Spectral data were included in statistical analyses if: 1) MRS voxel placement achieved greater than 30% overall overlap with Pre, or 67% overlap on each side of the voxel cube (note: prior to discarding, the average overlap between Pre and all sessions was 61 ± 0.04% and in total, 11 spectra were discarded with overlap < 30%); 2) the signal-to-noise ratio (SNR) was greater than 3 33 ; and 3) the fit achieved a Cramer-Rao lower bound (CRLB) less than 25% of the standard deviation (e.g., mean CRLB for Glx in M1 = 9.72; mean CRLB for Glx in DLPFC = 9.98); summary tables for CRLB and SNR can be found in the Supplementary Methods. All non-collision sport control data met these criteria. Football athletes sample sizes with valid data at all four sessions were (DLPFC) 28 and (M1) 18. Through use of multiple imputation (see the “Statistical Analysis” section), final sample sizes for football athletes were (DLFPC) 51 and (M1). 32
HAE post-processing
HAE metrics were computed on a cumulative, average, and normalized basis, per Bari and colleagues. 22 Season-end (i.e., at Post) metrics are denoted as follows: cumulative HAEs, cHAE; cumulative PTA, cPTA; average PTA, aPTA. Thresholded metrics assessing only those HAEs exceeding 50 G are denoted cHAE50G, cPTA50G, and aPTA50G. Metrics were also normalized using the number of “active” days with recorded HAEs (DLPFC athlete range = 9-59 days; M1 athlete range = 9-56 days): ncHAE, ncPTA, naPTA, ncHAE50G, ncPTA50G, naPTA50G.
Statistical analysis
All statistical analyses were conducted in STATA (StataCorp LLC, TX). 34 With 11.8% (26/220) of acquired sessions being excluded from analysis, multiple imputations were conducted to impute missing metabolite values using a multi-variate imputation approach and reported based on the means of 50 imputations. 35 It should be noted that this model is deemed appropriate for our number of observations (220 total sessions) and has be demonstrated to work well with highly skewed distributions. 36 Imputations were run separately for missing DLPFC and M1 data. All pairwise comparisons described below were corrected for multiple comparisons using the Benjamini-Hochberg procedure, and findings are only indicated as statistically significant if q < 0.05. 37
Metabolite concentrations were checked for normality and equal variances using the Shapiro-Wilk test and Bartlett's test, respectively. 38,39 All exhibited p < 0.05, indicating concentrations were not normally distributed and/or did not have equal variances. Therefore, all raw (i.e., non-transformed) metabolite data were analyzed using nonparametric analyses.
Potential confounding covariates and interactions were examined next. The Kruskal Wallis nonparametric test, followed by Bonferroni multiple comparisons correction, 31,40 was used to evaluate the effects of age on metabolite concentrations at Pre, followed by (pairwise) testing for interactions between session and HoC, and session and position.
Session-dependent changes in DLPFC and M1 metabolites were assessed using the Friedman test. 41 Sessions for those metabolites exhibiting p < 0.05 were pairwise analyzed using the Wilcoxon signed-rank test. 42,43
Position-dependent effects on DLPFC metabolites at each session were studied using a standard t-test (20 linemen, 31 non-linemen). Position-dependent effects across all sessions were analyzed using the Friedman test, followed by the Wilcoxon rank-sum test. 44
Position-dependent effects on M1 metabolites at each session were compared independently using the Wilcoxon rank-sum test (11 linemen, 21 non-linemen). Again, position-dependent effects across all sessions were analyzed using the Friedman test, followed by the Wilcoxon rank-sum test.
Position-specific variations in HAEs were investigated using a Wilcoxon rank-sum test. M1 and DLPFC athletes were combined for these analyses resulting in a group size of 55 (20 linemen, 35 non-linemen).
Following all session-wise and pairwise analyses, end-of-season (i.e., Post) metabolite levels were normalized:
Normalized metabolites (dependent variable) were regressed against end-of-season HAE metrics (independent variable) to investigate significant associations between metabolite change and HAEs. Cook's Distance was used to assess influence of data points on regression significance. 45 Raw HAE regressions were false discovery rate (FDR) corrected separately from normalized regressions.
Last, metabolite levels were compared between football athletes and peer non-collision sport controls. Given no significant differences between Test and Re-test metabolite levels in control athletes (Wilcoxon p > 0.05), the Wilcoxon rank-sum test was used to compare metabolite levels between football and non-collision athletes: Test for controls was compared with Pre in football athletes, and Re-test was compared with Post.
Results
Use of imputation yielded 51 athletes for DLPFC analyses and 32 for M1. No significant age-related metabolite differences were observed for DLPFC or M1 cohorts at Pre. Additionally, no significant interactions were found between session and HoC or position, for any metabolites.
DLPFC metabolite changes by session and position
Friedman analysis of DLPFC metabolites by session yielded a significant finding in Ins levels by session (p = 0.0020; n = 51; 20 linemen, 31 non-linemen). Ins was lower at In2 and Post compared with Pre (Fig. 2A; Supplementary Table S1).
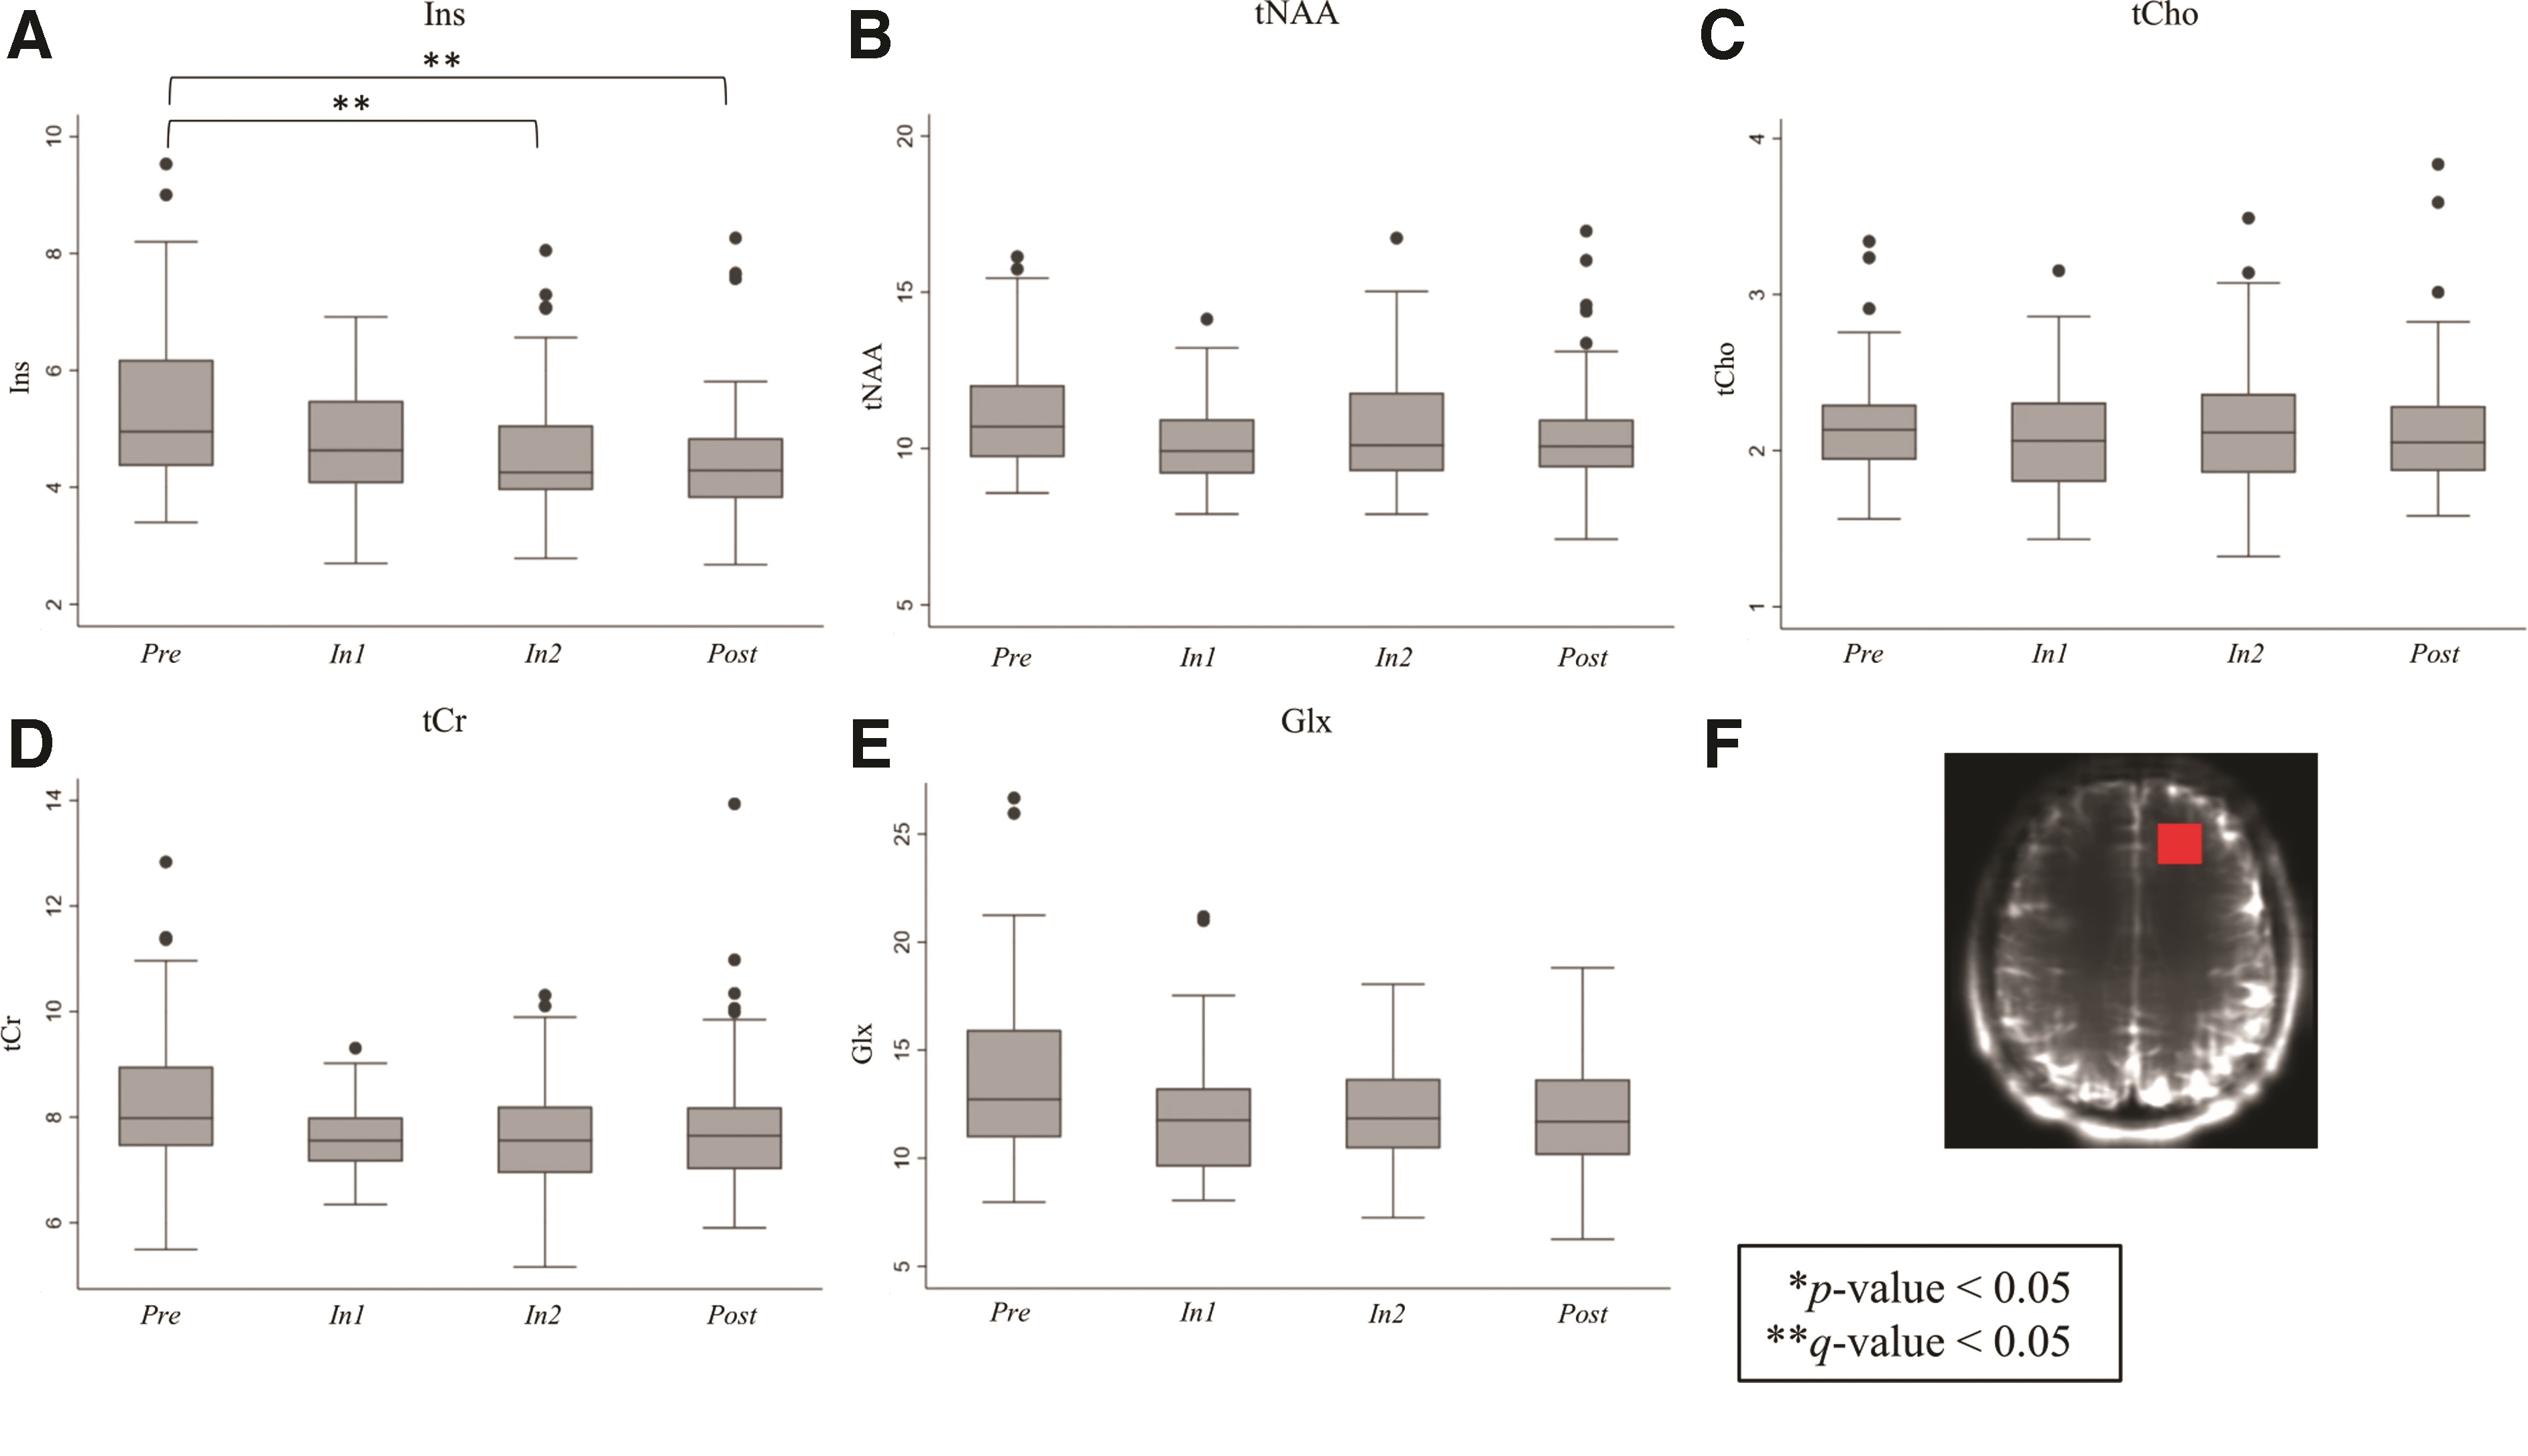
Changes in dorsolateral prefrontal cortex (DLPFC) metabolite levels across magnetic resonance spectroscopy assessments (Pre, In1, In2, and Post; n = 51 for all sessions) for
Position-specific analyses revealed that non-linemen (gray boxes, Fig. 3) exhibited significant Ins changes by session (p = 0.0199). Ins levels also decreased relative to Pre at each of In2 and Post (Fig. 3A; Supplementary Table S2). In addition, tNAA at In1 was lower in non-linemen relative to linemen (Table 1; Fig. 3B).
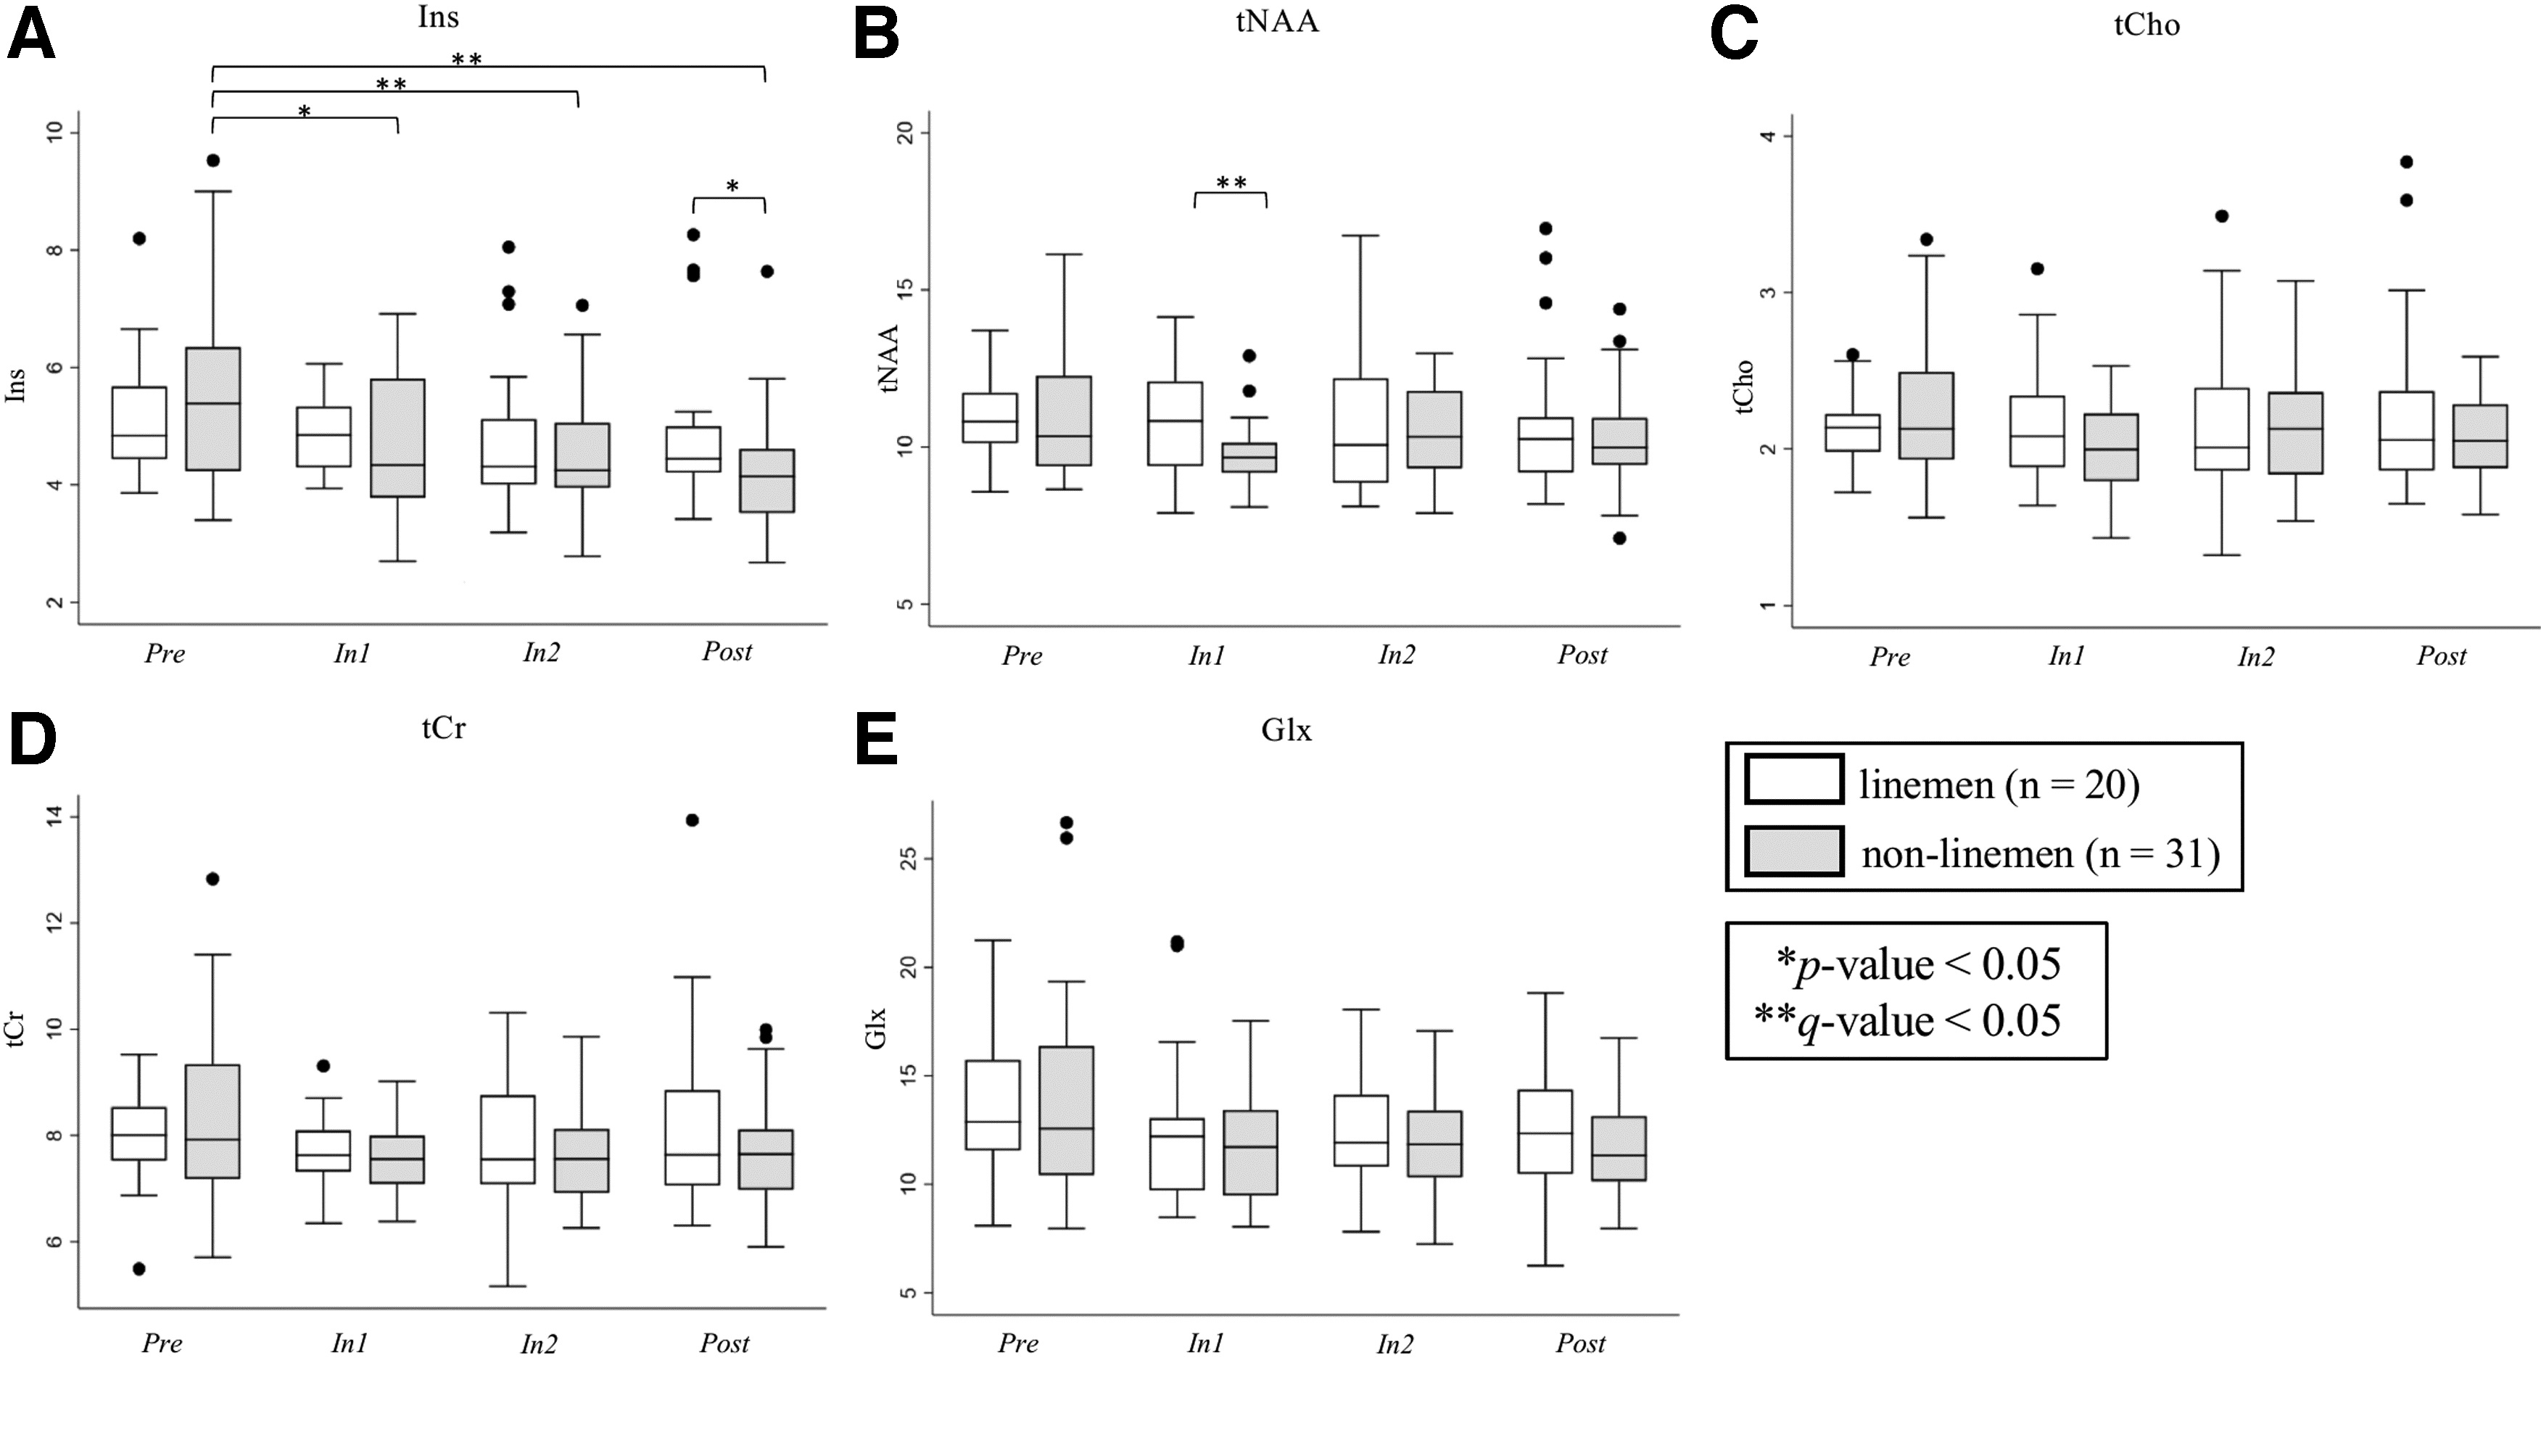
Changes in dorsolateral prefrontal cortex (DLPFC) metabolite levels by position (nlinemen = 20, nnon-linemen = 31) over all sessions (Pre, In1, In2, and Post) for
Results of Metabolite Level Differences between Linemen and Non-Linemen by Session
Boldface entries remained significant after FDR correction for multiple comparisons.
p's < 0.05 are reported and false discovery rate (FDR)-corrected to obtain q's; sample size for linemen = 20, sample size for non-linemen = 31.
ROI, region of interest; DLPFC, dorsolateral prefrontal cortex; Ins, myo-inositol; tNAA, total N-acetyl aspartate; Post, 1 month after the end of the competition season; In1, during the first half of the competition season.
M1 metabolite changes by session and position
Friedman analysis of M1 metabolites by session yielded significant changes in all five metabolites (n = 32; 11 linemen, 22 non-linemen). In general, metabolite levels were lower during (In1 and In2) and after (Post) the season compared with Pre (Fig. 4; Supplementary Table S1). Ins and tCho were lower at In1, In2, and Post compared with Pre. tCr and Glx were lower at In1 and In2 compared with Pre, and tCr was higher at Post compared with In2. While there was no overall effect for tNAA (i.e., no significant Friedman p value), there were significant differences between Pre and In1 and In2 (q < 0.05; Fig. 4B, denoted by dashed brackets).

Changes in primary motor cortex (M1) metabolite levels across magnetic resonance spectroscopy assessments (Pre, In1, In2, and Post; n = 32 for all sessions) for
Position-specific analyses revealed significant differences in both non-linemen and linemen (Fig. 5; Supplementary Table S2). Ins was lower in non-linemen at In1 and In2 relative to Pre. tCho was lower in non-linemen at In1 versus Pre and lower at In1 compared with Post. Linemen displayed lower tCho at In1, In2, and Post compared with Pre. tCr was lower in non-lineman at In1 and In2 versus Pre and higher at Post versus In1. Last, Glx was lower at In2 compared with Pre in non-linemen.
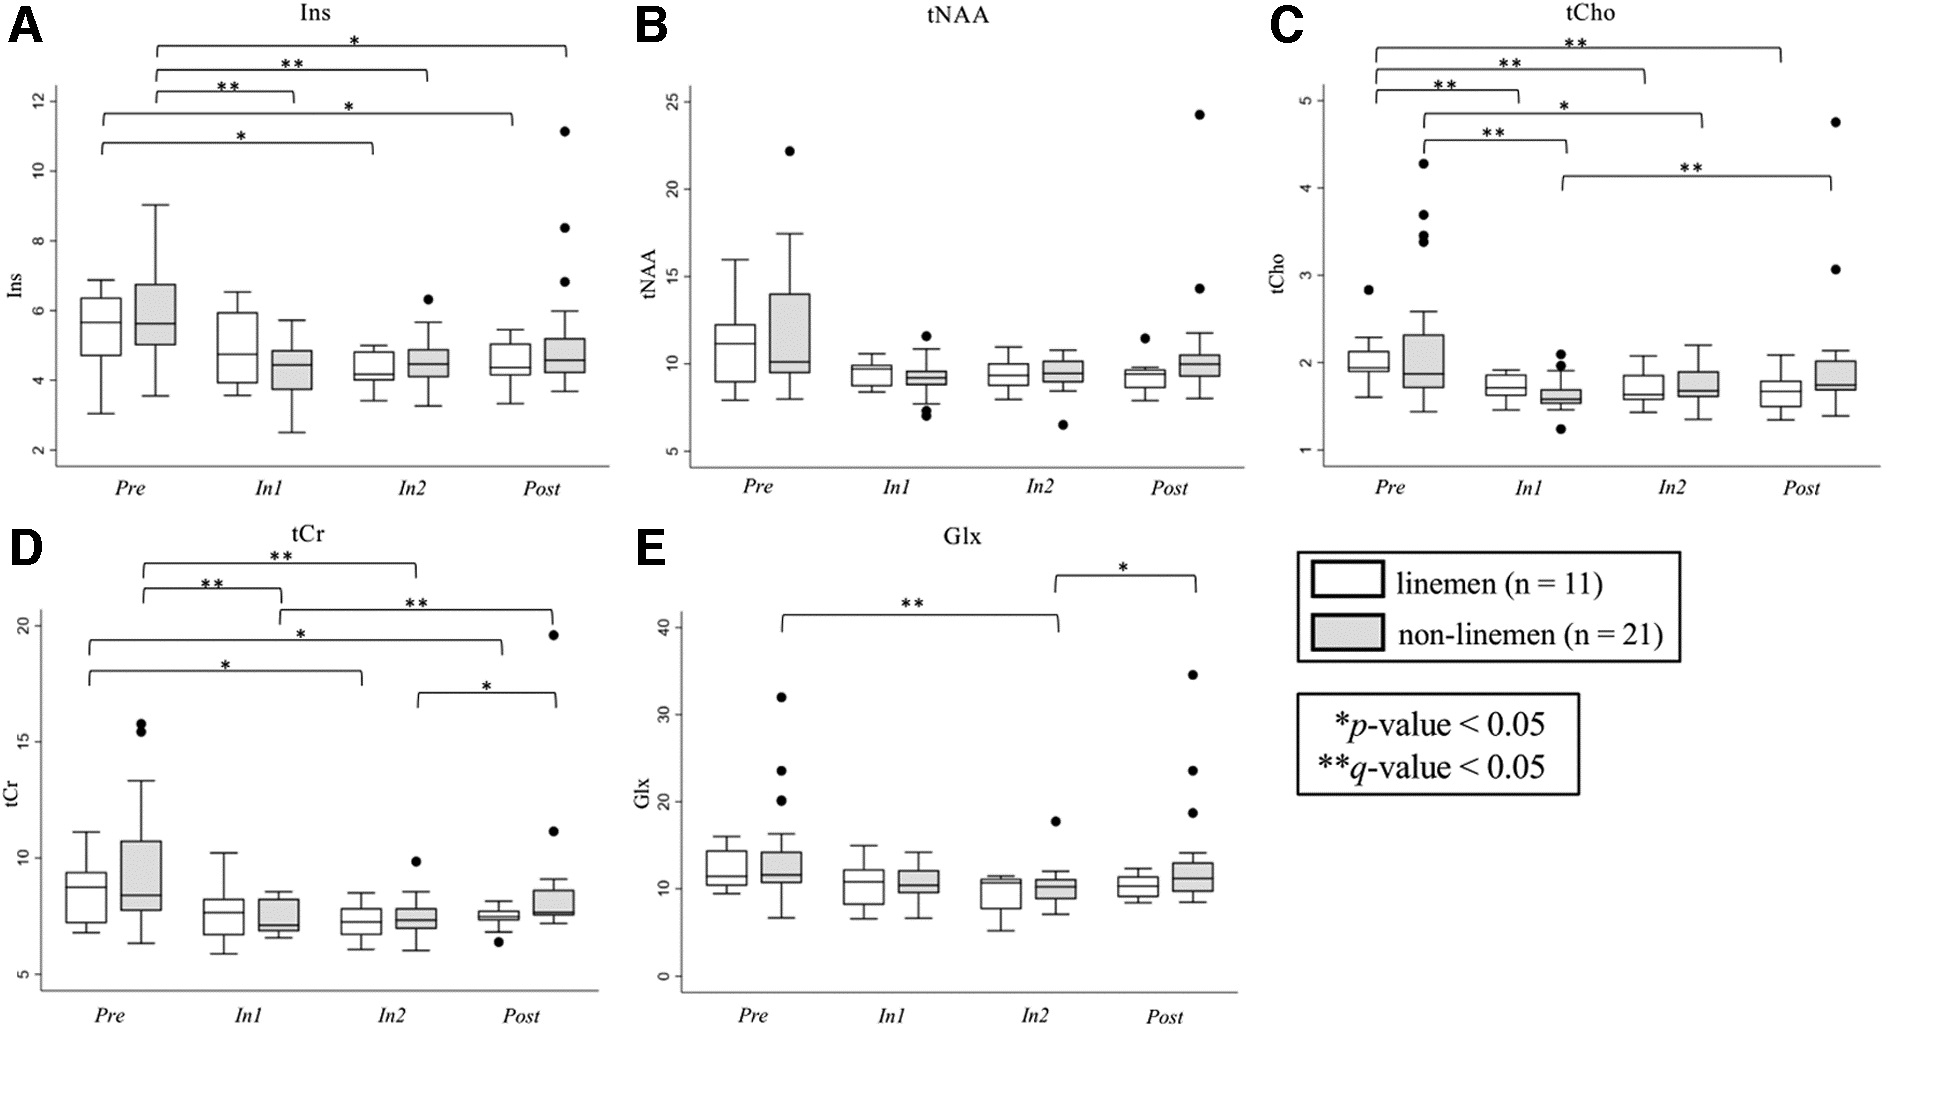
Changes in primary motor cortex (M1) metabolite levels by position (nlinemen = 11, nnon-linemen = 21) over all sessions (Pre, In1, In2, and Post) for
HAE variations by position
Analysis of the HAEs by position revealed that non-linemen (running backs, defensive backs, etc.) sustained more high-magnitude impacts while linemen accumulated more hits over the course of season. Specifically, non-linemen had significantly higher aPTA50G and linemen had higher cHAE, cPTA, ncHAE and ncPTA (Fig. 6).

Analysis of head acceleration event (HAE) metrics by position (nlinemen = 20, nnon-linemen = 35). Significant differences in HAE metrics between linemen and non-linemen were found for
Regression analysis of position effects on DLPFC and M1 metabolite levels
There were six significant regressions of normalized metabolite changes with raw or normalized HAE metrics. The majority (5/6) involved DLPFC metabolites (Table 2; Table 3). Regressions are plotted in Figures 7 and 8 to emphasize differences in regression fits between positions. Results not surviving an FDR correction can be found in Supplementary Tables S3 and S4 and Supplementary Figures S3 and S4. Note that regressions for tNAA versus cPTA50G and aPTA50G were not significant when an apparent outlier was removed (Supplementary Fig. S3B); however, given that these data points were not flagged using the Cook's distance method, results are included in Supplementary Table S3.

Statistically significant (q < 0.05) regressions of raw metabolite levels against end-of-season head acceleration event (HAE) metrics. Sample sizes and R2 values for the significant regression are indicated in each subplot. See Table 4 for further information regarding outliers. DLPFC, dorsolateral prefrontal cortex; Glx, glutmate+glutamine; aPTA, average peak translational acceleration; cHAE, cumulative HAEs; cHAE50G, cHAEs exceeding 50 G; tCr, total creatine; aPTA50G, average PTA for hits exceeding 50 G.
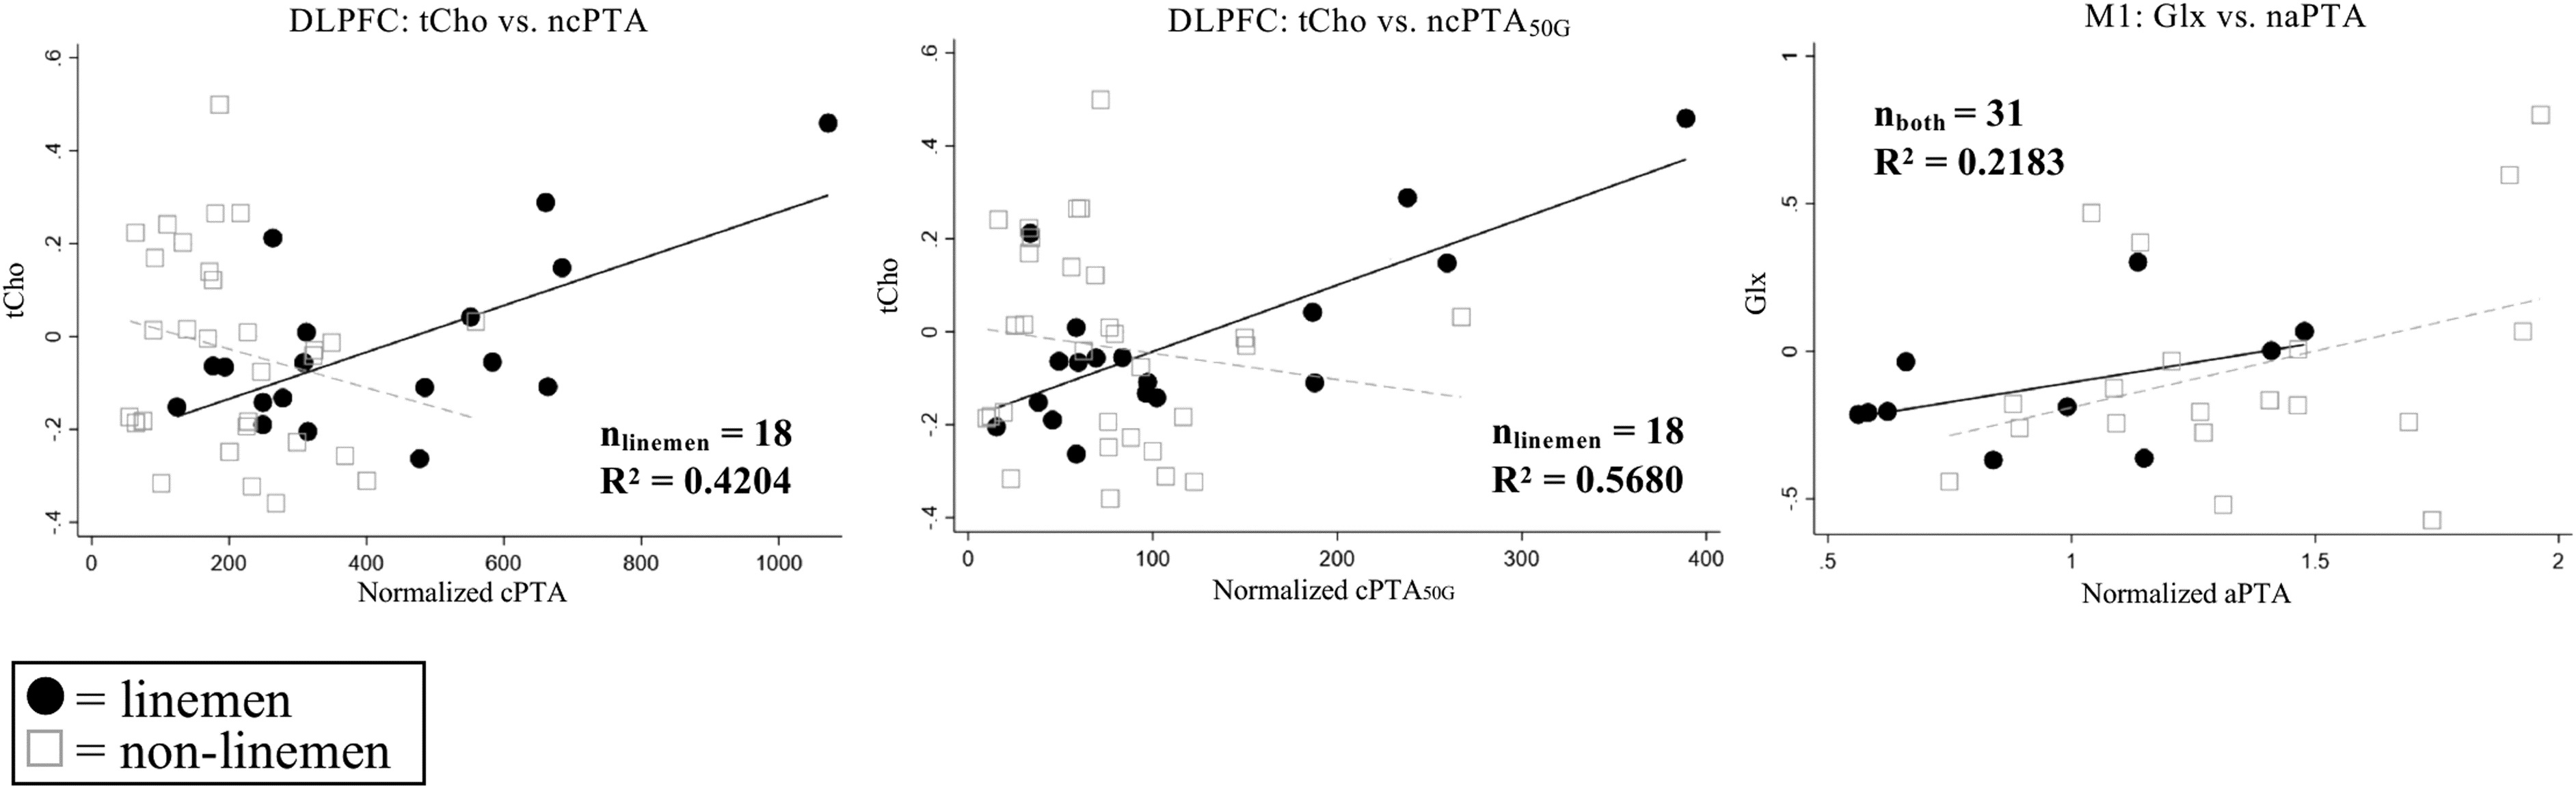
Statistically significant (q < 0.05) regressions of normalized metabolite levels against end-of-season head acceleration event metrics. Sample sizes and R2 values for the significant regression are indicated in each subplot. See Table 5 for further information regarding outliers. DLPFC, dorsolateral prefrontal cortex; tCho, total choline; cPTA, cumulative peak translational acceleration (PTA); cPTA50g, cumulative PTA for hits exceeding 50 G; M1, primary motor cortex; Glx, glutmate+glutamine; aPTA, average PTA.
Results of Linear Regression of Metabolite Concentrations for High School Football Athletes against Non-Normalized Head Acceleration Event (HAE) Metrics
Boldface entries represent regressions that remained significant after false discovery rate correction for multiple comparisons.
Regressions were performed for the full corpus of football athletes, as well as separately for linemen (n = 20) and non-linemen (n = 31). Outliers detected by Cook's Distance are indicated. Standardized β coefficients, R2, and adjusted R2 are reported.
ROI, region of interest; DLPFC, dorsolateral prefrontal cortex; Glx, glutamate/glutamine; tCr, total creatine; cHAE50G:cHAE, ratio of HAEs exceeding 50 G to all HAEs; aPTA, average peak translational acceleration; cPTA, cumulative peak translational acceleration.
Results of Linear Regression of Metabolite Concentrations for High School Football Athletes against Normalized Head Acceleration Event (HAE) Metrics
Boldface entries represent regressions that remained significant after false discovery rate correction for multiple comparisons.
Regressions were performed for the full corpus of football athletes, as well as separately for linemen (n = 20) and non-linemen (n = 31). Outliers detected by Cook's Distance are indicated. Standardized β coefficients, R2, and adjusted R2 are reported.
ROI, region of interest; DLPFC, dorsolateral prefrontal cortex, M1, primary motor cortex; tCho, total choline; Glx, glutamate+glutamine; ncPTA, normalized cumulative peak translational acceleration; naPTA, normalized average normalized cumulative peak translational acceleration.
Wilcoxon Rank-Sum Test Comparison of Metabolite Levels in Football Athletes and Control Athletes, Comparing Football Athlete Pre to Control Athlete Test, and Football Athlete Post to Control Athlete Re-test
Bold = significant p value; bold and italicized = significant q value. Boldface entries remained significant after false discovery rate correction for multiple comparisons.
ROI, region of interest; DLPFC, dorsolateral prefrontal cortex; M1, primary motor cortex; Ins, myo-inositol; tNAA, total N-acetyl aspartate; tCho, total choline; tCr, total creatine; Glx, glutamate+glutamine; Pre, prior to the start of contact practice; In1, during the first half of the competition season; In2, during the second half of the competition season; Post, 1 month after the end of the competition season.
Metabolite comparisons between controls and high school football athletes
In DLPFC, football athletes exhibited significantly higher levels of Ins and tCho at Pre compared with Test in controls (Table 4; Fig. 9A). In addition, tCho was elevated at Post compared with Re-test in controls (Table 4; Fig. 9B).

Comparison of dorsolateral prefrontal cortex (DLPFC) metabolites in non-collision sport control athletes with football athletes.
In M1, football athletes again exhibited significantly higher levels of metabolites compared with controls. Specifically, Ins, tCho, and tCr were higher at Pre relative to Test in controls (Table 4; Fig. 10A). However, no metabolites were altered at Post for football athletes relative to Re-test for controls (Table 4; Fig. 10B).

Comparison of primary motor cortex (M1) metabolites in non-collision sport control athletes with football athletes.
Discussion
The presented study sought to evaluate how player position, and the associated playing behaviors, in American football may affect brain homeostasis. Spectroscopic data, collected from 55 male high school football athletes at four time points over the course of a season in which HAEs were monitored at each practice and game, revealed changes from non-collision peers and across position groups (linemen and non-linemen). These findings suggest that it would be valuable to explore position-specific changes in protection and training to reduce HAE-induced injuries.
Neurometabolic changes
In DLPFC, Ins decreased from baseline Pre to In2 and Post. In M1, Ins, tNAA, tCho, tCr, and Glx decreased from Pre levels. Together, these changes may reflect neurometabolic dysfunction and energy crises triggered by injury and evidenced by inflammation—pathologies evidenced by other neuroimaging and biomarker studies. 22,23,28,46,47 In the literature, Ins has been reported to decrease in collision-sport athletes at 1, 2, and 3 months following baseline scans, and in rats sustaining controlled closed-head injuries. 23,48 These changes are likely due to loss of glial and astrocytic cells due to injury. 23 Studies have also reported TBI-related decreases in tNAA and tCho, which could be representative of mitochondrial dysfunction and energetic impairment and/or tissue damage and swelling, respectively. 23,49 –53 tCr is a marker of energy status in the brain and remains stable in many TBI studies, owing to its use as an internal reference. 22,24 However, tCr decreased in the presented study and other related studies. 23,50,51 These observations further question the use of tCr as an internal reference and suggest a state of energy crisis and impaired ATP buffering. 54 In general, we observed a number of metabolic changes in DLPFC and M1 which would not occur in healthy individuals; our reports are consistent with others' findings. 22,23,51,55 –60 Our discussion is by no means an exhaustive discussion of these metabolic alterations as previous research has focused greatly on these observations.
Position-specific effects
Linemen accumulated more HAEs (cHAE and cPTA) while non-linemen had a higher average PTA when counting hits greater than 50 G (aPTA50G; Fig. 6). Linemen are positioned at the line of scrimmage and generally make contact with other players during each play. Therefore, it seems intuitive that linemen would experience a larger number of HAEs. Non-linemen withstand fewer contacts, but these contacts are typically higher in collision speed—hence, the higher aPTA50G. 18
Across the season, metabolite levels changed in varying ways in DLPFC and M1 when comparing linemen to non-linemen (Fig. 3; Fig. 5). Notably, non-linemen exhibited a larger number of metabolic changes in DLPFC and M1 metabolites as compared with linemen (i.e., three total for linemen vs. 10 total for non-linemen; q < 0.05). In the DLPFC, non-linemen exhibited lower levels of Ins at Post and tNAA at In1 when compared with linemen. The overall lack of metabolic differences between positions could be due to unequal groups comparisons (i.e., 20 linemen vs. 31 non-linemen for DLPFC and 11 linemen vs. 21 non-linemen for M1). Together, these findings suggest that non-linemen may be more susceptible to metabolic depletions in both DLPFC and M1 as compared with their linemen counterparts. This could be due, in part, to the nature of their position which can result in high-magnitude HAEs, as mentioned above. These findings also emphasize the importance of taking player position into consideration when conducting formal analyses on football athletes as the lack of changes in some athletes may dampen the overall effects observed and prevent the discovery of changes in athletes who play other positions.
Position effects on HAE-metabolite relationships
As HAE exposure increased, DLPFC metabolite levels (Glx, tCr, and tCho) were increasingly higher at Post (relative to Pre). Of these relationships, 3/5 (60%) were observed in linemen. These observations could be explained by the high frequency of top-front (i.e., near the DLPFC) HAEs experienced by linemen. 15 We hypothesize that more repetitive HAE exposures to the DLPFC region may in fact trigger injury responses to maintain metabolic homeostasis, whereas fewer HAEs may not trigger such responses. Overall, metabolite levels decreased at In1, In2, and Post as compared with Pre; however, the sheer volume of HAEs sustained may be triggering repair mechanisms as the season progresses and once the season is over. Additionally, because Post imaging occurred 4-6 weeks following the end of the season, this could also be enough time for repair mechanisms to kick in and repair may be more aggressive in athletes who experienced a higher number of HAEs during the season. Therefore, it could be posited that metabolic turnover in DLPFC metabolites increases with HAE exposure as a compensatory mechanism for cumulative injury. This is noteworthy given the DLPFC is still developing in these youth athletes. 61,62
Comparison of metabolites with controls
Metabolites were elevated in football athletes compared with controls for both DLPFC and M1, particularly at pre-participation assessments (Pre vs. Test). These observations support findings in Poole et al. 2014 where Glx was elevated in football athletes at Pre and In-season as compared to controls. One potential explanation for this observation could be the neuroplastic responses to frequent periods of injury accumulation. The presence of neurometabolic changes over the course of the season could thus be consistent with previous reports of new synaptic growth and axonal synthesis increase weeks following injury. 63,64 Such plasticity may be greater for these youth athletes, who are still undergoing significant brain maturation, especially in the DLPFC. 62,65,66
The response to injury posited above could, however, be detrimental to normal, healthy development. Because nearly all metabolites in DLPFC and M1 were elevated in football athletes at Pre (i.e., before any contact practices), it is plausible that the brain has compensated for damage accrued from prior years of play—an average of 7 years for this cohort of high school football athletes. It seems possible that levels of these metabolites may increase as a precaution for impending damage. That is, as contact practices and games begin, levels of these metabolites may decrease, but they would not reach critically low levels; rather, metabolites achieve levels similar to (presumably healthy) controls—a phenomenon previously reported in resting-state functional connectivity. 67 The long-term effects of increased baseline levels of these metabolites are unknown.
Some could argue that the consistent elevation of all metabolites could be indicative of a scaling issue, potentially related to body-mass-index (BMI). Because BMI is known to vary greatly by age, especially in youth, we separated our football and control athletes by age to compare BMI more appropriately 68 : (1) sample sizes were too small to make comparisons in the 14- and 18-year-old age groups and (2) albeit there was a BMI difference between control and football athletes in 17-year-olds (t-test p = 0.033), there were no significant differences in 15- and 16-year-olds (t-test p > 0.05). Further, both control and football athlete BMI levels fell into ranges that are deemed healthy or close-to-healthy for each respective age group (15, 16, 17 years). 68 Given that (1) we did not find BMI differences across all age groups, (2) our cohort of football and control athletes fall into healthy and close-to-healthy BMI ranges, 68,69 (3) BMI has been shown to be an inaccurate measure 70,71 — especially in athletes, 72 and (4) all metabolite levels were reported relative to each athlete's water signal, we concluded that BMI would unlikely produce a scaling issue in our dataset.
Study limitations
Limitations include unequal and small sample sizes of linemen (N = 20) and non-linemen (N = 35), use of manual voxel placement, lack of HAE confirmation with video recording, and variations in time between sessions for each athlete. While novel automatic voxel placement methods are under development, no robust methods were available during the length of this study. Therefore, additional measures were taken to minimize erroneous manual voxel placement. Further, video recordings were not implemented to confirm each specific sensor-recorded HAE. We recognize this as a limitation but also note that our prior experiences working with video confirmation suggests that it is not necessarily a useful practice given that collisions along the line of scrimmage are occluded from most sideline camera locations, and are difficult to assign to athletes when using cameras in the stands. Time intervals between sessions were different for each player due to time constraints surrounding imaging, and improvements can be made by scanning athletes in tighter time windows.
Conclusion
This study revealed that brain metabolites decreased in youth American football athletes across a season of play. Further, the degree of metabolite change varied by the position an athlete played (linemen vs. non-linemen). Player position was also important when examining relationships between head acceleration events and metabolite levels, as relationships were commonly observed for one position class. Lastly, metabolite levels in football athletes were consistently higher at both pre-season and post-season when compared with non-contact control athletes. Together, these findings: 1) extend previous work, which reports neurometabolic disturbances occur in youth football athletes; 2) emphasize the importance of player position in spectroscopic changes; and 3) provide evidence of potential neurocompensatory mechanism whereby metabolites are maintained at a heightened level to prepare the brain for impending damage.
Footnotes
Acknowledgments
The authors express thanks to Dr. Gregory Tamer for his assistance with preparing the MR imaging protocol and scheduling.
Authors' Contributions
NV was responsible for the oversight of collection of MRS data, coordination of analysis, and primary preparation of manuscript. SB was responsible for the coordination of collection of MRS data. AS provided SNR and FWHM tables, as well as spectral quality assessment presented as Supplementary Figure S2. RL, JA, JM were responsible for the coordination of collection of HAE data. EN was responsible for design and oversight of collection of HAE data and assisted with manuscript preparation. TT was responsible for the design and oversight of study protocol and assisted with manuscript preparation. JR was responsible for the design of collection and analysis of MRS data and assisted with manuscript preparation.
Funding Information
This work was funded in part by a grant from Allied Milk Producers.
Author Disclosure Statement
Funding for TL was supported by the National Science Foundation Graduate Research Fellowship under Grant No. DGE-1333468.
For all other authors, no competing financial interests exist.
Supplementary Material
Supplementary Methods
Supplementary Figure S1
Supplementary Figure S2
Supplementary Figure S3
Supplementary Figure S4
Supplementary Table S1
Supplementary Table S2
Supplementary Table S3
Supplementary Table S4
References
Supplementary Material
Please find the following supplemental material available below.
For Open Access articles published under a Creative Commons License, all supplemental material carries the same license as the article it is associated with.
For non-Open Access articles published, all supplemental material carries a non-exclusive license, and permission requests for re-use of supplemental material or any part of supplemental material shall be sent directly to the copyright owner as specified in the copyright notice associated with the article.
