




Abstract
In nearly all clinical and research contexts, the initial severity of a traumatic brain injury (TBI) is measured using the Glasgow Coma Scale (GCS) total score. The GCS total score however, may not accurately reflect level of consciousness, a critical indicator of injury severity. We investigated the relationship between GCS total scores and level of consciousness in a consecutive sample of 2455 adult subjects assessed with the GCS 69,487 times as part of the multi-center Transforming Research and Clinical Knowledge in TBI (TRACK-TBI) study. We assigned each GCS subscale score combination a level of consciousness rating based on published criteria for the following disorders of consciousness (DoC) diagnoses: coma, vegetative state/unresponsive wakefulness syndrome, minimally conscious state, and post-traumatic confusional state, and present our findings using summary statistics and four illustrative cases. Participants had the following characteristics: mean (standard deviation) age 41.9 (17.6) years, 69% male, initial GCS 3–8 = 13%; 9–12 = 5%; 13–15 = 82%. All GCS total scores between 4–14 were associated with more than one DoC diagnosis; the greatest variability was observed for scores of 7–11. Further, a wide range of total scores was associated with identical DoC diagnoses. Importantly, a diagnosis of coma was only possible with GCS total scores of 3–6. The GCS total score does not accurately reflect level of consciousness based on published DoC diagnostic criteria. To improve the classification of patients with TBI and to inform the design of future clinical trials, clinicians and investigators should consider individual subscale behaviors and more comprehensive assessments when evaluating TBI severity.
Introduction
The Glasgow Coma Scale (GCS), developed in 1974 by Teasdale and Jennett, 1 is the most widely used behavioral measure to assess the severity of acute traumatic brain injury (TBI). 2,3 The scale's simplicity and rapid assessment approach has led to its international adoption for both diagnostic and prognostic 4 applications in pre-hospital, emergency department (ED), and intensive care unit (ICU) settings. The GCS has been designated a core TBI Common Data Element 5 by the National Institute of Neurological Disease and Stroke and is commonly used in clinical trials both as a criterion for subject inclusion and as an approach for subject stratification. 6
The GCS is scored based on behaviors observed across three subscale scores—eye-opening (score range 1–4), verbal (score range 1–5), and motor (score range 1–6)—that are summed to provide a total score ranging from 3–15. 7 The total score is intended to reflect severity of injury, with scores of 3–8 indicating a severe injury, 9–12 a moderate injury, and 13–15 a mild injury. Moreover, GCS total scores of 3–8 are often used to define coma. 8 Despite its widespread use, GCS administration and scoring is not standardized, and its psychometrical strength is moderate. 3,9 While there is a relationship between GCS total score and prognosis, 7,10 this relationship is strongest for predicting death in large population studies 11 but not for predicting morbidity or functional outcome at the individual patient level. 12
Cognizant of its limitations, the original developers of the GCS wrote in 1978 that, although total scores may have prognostic utility, important information about current function and the potential for recovery is lost when reporting a GCS total score rather than individual component scores. 7 In 1983 and again in 2014, Teasdale and colleagues 2,13 reaffirmed the importance of specifying the score for each of the three subscales and that failure to do so could limit the ability to detect changes in consciousness.
Multiple studies have found that individual subscale scores are more diagnostically 14 and prognostically 15 relevant than the total score. Moreover, different combinations of subscales that sum to the same total score are associated with variable mortality rates. 16 The implication of these findings spans across clinical and research settings where GCS scores are often further collapsed into three broad categories of mild, moderate, and severe TBI. This coarse classification may mischaracterize individual patient prognosis, as evidenced by some “severe” patients having a favorable outcome 17 and some “mild” patients having an unfavorable outcome. 18
From a clinical trial design perspective, reliance on GCS total scores may contribute to improper inclusion and stratification of subjects, leading to heterogenous study groups, lack of statistical robustness, inaccurate interpretation of findings, and ultimately trial failure. 6 Despite the evidence for using GCS subscale scores rather than a total score, GCS total scores remain the most common metric for establishing TBI severity and stratifying study subjects. 6
Since the development and dissemination of the GCS, the diagnostic framework for classifying level of consciousness has evolved to be more precise. A definition of the minimally conscious state (MCS) was published in 2002 by the Aspen Neurobehavioral Conference Workgroup. 19 MCS was further subdivided into MCS+ and MCS- based on presence or absence of language function, respectively. 20 Distinguishing between the vegetative state/unresponsiveness syndrome (VS/UWS), MCS- and MCS+ diagnoses increases prognostic precision. 20 –22
The GCS was not designed, however, to differentiate these DoC states and lacks assessment of items such as visual pursuit and fixation that are crucial for detecting consciousness. 23,24 In fact, the GCS has been estimated to have a false negative rate of 38% for detection of consciousness. 24 It follows that, in some patients, neither GCS total scores nor subscale scores may characterize injury severity accurately.
The association between GCS total scores and the current diagnostic criteria for level of consciousness is unknown. We identified all potential combinations of GCS total scores and used published diagnostic criteria for VS/UWS, MCS-, MCS+, 19,20 and the post-traumatic confusional state (PTCS) 25 to match each GCS score combination with a level of consciousness. We then evaluated the observed incidence of each GCS combination in the Transforming Research and Clinical Knowledge in TBI (TRACK-TBI) study. Finally, we provide case studies illustrating the diagnostic discrepancies that result from using GCS total scores.
Methods
Participants
TRACK-TBI is an 18-site observational study aimed at improving phenotypic accuracy and outcome precision for patients with TBI. Subjects at participating sites are enrolled within 24 h of injury and followed up to 12 months if they meet the following criteria: documented TBI, computed tomography (CT) scan, and no significant polytrauma that would interfere with follow-up assessment (for full inclusion criteria, see the TRACK-TBI website). 26 The Institutional Review Board of each site approved the study protocol, and all subjects or surrogates provided written informed consent to participate.
Acute hospitalization data elements, including GCS scores obtained in the field, ED, ICU, and on the hospital ward, were abstracted from medical records by research staff and documented in an electronic database. The GCS scores were available for the first five days of hospitalization and for the entire duration that intracranial pressure was monitored.
Of the 2552 subjects (≥17 years old) enrolled in TRACK-TBI from 2014–2018, we excluded (1) subjects with no GCS scores (n = 28); (2) subjects for whom all GCS scores were confounded by periorbital swelling, intubation, and/or paralysis (n = 68); and (3) subjects for whom data errors (e.g., GCS date preceded injury date) could not be resolved (n = 1). The final sample included 2455 subjects with at least one unconfounded GCS score (Supplementary Fig. S1).
Collectively, these subjects were assessed with the GCS 69,487 times. Periorbital swelling, intubation, and/or paralysis were documented in 30,139 of the 69,487 GCS scores, leaving 39,348 unconfounded GCS scores for the primary analysis. Intubation was the most common confounding factor and was documented in 28,902 GCS scores. To reduce the potential for bias related to interpreting the verbal subscale in intubated patients, we excluded GCS scores confounded by intubation from the primary analysis. In a separate, secondary analysis, we analyzed scores confounded by intubation by imputing the verbal subscale score based on the Rutledge model, Equation 1. 27
GCS combinations and associated level of consciousness
We identified the 120 possible GCS subscale score combinations (4 eye-opening
We started by selecting the highest-level behavior assessed by the GCS, “oriented” (verbal = 5), and assigning all GCS combinations with a verbal subscale score of 5 to the rPTCS group. Next, we assigned all GCS scores with the subsequent highest-level behavior assessed by the GCS (i.e., “confused,” verbal = 4) to the “PTCS” group. We continued along this line of stepwise reasoning by identifying the subsequent highest-level GCS behavior 31 and assigning all GCS combinations with that behavior the corresponding DoC diagnostic group (see Fig. 1, Panel B for a flow-diagram illustrating this procedure).
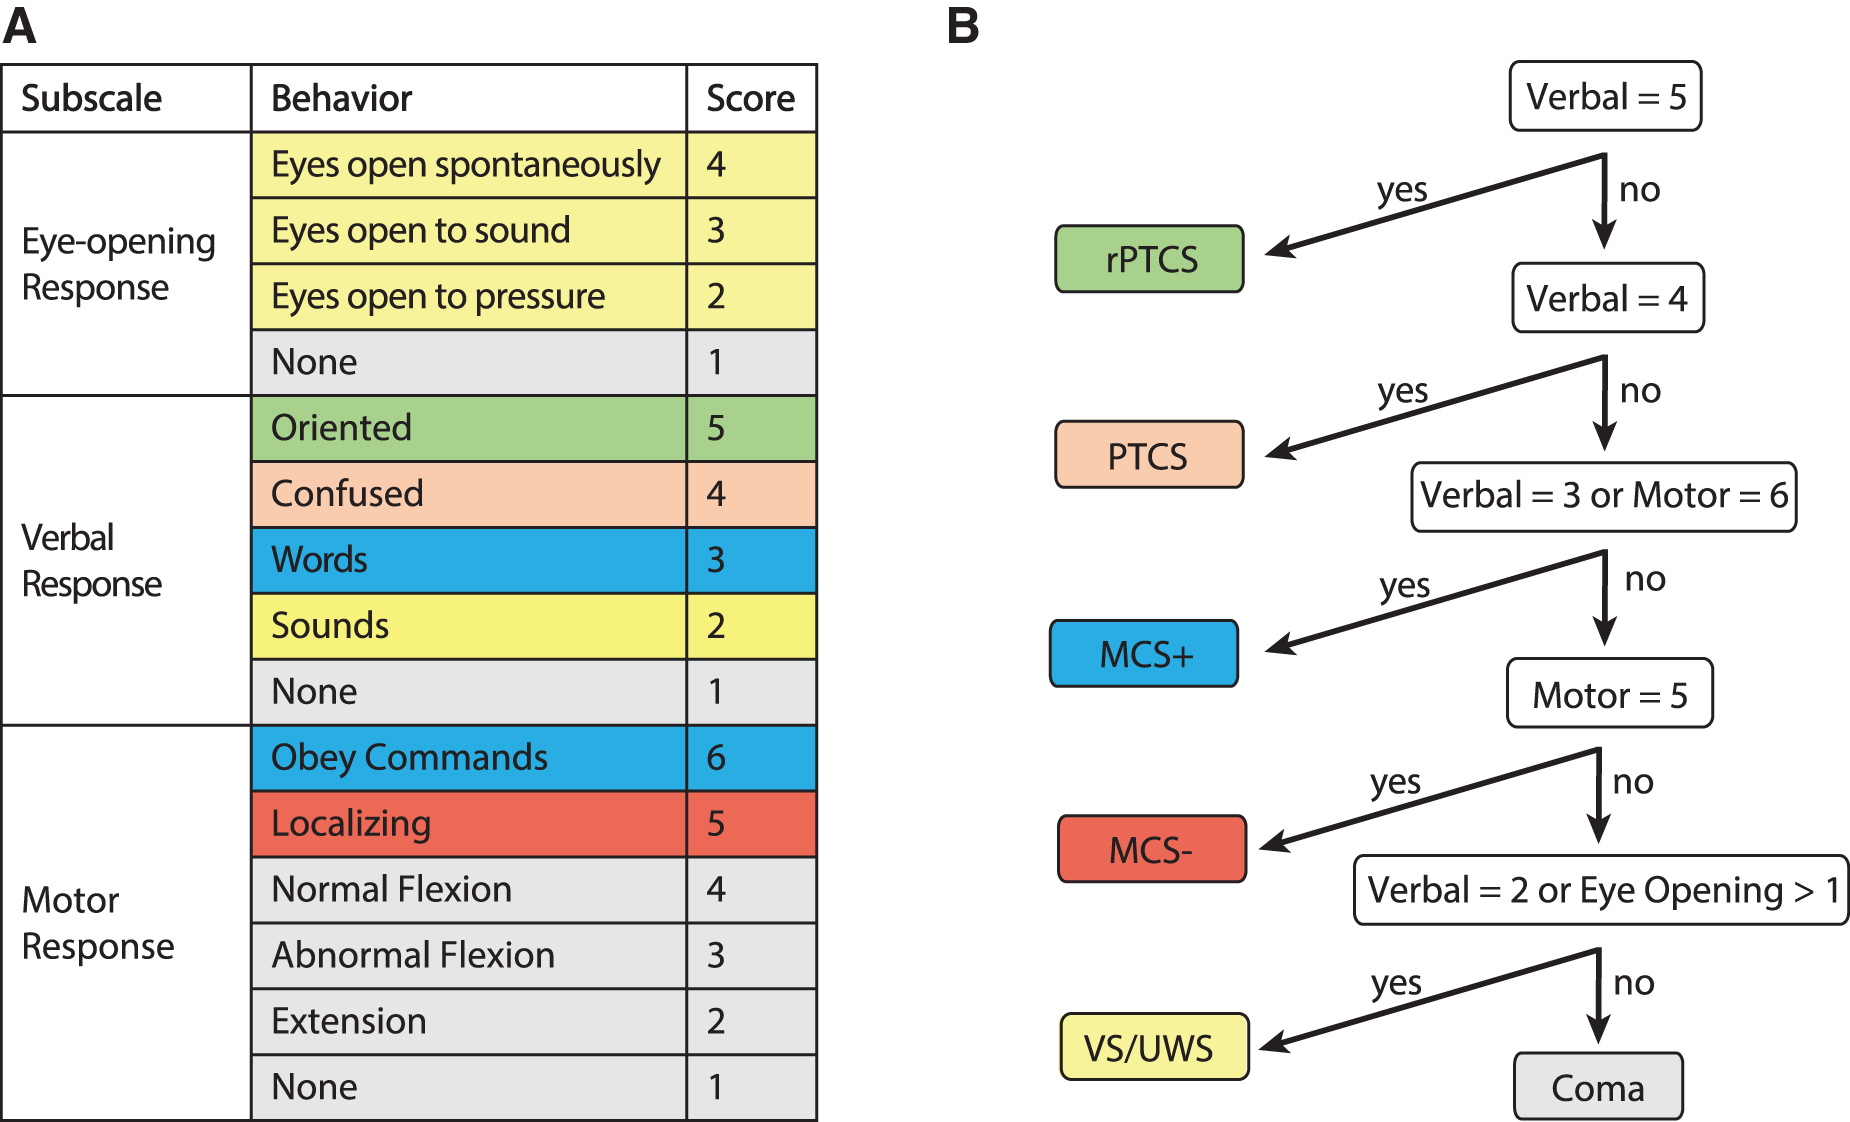
Decision tree associating individual Glasgow Coma Scale (GCS) subscale behaviors with disorder of consciousness (DoC) diagnoses. (
We calculated the number of times each GCS subscale score combination was observed in the 39,348 unconfounded GCS scores and, separately, the 28,902 GCS total scores with documented intubation. Because the first GCS score is often used to determine eligibility for clinical trials, we repeated this analysis using each subject's first GCS score, rather than all available GCS scores. Finally, we selected four subjects from the TRACK-TBI dataset to illustrate the challenges that arise when relying on GCS total scores for clinical management or research.
Data analysis
For each GCS total score, we calculated: (1) the proportion of GCS subscale score combinations that could result in each DoC diagnosis; (2) the proportion of all GCS total scores that are associated with each DoC diagnostic category in the TRACK-TBI dataset; and (3) the proportion of TRACK-TBI subjects whose first valid GCS total score is associated with each DoC diagnostic category. Data summaries and descriptive statistics were compiled in Microsoft Access. TRACK-TBI data collection protocols, case report forms, and data sharing information can be found on the TRACK-TBI webpage. 26
Results
Participants
Demographic and clinical characteristics are provided in Table 1. Briefly, mean (standard deviation) age was 41.9 (17.6) years, and 69% were male. Using the traditional characterization of severity via ED GCS total scores, 13% (n = 314) had a severe, 5% (n = 119) had a moderate, and 82% (n = 1,975) had a mild TBI. For hospitalized participants, GCS data were collected for mean (standard deviation) 2.4 (2.9) days, (median [interquartile range, IQR] = 1.5 [0.3–4.0] days, maximum 62 days). More than 90% of the GCS scores were obtained within the first seven days post-injury (Supplementary Fig. S2), and each patient was assessed on average 16.0 (21.8) times (median [IQR] = 8 [2, 21.5] assessments, maximum = 263 assessments, Supplementary Fig. S3)
Patient Demographics and Injury Characterization
SD, standard deviation; ED, emergency department; GCS, Glasgow Coma Scale; IC, intensive care unit.
Subjects with at least one valid GCS score.
Potential GCS total score combinations and associated level of consciousness
Each GCS total score is associated with between one and 18 different combinations of GCS subscale scores. The 120 GCS combinations and associated DoC diagnoses are displayed in Supplementary Table S1. Variability in DoC diagnoses is highest with GCS total scores of 7–10, each of which can result in a spectrum of DoC diagnoses (i.e., VS/UWS, MCS-, MCS+, PTCS, or rPTCS, [Fig. 2]). The only GCS total scores that invariably identify patients who are unconscious (coma or VS/UWS) are 3 and 4, and that invariably identify patients who have emerged from MCS (PTCS or rPTCS) are 14 and 15. Notably, a GCS total score of 7 or 8 cannot result in a diagnosis of coma, while a diagnosis of MCS is possible with any GCS total score in the range of 5–13.
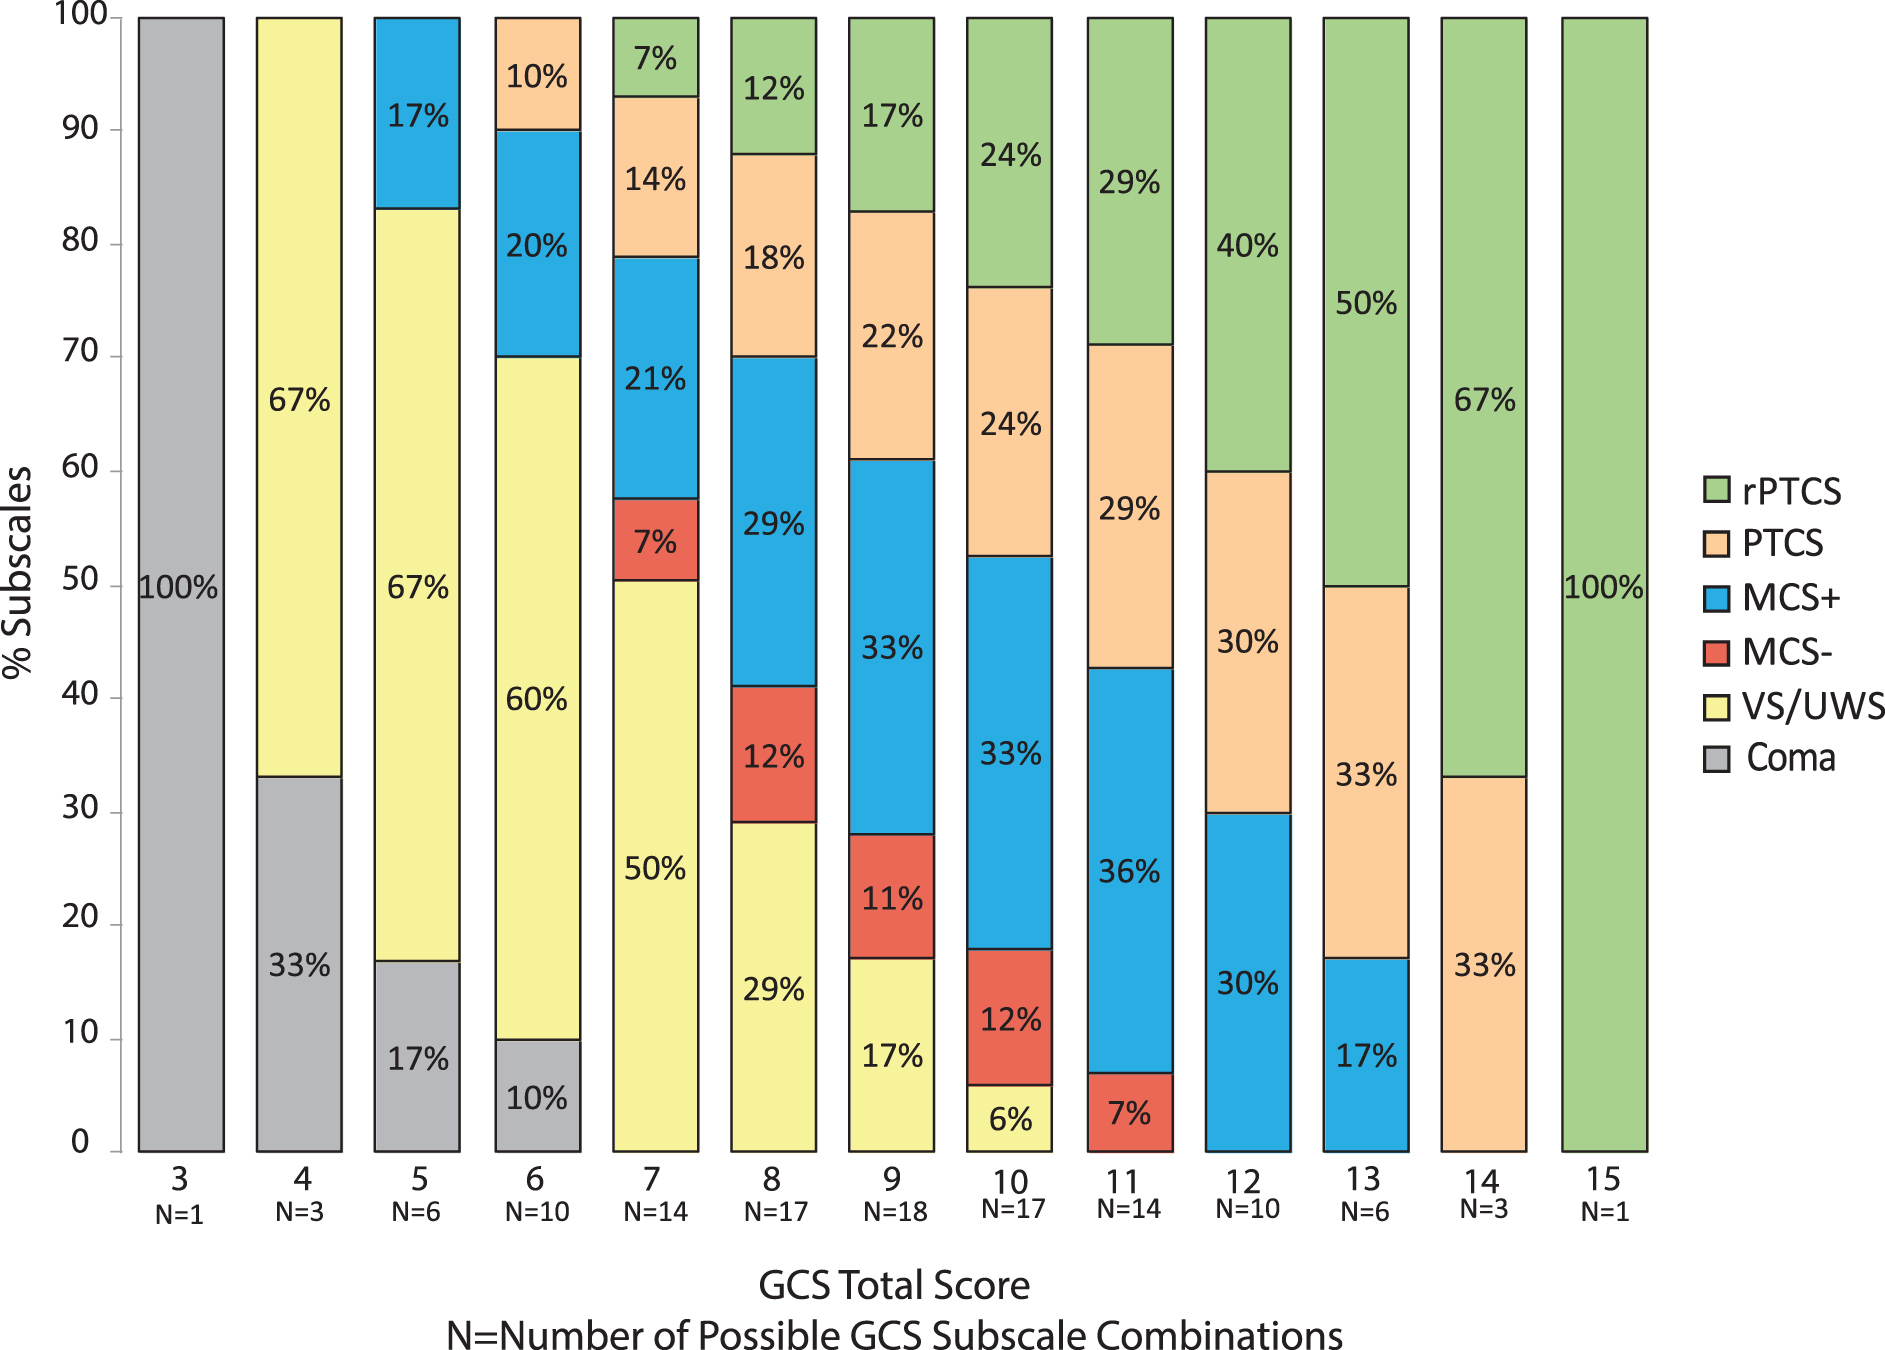
Frequency of disorder of consciousness (DoC) diagnoses by Glasgow Coma Scale (GCS) total score. The GCS comprises three subscales: eye opening, motor, and verbal responses. There are 120 possible combinations of subscale scores, each of which can be associated with a DoC diagnosis. All scores other than 3 and 15 are associated with multiple DoC diagnoses. Scores of 7–11 have the largest number of potential subscale combinations. The “N” below each GCS total score indicates the number of possible GCS subscale score combinations for each GCS total score. For example, there are 18 different ways a GCS total score of 9 could be achieved. rPTCS, recovered from PTCS (best GCS subscale score is GCS verbal = 5); PTCS, post-traumatic confusional state (best GCS subscale score is GCS verbal = 4); MCS+, minimally conscious state with evidence of language function (best GCS subscale score is GCS verbal = 3 or GCS motor = 6); MCS-, MCS without evidence of language function GCS (best GCS subscale score is GCS motor = 5); VS/UWS, vegetative state/unresponsive wakefulness syndrome (best GCS subscale score is GCS eye opening >1 or verbal = 2). Color image is available online.
Interestingly, because the only GCS behavior indicative of MCS- is localization (motor = 5), the lowest GCS total score associated with an MCS- diagnosis is 7 (eyes = 1, verbal = 1, motor = 5) while the lowest score associated with an MCS+ diagnosis is 5 (eyes = 1, verbal = 3, motor = 1).
Analysis of GCS data in the TRACK-TBI study
The frequency with which each of the 120 GCS subscale score combinations occurs in the TRACK-TBI dataset is provided in Supplementary Table 1. Not all GCS combinations and total scores are represented equally in this TRACK-TBI sample. Higher-level GCS behaviors are more prevalent, reflecting the characteristics of the TRACK-TBI dataset and the separate analysis of scores confounded by intubation (Supplementary Fig. S4). Approximately 25% of the 120 GCS combinations were never observed across the entire TRACK-TBI dataset (Supplementary Table S2).
In the TRACK-TBI dataset, the only GCS total scores that were always associated with coma or VS/UWS were 3, 4, 5, and 6, and the only total scores that were always associated with recovery from MCS (i.e., PTCS, rPTCS) were 14 and 15. The variability of DoC diagnoses was highest for GCS scores of 7–12 (Fig. 3). For example, a GCS total score of 8, which, by convention, indicates a severe injury and is sometimes used to define coma, was observed 654 times and was associated with coma in 0%; VS/UWS in 5%; MCS- in 78%; and MCS+ in 17% of scores. Conversely, different total scores were associated with the same DoC diagnoses. For example, a diagnosis of MCS- was associated with between 83% and 19% of GCS total scores of 7, 8, 9, 10, and 11.

Frequency of disorder of consciousness (DoC) diagnoses by Glasgow Coma Scale (GCS) total score in the Transforming Research and Clinical Knowledge in Traumatic Brain Injury (TRACK-TBI) database. We assigned a DoC diagnosis to 39,348 GCS scores from 2455 patients in the TRACK-TBI database based on the Decision Tree algorithm in Figure 1. Each color represents a different DoC diagnosis. Total scores ranging from 7–11 had the highest variability, such that a single GCS score could indicate multiple different DoC diagnoses, while different GCS total scores could indicate the same DoC diagnosis. The “N” below each GCS total score indicates the number of times each GCS total score occurs in the TRACK-TBI database. rPTCS, recovered from PTCS (best GCS subscale score is GCS verbal = 5); PTCS, post-traumatic confusional state (best GCS subscale score is GCS verbal = 4); MCS+, minimally conscious state with evidence of language function (best GCS subscale score is GCS verbal = 3 or GCS motor = 6); MCS-, MCS without evidence of language function GCS (best GCS subscale score is GCS motor = 5); VS/UWS, vegetative state/unresponsive wakefulness syndrome (best GCS subscale score is GCS eye opening >1 or verbal = 2). Color image is available online.
Results were similar when evaluating only the first valid GCS score across TRACK-TBI subjects (Supplementary Fig. S5). Results of the secondary analysis imputing the GCS verbal score for intubated patients are in the Supplementary Materials text and Supplementary Table S3.
Case studies
We present four scenarios to illustrate how use of GCS total scores may result in misleading interpretation of level of consciousness (Fig. 4). For Participants 1 and 2, GCS subscale behavioral profiles result in a total score of 8 and an injury categorization of “severe.” For Participant 1, however, the profile is consistent with VS/UWS, while for Participant 2 the profile is consistent with MCS+. For Participants 3 and 4, the GCS total score differs by three points—total score = 7 versus 10—corresponding to severe and moderate injury, respectively. Nevertheless, the behavioral profiles both reflect the same level of consciousness (i.e., MCS-).

Case illustrations of the variable association between Glasgow Coma Scale (GCS) total scores and disorder of consciousness (DoC) diagnoses. For Participants 1 and 2, GCS subscale score behavioral profiles result in a total score of 8 and a severe injury categorization. For Participant 1, however, the profile is consistent with a DoC diagnosis of vegetative state/unresponsive wakefulness syndrome (VS/UWS), while for Participant 2, the profile is consistent with minimally conscious state with evidence of language function (MCS+). Characterizing both patients as having a “severe” injury ignores the highly variable approach toward clinical management applied to patients who are unconscious versus those who are conscious and following commands. 17 With regard to research, both Participants 1 and 2 would be allocated to the same study arm based on the total GCS score, despite having markedly different levels of consciousness. This would result in a heterogenous group and make it more difficult to determine differences in treatment efficacy or outcome. For participants 3 and 4 the GCS total scores differ by 3 points, and the total scores are consistent with severe versus moderate injury, respectively. Nevertheless, the behavioral profiles both reflect an MCS without evidence of language function (MCS-) level of consciousness. In this case, ascribing different injury severity categories based on the total score would create an erroneous distinction between Participants 3 and 4 who are, in fact, functioning at the same level. In a research study, these two patients may be placed in separate severity groups, or one participant may be excluded, creating an artificial distinction based on GCS total scores that is not supported by the actual level of consciousness. Consequently, this may obscure the effect of treatment, reflecting instead heterogeneity across study groups. VS/UWS, vegetative state/unresponsive wakefulness syndrome (best GCS subscale score is GCS eye opening >1 or verbal = 2); MCS+, minimally conscious state with evidence of language function (best GCS subscale score is GCS verbal = 3 or GCS motor = 6); MCS-, MCS without evidence of language function GCS (best GCS subscale score is GCS motor = 5). Color image is available online.
Discussion
In this study of 2455 participants with acute TBI, we found substantial heterogeneity in the level of consciousness associated with GCS total scores. While identical total scores reflected different levels of consciousness, different total scores reflected the same level of consciousness. Lower GCS total scores did not always indicate a more severe injury, and vice versa. Importantly, although a GCS total score of 8 is often used as the threshold to operationally define “coma” in clinical trials, no patients with GCS total scores of 7 or 8 had a diagnosis of coma. Given the prognostic relevance of precise assessment of level of consciousness 22,32 and the importance of consistent subject stratification in clinical trials, 6 the GCS total score may, therefore, be a suboptimal tool for defining TBI severity or monitoring recovery. Our results support previous studies suggesting that the behavioral subscale profile underlying the total GCS score may be more clinically meaningful than the total score itself 7,11,14,15 and shed new light on the limitations of the GCS total score as a clinical and investigational tool.
In this study, we showed that the GCS total score does not differentiate DoC diagnoses. 19 The GCS subscales, however, are also limited because they omit behaviors, such as visual pursuit, 23 that are necessary to distinguish between VS/UWS, MCS-, and MCS+. Failing to assess these behaviors could contribute to misdiagnosis, inaccurate prognosis, and heterogeneous clinical trial samples. GCS items also lack a standardized approach for subscale administration and a consistent way of documenting factors such as sedation and intoxication that influence performance. 3 Guidance on how to assess behaviors such as command-following and what criteria must be met to document a localizing response are needed to ensure that changes in scores reflect the patient's true responsiveness rather than the examiner's approach toward administration of the measure. Recognizing these limitations of the GCS, the original authors have provided additional recommendations to aid in proper use of the subscale and total GCS scores. 31
When one or more GCS subscales are confounded, the opportunity to detect conscious awareness is further reduced. In such cases, it is especially important to review individual behaviors rather than total scores and to conduct further comprehensive assessments aimed at differentiating VS/UWS from MCS.
Approaches aimed at providing a score for confounded subscales, such as applying imputation algorithms or assigning the lowest possible value of “1”, may lead to misclassification of level of consciousness. In fact, we found that imputing verbal subscale scores drastically and artificially reduced the opportunity to observe the various DoC diagnoses associated with each GCS total score. Although there are alternate approaches to imputing confounded GCS verbal scores, none address the issue of reduced variability, and there are no reliable approaches for imputing confounded eye and motor subscale scores. Therefore, when one or more GCS subscales are confounded, an accurate total score cannot be calculated. The Full Outline of UnResponsiveness (FOUR) score is designed to overcome some of the limitations of the GCS. The FOUR score, however, also omits behaviors associated with MCS, has not been validated in TBI, and lacks strong psychometrical properties. 9,33
Of the 120 combinations of the GCS total score, about 25% were not observed a single time across our sample of 39,348 GCS scores. This finding suggests that some GCS subscale combinations are clinically unlikely to co-occur. Observation of these infrequent combinations clinically and in research may signal errors in administration or scoring or a failure to identify confounding factors.
Our mapping of GCS behaviors onto levels of consciousness was conducted objectively based on published diagnostic criteria. Because the GCS does not test all behaviors associated with each DoC diagnosis, however, the DoC diagnoses we associated with GCS behaviors are approximations and not intended for clinical diagnostic purposes. Further, because our study relies on a conceptual mapping of GCS behaviors onto DoC diagnoses and our sample is heavily weighted toward mild TBI, follow-up studies that prospectively evaluate level of consciousness using a comprehensive standardized bedside assessment in a large cohort of participants with severe TBI will be needed to confirm our findings.
Interestingly, the GCS motor subscale has been shown to be more sensitive for classifying injury severity 34,35 and predicting survival, 11 compared with the GCS total score, although this may not be the case for older patients. 36 Given that the GCS eye-opening subscale does not include any behaviors differentiating VS from MCS and that the verbal subscale is often confounded by intubation, GCS motor subscale may also be the most likely to accurately characterize 6- and 12-month outcome.
Finally, the utility of GCS scores for assessing consciousness may vary based on patient acuity and setting. For patients with GCS ≤ 8, regardless of the subscale composition of this score (e.g., E3, V2, M3 verses E2, V1T, M5), current guidelines from the Brain Trauma Foundation recommend neurosurgical intervention to place an intracranial pressure monitoring device. 37 Whether outcome is affected by the GCS subscale composition of the total score that leads to the neurosurgical intervention is unknown. Our findings, however, suggest that knowledge of the subscale scores may be important even in the setting of rapid triage for clinical procedures, to the extent that these decisions are informed by a patient's level of consciousness.
Although more than 90% of GCS scores in this study were obtained within the first seven days post-injury, approximately 0.5% of GCS scores were obtained in what is considered prolonged DoC (more than 28 days post-injury). 32 The generalizability of our findings to patients with prolonged DoC requires further investigation.
In the 45 years since its development, the GCS has continued to have a uniquely prominent role in assessment of TBI. The overwhelming adoption of the GCS is likely related to its historical positioning as one of the first scales to quantify brain injury severity and create a common language around recovery from TBI-related coma. 2 The GCS is also simple and fast to administer and is routinely identified as a statistically significant, if modest, indicator of outcome at the group level. 2,4,10,38
Despite the development of various revisions, 4 however, the prognostic validity of the GCS, even at the subscale level, is insufficient for predicting outcome in individual patients. Nevertheless, early behavioral assessment of TBI, grounded in the GCS, continues to inform individual prognostic discussions that may lead to withdrawal of life-sustaining therapy. More refined methods for quantifying impairments in consciousness that maximize reliability, mitigate misdiagnosis, and hence reduce prognostic errors, are clearly needed.
A standardized measure of level of consciousness with strong psychometric properties that assesses the full range of behaviors underlying DoC diagnosis should complement the GCS evaluation. The CRS-R, 30 a TBI Common Data Element 5 that is recommended by the American Academy of Neurology and the American Congress for Rehabilitation Medicine 31 practice guidelines, meets these criteria. The CRS-R, however, is not validated in the ICU setting and is lengthy, making it difficult to administer in patients with acute TBI who are sedated, rapidly fluctuating, or clinically unstable. An abbreviated version of the CRS-R, the CRS-R FAST (CRS-R For Accelerated Standardized Testing) is currently being investigated (NCT #03549572). The FOUR score is designed for use in the ICU and can be administered in a few minutes, but has limitations for diagnosing DoC, as described above.
Conclusion
Before assigning an injury severity classification based on GCS total scores, clinicians and investigators should, at a minimum, consider the information provided by the GCS behavioral profile and potential confounding factors. Subscale score analysis is especially important for GCS total scores of ≤8 because of the risk of incorrectly establishing a diagnosis of coma. Designing electronic medical record systems to prompt for GCS subscale scores and potential confounds may aid in ensuring routine documentation of this information. Accurate clinical assessment and successful clinical trials will ultimately necessitate comprehensive behavioral measures that rigorously and reliably classify patients according to their level of consciousness, cognition, and function.
TRACK-TBI Investigators
Neeraj Badjatia, University of Maryland, College Park, MD; Ann-Christine Duhaime, MassGeneral Hospital for Children, Boston, MA; Adam R. Ferguson, University of California, San Francisco, San Francisco, CA; Etienne Gaudette, PhD, University of Toronto, Toronto, Ontario, Canada; Shankar Gopinath, Baylor College of Medicine, Houston, TX; C. Dirk Keene, University of Washington, Seattle, WA; Michael McCrea, Medical College of Wisconsin, Wauwatosa, WI; Randall Merchant, Virginia Commonwealth University, Richmond, VA; Pratik Mukherjee, University of California, San Francisco, San Francisco, CA; Laura B. Ngwenya, University of Cincinnati, Cincinnati, OH; David Okonkwo, University of Pittsburgh, Pittsburgh, PA; Ava Puccio, University of Pittsburgh, Pittsburgh, PA; Gabriella Sugar, University of California, San Francisco, San Francisco, CA; David Schnyer, University of Texas, Austin, Austin, TX; John K. Yue, University of California, San Francisco, San Francisco, CA; Ross Zafonte, Harvard Medical School, Boston, MA.
Footnotes
Authors' Contributions
Yelena G. Bodien: study concept, design and oversight, acquisition, analysis, and interpretation of data, drafting/revising the manuscript, critical revision of the manuscript for intellectual content; Alice Barra: study concept, interpretation of data, drafting/revising the manuscript, critical revision of the manuscript for intellectual content; Nancy R. Temkin: study concept, analysis and interpretation of data, drafting/revising the manuscript, critical revision of the manuscript for intellectual content; Jason Barber: analysis and interpretation of data, drafting/revising the manuscript, critical revision of the manuscript for intellectual content; Brandon Foreman: study concept, design and interpretation of data, drafting/revising the manuscript, critical revision of the manuscript for intellectual content; Mary Vassar: study concept, design and interpretation of data, drafting/revising the manuscript, critical revision of the manuscript for intellectual content; Claudia Robertson: study concept, design and interpretation of data, drafting/revising the manuscript, critical revision of the manuscript for intellectual content; Sabrina R. Taylor: study concept, design and interpretation of data, drafting/revising the manuscript, critical revision of the manuscript for intellectual content; Amy J. Markowitz: study concept, drafting/revising the manuscript, critical revision of the manuscript for intellectual content Geoffrey T. Manley, Joseph T. Giacino, and Brian L. Edlow: study concept, design and oversight, acquisition, analysis, and interpretation of data, drafting/revising the manuscript, critical revision of the manuscript for intellectual content. Neeraj Badjatia, Pratik Mukherjee, David Okonkwo, Ava Puccio: study metrics development/validation, data collection, data quality/curation; Ann-Christine Duhaime: study metrics development/validation, data collection, data quality/curation, critical revision of the manuscript for intellectual content; Adam R. Ferguson: data analysis and biostatistical support; Etienne Gaudette: study metrics development/validation; Shankar Gopinath: data collection; C. Dirk Keene: data collection, data quality/curation, critical revision of the manuscript for intellectual content; Michael McCrea: study metrics development/validation; Randall Merchant: collection, data quality/curation: Laura B. Ngwenya: data collection, data quality/curation; Gabriella Sugar, David Schnyer, John K. Yue: data collection, data quality/curation; Ross Zafonte: study metrics development/validation
Funding Information
This study was supported by the NIH National Institute of Neurological Disorders and Stroke (R21NS109627, RF1NS115268, UH3NS095554, U01 NS1365885, U01-NS086090), NIH Director's Office (DP2 HD101400), National Institute on Disability, Independent Living and Rehabilitation Research (NIDILRR), Administration for Community Living (90DPCP0008-01-00, 90DP0039), James S. McDonnell Foundation, and Tiny Blue Dot Foundation, U.S. Department of Defense (W81XWH-14-2-0176, X81XWH-18-DMRDP-PTCRA), National Science Foundation (1014552)
Author Disclosure Statement
Y.G. Bodien reports funding from: NIH National Institute of Neurological Disorders and Stroke ( U01 NS1365885, U01-NS086090), National Institute on Disability, Independent Living and Rehabilitation Research (NIDILRR), Administration for Community Living (90DPCP0008-01-00, 90DP0039), James S. McDonnell Foundation, and Tiny Blue Dot Foundation; A. Barra reports funding from: National Institute on Disability, Independent Living and Rehabilitation Research (NIDILRR), Administration for Community Living (90DPCP0008- 01-00, 90DP0039); N. R. Temkin reports funding from: NIH National Institute of Neurological Disorders and Stroke ( U01 NS1365885, U01-NS086090), US Department of Defense (W81XWH-14-2-0176); J. Barber reports funding from: NIH National Institute of Neurological Disorders and Stroke (U01-NS086090), US Department of Defense (W81XWH-14-2-0176); B. Foreman reports funding from: NIH National Institute of Neurological Disorders and Stroke (U01-NS086090), US Department of Defense (X81XWH-18-DMRDP-PTCRA), National Science Foundation (1014552); M. Vassar reports funding from: NIH National Institute of Neurological Disorders and Stroke (U01- NS086090), US Department of Defense (W81XWH-14-2-0176); C. Robertson reports funding from: NIH National Institute of Neurological Disorders and Stroke (U01-NS086090); S. R. Taylor reports funding from: NIH National Institute of Neurological Disorders and Stroke (U01-NS086090); A.J. Markowitz reports funding from: NIH National Institute of Neurological Disorders and Stroke (U01-NS086090); G.T. Manley reports funding from: NIH National Institute of Neurological Disorders and Stroke (U01-NS086090); J. T. Giacino reports funding from: NIH National Institute of Neurological Disorders and Stroke (U01-NS086090, UH3NS095554), US Department of Defense (W81XWH-14-2-0176), National Institute on Disability, Independent Living and Rehabilitation Research (NIDILRR), Administration for Community Living (90DPCP0008-01-00, 90DP0039); B. L. Edlow reports funding from: NIH National Institute of Neurological Disorders and Stroke (R21NS109627, RF1NS115268), NIH Directors Office (DP2 HD101400), James S. McDonnell Foundation, and Tiny Blue Dot Foundation.
Supplementary Material
>Supplementary Text
Supplementary Table S1
Supplementary Table S2
Supplementary Table S3
Supplementary Figure S1
Supplementary Figure S2
Supplementary Figure S3
Supplementary Figure S4
Supplementary Figure S5
References
Supplementary Material
Please find the following supplemental material available below.
For Open Access articles published under a Creative Commons License, all supplemental material carries the same license as the article it is associated with.
For non-Open Access articles published, all supplemental material carries a non-exclusive license, and permission requests for re-use of supplemental material or any part of supplemental material shall be sent directly to the copyright owner as specified in the copyright notice associated with the article.
