




Abstract
Neuroinflammation is an important mediator of secondary injury pathogenesis that exerts dual beneficial and detrimental effects on pathophysiology of the central nervous system (CNS) after traumatic brain injury (TBI). Fluvoxamine is a serotonin selective reuptake inhibitor (SSRI) and has been reported to have the anti-inflammatory properties. However, the mechanisms and therapeutic effects of fluvoxamine in neuroinflammation after TBI have not be defined. In this study, we showed that fluvoxamine inhibited peripheral immune cell infiltration and glia activation at 3 days in mice subjected to TBI. Fluvoxamine treatment promoted microglial/macrophage phenotypic transformation from pro-inflammatory M1-phenotype to anti-inflammatory M2-phenotype in in vivo and in vitro experiments. In addition, fluvoxamine treatment attenuated neuronal apoptosis, blood–brain barrier (BBB) disruption, cerebrovascular damage, and post-traumatic edema formation, thereby improving neurological function of mice subjected to TBI. These findings support the clinical evaluation of fluvoxamine as a neuroprotective therapy for TBI.
Introduction
Traumatic brain injury (TBI) is a leading cause of mortality and disability among young people worldwide, bringing heavy economic burdens and physical dysfunction to patients. 1,2 It has been well established in both human research and experimental models of TBI that TBI induces a series of complex inflammatory response cascades in the acute post-injury period, which are related to the recruitment of circulating immune cells, including T cells, B cells, neutrophil cells, natural killer (NK) cells, and macrophages. 3 In addition, microglia/macrophages, as the resident immune cells in the central nervous system (CNS), undergo activation, migration, and polarization post-injury and play crucial roles in neuroinflammation after TBI. 4
Serotonin selective reuptake inhibitors (SSRIs) have been reported to activate sigma-1 receptor (Sig-1R) 5 and exert anti-inflammatory effects in both in vitro and in vivo models of inflammation. 6 –8 Among all SSRIs, fluvoxamine has been reported to have the highest affinity with Sig-1R and the strongest activity at Sig-1R. 9 However, whether fluvoxamine therapy can regulate immunomodulatory process and exert neuroprotective effects after TBI is still unknown. Thus, in the present study, we hypothesized that fluvoxamine treatment would provide neuroprotection for TBI-treated mice by regulating neuroinflammation.
Methods
Animals, mouse model of TBI, drug administration, and experimental groups
A total of 192 male C57BL/6 mice (6–8 weeks old and 20–25 g) were purchased from the Experimental Animal Laboratories of the Academy of Military Medical Sciences (Beijing, China). Mice were housed in the temperature (18℃–22℃) and humidity (50–60%) controlled vivarium with ad libitum access to food and water under a standard 12 h light/dark cycle. All experimental procedures were conducted in strict accordance with the National Institutes of Health (NIH)'s “Guide for the Care and Use of Laboratory Animals” and approved by Tianjin Medical University Animal Care and Use Committee. All procedures were approved by the Chinese Small Animal Protection Association Experimental Protocol.
TBI was induced by a digital electromagnetically controlled cortical impact (CCI) device (eCCI-6.3 device, Custom Design & Fabrication, USA) as previously described. 10 A 4-mm flat impactor tip was used to perform a unilateral 2.5-mm depth impact on the mice at 5 m/sec with a 200 msec dwell time.
Fluvoxamine maleate (Selleck, USA) was dissolved in 0.5% DMSO and was then diluted in 0.9% saline. Next, fluvoxamine or 0.5% DMSO was administered intraperitoneally once per day for 3 consecutive days beginning at 2 h after TBI. Sig-1R antagonist BD-1047 was administered before fluvoxamine treatment. Previous study has shown that intraperitoneal administration of fluvoxamine (20 mg/kg) significantly inhibited inflammatory response in a mice model of sepsis. 11 In this study, three different doses (2, 10, and 30 mg/kg/day) were used for preliminary dose-response analysis to determine the optimal dose of fluvoxamine after brain injury in mice by neurological assessment, measurement of lesion volume, and cerebral cortical perfusion (n = 6 Six mice used to test each dose).
All mice were randomly assigned into the following five groups by a randomized block design: (1) sham mice group (n = 48), (2) sham mice treated with fluvoxamine group (sham+FLV, n = 48), (3) TBI mice treated with 0.5% DMSO group (TBI+vehicle, n = 48), (4) TBI mice treated with fluvoxamine group (TBI+FLV, n = 48), and (5) TBI mice treated with fluvoxamine and BD-1047 group (TBI+FLV+BD-1047, n = 6).
Cell culture, drug administration, and experimental groups
BV2 microglial cells (China Infrastructure of Cell Line Resources, Beijing, China) were cultured in high-glucose Dulbecco's modified eagle medium (DMEM; Corning, Tewksbury, MA, USA) with 10% fetal bovine serum (FBS, Sigma-Aldrich, MO, USA) and 1% penicillin-streptomycin (Hyclone, Logan, UT, USA) in a 5% CO2 incubator at 37°C. To mimic microglial activation in vitro, cells were treated with 1 μg/mL lipopolysaccharide (LPS, Sigma-Aldrich, MO, USA) for 24 h.
All BV2 cell groups were assigned into the following four groups: (1) control cells group (NC), (2) control cells treated with fluvoxamine group (NC+FLV), (3) cells treated with LPS group (LPS), and (4) LPS-induced cells treated with fluvoxamine group (LPS+FLV).
All primary microglial cell groups were assigned into the following five groups: (1) control cells group (NC), (2) control cells treated with fluvoxamine group (NC+FLV), (3) cells treated with LPS group (LPS), (4) LPS-induced cells treated with fluvoxamine group (LPS+FLV), and (5) LPS-induced cells treated with fluvoxamine and BD-1047 group (LPS+FLV+BD-1047).
Cell viability assay
Cell viability was measured by the 3-(4,5-dimethylthiazol-2-yl)-2,5-diphenyltetrazolium bromide (MTT; Sigma-Aldrich, MO, USA) assay as previously reported. 12
Morphological observation by hopping probe ion conductance microscopy
Morphological changes of BV2 microglial cells after different treatments were monitored by hopping probe ion conductance microscopy as previously described. 13 A hopping probe ion conductance microscopy (HPICUM) system was modified from a commercial ICnano Scanning Ion Conductance Microscopy (SICM) system (Ionscope Ltd., UK). After setting the parameters as previously described, different groups of BV2 microglial cells were placed under the HPICUM at room temperature (RT) to continuously and dynamically observe the morphological changes.
Enzyme-linked immunosorbent assay
To examine whether fluvoxamine affects the inflammatory response of LPS-induced BV2 microglial cells, the levels of interleukin (IL)-1β, IL-10, IL-6, and IL-4 in the culture supernatants of the treated cells were measured and quantified by enzyme-linked immunosorbent assay (ELISA) kits (all from j&l biological, Shanghai, China) according to the manufacturer's instructions. The mouse tumor necrosis factor α (TNF)-α ELISA kits were purchased from R&D System.
Neurological assessment
Neurological function was measured using the well-established modified neurological severity score (mNSS) as previous described. 14 mNSS was performed to assess mice neurological functions at 1 day, 3 days, 5 days, 7 days, and 14 days after TBI or sham surgery.
Evans blue extravasation assay
The permeability of the blood–brain barrier (BBB) was assessed by the extravasation of Evans blue dye (EB) as previously described. 15 The brain homogenates were centrifuged at 14,000 rpm for 30 min, and absorption of the supernatant was determined at optical density (OD) 620 nm using a SpectraMax M5 plate-reader (Molecular Devices, Sunnyvale, CA, USA).
Nissl staining
Nissl staining was performed to evaluated neuronal damage as previously reported. 14 The damaged neurons were characterized by a shrunken cytoplasm and condensed staining, whereas normal neurons were characterized by a large and full soma.
Brain water content
Brain water content (BWC) was calculated at 3 days after TBI by using the wet weight-dry weight method as previously described. 16 The weights of tissue samples were immediately measured (wet weight) and subsequently tissue samples were placed in an oven at 100℃ for 48 h until a constant weight (dry weight) was measured. The BWC was calculated as: (wet weight – dry weight)/wet weight × 100%.
Cerebral cortical perfusion
As previously described, 16 cerebral cortical blood perfusion was monitored using a laser speckle imager (PeriCam PSI System, Perimed AB, Sweden). Briefly, the mice were anesthetized by 10% chloral hydrate injection (3 mg/kg) and placed prone in a stereotaxic head frame. A midline incision was made over the skull to expose the calvaria, through which cerebral cortical perfusion was continuously measured for 30 sec at the following settings: 10 cm observation height, 2 × 2 cm laser irradiation area, the PSI system at 1388 × 1038 pixels, and the regional spatial contrast was calculated according to the 3 × 3 secondary matrices. To monitor changes of blood perfusion in the region of cortical injury and whole cortex, the mean value of the two regions of interests (ROIs) were measured respectively, including lesioned area (Area 1; 15 mm2) and whole cerebral cortex (Area 2; 70 mm2). The perfusion data were evaluated using the vendor supplied PIMsoft software (vesion 1.4; Perimed).
Magnetic resonance imaging
Non-invasive measurement of brain edema was performed using a horizonal 9.4T 30-cm bore BioSpec magnetic resonance imaging (MRI) spectrometer (Bruker Biospec 94/30USR, Billerica, MA, USA). Briefly, mice were anesthetized using isoflurane and were placed in a dedicated holder with stereotactic alignment of the head with anesthesia continuously administrated through a nose cone. Respiration rate and core body temperature were monitored with the dedicated physiological monitoring system (SAI, New Jersey, USA). Each whole brain scan was separated into 15 slices. Both high-resolution T2-weighted (T2W) images and diffusion-weighted images (DWI) were acquired during each session. The hyperintensity signal in T2W images at and around the site of cortical impact was identified as brain edema. 17 All hyperintensities were quantified using the freeware image processing software ITK SNAP (version 3.8.0) as previously described. 18 All analyses were done by investigators blinded to experimental groups.
Flow cytometry
For flow cytometry analysis of cellular components in the injured brain, the injured hemisphere of the brain was collected and dissected into small pieces. The pieces were rinsed with cold phosphate-buffered saline (PBS), and then were sieved through a 40-μm nylon cell strainer (BD Bioscience, Franklin Lakes, NJ, USA). The tissue suspension was then resuspended in a 5 mL of 30% Percoll, and slowly layered on top of 5 mL of 70% Percoll followed by centrifugation at 500g for 15 min at RT. Mononuclear cells were collected in the 30–70% interphase and washed twice with cold PBS. The cells were resuspended in 100 μL of flow cytometry staining buffer for further use. Four tubes of single cells were prepared in this study for four different experiments: (1) first tube: CD45-APC, CD11b-FITC, Ly6G-PerCP, Ly6C-PE; (2) second tube: CD45-APC, CD3-PerCP, CD8-BV421, CD4-FITC, CD19-PE-Cy7, NK1.1-PE; (3) third tube: GFAP-APC; and (4) forth tube: CD11b-APC-Cy7, CD68-PE-A, CD86-FITC, CD206-APC. Isotype-matched controls were analyzed to set the appropriate gates for each sample. For each marker, samples were analyzed in duplicate. Flow cytometry was performed on a FACS Aria III apparatus (BD Bioscience) and the obtained data were analyzed by FlowJo software 7.6.1(Tree Star, Ashland, OR, USA).
Immunofluorescence staining
The mice were sacrificed at 3 days after TBI and intracardially perfused with ice-cold PBS; next, the whole brains were removed quickly and fixed in 4% paraformaldehyde (PFA) at 4℃ for 24 h. Then the formaldehyde-fixed brain tissues were flash-frozen and sliced into 8-μm-thick coronal sections using a cryostat (Leica, Model CM1950, Germany). The brain cryosections were washed with PBS and permeabilized with 0.1% Triton X-100 (Sigma Aldrich) for 20 min and 3% bovine serum albumin (BSA) for 1 h at RT. The brain sections were subsequently incubated overnight at 4℃ with primary antibodies, including NeuN (1:100, Abcam, UK), Iba-1 (1:500, Abcam), GFAP (1:500, Abcam), iNOs (1:500, Cell Signaling Technology, USA), Arginase-1 (1:500, Cell Signaling Technology), CD31 (1:500, R&D Systems, USA), laminin (1:100, Abcam), MPO (1:100, Abcam), TNF-α (1:500, Cell Signaling Technology) and AQP-4 (1:500, Abcam).
The sections were then incubated with the appropriate Alexa Fluor-conjugated immunoglobulin G (IgG; 1:500, Invitrogen-Thermo Fisher Scientific, USA) for 1 h at RT in the dark. For observation of apoptotic cortical neurons, double staining of neuronal nuclei (NeuN) and terminal deoxynucleotidyl transferase dUTP nick-end labeling (TUNEL) was performed using the In Situ Cell Death Detection Kit (Roche, South San Francisco, CA, USA) according to the manufacturer's instructions. Finally, the nuclei were counterstained with 4’,6-diamidino-2-phenylidole (DAPI; Abcam) and imaged by an inverted fluorescence microscope (Olympus, Japan).
The numbers of positive cells were identified and counted in three different fields of the right lesioned cortex from six random coronal sections per mouse, and the positive cells were quantified under a microscopic field of 200 × magnification using National Institute of Health (NIH) ImageJ software (Version 1.46r, Bethesda, MD, USA); data were expressed as cells per field. Activated microglia morphology was defined as Iba-1-positive cells with a rod-like, spherical, or amoeboid appearance, and a cell body more than 10 μm in diameter that had a short and thick process, as previously described. 19 Activated astrocyte morphology was defined as glial fibrillary acidic protein (GFAP)-positive cells with characteristic hypertrophy of the cell body that had a short and thick process and with upregulation of GFAP, as previously described. 20 In addition, the fluorescence intensity of a laminin/CD31-positive area and AQP4-positive area were quantified by ImageJ software.
Measurement of lesion volume
For quantification of mouse brain lesion volume at 14 days after TBI, transverse sections were cut at 120-μm continuous intervals to cover the entire injured cortex as previously described. 15 The slices were then stained with hematoxylin and eosin (H&E; Solarbio, Beijing, China) and imaged under a light microscope (Olympus, Japan). Images were analyzed using NIH ImageJ software (Version 1.4; NIH, MD, USA). The ipsilateral and contralateral sides were tracked on each slice to obtain the loss of cortical tissue, and this is multiplied by the known distance between slices to obtain the volumes. The volume of cortical lesion was presented as: (contralateral hemisphere volume-ipsilateral hemisphere volume)/contralateral hemisphere volume × 100%.
Western blot analysis
We sacrificed the mice at 3 days after TBI for western blot analysis as previously described. 15 Proteins samples and pre-stained molecular weight markers (Thermo Fisher Scientific) were separated by sodium dodecyl sulfate-polyacrylamide gel electrophoresis (SDS-PAGE) and transferred to 0.45-um-pore size polyvinylidene difluoride membranes (Millipore, Temecula, CA, USA). Membranes were blocked in 5% non-fat milk in Tris-buffered saline containing 0.1% Tween-20 (TBST) for 2 h at RT and incubated at 4℃ overnight with the following primary antibodies: claudin-5 (1:1000, Abcam), Bcl-2 (1:500, Cell Signaling Technology), Bax (1:1000, Cell Signaling Technology), laminin (1:1000, Abcam), MPO (1:1000, Abcam), ZO-1 (1:1000, Abcam), MMP-9 (1:1000, Abcam), AQP-4 (1:500, Abcam), occludin (1:1000, Protech, USA), caspase-9 (1:1000, Cell Signaling Technology), COX-2 (1:1000, Abcam), cleaved-caspase-3 (1:1000, Cell Signaling Technology), PARP-1 (1:500, Abcam), Iba-1(1:500, Abcam), iNOs (1:500, Cell Signaling Technology), Arginase-1 (1:500, Cell Signaling Technology), TNF-α (1:500, Cell Signaling Technology), IL-6 (1:500, Cell Signaling Technology), IL-1β (1:500, Cell Signaling Technology), IL-10 (1:1000, Abcam), and β-actin (1:1000, Cell Signaling Technology).
Thereafter, membranes were washed with TBST and then incubated with appropriate secondary antibodies (1:5000, Cell Signaling Technology) for 1 h at RT. The immunoblot bands were probed with a Chemiluminescent HRP Substrate (EMD Millipore Corporation, USA) and visualized under an imaging system (Bio-Rad, Hercules, CA, USA). Gray value analysis was quantified by Image-J software. Expression levels of all proteins were normalized against β-actin.
Statistical analysis
All statistical analysis was performed with Graph-Pad Prism software (Graph Pad Software, Version 8.1.2 San Diego, CA, USA). Non-parametric data from the mNSS test were analyzed using the Kruskal-Wallis H analysis followed by a Mann-Whitney U test. Two-way analysis of variance (ANOVA) with repeated measures followed by Tukey's multiple comparison post hoc test was used to analyze cerebral cortical perfusion. Part of the data was analyzed using one-way ANOVA followed by Tukey's multiple comparison post hoc test. The majority of the data was analyzed using a two-way ANOVA (vehicle vs. FLV and sham/control vs. TBI/LPS) with Tukey's multiple comparison post hoc test. The results were expressed as means ± standard error of the mean (SEM). A probability value of p < 0.05 was considered statistically significant.
Results
Fluvoxamine exerted anti-inflammatory effects in a dose-dependent manner in LPS-induced BV2 and primary microglial cells
Fluvoxamine at concentrations 1.25, 2.5, 5, and 10 μM showed no significant toxic effects, but it induced significant toxicity at 20 μM and higher in BV2 cells (Fig. 1A,B). Fluvoxamine treatment resulted in a significant downregulation of NO levels in a dose-dependent manner (Fig. 1C). In addition, Fluvoxamine treatment also significantly inhibited the expression of iNOs and COX-2 in a dose-dependent manner (Fig. 1D,E). Because there is no significant difference in anti-inflammatory effects between 5 μM fluvoxamine and 10 μM fluvoxamine, based on the principle of minimizing drug toxicity, 5 μM fluvoxamine was considered as the optimal concentration in a subsequent in vitro BV2 cells experiment.
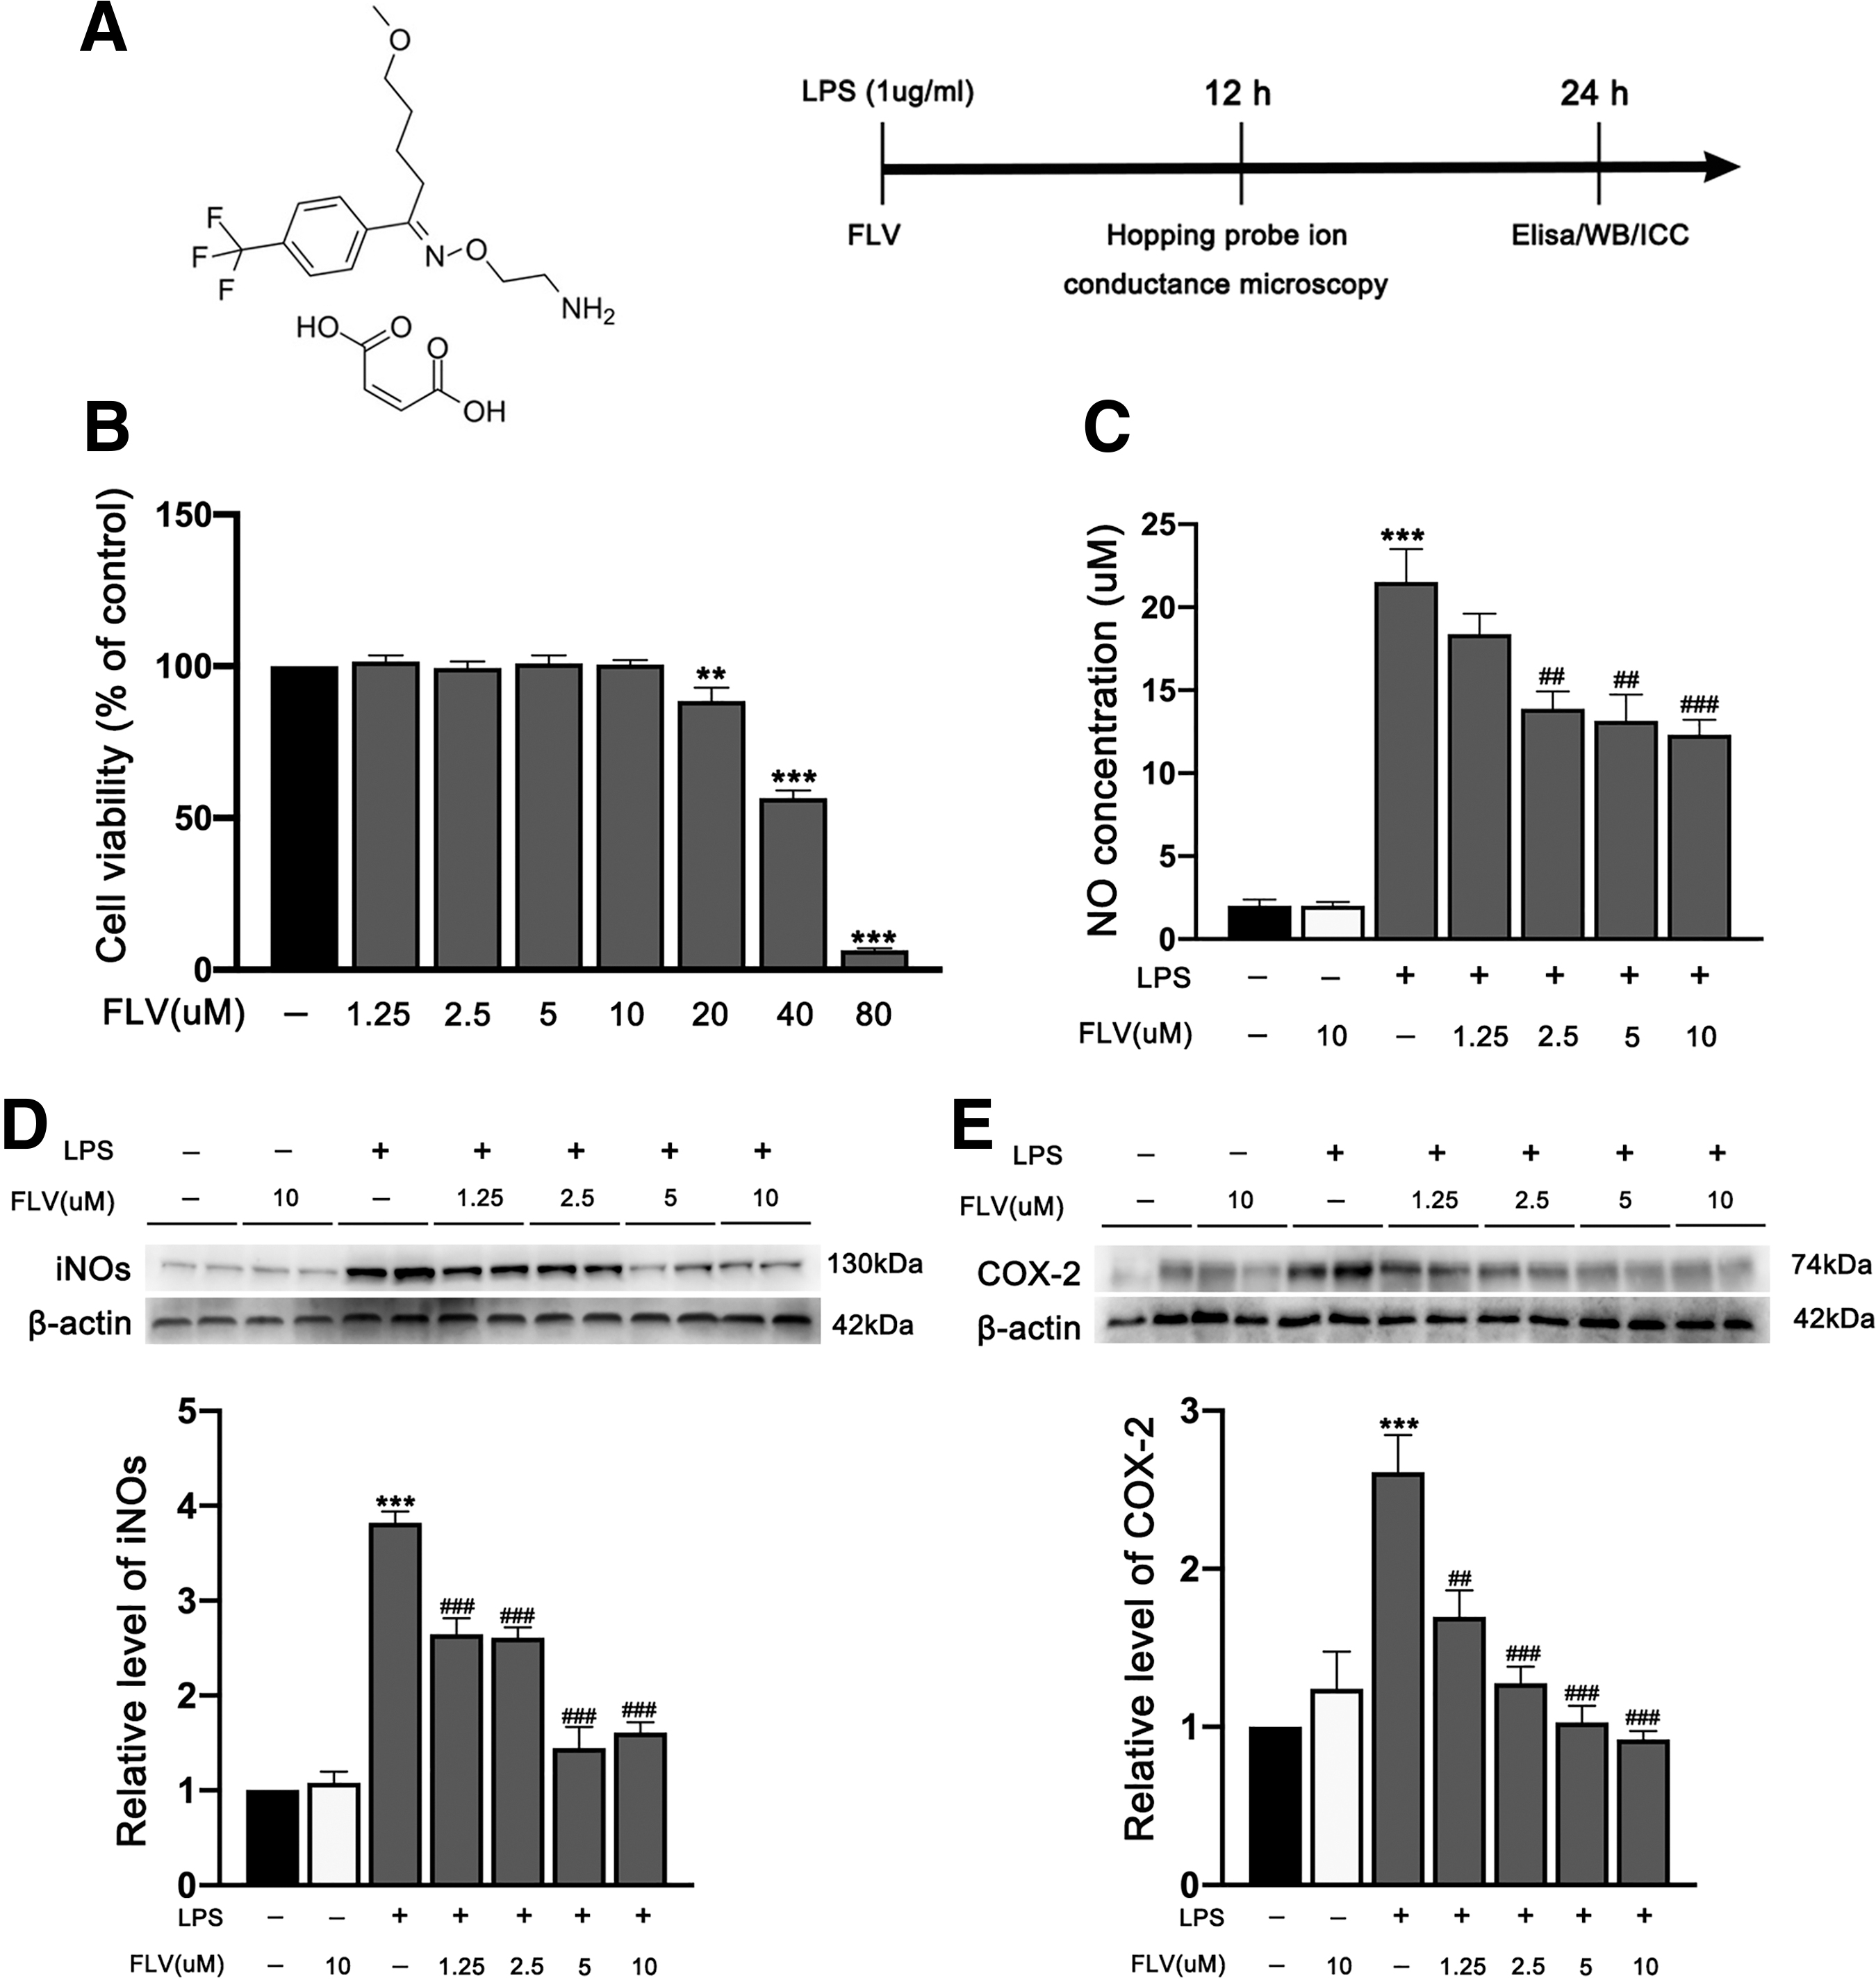
Effects of fluvoxamine on cell viability and the inflammatory response in LPS-induced BV2 microglial cells.
We then validated the effects of fluvoxamine on primary microglial cells. Fluvoxamine at concentrations 2.5, 5, 10, 20, and 40 μM showed no significant toxic effects, but it induced significant toxicity at 80 μM and higher in primary microglial cells (Fig. 2A). Fluvoxamine treatment resulted in a significant downregulation of NO levels in a dose-dependent manner (Fig. 2B). Additionally, fluvoxamine treatment also significantly inhibited the expression of iNOs and COX-2 in a dose-dependent manner in primary microglial cells (Fig. 2C,D). Because there is no significant difference in anti-inflammatory effects between 10 μM fluvoxamine and 20 μM fluvoxamine, based on the principle of minimizing drug toxicity, 10 μM fluvoxamine was considered as the optimal concentration in a subsequent in vitro primary microglial cells experiment.
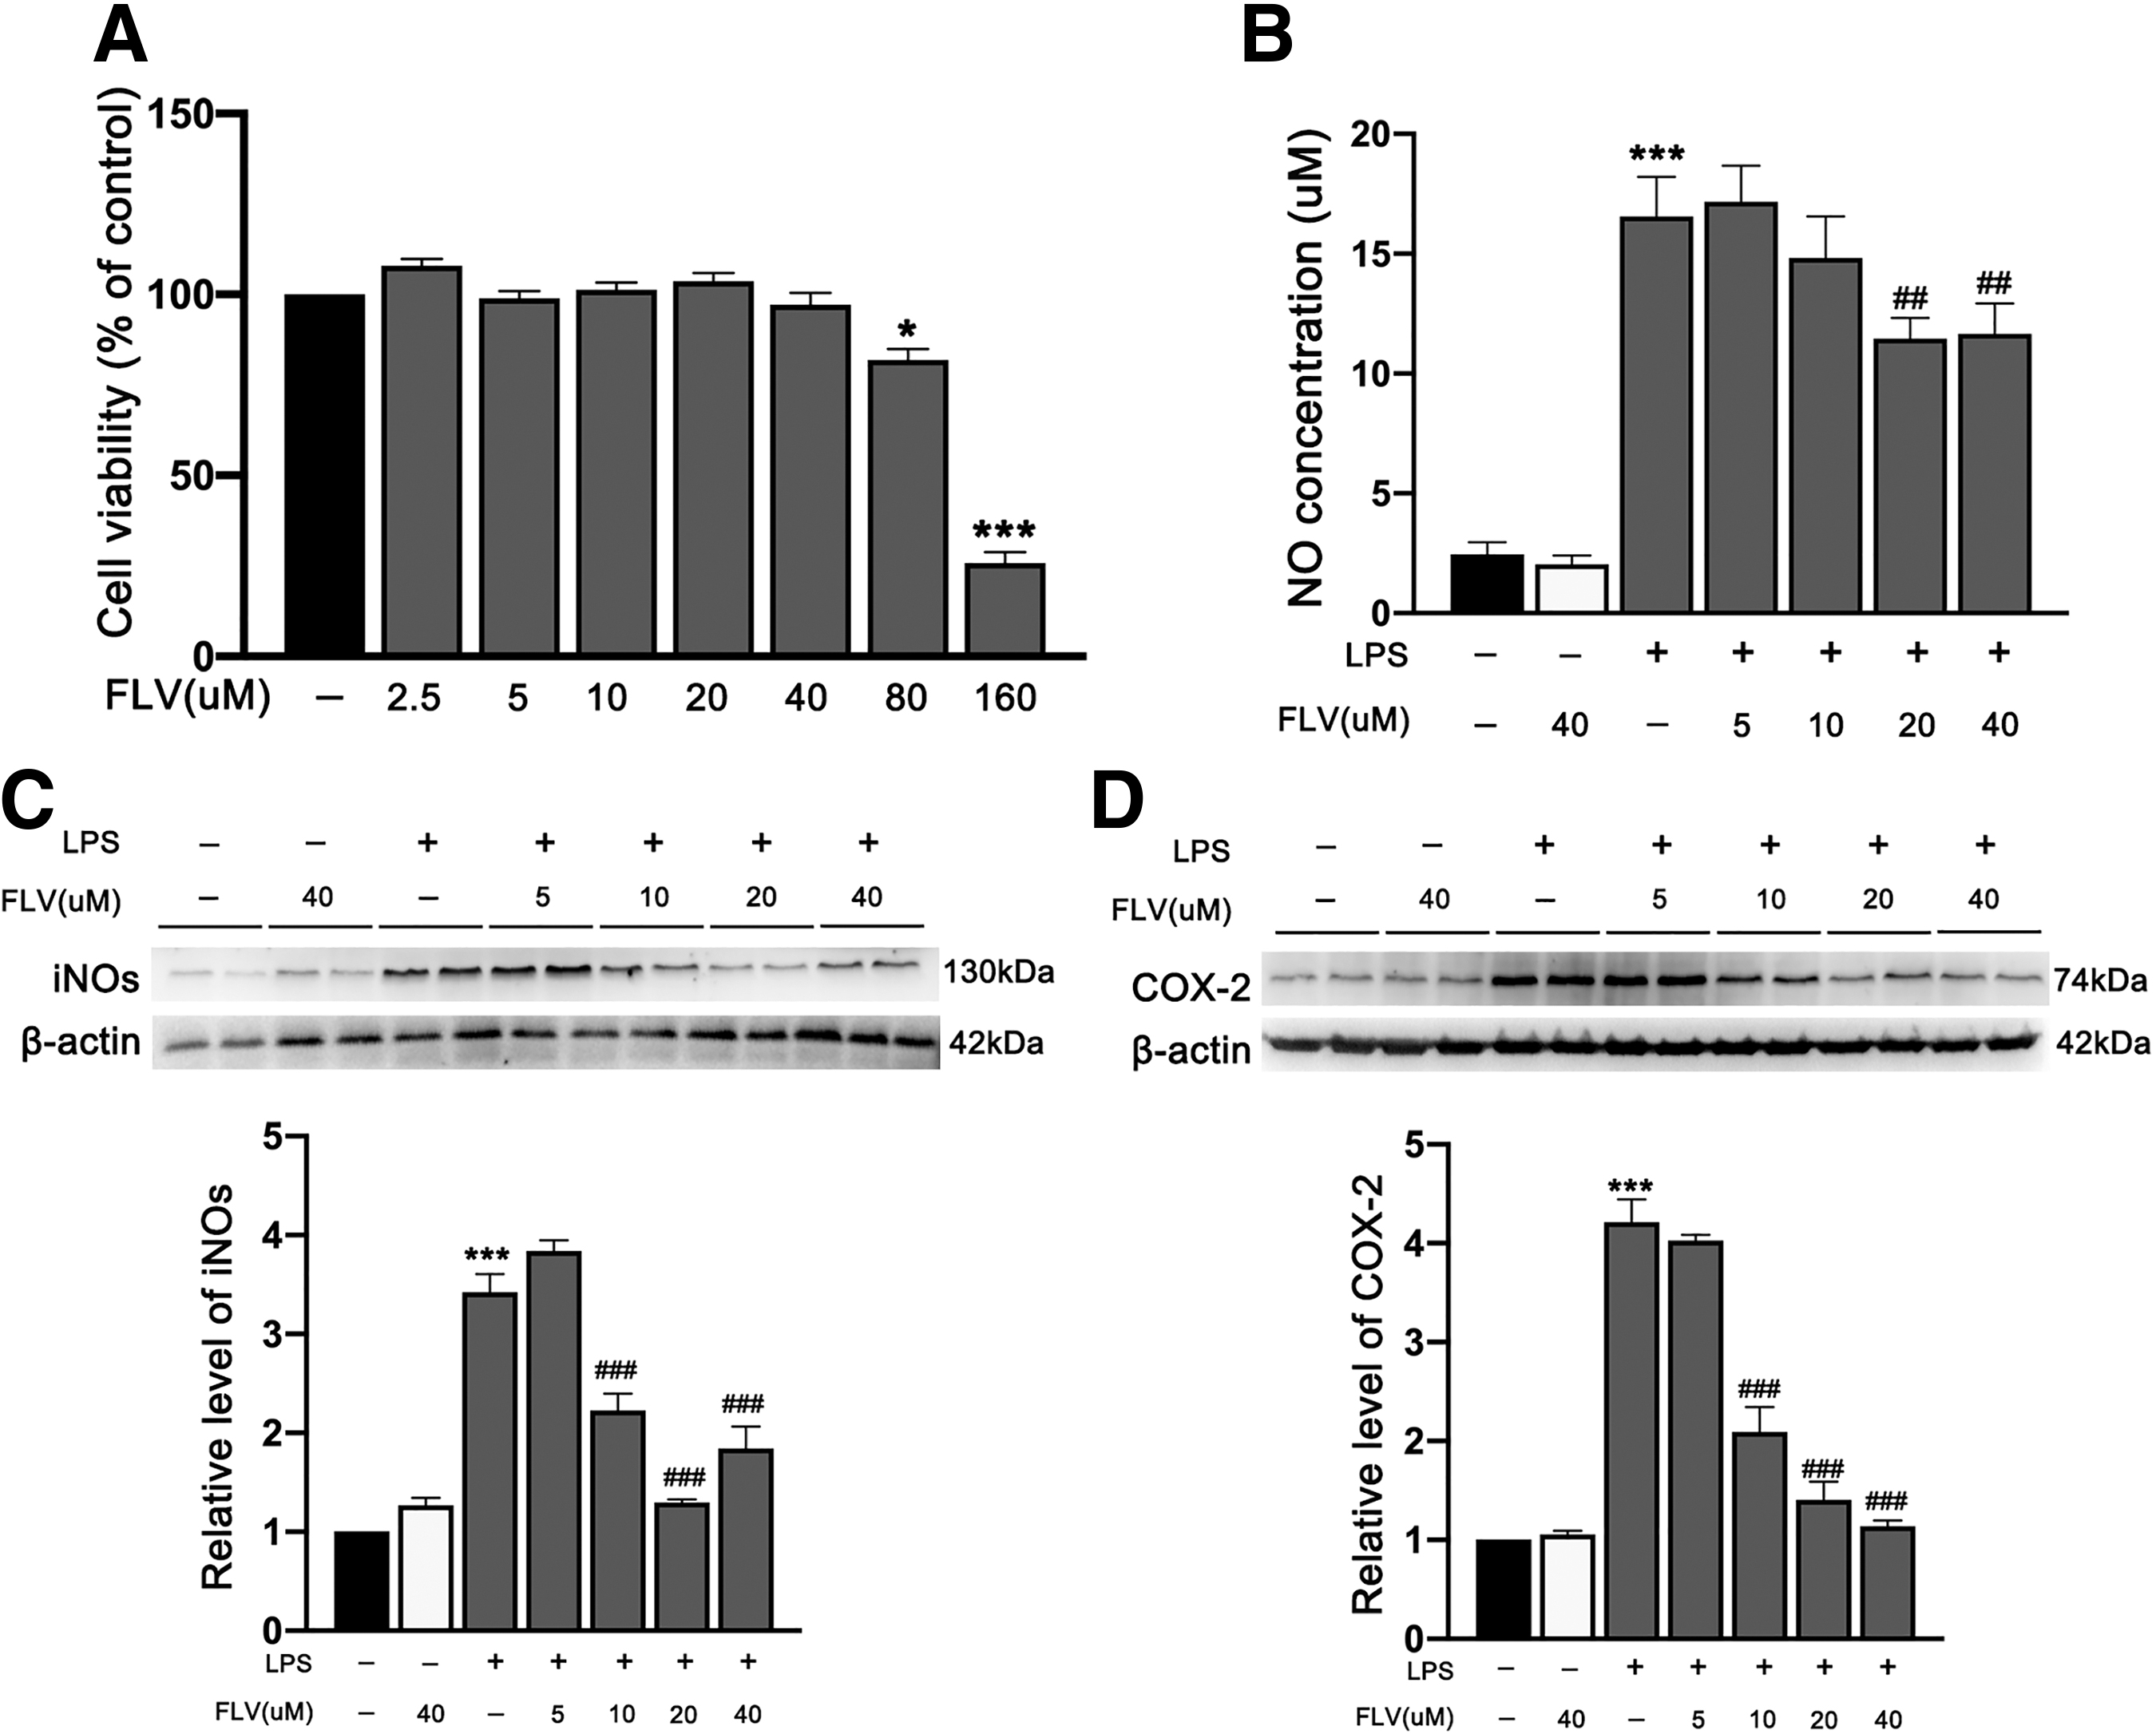
Effects of fluvoxamine on cell viability and the inflammatory response in LPS-induced primary microglia.
Fluvoxamine stabilized morphology of LPS-induced BV2 and primary microglial cells
Microglia can change their morphology in response to extracellular stimuli. In the resting state, BV2 microglial cells were spindle-shaped with small cell bodies and long processes. After treatment with LPS, the BV2 microglial cells were activated and acquired an amoeboid morphology, characterized by thick and short cell bodies, as previously described. 21 The results showed that in the NC group and the NC+FLV group the morphology of the cells was not significantly altered (Fig. 3A). Interestingly, the morphology of the LPS-induced cells was significantly changed to an activated state after 12 h, and the cells hardly adhered to the culture dish after approximately 13.5 h (Fig. 3A). The height of the amoeboid-like BV2 microglial cells was significantly increased after treatment with LPS at12 h (Fig. 3A). Importantly, in comparison with the LPS group, the LPS+FLV group produced fewer amoeboid-like BV2 microglial cells and lower height of these cells under the condition of LPS stimulation (Fig. 3A).

Effects of fluvoxamine on morphology of LPS-induced BV2 microglial cells and the expression of TNF-α in LPS-induced BV2 microglial cells.
Previous study demonstrated that after LPS treatment primary microglial cells also developed amoeboid-like morphology, indicating that the cells had been activated. 22 We also observed similar morphological changes in primary microglial cells after treatment with LPS (Fig. 4A). In comparison with the LPS group, the LPS+FLV group produced fewer amoeboid-like primary microglial cells and lower height of these cells under the condition of LPS stimulation (Fig. 4A). Importantly, we found that Sig-1R antagonist BD-1047 significantly reversed the effect of fluvoxamine in LPS-treated primary microglial cells (Fig. 4A).
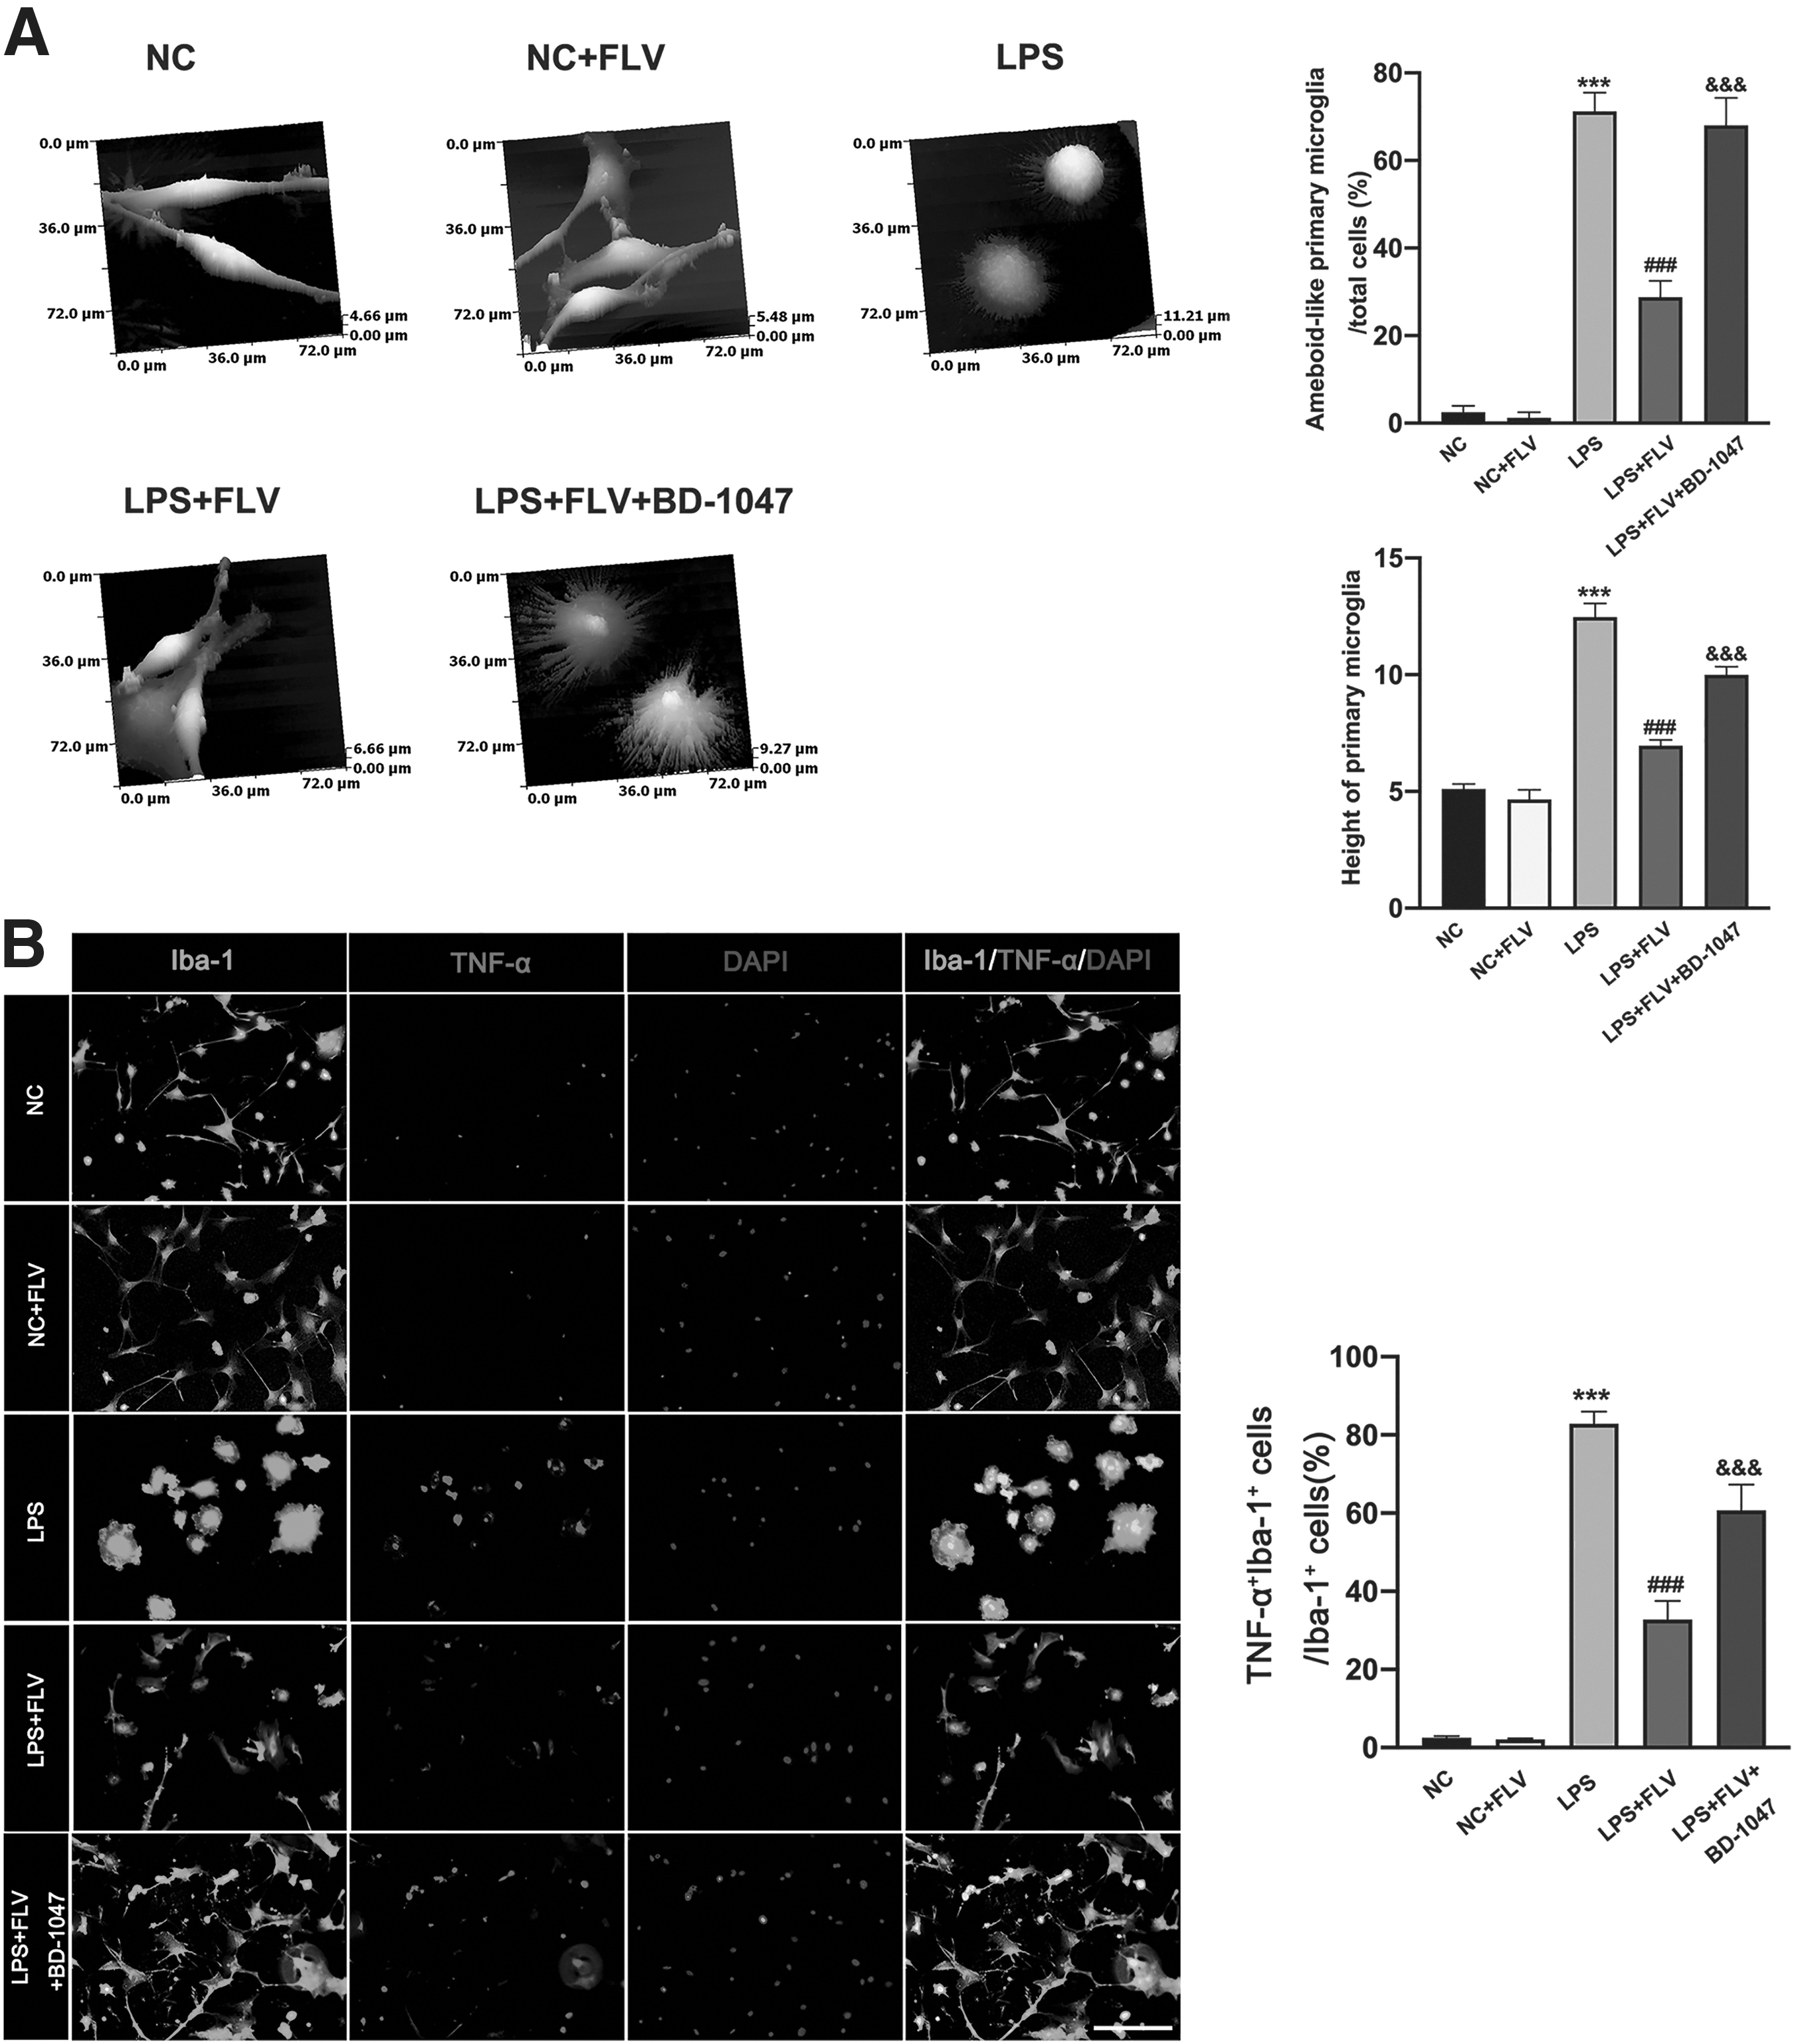
Effects of fluvoxamine and sigma-1 receptor antagonist BD-1047 on morphology of LPS-induced primary microglial cells and the expression of TNF-α in LPS-induced primary microglial cells.
Fluvoxamine promoted LPS-induced BV2 and primary microglial cell transformation from M1-like phenotype to M2-like phenotype
Immunofluorescence staining results from mice treated with fluvoxamine showed that fluvoxamine treatment significantly inhibited the expression of TNF-α and iNOs as compared with mice that received the 0.5% DMSO, whereas it promoted the expression of M2 marker Arginase-1 in BV2 cells (Fig. 3A and Fig. 5A). ELISA results showed that fluvoxamine treatment significantly suppressed the secretion of pro-inflammatory cytokines (TNF-α, IL-1β, and IL-6), whereas it promoted the release of anti-inflammatory cytokines (IL-10 and IL-4) in LPS-induced BV2 microglial cells (Fig. 5B).
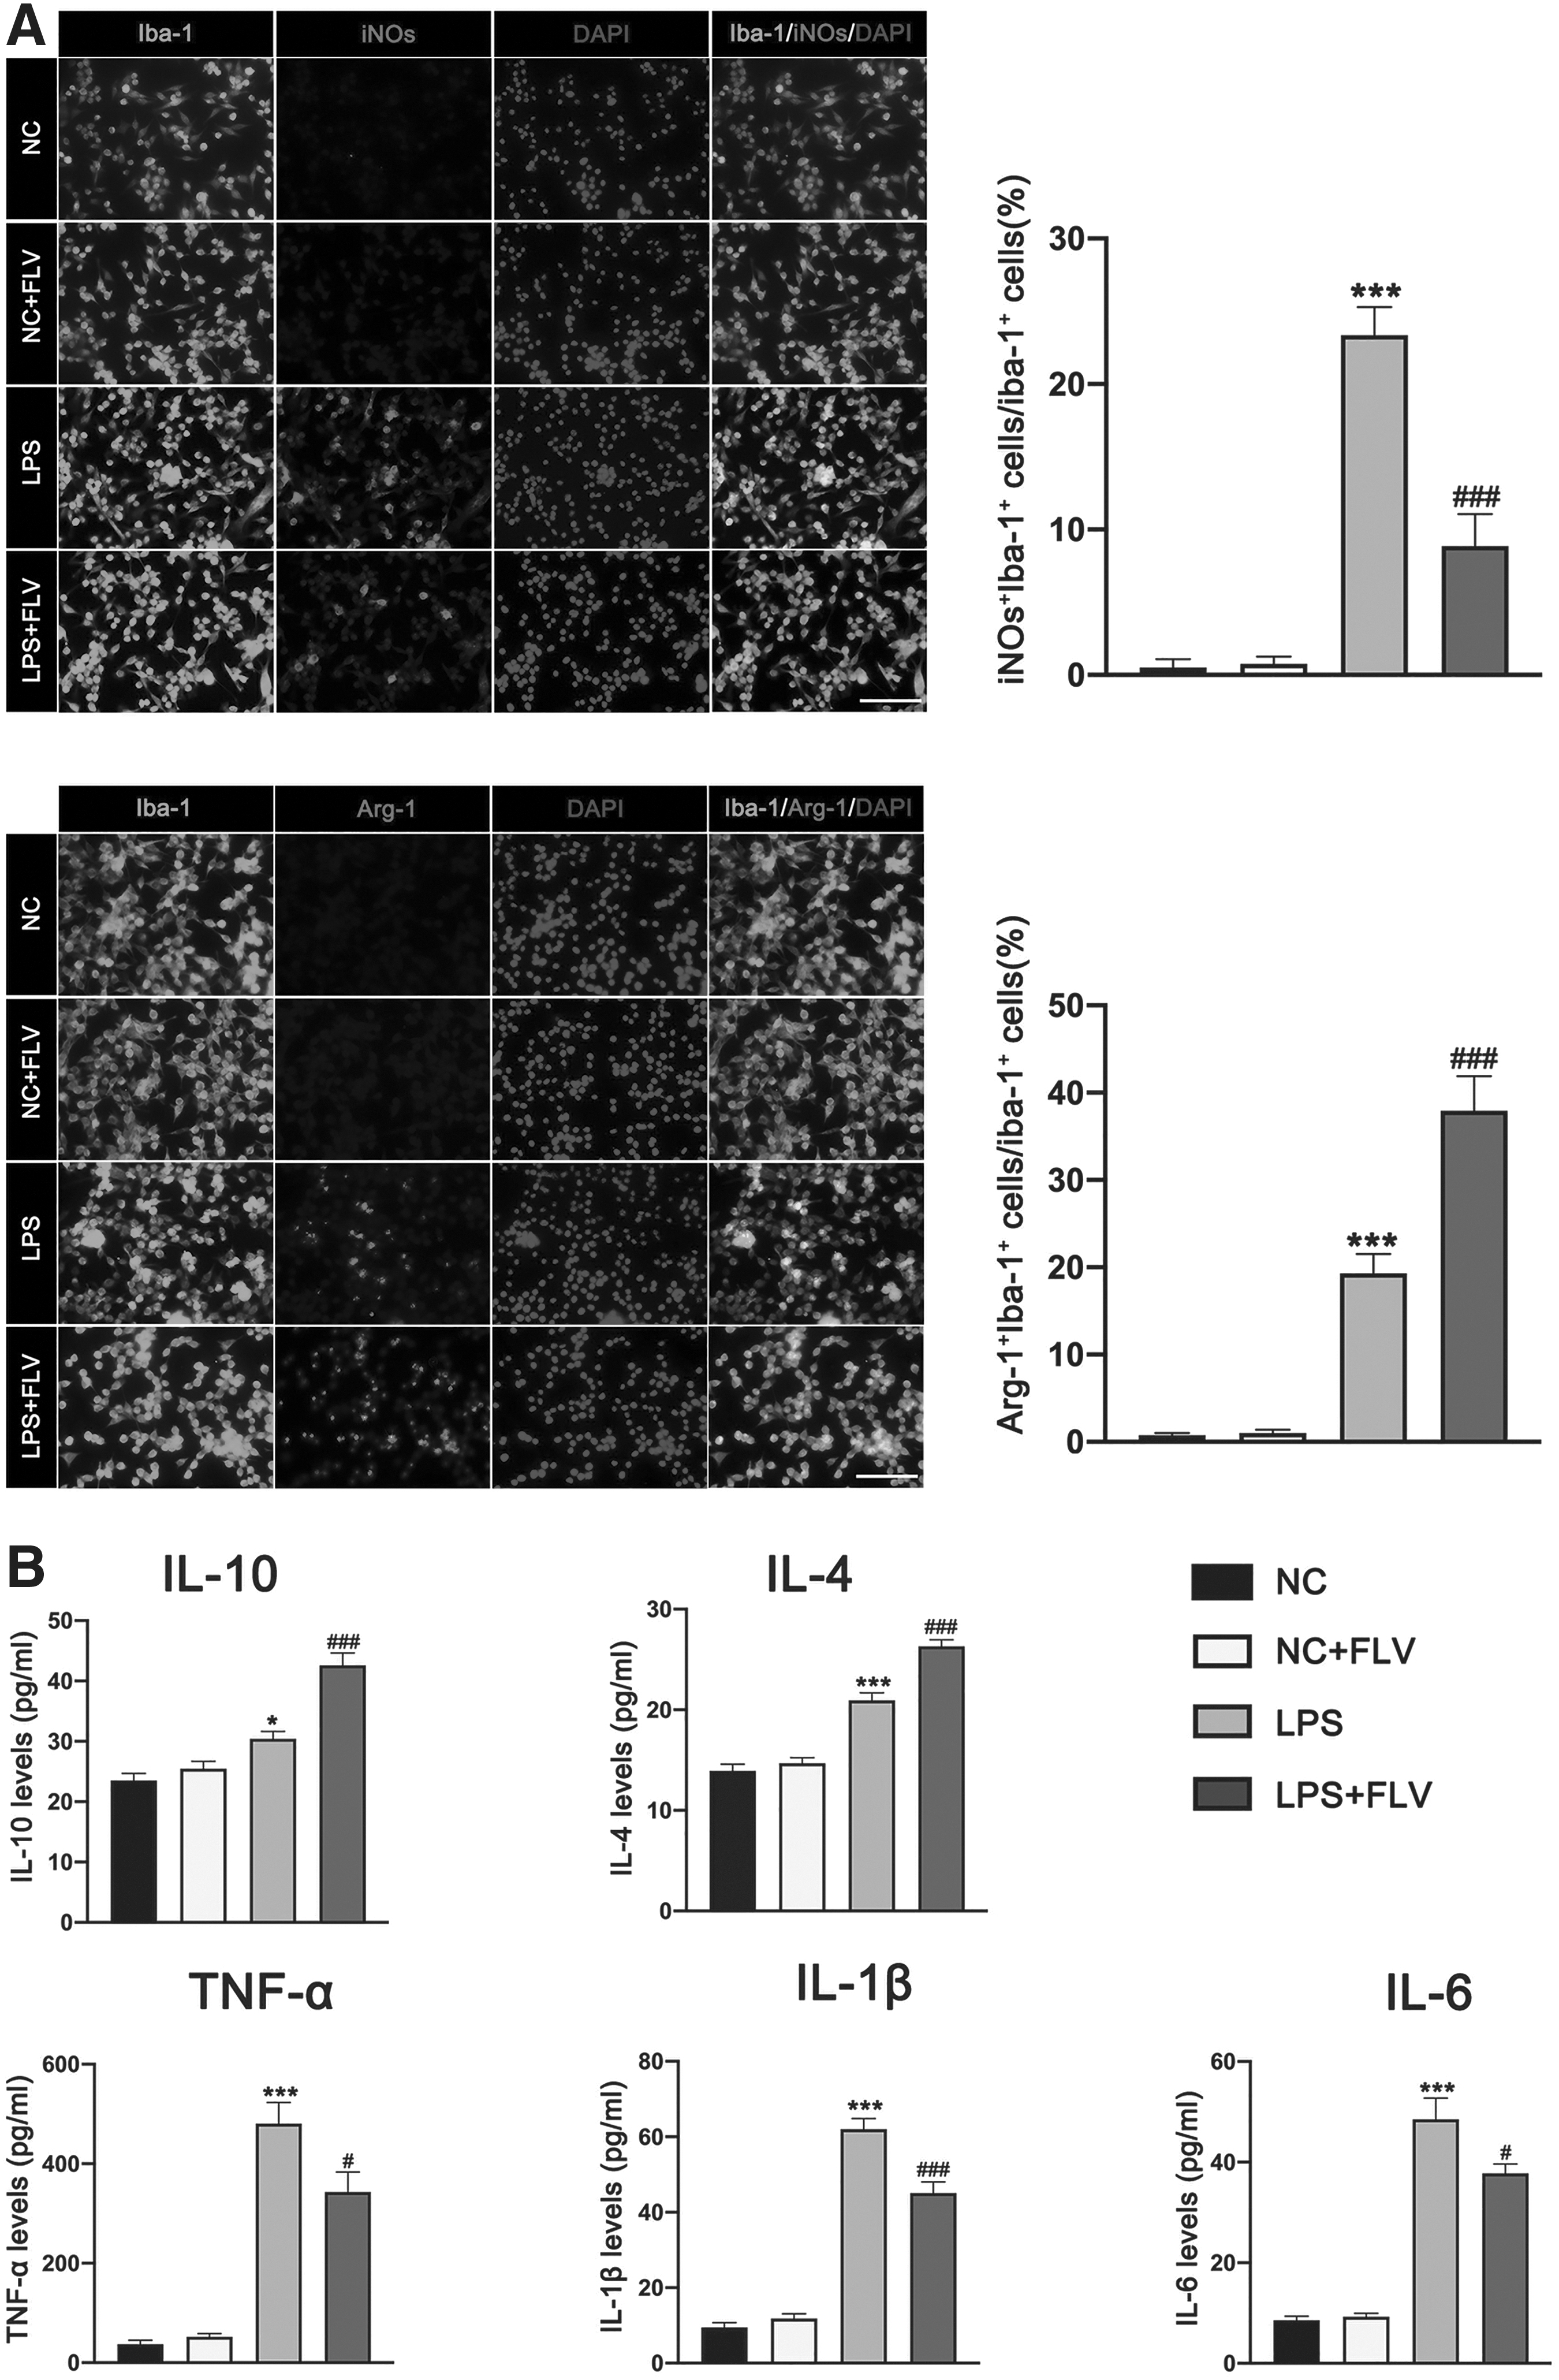
Effects of fluvoxamine on LPS-induced BV2 microglial polarization.
In addition, results from mice treated with fluvoxamine also validated that fluvoxamine treatment significantly inhibited the expression of TNF-α and iNOs as compared with mice that receiving the 0.5% DMSO, whereas it promoted the expression of M2 marker Arginase-1 in primary microglial cells (Fig. 4B and Fig. 6A). Importantly, we observed that BD-1047 significantly reversed the anti-inflammatory effect of fluvoxamine in LPS-treated primary microglial cells (Fig. 4B and Fig. 6A). ELISA results showed that fluvoxamine treatment significantly suppressed the secretion of pro-inflammatory cytokines (TNF-α, IL-1β, and IL-6), whereas it promoted the release of anti-inflammatory cytokines (IL-10 and IL-4) in LPS-induced primary microglial cells (Fig. 6B). The further results also showed that BD-1047 could significantly abolish the immunomodulatory effects of FLV in LPS-treated primary microglia (Fig. 6B).

Effects of fluvoxamine and BD-1047 on LPS-induced primary microglial polarization.
Fluvoxamine improved neurological functions, reduced cerebral lesion volume, and increased cerebral cortical blood perfusion
The mNSS was significantly improved in mice receiving 10 mg/kg/day and 30 mg/kg/day rather than 2 mg/kg/day fluvoxamine at 3 days, 5 days, 7 days, and 14 days post-TBI (Fig. 7A). In addition, 10 mg/kg/day and 30 mg/kg/day rather than 2 mg/kg/day fluvoxamine-treated TBI mice had significantly reduced volume of cerebral lesion at 14 days after TBI, as compared with TBI mice that received the vehicle (Fig. 7B). The TBI mice treated with 10 mg/kg/day and 30 mg/kg/day rather than 2 mg/kg/day fluvoxamine had significantly increased cerebral cortical perfusions of Area 1 at 72 h after TBI (Fig. 7C). In addition, 10 mg/kg/day and 30 mg/kg/day rather than 2 mg/kg/day fluvoxamine-treated TBI mice had significantly increased cerebral cortical perfusions of Area 2 at 24 h and 72 h after TBI (Fig. 7C). Because there is no significant difference in benefit between 10 mg/kg/day fluvoxamine and 30 mg/kg/day fluvoxamine, based on the principle of minimizing drug toxicity, 10 mg/kg/day fluvoxamine was chosen for all subsequent in vivo experiments.
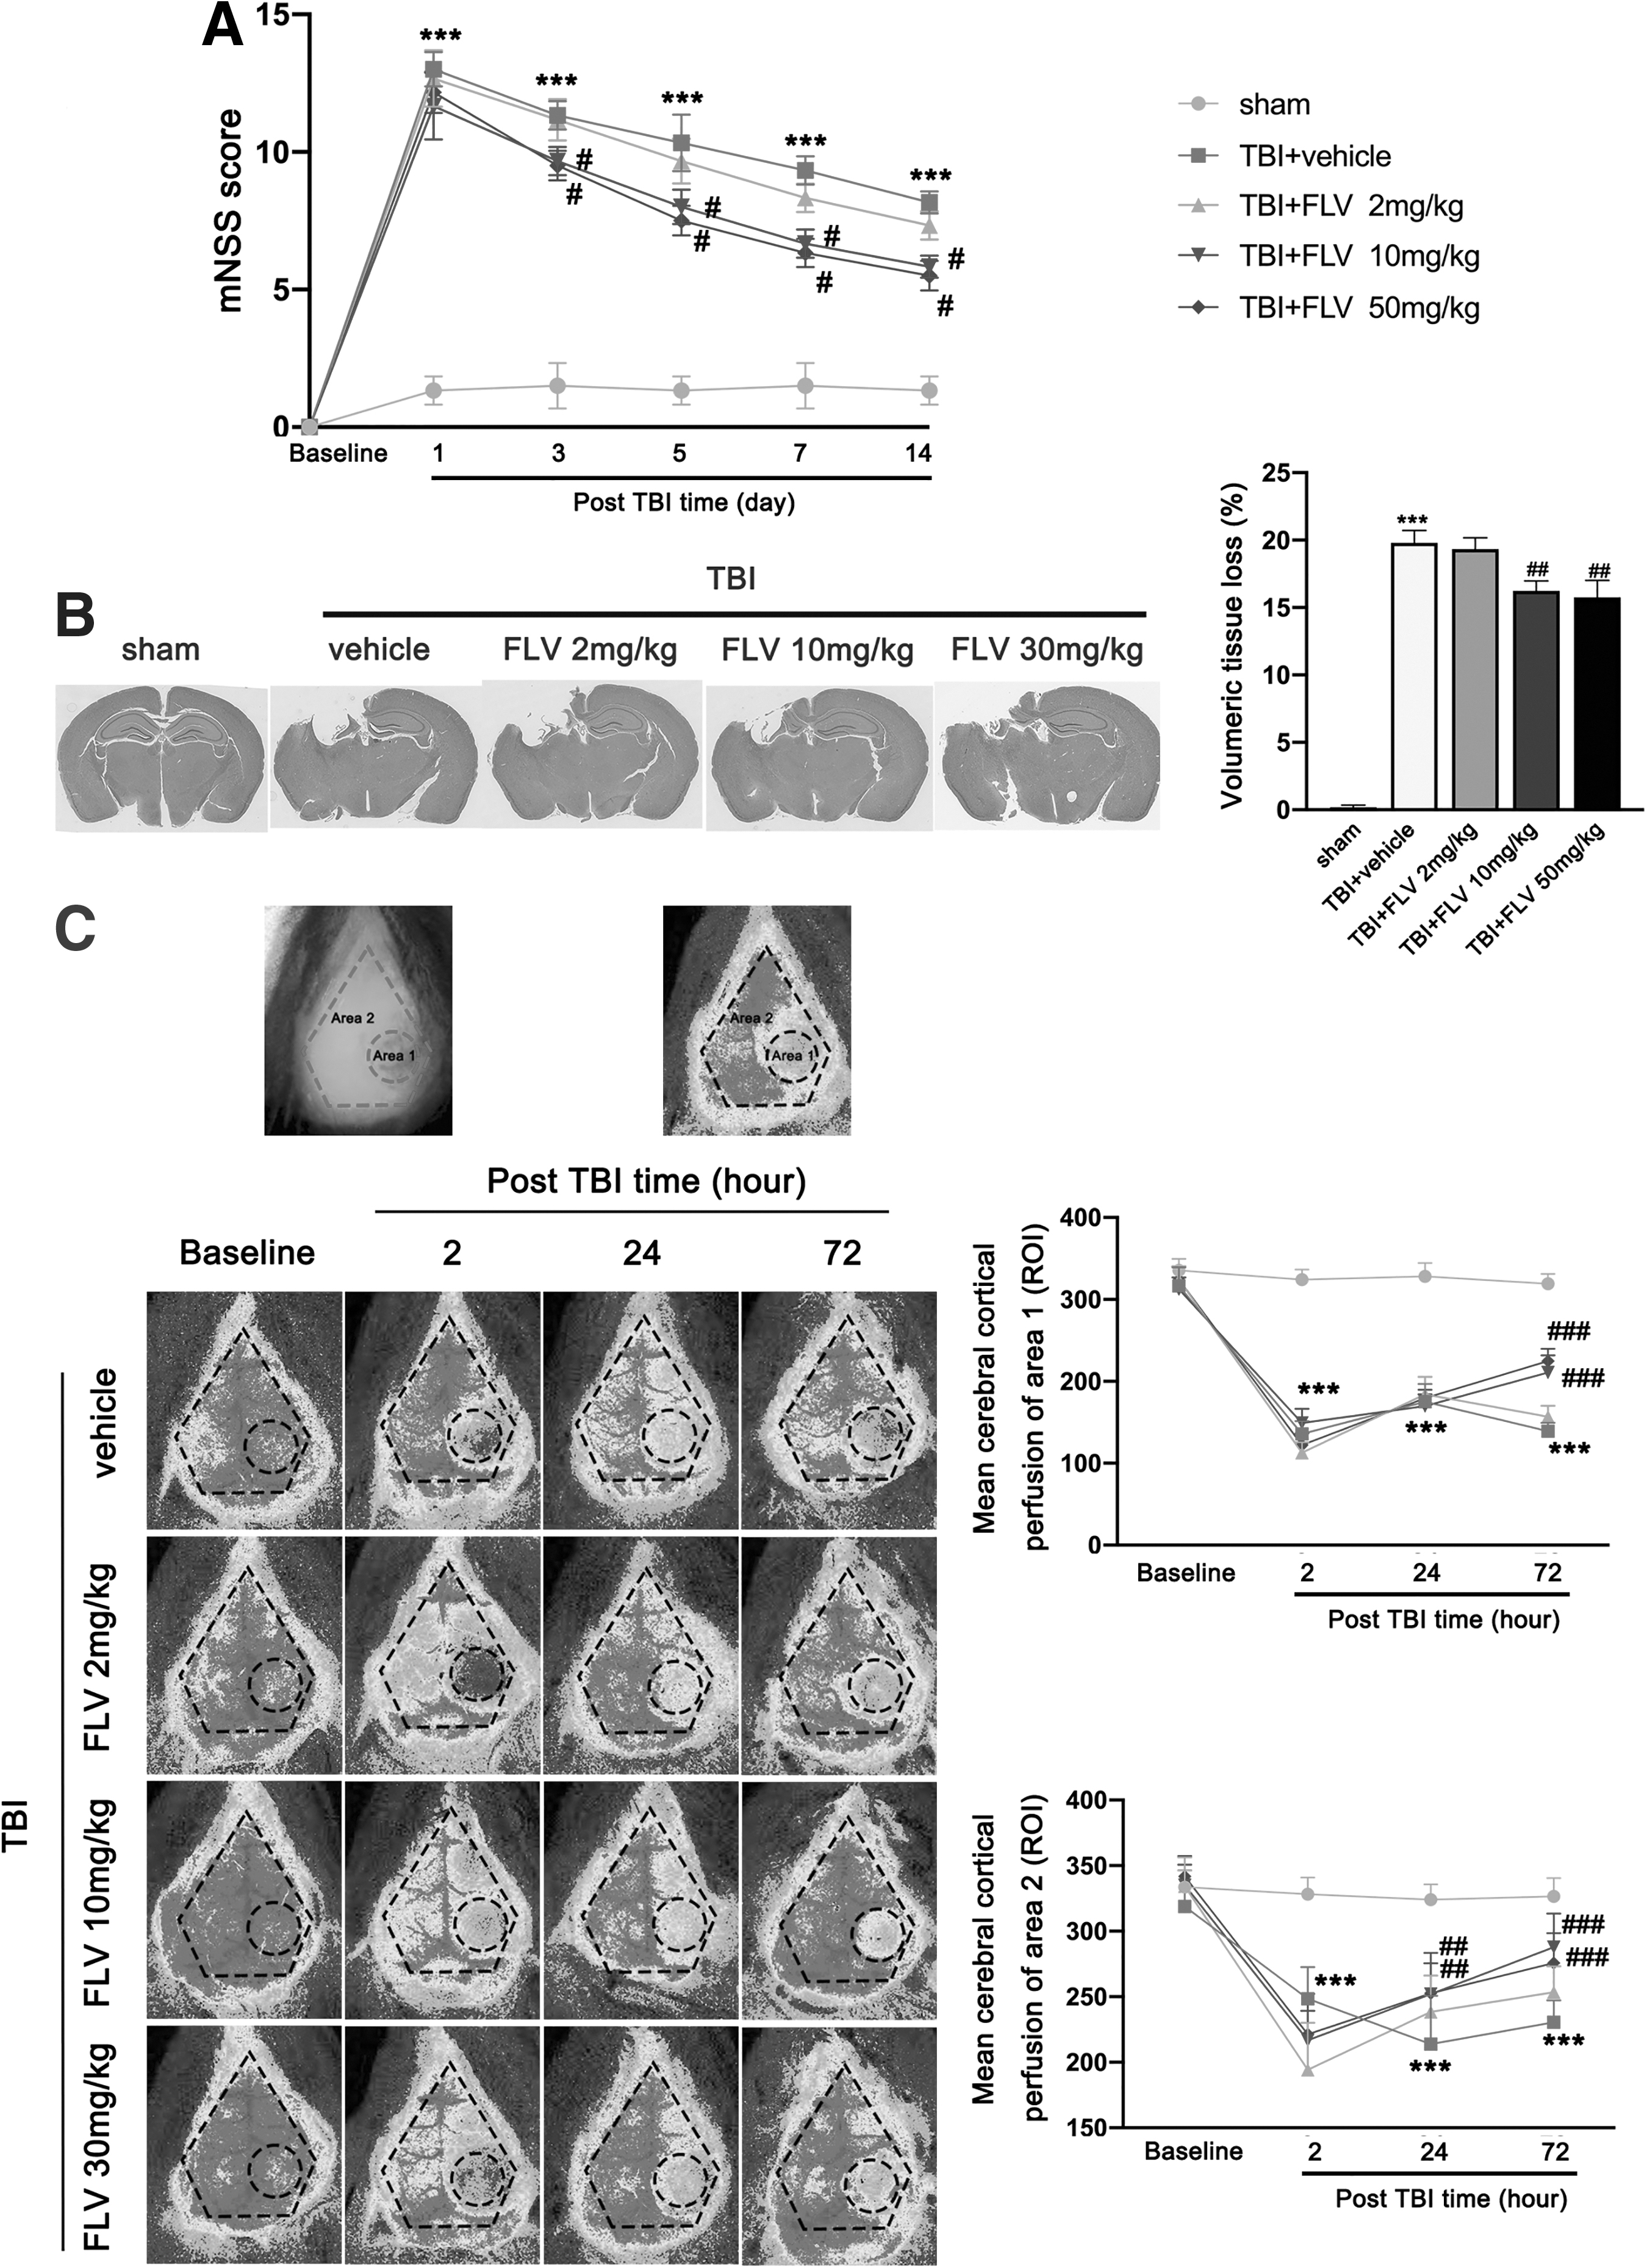
Effects of fluvoxamine on neurological outcomes, cerebral lesion volume, and cerebral cortical blood perfusion after TBI.
Fluvoxamine inhibited peripheral immune cell infiltration and glia activation after TBI
The counts of astrocytes, microglia, neutrophils, macrophages, CD3+ T cells, CD8+ T cells, Th cells, B cells, and NK cells in injured brain hemisphere were all significantly increased at 3 days post-TBI. In contrast, fluvoxamine-treated TBI mice had significantly reduced invasion of leukocytes and activation of glia after TBI, as compared with TBI mice that received the vehicle (Fig. 8). There was no significant difference in counts of these immune cells in injured brain hemisphere between the sham group and the sham+FLV group.

Effects of fluvoxamine on brain-invading immune cell subsets after TBI. Representative gating strategy of astrocytes (GFAP+), microglia (CD45intermediateCD11b+), neutrophils (CD45highCD11b+Ly6G+), macrophages (CD45highCD11b+Ly6C+), CD3+ T cells (CD45+CD3+), CD8+ T cells (CD45+CD3+CD8+), Th cells (CD45+CD3+CD4+), B cells (CD45+CD3-CD19+), and NK cells (CD45+CD3-NK1.1+) and quantitative analyses of cell counts of these invading immune cells in the brain of different groups at 3 days after TBI. Data were represented as mean ± SEM (n = 6 per group) and were analyzed by two-way ANOVA followed by Tukey's multiple comparison post hoc test. **p < 0.01 and ***p < 0.001 versus sham group; # p < 0.05, ## p < 0.01, and ### p < 0.001 versus TBI group. ANOVA, analysis of variance; GFAP, glial fibrillary acidic protein; NK, natural killer; SEM, standard error of the mean; TBI, traumatic brain injury.
Immunofluorescence staining of brain slices for MPO+ neutrophils, Iba-1+ microglia/macrophages, and GFAP+ astrocyte cells detected that the TBI induced a massive infiltration of peripheral neutrophils and glia activation in the peri-contusional region at 3 days post-injury (Fig. 9A). The brain slices of fluvoxamine-treated TBI mice showed significantly less infiltration of peripheral neutrophils and glia activation around the lesion site as compared with brain slices of TBI mice that received the vehicle at 3 days post-TBI (Fig. 9A). There was no significant difference in alteration of infiltration of peripheral neutrophils and glia activation between the sham group and the sham+FLV group. Subsequent western blotting analyses also showed that the expression of MPO, Iba-1, and GFAP was significantly increased in injured cortex at 3 days post-TBI (Fig. 9B). However, the expression of these proteins was significantly decreased in mice treated with fluvoxamine (Fig. 9B). There was no significant difference in expression of these proteins between the sham group and the sham+FLV group.
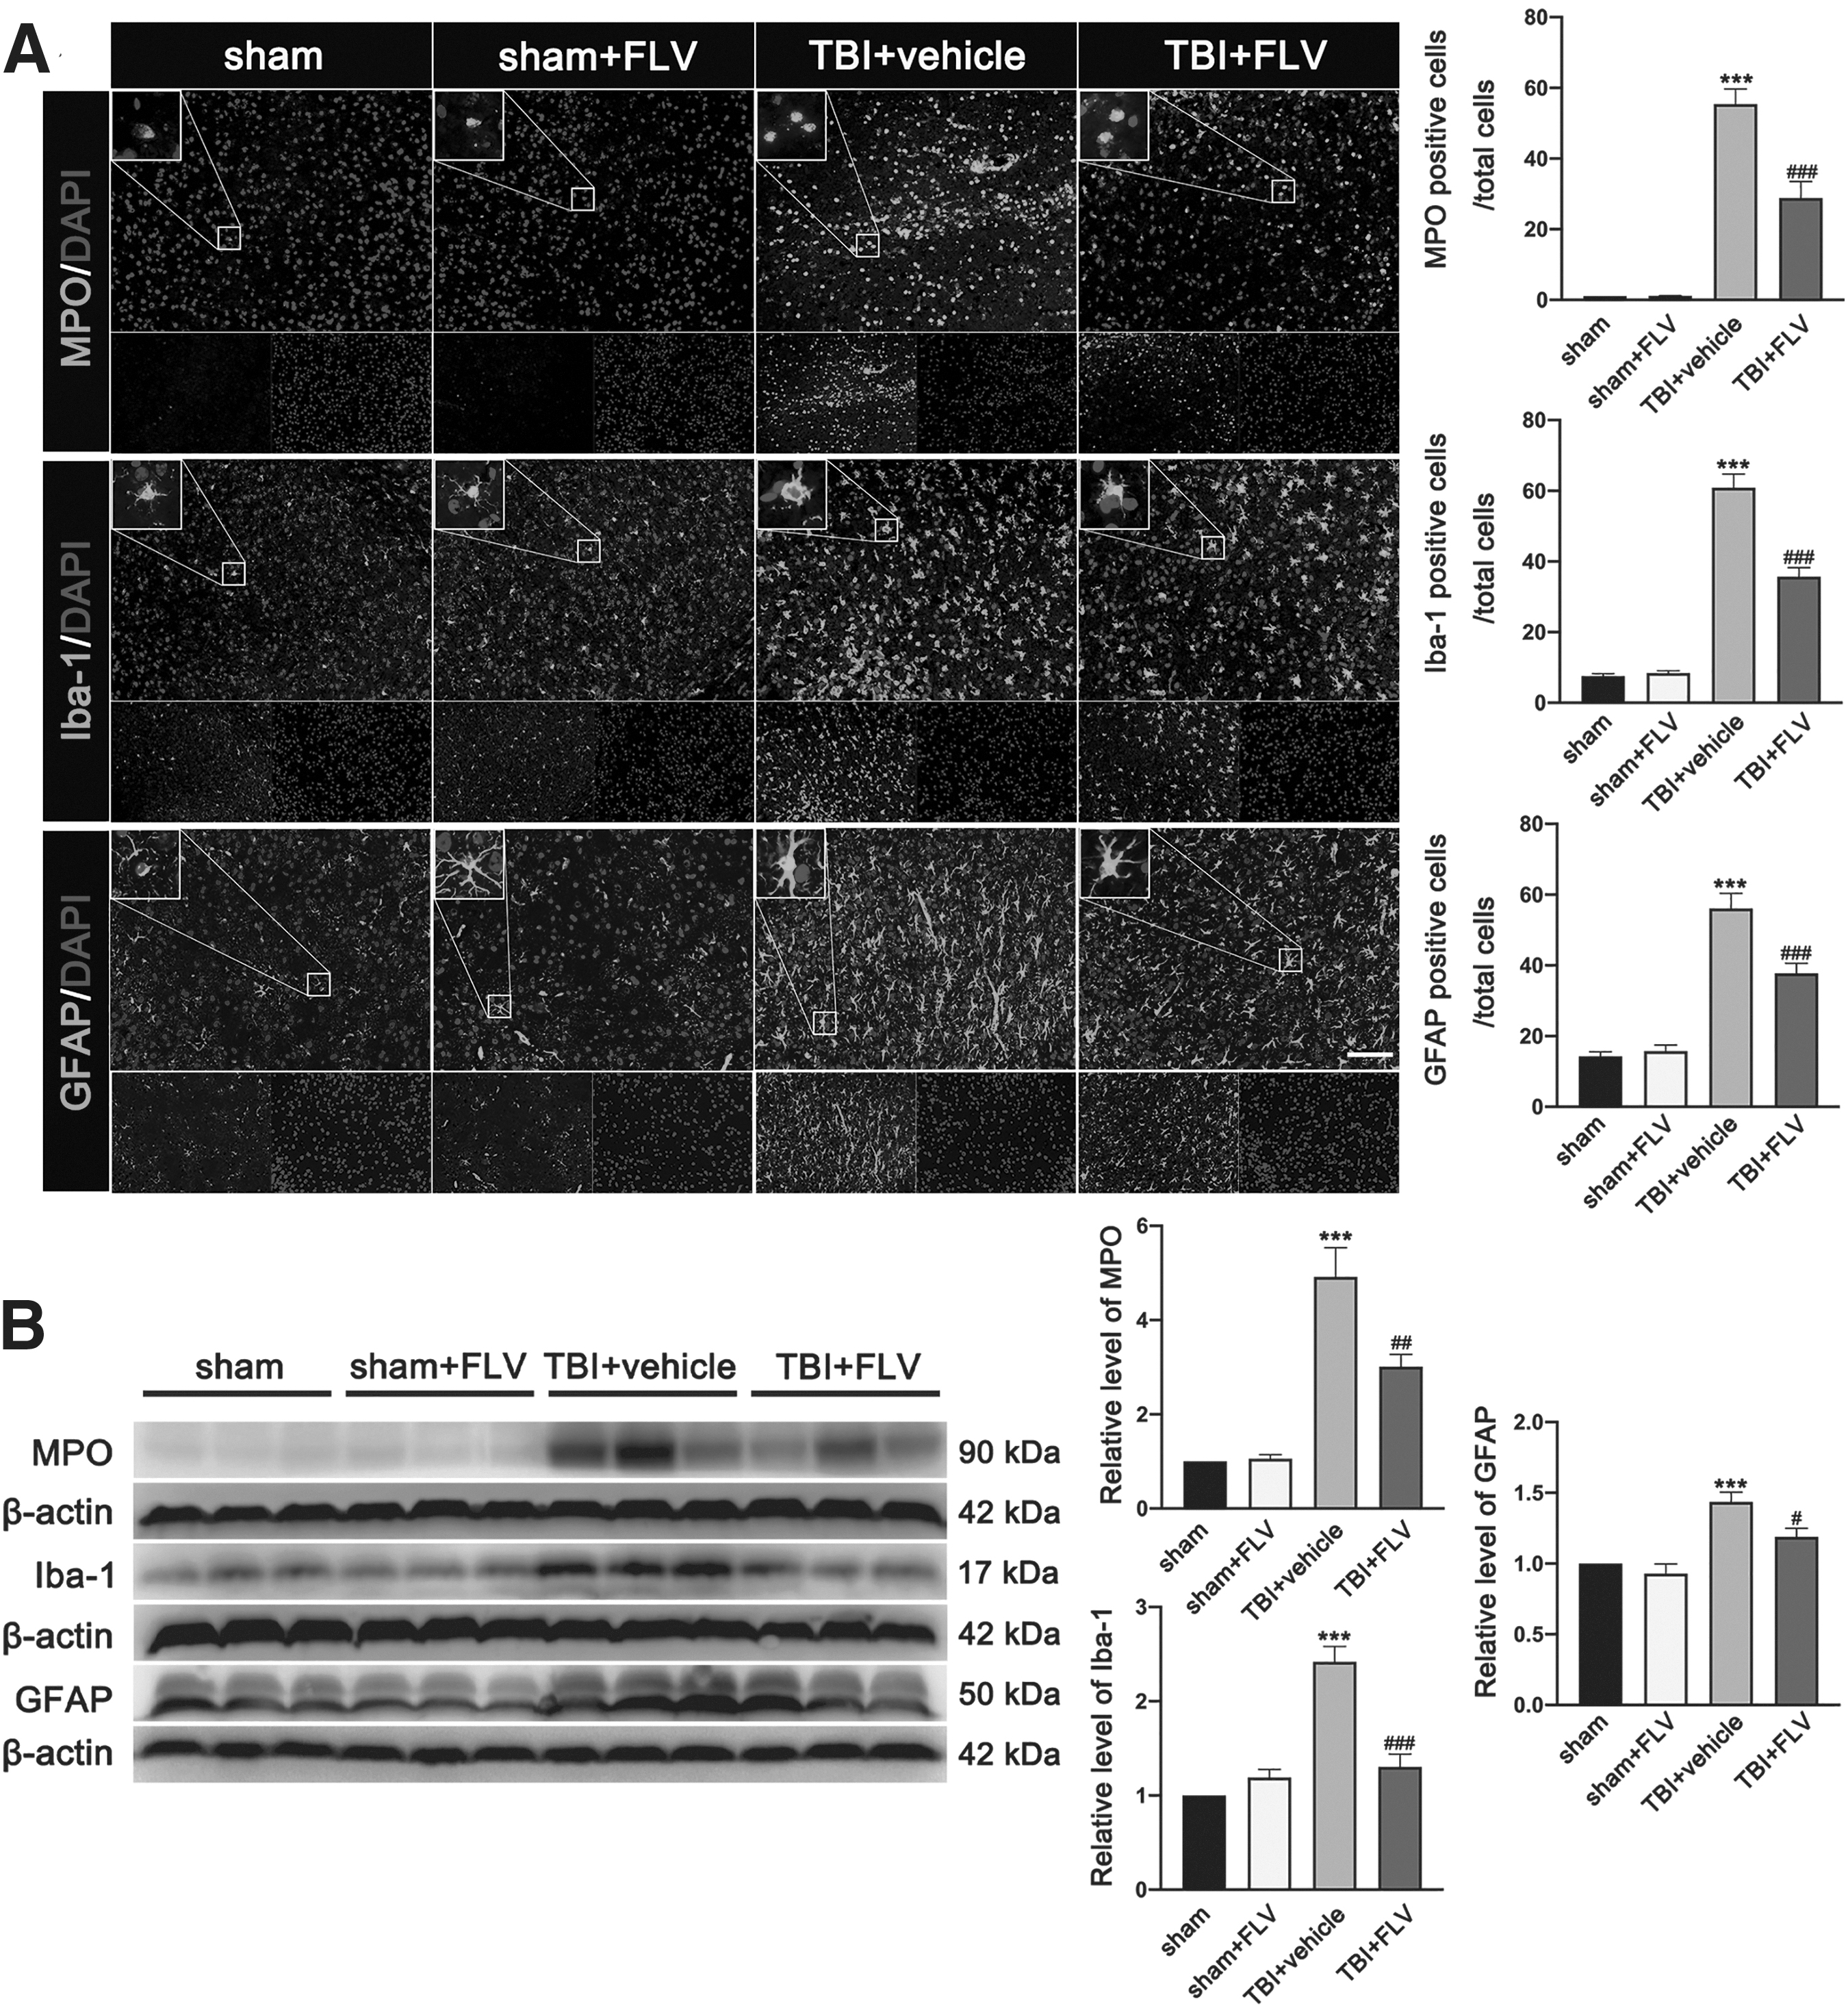
Effects of fluvoxamine on leukocyte invasion and glia activation and migration after TBI.
Fluvoxamine inhibited M1 polarization and promoted M2 polarization after TBI primarily via the IKK/IκB/NK-κB pathway
Flow cytometry analysis showed that the counts of M1-like microglial/macrophage cells and M2-like microglial/macrophage cells were both significantly increased in injured cerebral hemisphere at 3 days post-TBI (Fig. 10 A). In comparison with 0.5% DMSO treatment after TBI, fluvoxamine treatment significantly decreased the counts of M1-like microglial/macrophage cells in injured cerebral hemisphere at 3 days post-TBI, whereas it significantly increased the counts of M2-like microglial/macrophage cells (Fig. 10A). There is no significant difference in counts of M1-like microglial/macrophage cells and M2-like microglial/macrophage cells between the sham group and the sham+FLV group. Further immunofluorescence experimentation on brain slices for iNOs+Iba-1+ microglial/macrophage cells (M1) and Arginase-1+ Iba-1+ microglial/macrophage cells (M2) found that both M1-like microglial/macrophage cells and M2-like microglial/macrophage cells were significantly increased after TBI in the peri-contusional region at 3 days post-injury (Fig. 10B). The brain sections of fluvoxamine-treated TBI mice showed significantly fewer M1-like microglial/macrophage cells but more M2-like microglial/macrophage cells in the peri-contusional region as compared with mice that received the vehicle at 3 days after TBI (Fig. 10 B).

Effects of fluvoxamine on microglial/macrophages polarization after TBI.
In line with these observations, post-TBI the protein expressions of M1-associated cytokines and M2-associated cytokines were both significantly increased in injured cortex at 3 days post-TBI (Fig. 10C). Similarly, fluvoxamine treatment significantly decreased the expression of M1-associated cytokines (iNOS, TNF-α, IL-1β, and IL-6) and concomitantly increased the expression of M2-associated cytokines (Arginase-1 and IL-10) around the lesioned cortex at 3 days after TBI (Fig. 10C). Similarly, there was no significant difference in expression of these proteins between the sham group and the sham+FLV group at 3 days. Further study showed that the inflammatory transcriptional protein levels of p-IKK-α/β, p-IκB, and p-NF-κB were significantly increased in the injured cortex at 3 days post-injury as compared with the sham group (Fig. 11). The protein expressions of Iba-1- and M1-associated cytokines (iNOs and IL-1β) and M2-associated cytokines (Arginase-1) were significantly increased in the injured cortex at 3 days post-injury as compared with the sham group. Fluvoxamine significantly attenuated the IKK/IκB/NK-κB pathway-associated protein expression and M1/M2 polarization-associated protein expression in the injured cortex at 3 days post-injury, whereas Sig-1R antagonist BD-1047 significantly reversed the anti-inflammatory effect of fluvoxamine (Fig.11).

Fluvoxamine regulates microglial/macrophage polarization primarily via the IKK/IκB/NF-κB pathway after TBI. Representative western blotting bands and densitometric analysis of p-IKK-α/β/IKK-β, p-IκB/IκB, p-NF-κB/NF-κB, iNOs, Arginase-1, and IL-1β in the ipsilateral cerebral cortex of mice at 3 days after TBI. Data were represented as mean ± SEM (n = 6 per group) and were analyzed by two-way ANOVA followed by Tukey's multiple comparison post hoc test. *p < 0.05, **p < 0.01, and ***p < 0.001 versus sham group; # p < 0.05, ## p < 0.01, and ### p < 0.001 versus TBI group; & p < 0.05, && p < 0.01, and &&& p < 0.001 versus LPS+FLV group. ANOVA, analysis of variance; FLV, fluvoxamine; LPS, lipopolysaccharide; SEM, standard error of the mean; TBI, traumatic brain injury.
Fluvoxamine attenuated neuronal apoptotic death and the expression of apoptotic proteins after TBI
Nissl staining results showed that there were more apoptotic neurons and increased shrinkage morphology of neurons in the peri-contusional region at 3 days after TBI (Fig. 12A). However, the numbers of these apoptotic neurons and the shrinkage morphology of neurons in the peri-contusional region at 3 days post-injury were significantly decreased in TBI mice treated with fluvoxamine (Fig. 12A). There was no significant difference in the numbers of these apoptotic neurons in lesioned cortex between the sham group and the sham+FLV group at 3 days. TUNEL staining detected greater neuron loss and TUNEL-positive neurons in the peri-contusional region at 3 days after TBI (Fig. 12B).

Effects of fluvoxamine on neuron apoptotic death and the expression of apoptotic proteins after TBI.
In contrast, fluvoxamine treatment significantly decreased the number of TUNEL-positive neurons and preserved more live neurons in the lesioned cortex 3 days after TBI (Fig. 12B). There is no significant difference in numbers of TUNEL-labeled neurons in lesioned cortex between the sham group and the sham+FLV group at 3 days. Also, western blotting results showed that the expression of pro-apoptotic molecular markers of Bax, cleaved-caspase-9, cleaved-caspase-3, and cleaved-PARP-1 were significantly increased and expression of anti-apoptotic molecular markers of Bcl-2 were significantly decreased in the injured cortex at 3 days after TBI (Fig. 12C). However, these observations were all significantly reversed by fluvoxamine treatment (Fig. 12C). There was no significant difference in expression of these proteins between the sham group and the sham+FLV group at 3 days.
Fluvoxamine ameliorated BBB disruption and brain edema after TBI
The present experiment found that BBB permeability quantified by Evans blue extravasation was significantly increased in injured cerebral hemisphere at 3 days after TBI (Fig. 13A). Interestingly, the Evans blue extravasation was significantly reduced in fluvoxamine-treated mice compared with TBI mice that received vehicle (Fig. 13A). There was no significant difference in quantification of Evans blue extravasation between the sham group and the sham+FLV group at 3 days. Double immunofluorescence staining showed that laminin-positive vessels (labeled by endothelial marker CD-31) in the peri-contusional region were significantly reduced at 3 days after TBI (Fig. 13B).
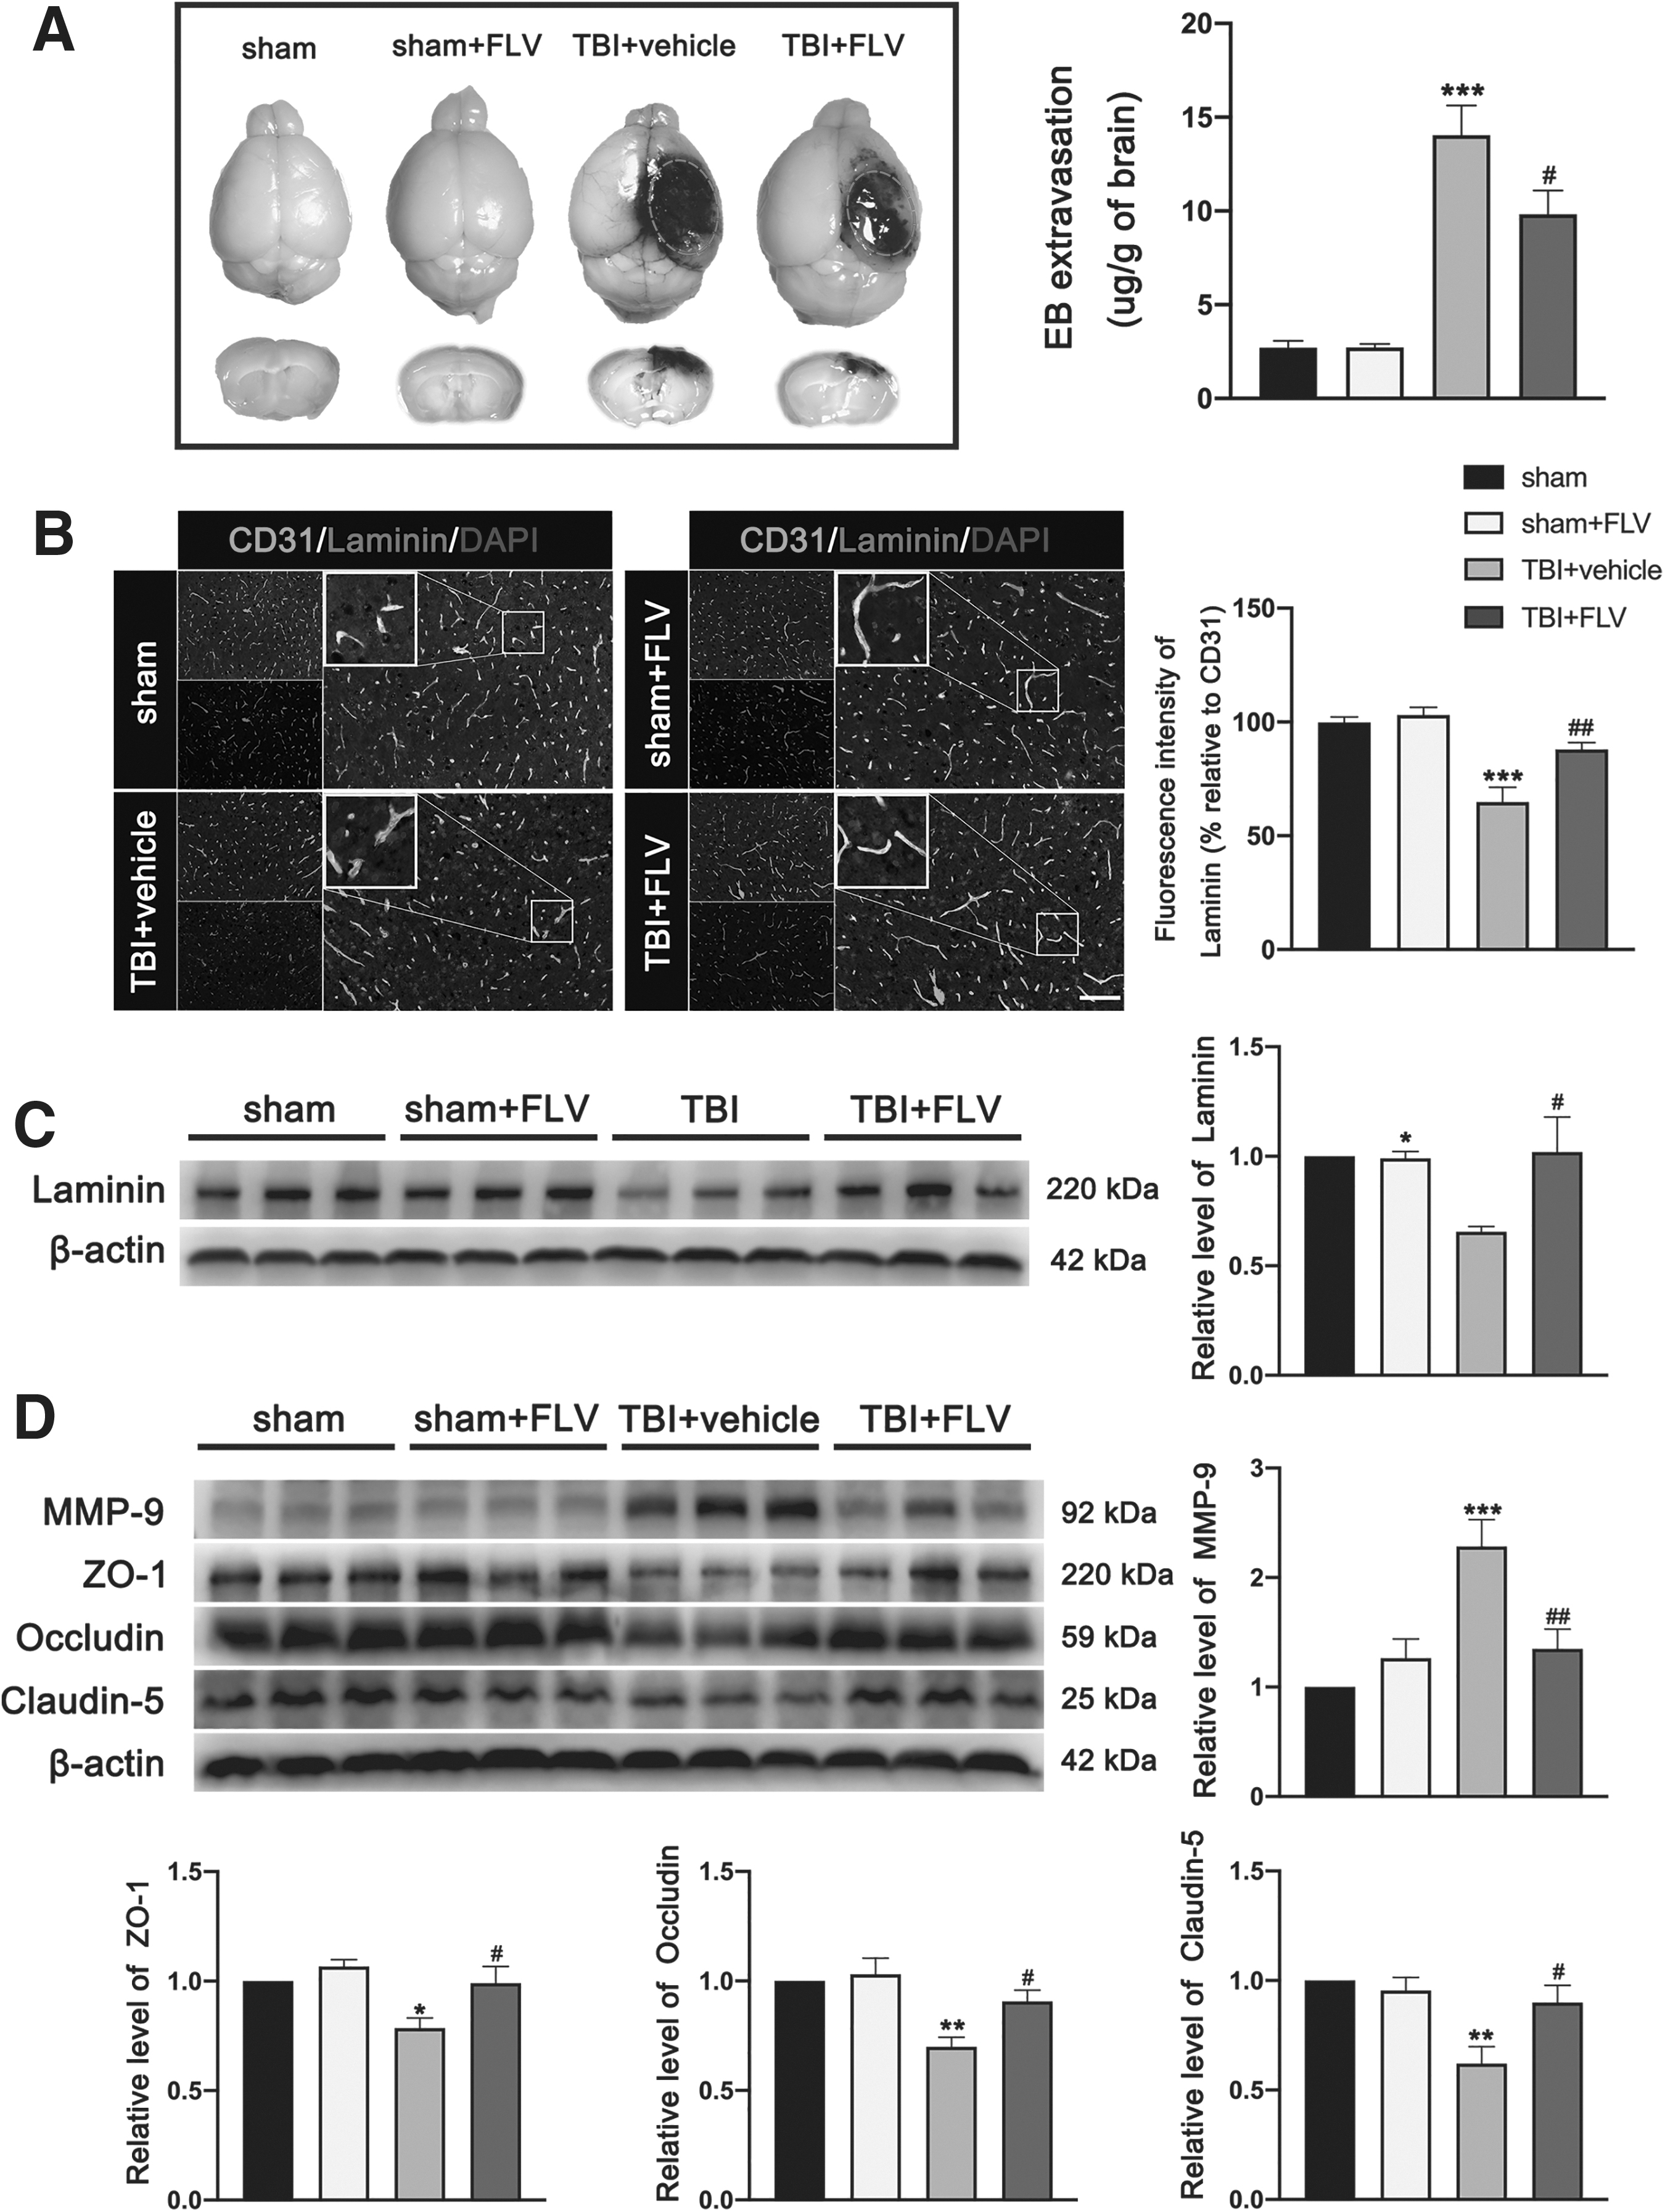
Effects of fluvoxamine on BBB integrity after TBI.
However, fluvoxamine restored the laminin expression in the peri-contusional region of TBI mice (Fig. 13B). There was no significant difference in fluorescence intensity of laminin/CD31 in lesioned cortex area between the sham group and the sham+FLV group at 3 days. This observation was further supported by the western blotting, which showed that expression of laminin in lesioned cortex at 3 days after TBI was significantly reduced, wheras it was not reduced in mice receiving fluvoxamine (Fig. 13C). There is no significant difference in expression of laminin between the sham group and the sham+FLV group at 3 days. In addition, western blotting results showed that the expression of matrix metalloproteinase 9 (MMP-9) was significantly increased and the expression of junction proteins ZO-1, occludin, and claudin-5 was significantly reduced in lesioned cortex at 3 days after TBI (Fig. 13D). Interestingly, these observations were all significantly reversed by fluvoxamine treatment (Fig. 13D). Similarly, there was no significant difference in expression of these proteins between the sham group and the sham+FLV group at 3 days.
MRI and BWC showed that brain edema was significantly increased in injured hemisphere at 3 days after TBI. In contrast, brain edema was significantly reduced in fluvoxamine-treated mice compared with TBI mice that received vehicle (Fig. 14A). There was no significant difference in alteration of brain edema between the sham group and the sham+FLV group at 3 days. The effect of fluvoxamine on expression of astrocytic water channel AQP4, a protein that is associated with the brain edema process, was also evaluated after TBI by western blotting and immunofluorescence staining. We found that the fluorescence intensity of AQP4 was significantly increased in the peri-contusional region at 3 days after TBI, whereas fluvoxamine treatment significantly reduced the fluorescence intensity of AQP4 at 3 days after TBI (Fig. 14D). In addition, western blotting results detected that the expression of AQP4 in cortex was significantly increased in the lesioned cortex at 3 days after TBI, whereas it was reduced in fluvoxamine-treated mice compared with TBI mice that received vehicle (Fig. 14D). Similarly, there was no significant difference in expression of AQP4 between the sham group and the sham+FLV group at 3 days.
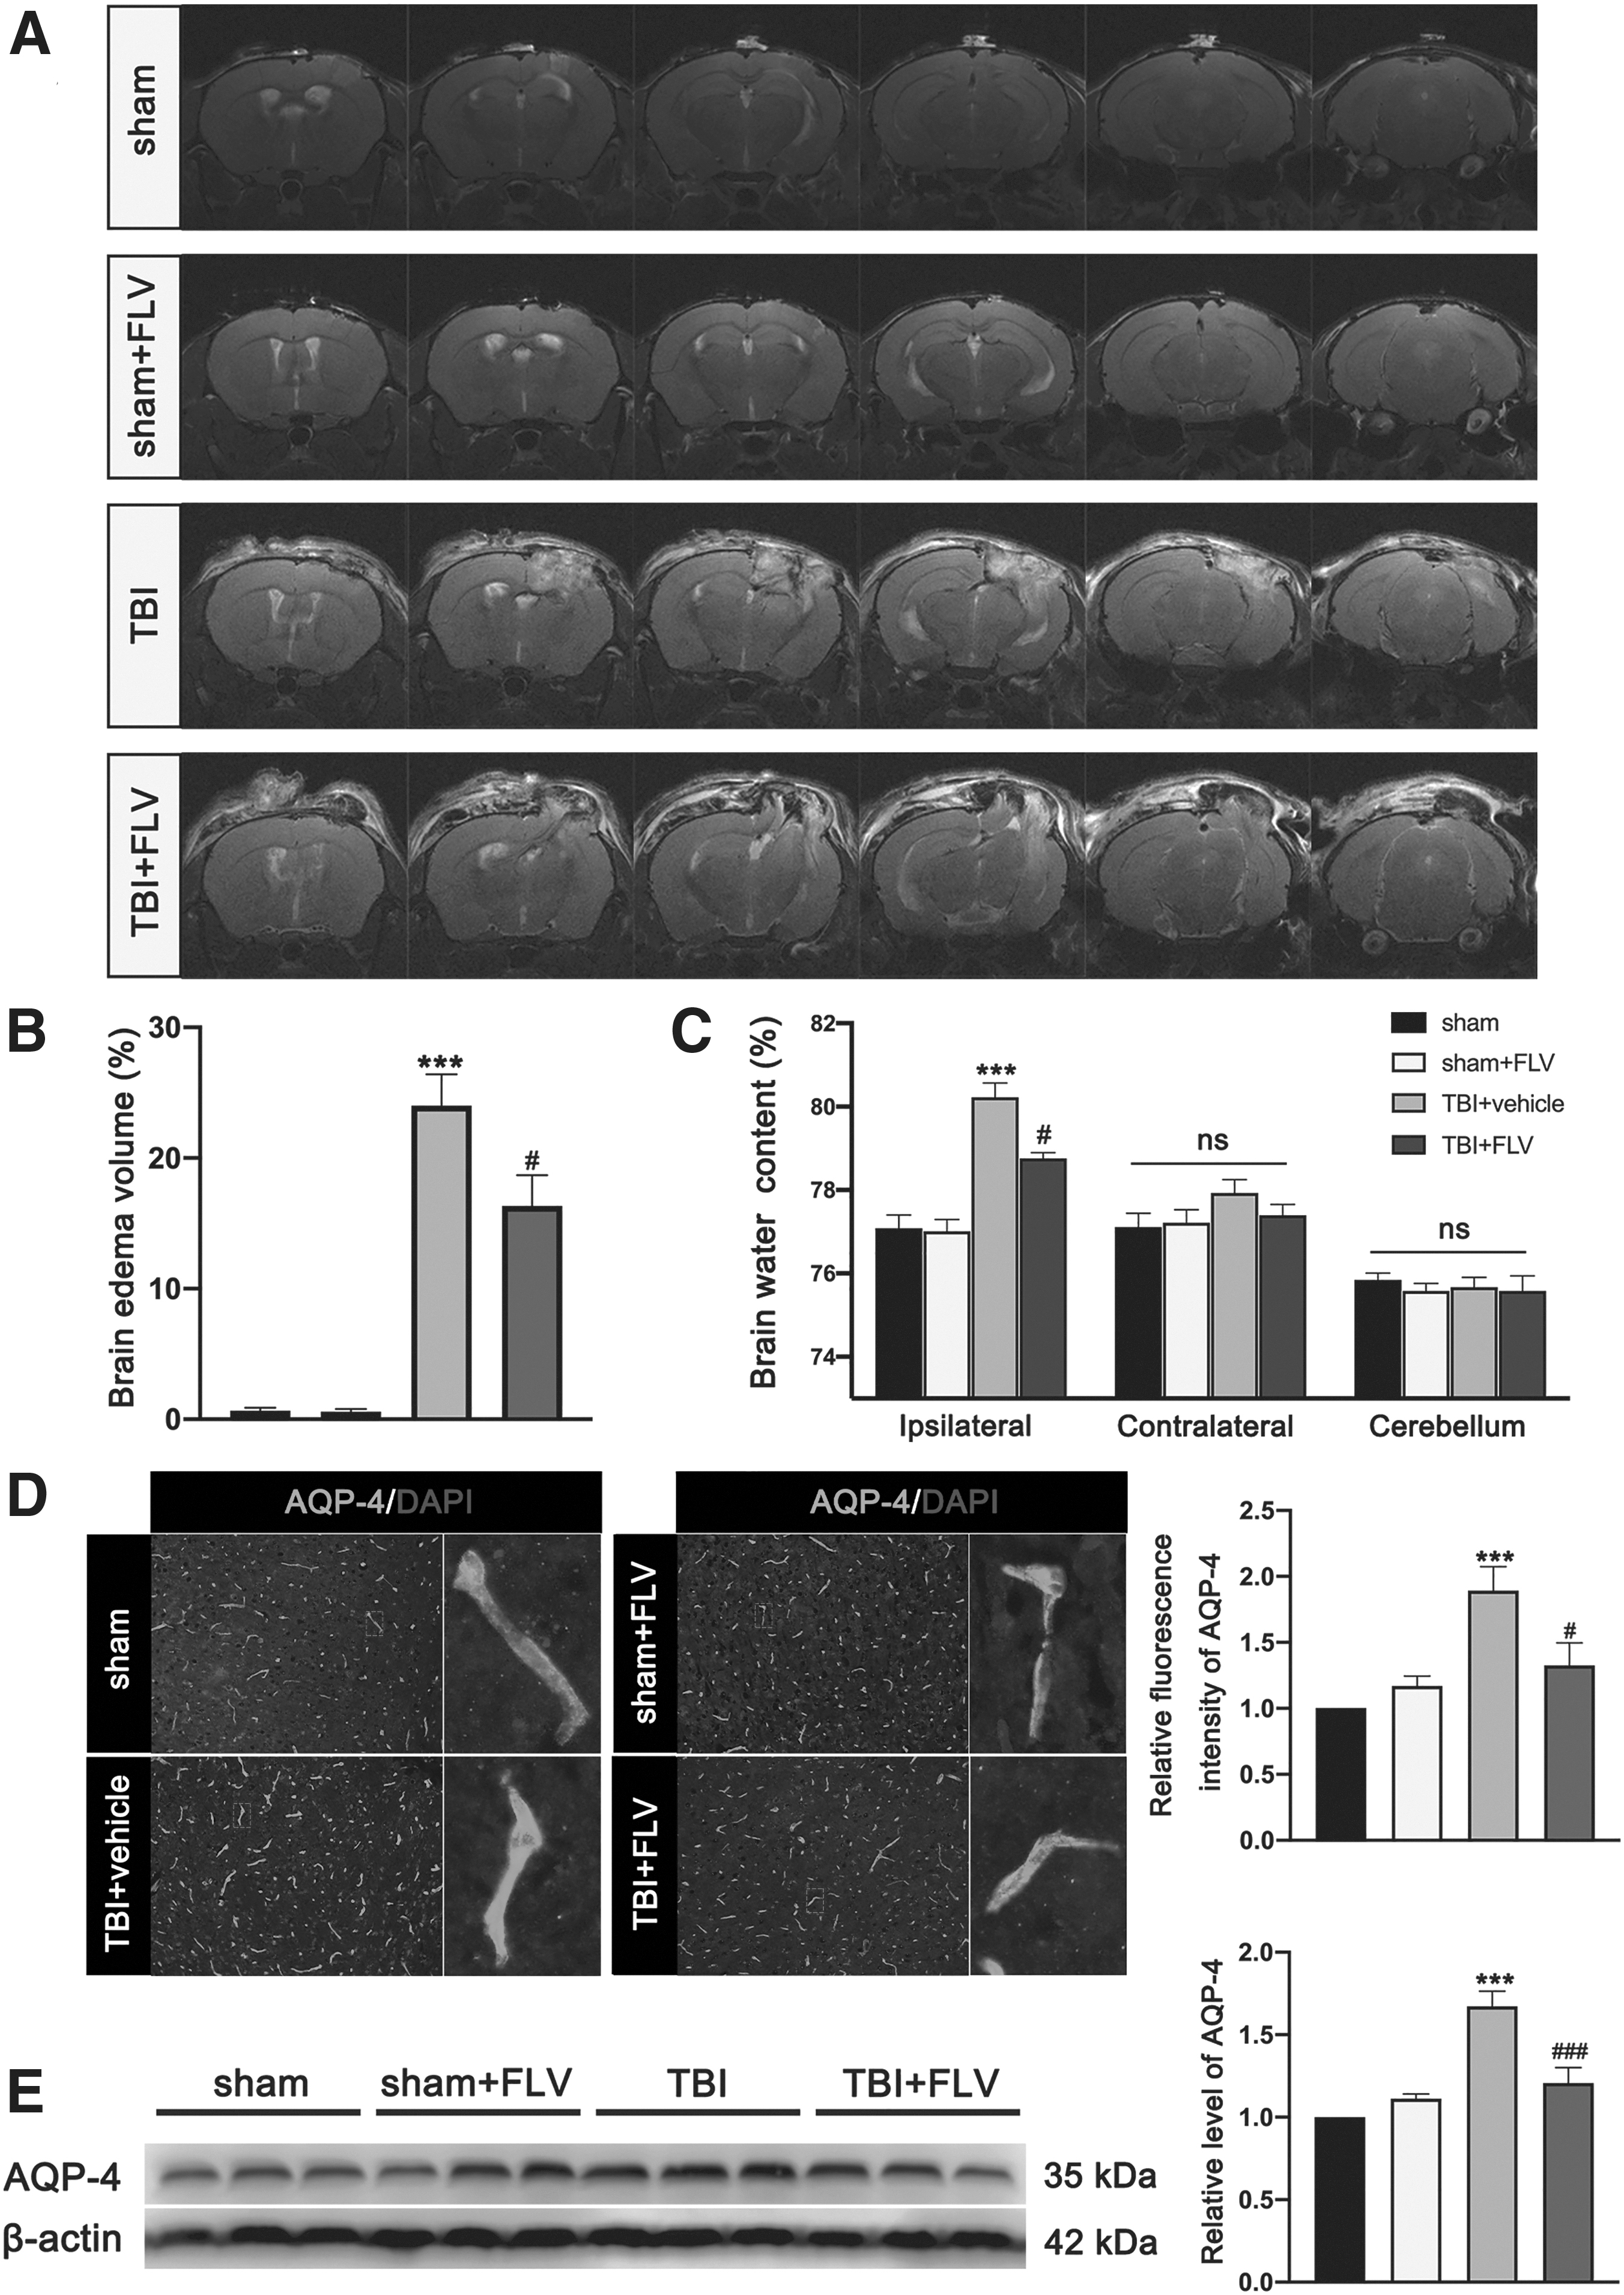
Effects of fluvoxamine on brain edema after TBI.
Discussion
In the present study, we investigated the mechanism and therapeutic effects of fluvoxamine treatment in mice subjected to TBI. The main findings of the present study were that (1) fluvoxamine treatment promoted microglial/macrophage transformation from pro-inflammatory M1 phenotype to anti-inflammatory M2 phenotype in both in vivo and in vitro experiments; (2) fluvoxamine treatment inhibited peripheral immune cell infiltration; (3) fluvoxamine treatment ameliorated neuronal apoptosis, BBB disruption, post-traumatic edema formation, cerebrovascular damage, and neurological deficits of mice subjected to TBI. The experimental results of the present study fully validate our hypothesis, revealing a therapeutic potential of fluvoxamine treatment in protecting against secondary brain injury of TBI by inhibiting infiltration of peripheral immune cells and M1 polarization of microglia/macrophages.
Neuroinflammation composed of both a central and peripheral immune response is one of the major pathological hallmarks of TBI, which is associated with neuronal death, BBB disruption, brain edema, cerebrovascular dysfunction, and neurological deficits post-injury. 23,24 Modulation of robust neuroinflammation has been recognized as an attractive therapeutic target in TBI. Compelling data have indicated that inhibition of neuroinflammation in the acute phase post-TBI exerts neuroprotective effects on secondary brain injury. 25,26 Massive glia activation and peripheral immune cell infiltration promote the release of pro-inflammatory cytokines and chemokines, and subsequently recruit and activate more pro-inflammatory cells to amplify the inflammatory response. 27 The disruption of BBB after TBI results in massive access of circulating immune cells, cytokines, and chemokines to the brain parenchyma and aggravates the inflammatory response of TBI. 28
Consistent with previous investigations, 29 we observed a massive increase in peripheral immune cell infiltration at 3 days after TBI. Our experimental results were also consistent with a previous finding that fluvoxamine significantly inhibits immune cell releasing of inflammatory cytokines in LPS-treated human blood and pre-clinical models of sepsis. 11 Microglia/macrophages are the major contributors to central immune response and have been considered as key mediators of the process of CNS inflammation after TBI. 30 Consistently, our findings demonstrate that massive numbers of microglia/macrophages were recruited and activated to the peri-lesion site in mice subjected to TBI. Growing findings have proposed that the promotion of microglia/macrophage transformation from M2 phenotype to M1 phenotype is a pivotal therapeutic target for amelioration of neuroinflammation and brain damage following TBI. 31,32 In the present study, we found that fluvoxamine treatment effectively shifted the pro-inflammatory M1 phenotype toward the anti-inflammatory M2 phenotype in both in vivo and in vitro experiments of TBI. Besides, several novel studies have identified that microglia/macrophages also include the Mhem, MHb, Mox, and M4 phenotypes. 33 However, the effect of fluvoxamine on these novel phenotypes is not elucidated in this study. Further studies are needed to clarify the role of fluvoxamine in regulating these novel microglial/macrophage phenotypes.
Recent pre-clinical studies have found that several SSRIs exert immunomodulatory and neuroprotective effects in various CNS diseases. A previous in vitro experiment showed that the antidepressant effects of SSRIs may be at least partly attributed to their anti-inflammatory properties. 7,8,34 –37 Also, the antiinflammatory effects of SSRIs primarily activating Sig-1R has been demonstrated in previous study 5,11 . Fluvoxamine, as one of the SSRIs, has been reported to have the highest affinity with Sig-1R. 9 Recently, several studies reported that fluvoxamine exerted a capacity to modulate inflammatory responses. 6 –8 Consistent with previous studies, our findings revealed that fluvoxamine exerts neuroprotective effects by exerting anti-inflammatory and immunomodulatory effects after TBI, and the anti-inflammatory effects of fluvoxamine are abolished by the Sig-1R antagonist BD-1047. Our experimental results are consistent with a previous finding about fluvoxamine significantly inhibiting immune cell releasing inflammatory cytokines in LPS-treated human blood and pre-clinical models of sepsis. 11 In addition, fluvoxamine also has been reported to target activated microglia to reduce microglia-mediated inflammatory response. 38 Consistently, our in vivo and in vitro data show that fluvoxamine plays an intense modulatory role in microglia activation and inflammatory response. Taken together, our pre-clinical data further validate the previous finding 11 on anti-inflammatory properties of fluvoxamine, and were the first to demonstrated the roles of fluvoxamine in modulation of neuroinflammation by affecting both systemic blood immune response and brain glia activation after TBI.
However, several limitations of the present study need to be acknowledged. First, we only investigated the effects of fluvoxamine in mice after TBI, and did not compare the effects of other SSRIs drugs in mice post-TBI. Second, we did not specifically demonstrate the particular mechanisms by which fluvoxamine modulated the microglial activation polarization and leukocyte invasion in mice post-TBI. Third, we only revealed the effects of fluvoxamine in mice at 3 days after TBI, and did not investigate the effects of fluvoxamine in the acute phase post-TBI. Lastly, we demonstrated that fluvoxamine ameliorated neuronal death and BBB dysfunction was indirect and dependent on the attenuation of neuroinflammation, but we did not investigate the potential for direct effects of fluvoxamine in neurons and the BBB. Further studies are needed to investigate the potential for direct effects of fluvoxamine in neurons and the BBB.
Conclusion
In summary, we report for the first time anti-inflammatory effects of fluvoxamine on secondary brain injury through inhibition of both infiltration of peripheral immune cells and M1 polarization of microglia/macrophages in a mouse model of TBI. Therefore, fluvoxamine, as one of the SSRIs, exerts therapeutic effects on the improvement of neurological outcomes after TBI at least in part by suppressing neuroinflammation, suggesting fluvoxamine might be a promising approach for treatment of TBI.
Footnotes
Authors' Contributions
X.C. and J.Z. designed the study; L.M., F.L., Y.L, F.C., L.L., and M.S. performed most of the experiments; Y.C. and W.Y. assisted in data analysis; M.S. drew the figures and wrote the article manuscript; X.C. provided overall guidance. All authors approved the final version of the article manuscript.
Funding Information
This work was supported by grants from the National Natural Science Foundation of China (no. 81671902 and no.81801234), the Project of Tianjin Applied Basic and Cutting-Edge Technological Research (no. 17JCYBJC25200), the Tianjin Health Care Elite Prominent Young Doctor Development Program, and the Young and Middle-Aged Backbone Innovative Talent Program. We thank the core facilities of the Tianjin Neurological Institute for providing technical support.
Availability of Data and Information on Materials
The data sets supporting the conclusions of this article are included within the article. Information on all materials used in this article will be made available to researchers and is subject to confidentiality.
Author Disclosure Statement
No competing financial interests exist.