




Abstract
The objective of this work was to analyze the relationships between traumatic brain injury (TBI) on computed tomographic (CT) imaging and blood concentration of glial fibrillary acidic protein (GFAP), ubiquitin C-terminal hydrolase-L1 (UCH-L1), and S100B. This prospective cohort study involved 644 TBI patients referred to Stanford Hospital's Emergency Department between November 2015 and April 2017. Plasma and serum samples of 462 patients were analyzed for levels of GFAP, UCH-L1, and S100B. Glial neuronal ratio (GNR) was calculated as the ratio between GFAP and UCH-L1 concentrations. Admission head CT scans were reviewed for TBI imaging common data elements, and performance of biomarkers for identifying TBI was assessed via area under the receiver operating characteristic curve (ROC). We also dichotomized biomarkers at established thresholds and estimated standard measures of classification accuracy. We assessed the ability of GFAP, UCH-L1, and GNR to discriminate small and large/diffuse lesions based on CT imaging using an ROC analysis. In our cohort of mostly mild TBI patients, GFAP was significantly more accurate in detecting all types of acute brain injuries than UCH-L1 in terms of area under the curve (AUC) values (p < 0.001), and also compared with S100B (p < 0.001). UCH-L1 and S100B had similar performance (comparable AUC values, p = 0.342). Sensitivity exceeded 0.8 for each biomarker across all different types of TBI injuries, and no significant differences were observed by type of injury. There was a significant difference between GFAP and GNR in distinguishing between small lesions and large/diffuse lesions in all injuries (p = 0.004, p = 0.007). In conclusion, GFAP, UCH-L1, and S100B show high sensitivity and negative predictive values for all types of TBI lesions on head CT. A combination of negative blood biomarkers (GFAP and UCH-L1) in a patient suspected of TBI may be used to safely obviate the need for a head CT scan. GFAP is a promising indicator to discriminate between small and large/diffuse TBI lesions.
Introduction
Traumatic brain injury (TBI) is a devastating condition and a significant public health issue. In the United States in 2019, the Centers for Disease Control (CDC) reported 2,530,000 TBI-related emergency department (ED) visits, 288,000 TBI-related hospitalizations, and 56,800 TBI-related deaths. 1 The total number of TBI-related ED visits, hospitalizations and deaths almost doubled from 2006 (1,880,000) to 2014 (2,880,000).
Blood biomarkers, such as glial fibrillary acidic protein (GFAP), ubiquitin C-terminal hydrolase-L1 (UCH-L1), and S100B, have been demonstrated to correlate with TBI diagnosis, and have been associated with computed tomography (CT) findings in cohorts of patients with TBI. 2 Results from a study published in 2018 in Lancet Neurology by Bazarian and colleagues showed that a combination test of GFAP and UCH-L1 yielded high sensitivity and negative predictive value (NPV) for the detection of intracranial lesions when tested for within 12 h after injury. 3 TBI is a complex and heterogeneous neurological disorder. It includes a spectrum of conditions ranging from focal lesions to diffuse injuries as well as subsequent, secondary brain damage. 4 Blood biomarkers derive from different neuroanatomic structures and reflect different pathophysiological mechanisms of TBI. 5,6 Several studies have used blood biomarkers to distinguish focal and diffuse TBI. In 2004, Pelinka and colleagues 7,8 showed that serum GFAP concentration was significantly higher in focal non-evacuated mass lesions than in diffuse axonal injury (DAI) among all types of Marshall CT classification. 9 Mondello and colleagues demonstrated that serum UCH-L1 levels were higher in patients with diffuse injury than in those with focal injury, the opposite of GFAP. 10 Mondello and colleagues 11 used a glial neuronal ratio (GNR), (which was defined as the GFAP concentration divided by UCH-L1 concentration) to examine the correlations between glial and neuronal damage in patients with severe brain trauma, and found that the GNR was significantly higher in patients with focal mass lesions than in those with diffuse injuries according to Marshall CT Classification. However, the relationship between the different types of TBI stratified by CT imaging and blood biomarkers requires further elucidation.
In this study, we sought to describe and analyze how the blood concentrations of GFAP, UCH-L1, S100B, and GNR relate to different types of TBI detected on CT imaging, and whether that relationship is confounded by other body injuries often concomitant with TBI. We also determined whether the timing of the blood draw following injury influenced the relationship between the blood and CT imaging biomarkers. Finally, we assessed whether these blood biomarkers could discriminate small and large/diffuse traumatic brain lesions on CT, which could help with early clinical decision making in TBI patients.
Methods
Study population
This prospective study involved patients admitted to Stanford Hospital's Emergency Department for suspicion of TBI between November 2015 and April 2017. Adult patients (> 18 years old) transported by ambulance or helicopter, for whom a trauma alert was triggered and who underwent a non-contrast head CT seeking care for suspected TBI, were enrolled (Fig 1).
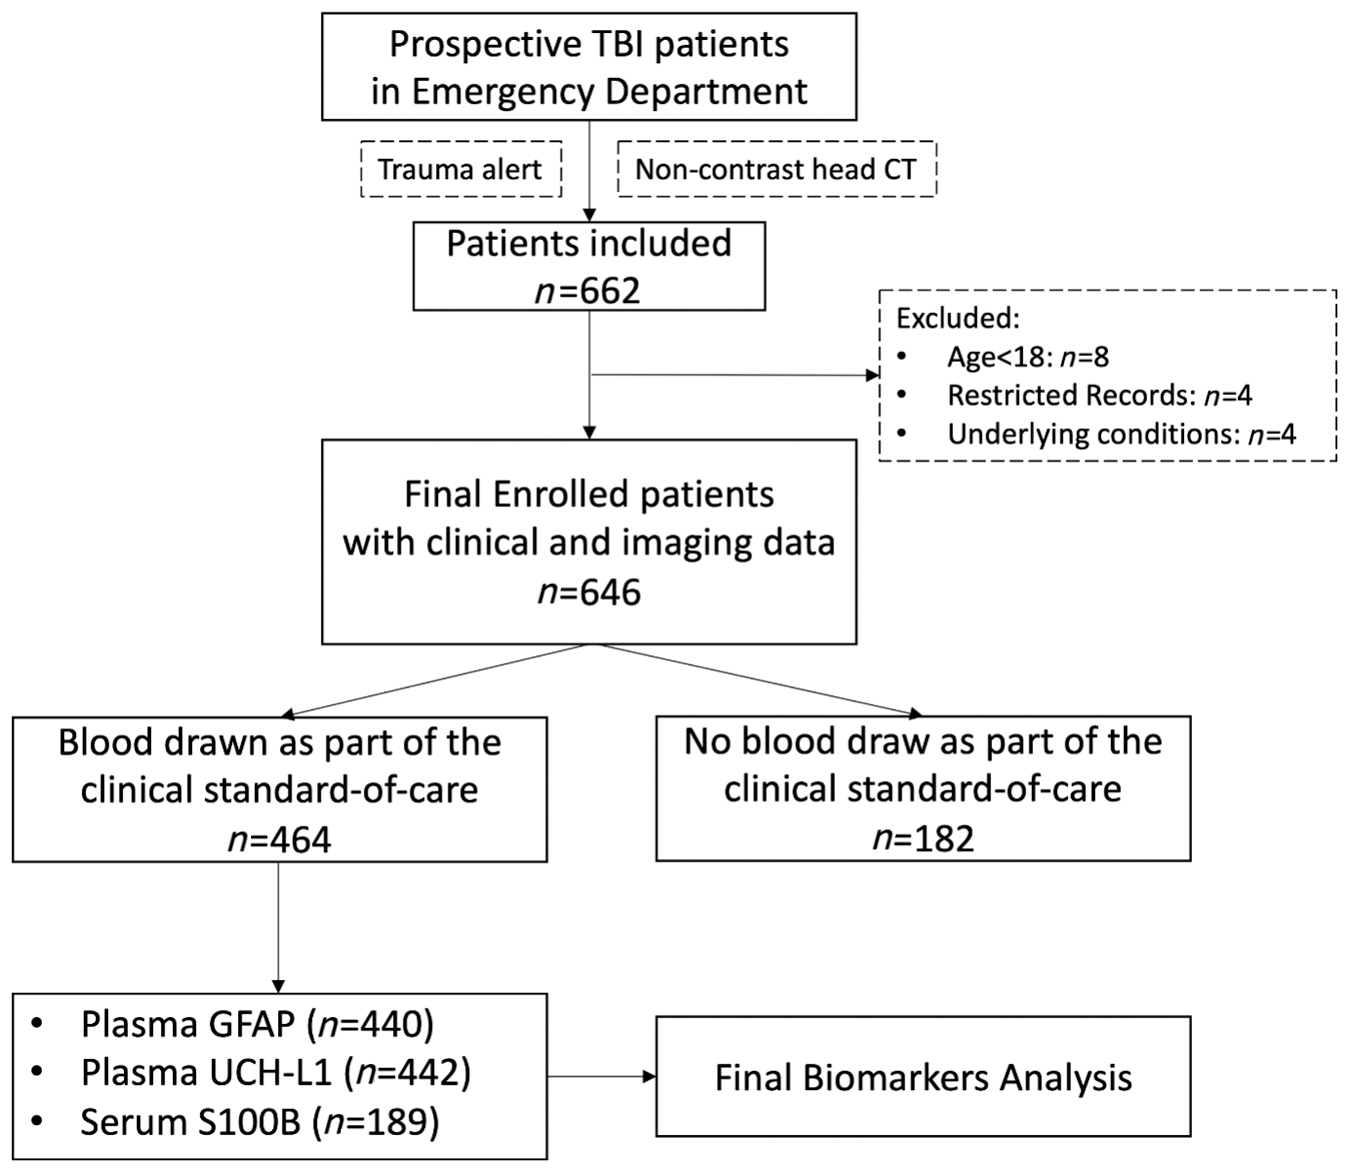
Flow chart of prospective traumatic brain injury (TBI) patients' enrollment in our study.
Other major extracranial injuries (OMEI) at the time of trauma were recorded separately (Table S1). We analyzed data separately in the full cohort and in a sub-cohort excluding patients with OMEI, to determine whether OMEI would confound the relationship between blood biomarkers and CT imaging biomarkers of TBI.
Blood sample collection and analysis
Our institutional review board (IRB) approved the use of leftover blood collected for clinical care but not used for standard-of-care clinical analysis during the first 48 h after collection. Whole blood in ethylenediaminetetraacetic acid (EDTA) tubes and serum separating tubes (SST; BD Vacutainers Part No. 367861 and 367986; Becton Dickinson, Heidelberg, Germany) were collected, when available. We collected these blood samples just before they were discarded as per laboratory protocol. A previous study 12 showed that blood biomarkers are stable in refrigerated blood for at least 72 h after collection. Blood samples were processed to plasma and serum and subsequently analyzed for levels of GFAP, UCH-L1, and S100B using Banyan Biomarkers assay (Banyan Biomarkers, San Diego, CA).
Samples were analyzed for GFAP and UCH-L1 using a sandwich enzyme-linked immunosorbent assay (Banyan Biomarkers, San Diego, CA). An electrochemiluminescence immunoassay designed for in vitro diagnostic testing (Roche, Switzerland) was utilized to detect S100B. The pre-specified cutoff values of GFAP, UCH-L1, and S100B were 22 pg/mL 3 , 327 pg/mL 3 , and 105 pg/mL 13 , respectively. A negative test result referred to markers falling at or below their pre-specified cutoff value, whereas a positive test result indicated that markers exceeded their pre-specified cutoff value. Values above/below that reportable range are reported as the upper/low value of that range, respectively, as described in the work of Bazarian and colleagues. 3
Blood samples were tested as available, resulting in GFAP and UCH-L1 test results being available for almost all patients, and S100B results limited to a subset with sufficient remaining volume.
A previous study 12 suggests that plasma and serum concentrations of GFAP and UCH-L1 are strongly correlated. Plasma data were therefore used rather than serum data for GFAP and UCH-L1 analysis because of the greater number of plasma samples available (440 plasma samples for GFAP, 221 serum samples for GFAP; 442 plasma samples for UCH-L1, 222 serum samples for UCH-L1). For S100B, more serum samples were available and therefore used for analysis (0 plasma sample for S100B, 189 serum samples for S100B).
Imaging data collection
The non-contrast head CTs were reviewed for the National Institutes of Healtth (NIH) TBI common data elements (CDEs). 14,15 Patients with TBI experience a variety of physical and cognitive effects that worsen as the type of trauma worsens. Non-invasive insights into the pathophysiology of TBI are possible using advanced imaging techniques, including magnetic resonance imaging (MRI) and CT, among others. 15 In addition to determining acute patient management and prognosis, imaging is crucial for the characterization and classification of injuries for natural history studies and clinical trials. 14 The following CDEs were recorded for their presence or absence: fracture, pneumocephalus, epidural hematoma, subdural hematoma, subarachnoid hemorrhage, intraventricular hemorrhage, parenchymal hemorrhage, contusion (divided into non-hemorrhagic contusions (only hypodensity on CT) and hemorrhagic contusions (hypodensity mixed with hyperdensity on CT), mass effect, herniation, or shift.
Statistical analysis
Clinical and imaging characteristics of TBI patients were compared based on whether plasma GFAP, plasma UCH-L1, and serum S100B results were available in order to assess for selection bias. Categorical characteristics were compared using χ 2 or Fisher's exact tests, and continuous characteristics were compared using t tests or Mann–Whitney U tests and Kruskal–Wallis tests. Distribution of time from injury to ED admission/blood draw is presented as a histogram (Fig. 2).
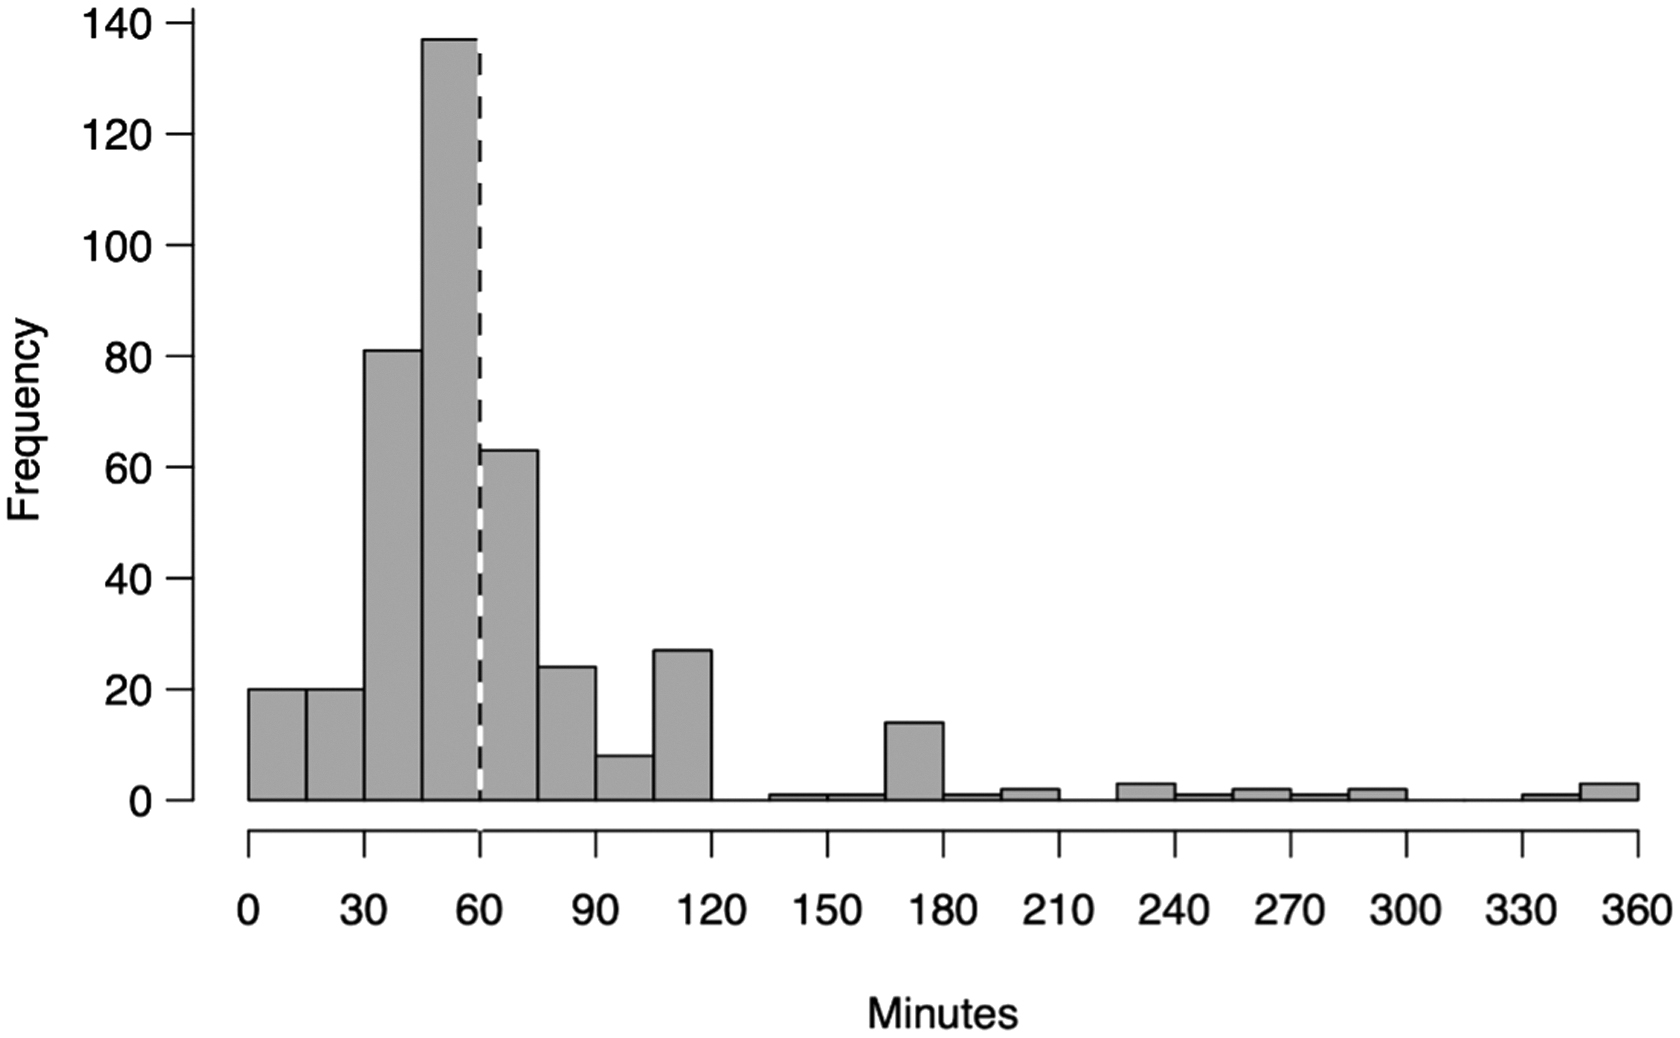
Distribution of time from injury to emergency department (ED) admission/blood draw.
Both for the full cohort and the no-OMEI subcohort, area under the receiver operating characteristic curve (AUC) was estimated for the identification of TBI (CDE categories listed previously) under the GFAP >22 pg/mL, UCH-L1 > 327 pg/mL, and S100B >105 pg/mL biomarker decision rules and visualized using heat maps (Figs. 3 and 4). These analyses were further stratified by timing of biomarker collection compared with trauma (< 1 h since injury vs. ≥1 h). Measures of classification accuracy (sensitivity, specificity, positive predictive value [PPV], and NPV) were also estimated across injury categories and visualized as line plots. Special review was performed for patients whose TBI was missed by any of the biomarker decision rules.

Heat maps of areas under the curve (AUC) achieved by each blood biomarker for identifying traumatic brain injury (n = patient count) in the full cohort and in the sub-cohort without other major extracranial injuries (OMEI).

Heat map of areas under the curve (AUC) achieved by each blood biomarker for identifying traumatic brain injury (n = patient count) in the sub-cohort without other major extracranial injuries (OMEI) and in the full cohort, stratified based on timing of the blood draw in relation to the trauma.
For each biomarker, we compared AUC for identifying any TBI by time since injury, by TBI category, and by OMEI status, and we also compared the biomarker concentrations and the GNR, which was evaluated as the ratio between GFAP and UCH-L1 concentrations 11 between small lesions and large/diffuse lesions stratified by CT images using the methodology as described in DeLong and colleagues 16 and implemented via the ‘pROC’ R package. 17 Focal lesions included epidural hematoma, subdural hematoma, focal subarachnoid hemorrhage, parenchymal hematoma, and parenchymal contusion on CT imaging. Small lesions were defined as focal lesions with a volume <25 cc and associated with a midline shift <0.5 cm. Large lesions were defined as focal lesions with a volume ≥25 cc or associated with a midline shift ≥0.5 cm. Diffuse lesions including widespread subarachnoid hemorrhage and DAI were considered together with large focal lesions. Statistical significance was assessed at the 0.05 level, and all analyses were conducted in the R statistical computing framework, version 3.6. 18
Results
Our of 644 patients, 52 had a Glasgow Coma Scale (GCS) score <13. A total of 137 patients were admitted to advanced care units, 11 patients underwent neurosurgical interventions for TBI, and 15 patients died. Patients with blood samples (462) and without blood samples (182) did not show any significant difference in terms of age, gender, and mortality (Table S1). However, patients with blood samples had more severe injury mechanism, worse GCS, more other major extracranial injury, more OMEI, longer intensive care unit (ICU) stay and overall length of stay, and less favorable ED disposition (Table S1). Patients with blood samples had more skull fractures, more intracranial hemorrhages, more contusions, and more mass effect than patients without blood samples (Table S2). When hemorrhage was present, there was no significant difference in hemorrhage volumes between patients with and without blood samples (Table S2).
Distribution of time from injury to ED admission/blood draw spanned 0–6 h (Fig. 2) with a median at 1 h, which we used as a cutoff value to dichotomize our study patients in terms of their getting a hyperacute versus an acute blood draw.
In the full cohort, 440 patients had plasma samples of GFAP and 442 patients had plasma samples of UCH-L1; 189 patients had serum samples of S100B (Fig.1). In the cohort with no OMEI, 245 patients had plasma samples of GFAP (Table 1), 246 patients had plasma samples of UCH-L1 (Table 2), and 101 patients had serum samples of S100B (Table S3).
Comparison of the Concentrations of Plasma GFAP in the No-OMEI Sub-Cohort between Small Lesions and Large Lesions for the Different Types of TBI on CT
GFAP, glial fibrillary acidic protein; OMEI, other major extracranial injuries; TBI, traumatic brain injury; CT, computed tomography; IQR, interquartile range.
Comparison of the Concentrations of Plasma UCH-L1 in the No-OMEI Sub-Cohort between Small Lesions and Large/Diffuse Lesions for the Different Types of TBI on CT
UCH-L1, ubiquitin carboxy-terminal hydrolase-L1; OMEI, other major extracranial injuries; TBI, traumatic brain injury; CT, computed tomography; IQR, interquartile range.
GFAP was significantly more accurate than UCH-L1 and S100B in detecting all types of acute brain injuries (significantly larger AUC values, p < 0.001) (Table S4, Fig. 3). GFAP was also significantly more accurate than S100B (significantly larger AUC values, p < 0.001) (Table S5, Fig. 3). The detection performance of UCH-L1 and S100B were similar (similar AUC values, p = 0.342) (Table S4, Fig. 3).
The AUC values of the blood biomarkers were only slightly more accurate in the sub-cohort without OMEI than in the full cohort (p > 0.5 for all biomarkers), indicating that the relatively low PPVs were not confounded by OMEI (Table S4 and Fig. 3). The accuracy or AUC of plasma GFAP was higher in the 1st h after trauma than after 1 h (p = 0.042), whereas no difference based on timing of the blood draw in relation to the trauma was noted for plasma UCH-L1 (p = 0.256) and serum S100B (p = 0.161) (Table S5 and Fig. 4).
Sensitivity exceeded 0.8 for each biomarker across all different types of TBI injuries, and no significant differences were observed among the different types of injury. GFAP was more specific than UCH-L1 and S100B. PPV was <0.5 and NPV was >0.8 across all different types of TBI injuries for each biomarker (Fig. 5).

Levels of classification accuracy (sensitivity, specificity, positive predictive value, and negative predictive value) achieved by each biomarker for identifying different types of traumatic brain injury in the no-other major extracranial injuries (OMEI) sub-cohort and in the full cohort.
There were no statistical differences in plasma GFAP concentrations among different types of traumatic brain injuries, independently of their volumes (Table 1). When considering one specific type of TBI, significant differences of plasma GFAP concentrations were observed between small lesions and large/diffuse lesions (especially when considering subarachnoid hemorrhage or intraventricular hemorrhage, and parenchymal hemorrhage or contusion, p < 0.001), but not for mass effect, herniation, or midline shift (p = 0.941). There was significant differences among different types of traumatic brain injuries for plasma UCH-L1 concentrations, if not considering the injury volumes (p = 0.027) (Table 2). Plasma UCH-L1 concentrations could not discriminate between small and large/diffuse lesions in most of injury types except for subarachnoid and intraventricular hemorrhages (p = 0.013). Serum S100B concentrations had poor discrimination for small and large/diffuse lesions for all different types of TBI (Table S3). The GNR could differentiate between small and large/diffuse lesions for all injuries considered together; skull fracture, pneumocephalus, or epidural hematoma; and subarachnoid and intraventricular hemorrhages (p = 0.007, p = 0.016, p < 0.001). A GNR <1 could be observed in all lesions (Table S6). As shown in Figure 6, ROC curve analyses to discriminate between small and large lesions were applied to plasma GFAP concentrations, plasma UCH-L1 concentrations, and GNR. The AUC of plasma GFAP was 0.706 and the AUC of plasma UCH-L1 was 0.608. The ROC curve analysis of GNR showed an AUC of 0.694. There were significant differences between the AUC values of UCH-L1 and GNR (p < 0.01); there was no statistical difference between the AUC values of GFAP and UCH-L1 (p = 0.353), and between the AUC values of GFAP and GNR (p = 0.901).

Receiver operating characteristic curves (ROC) for plasma glial fibrillary acidic protein (GFAP) concentrations, glial neuronal ratio (GNR), and plasma ubiquitin carboxy-terminal hydrolase-L1 (UCH-L1) on discriminating between small lesions and large/diffuse lesions.
The details of nine patients with TBI that would have been missed using blood biomarkers in predictive models are listed in Table S7 and Figure S1. It is of note that no patient would have been missed if both GFAP and UCH-L1 had been used to trigger a head CT scan (i.e., a head CT scan would have been obtained if either GFAP or UCH-L1 were abnormal). Two patients were missed by GFAP, six patients were missed by UCH-L1, three patients were missed by S100B, and only two patients were missed by both UCH-L1 and S100B (Table S7). Six of these 9 patients had subdural hematomas, typically <5 cc (Fig. S1), one of whom had chronic subdural hematomas.
Discussion
Blood biomarkers for TBI can be classified according to their presence and abundance in specific neuroanatomical structures of the central nervous system, including the astroglia, the neuron cell bodies, the axons, and the pre-/post-synaptic terminals. GFAP 2,19 is a brain-specific, glial-derived biomarker. UCH-L1 20 –22 is located mainly in the neuron cell bodies throughout the brain. S100B 21 is a calcium-binding protein found in astrocytes and in Schwann cells, which helps regulate intracellular levels of calcium, and is considered a marker of astrocyte injury. Mondello and colleagues 10 reported that distinct neuronal and glial patterns of biomarker release were associated with different types of structural brain injury as detected by neuroimaging. Thelin and colleagues found that that S100B is independently correlated to long-term functional outcome and is possibly a clinically useful biomarker for TBI patients, 23 and that a panel of blood biomarkers, including UCH-L1, GFAP, and S100B, all associated with injury severity, improve outcome prediction models. 21
In our study, we found that all three blood biomarkers had excellent sensitivity (> 80%) and NPV (> 80%) for all types of TBI detected by imaging. Of the 464 patients with blood samples, only 9 (1.9%) with TBI on CT were missed by one or the other biomarker, but none was missed by the combination of GFAP and UCH-L1 biomarkers.
Mondello and colleagues 11 defined a GNR as the ratio between GFAP and UCH-L1 concentrations, and observed that the GNR was significantly higher in TBI patients with focal mass lesions than in patients with diffuse/large lesions, indicating that GFAP tended to increase more than UCH-L1 in patients with focal mass lesions. In our study, GFAP was better than UCH-L1 or GNR (GFAP/UCH-L1) at discriminating between small and large injuries for almost all injury types on CT imaging. GFAP was not able to assess the severity of mass effect, including midline shift or herniation. For our definition of small versus large lesions, we use the same cutoff values as the well-accepted one from the Marshall CT classification. We also used the same cutoff value of 5 mm for the midline shift. Our results differed from Mondello's in the sense that GFAP, UCH-L1, and the GNR increased with the size of the lesions. Further studies are needed to refine our understanding of the concentrations of GFAP and UCH-L1 in TBI patients and of the optimal cutoff values for injuries and for small versus large injuries, and for understanding how the concentration values can guide patient management.
In our study, nine patients with TBI findings on CT would have been missed by at least one blood biomarker. There are several explanations for these false negative results. First, each blood biomarker has specific kinetics following TBI. GFAP, UCH-L1, and S100B concentration levels peak at 2024 h, 824 h, and 27.225 h after injury, respectively. GFAP and UCH-L1 levels plateau at ∼7224 h and 4824 h, respectively. As for S100B, the timing of the plateau is variable, and even small differences in the timing from injury to sampling may lead to marked changes during the 1st day after injury. 25 In our study, blood samples were collected when patients were admitted, and UCH-L1 was falsely negative in some patients who presented to the ED late after the TBI and in whom blood collection therefore occurred “late” (≥ 24 h). Another contributing factor to falsely negative blood biomarkers may be the type or location of the TBI. Falsely negative GFAP results were observed in patients with subdural hematomas (especially when small and/or when chronic) and isolated skull fractures.
It is very important to note however, that, whereas nine patients with TBI findings on head CT had one negative blood biomarker finding, no patient had both GFAP and UCH-L1 falsely negative at the same time. Therefore, a combination of negative blood biomarkers (for example, GFAP and UCH-L1) in a patient suspected of TBI might be used to safely obviate the need for a head CT scan. This is in agreement with prior reports that GFAP and UCH-L1 form an efficient TBI blood biomarker panel. 13
The specificity of blood biomarkers was limited (slightly better for GFAP than for UCH-L1 and S100B), and the PPV was <50% for all types of TBI. The causes of TBI in our study patients were multiple, including motor vehicle accidents, falls from height, and assaults, which often result concurrently with OMEI. S100B has been identified in other cells including adipocytes, chondrocytes, and skeletal muscle cells. 26 Serum S100B levels are elevated after heart surgery, 27 in stroke, 28 and in aneurysmal subarachnoid hemorrhage. 29 S100B is increased within the first 12–24 h after hemorrhagic shock without TBI and is associated with shock severity. 30 In contrast, GFAP is reported to be more specific and not increased in hemorrhagic shock without TBI. 24 In our study, the accuracy of the GFAP and UCH-L1 did not vary significantly when we looked at all patients together (including those with OMEI) and when looking only at TBI patients without OMEI, indicating that the lack of specificity could not be attributed to OMEI.
We acknowledge several limitations to our study. Our trauma patient population underwent a blood draw as part of their clinical standard of care and, as such, were involved in more severe trauma and had more TBI lesions on their head CT than patients who did not need a blood draw, thus creating a selection bias and an important lens through which to interpret the overall utility and generalizability of the results of this study. Therefore, our results will need to be verified in an unbiased population of patients suspected of TBI, who will undergo routine as opposed to selective blood draws and blood biomarker testing. Also, most of our patients were admitted very shortly after their trauma (50% were admitted within 1 h of the trauma), again reflecting a selection bias toward patients with more severe TBI and limiting the assessment of the performance of the blood biomarkers in later time windows. 24 Another limitation is that the blood samples used in this study were not readily sampled but rather were stored in a refrigerator for up to 48 h before being processed. However, a previous study 12 showed that blood biomarkers are stable in the refrigerated blood for at least 72 h after collection. The limited number of S100B samples did not allow us to compare the TBI lesions in adequate subgroups. Finally, we had to combine large lesions with diffuse subarachnoid hemorrhage and DAI to improve statistical power, given the small sample sizes in both the "large lesions" and "diffuse lesions" groups. We recognize that DAI, diffuse subarachnoid hemorrhage, and large intracranial traumatic lesions are distinct processes with associated sequelae. Further research is needed to determine the discriminative capacity of blood biomarkers for these distinct processes.
Conclusion
In conclusion, GFAP, UCH-L1, and S100B show high sensitivity and NPV for all types of TBI lesions on head CT. Although individual blood biomarkers missed patients with TBI lesions on CT, a combination of biomarkers (such as GFAP+UCH-L1) may be used to safely obviate the need for a head CT scan in a patient suspected of TBI. GFAP is a promising marker to assess the severity of TBI injuries. Future studies are needed to assess the role of blood biomarkers in selecting patients suspected of TBI and identifying those who need a higher level of care and more aggressive management.
Footnotes
Authors' Contributions
Hui Chen and Victoria Y. Ding collected the data, conducted the analysis, and wrote the article. Guangming Zhu contributed to image data collection and review, and reviewed the manuscript. Bin Jiang contributed to image data collection and review and reviewed the manuscript. Ying Li contributed to image data collection and review and reviewed the manuscript. Derek Boothroyd performed statistical analysis and reviewed the manuscript. Paymon G. Rezaii contributed to blood collection and reviewed the manuscript. Anthony M. Bet contributed to blood collection and reviewed the manuscript. Amy D. Paulino contributed to the blood sample analysis and reviewed the manuscript. Art Weber contributed to the blood sample analysis and reviewed the manuscript. Olena Y. Glushakova contributed to the analysis and reviewed the manuscript. Ronald L. Hayes contributed to the analysis and reviewed the manuscript. Max Wintermark oversaw the entire study and reviewed the manuscript.
Funding Information
This work received no funding.
Author Disclosure Statement
Amy D. Paulino, Art Weber, Ronald L. Hayes were employees of Banyan at the time of the study. The other authors have nothing to disclose.
Supplementary Material
Supplementary Figure S1
Supplementary Table S1
Supplementary Table S2
Supplementary Table S3
Supplementary Table S4
Supplementary Table S5
Supplementary Table S6
Supplementary Table S7
References
Supplementary Material
Please find the following supplemental material available below.
For Open Access articles published under a Creative Commons License, all supplemental material carries the same license as the article it is associated with.
For non-Open Access articles published, all supplemental material carries a non-exclusive license, and permission requests for re-use of supplemental material or any part of supplemental material shall be sent directly to the copyright owner as specified in the copyright notice associated with the article.
