




Abstract
Following spinal cord injury (SCI) the degree of functional (motor, autonomous, or sensory) loss correlates with the severity of nervous tissue damage. An imaging technique able to capture non-invasively and simultaneously the complex mechanisms of neuronal loss, vascular damage, and peri-lesional tissue reorganization is currently lacking in experimental SCI studies. Synchrotron X-ray phase-contrast tomography (SXPCT) has emerged as a non-destructive three-dimensional (3D) neuroimaging technique with high contrast and spatial resolution. In this framework, we developed a multi-modal approach combining SXPCT, histology and correlative methods to study neurovascular architecture in normal and spinal level C4-contused mouse spinal cords (C57BL/6J mice, age 2–3 months). The evolution of SCI lesion was imaged at the cell resolution level during the acute (30 min) and subacute (7 day) phases. Spared motor neurons (MNs) were segmented and quantified in different volumes localized at and away from the epicenter. SXPCT was able to capture neuronal loss and blood–brain barrier breakdown following SCI. Three-dimensional quantification based on SXPCT acquisitions showed no additional MN loss between 30 min and 7 days post-SCI. In addition, the analysis of hemorrhagic (at 30 min) and lesion (at 7 days) volumes revealed a high similarity in size, suggesting no extension of tissue degeneration between early and later time-points. Moreover, glial scar borders were unevenly distributed, with rostral edges being the most extended. In conclusion, SXPCT capability to image at high resolution cellular changes in 3D enables the understanding of the relationship between hemorrhagic events and nervous structure damage in SCI.
Introduction
After spinal cord injury (SCI), primary and secondary mechanisms are cumulatively involved in the irremediable nervous tissue damage. 1 The primary SCI insult causes immediate vascular rupture, disruption of passing fibers, and neuronal loss. 2
As early as 5 min post-SCI, Nissl bodies disappear from neuronal perikarya followed by cell death, a process that culminates between 4 and 8 h post-injury at the epicenter. 3 –6 During the subacute phase, spared neurons, adjacent to the initial epicenter, enter in apoptosis. 4,5,7 Meanwhile, the recruitment of immune cells and activation of resident glial cells produce a plethora of inflammatory mediators and free radicals, which further compromise the immediate peri-lesional tissue homeostasis. 1,2 Consequently, the secondary lesion extension is thought to be responsible for the worsening of the functional outcomes commonly observed in patients. 1,4 –7 It is admitted that the extent of the primary injury predicts the neurological outcomes following SCI. 8,9 Consequently, the number of spared neurons represents a key prognostic factor.
The evaluation of neuron integrity within a complex cell network with powerful imaging tools is a very demanding task. Therefore, innovative biomarkers or three-dimensional (3D) imaging modalities must be continuously developed. Even though post-mortem magnetic resonance imaging (MRI) is a useful technique for the 3D analysis of central nervous system (CNS) tissue, 10 –13 it lacks the spatial resolution needed to access the neuron scale. Conventional X-ray tomography can partially overcome this resolution limit, but it fails to produce high-contrast images from soft tissues. Although histology reaches (sub-) cellular resolution, it is a destructive procedure subject to preparation bias and lacking faithful 3D rendering abilities.
MRI, X-ray tomography, and histology limitations can be overcome by synchrotron X-ray phase-contrast tomography (SXPCT). SXPCT is a non-destructive 3D imaging technique, able to visualize low-absorbing tissue samples such as biological tissue, thanks to the high sensitivity to phase-shifting due to the differential intrinsic electronic densities in the biological tissues. 14,15 Previous ex vivo studies validated SXPCT as a tool to visualize simultaneously the architecture of vascular and neuronal networks in the mouse spinal cord, down to a 100-nm resolution, without contrast agent or tissue sectioning. 16 –18 Moreover, with full 3D scans, it is possible to align cords to root entry zones and perform raw 3D volume measurements, without calling for time-consuming stereological methods. 19 Hence, SXPCT has been applied on ex vivo mouse and rat spinal cords following SCI. Most of the experimental SCI studies focused on the evolution of the cystic cavity, the remodeling of blood vessels post-SCI, and the effect of various angiogenic modulating strategies. 19 –26 Although the cystic cavity or the spinal vascular network was easily reconstructed using tomography, none of the aforementioned studies was able to visualize the neuronal loss or the cells involved in the building of the peri-lesional scar.
Thanks to the potentiality of high resolution SXPCT, the present work characterized, for the first time, the changes of spinal cell distribution in a mouse model of cervical SCI as well as spinal tissue reaction and remodelling post-SCI.
We observed that the peri-lesional cells accumulated in an inhomogeneous distribution, showing the highest cellular infiltration and thickness rostral to the epicenter, compared with all other directions. Even though the glial scar border is only mature several weeks' post-injury, this finding will help to better define glial scar ablating strategies. In particular, we imaged the morphological evolution of the lesion with a single-cell spatial resolution affording the discrimination of neuronal subpopulations and glial cells based on differential phase-shifts. Such a finding would have been difficult to capture using classical two-dimensional (2D) serial sectioning methods.
Methods
Experimental design and animals
Fifteen male C57BL/6J mice, age 2–3 months, were included in the study. The experimental protocol (reported below in the Methods section, and in Supplementary Appendix S1) was conducted in compliance with the European Communities Council Directives for Animal Experiment (2010/63/EU, 86/609/EEC, and 87—848/EEC) and was approved by the Animal Ethics Committee (ethics project UN 17-284) of University of Namur.
Mice were divided into three groups, each including five animals: (1) uninjured, (2) C4-injured followed by euthanasia 30 min post-SCI, and (3) C4-injured followed by euthanasia 7 days post-SCI. We did not include a 12–24 h timing with the most prominent blood extravasation. We deliberately chose: 30 min post-SCI, a subacute SCI timing characterized by a significant amount of red blood cells (RBCs) accumulating into the spinal parenchyma; and 7 days post-SCI, an acute-to-chronic SCI timing, when the microhemorrhage process is being resolved, but not fully.
SCI protocol
Mice were anesthetized with a cocktail of ketamine (100 mg/kg) and xylazine (5 mg/kg) delivered intraperitoneally. The skin along the midline, between the spinous processes of spinal cord level C2 and T1, was incised to expose the mid-cervical region. The epaxial muscle layers were dissected and retracted, and muscles overlying C4–C6 were removed. The uninjured sham-surgery group underwent a laminectomy at C4, but did not receive contusion injury. Injured mice were subjected to a unilateral, right-sided, C4 spinal contusion using the computer-controlled Infinite Horizon Impactor (Precision Systems and Instrumentation, Lexington, KY, USA) with a force set at 5 × 10⁻⁴ Newton as previously described. 27,28 Animals were monitored on a daily basis, and measures were taken to avoid dehydration and to minimize any potential pain (subcutaneous administration of buprenorphine: 0.1 mg/kg twice a day during first 48 h). Using the same anesthesia cocktail, mice were euthanized by exsanguination and transcardial perfusion with NaCl 0.9% followed by phosphate-buffered 4% paraformaldehyde. The spinal cords were post-mortem harvested, further fixed in paraformaldehyde for 48 h, and kept in phosphate-buffered saline (PBS) at 4°C until imaging session. Spinal cords were ex vivo imaged with SXPCT in free space propagation mode without the use of contrast agents. 15
Synchrotron X-ray phase contrast tomography setup
The experiments were carried out at the TOMCAT beamline of the Swiss Light Source (SLS) located in Villigen, Switzerland, and at the ID17 beamline of the European Synchrotron Radiation Facility (ESRF) located in Grenoble, France.
TOMCAT beamline
The incident monochromatic X-ray energy was of 17 keV. A PCO.edge 5.5 camera coupled with optics resulting in a pixel size of 0.65 × 0.65 μm2 (field of view [FOV] = 1.7 × 1.4 mm2) and 1.64 × 1.64 μm2 (FOV = 4.2 × 3.5 mm2), respectively, was set at a distance of 5 cm from the sample. The tomography was acquired with 2751 projections (pixel size of 1.64 × 1.64 μm2) and 3351 projections (pixel size of 0.65 × 0.65 μm2), covering a total angle range of 360 degrees.
ID17 beamline
The incident monochromatic X-ray energy was of 30 keV and the distance between the sample and the detection system was set at 2 m. The detection system 29 consists of a PCO.edge 5.5 sCMOS detector coupled with optics systems to obtain a final pixel size of 3.07 × 3.07 μm2 (FOV = 7.6 × 6.4 mm2). The tomography was acquired with 2000 projections covering a total angle range of 360 degrees. The entire volume of the spinal cord was measured. The tomographic projections were reconstructed using Syrmep Tomo Project (STP). 30 After the beamtime, the samples were sectioned and further processed for histological analysis (see Supplementary Appendix S1).
Synchrotron X-ray phase contrast tomography data analysis
Neuron counting
Spinal cells, including neurons, were unambiguously visualized by SXPCT due to the different electronic densities of the soma and of the nucleus (or even of the nucleolus in the case of motor neurons [MNs]). Based on the different gray levels, the more intense nuclear region can be told apart from the soma. The discrimination of spinal cells was performed on the basis of their soma size 31 as suggested by the cell-size profiling obtained by histology methods (Supplementary Fig. S1). MN counting was carried out on tomographic images pre-processed by an adaptive threshold method. MNs in rodents are typically 20–35 μm in diameter, with MN subsets less demarcated in size. The size exclusion represents the most-used criterion to discriminate MN from non-MN populations and is widely used for counting (for a review see the article by Ferrucci and colleagues 32 ).
The counting was performed by choosing a volume size corresponding to the real volume of the neurons, as previously estimated by profiling the size distribution of the most common spinal cells in histology, based on the expression of specific markers (NeuN/neurons, SMI32/MNs, glial fibrillary acidic protein [GFAP]/astrocytes, p25α/oligodendrocytes, Iba1/microglia, CD34/endothelial cells). In a normal cervical spinal cord, we herein determined that SMI32+ MNs have a soma surface between 117.8 and 805.2 μm2. The quantification of the cell-size distribution by histology was also performed on SCI samples, in which drastic morphological changes occurred such as in the cases of neuron loss or glial activation. In such pathological conditions, astrocytes underwent hypertrophy, reaching a cell size up to 152 μm2, partially overlapping MN cells (Supplementary Fig. S1). Therefore, we set the lower threshold for considering cells as MNs on SXPCT images at a volume of 10 × 10 × 10 μm3. Only cells localized in the inferior quadrants of the spinal cord and with a volume ranging from 10 × 10 × 10 μm3 to 30 × 30 × 30 μm3 were counted. It should be noted that we set up our lower cutoff value for defining MN soma a bit lower than other groups 2,5 –7 ; as a consequence, we probably included beta and gamma MNs. However, this methodological difference was not expected to influence the results to a considerable extent for the discussion, because the same criterion was consistently used for all MN subsets, thus ensuring the possibility of performing meaningful comparisons among different experimental groups.
Spinal cord axial images were divided into four quadrants, centered on the ependymal canal. Then, we selected two regions of interest (ROIs), in the third and fourth quadrants, corresponding to the contralateral and ipsilateral ventral horns of the spinal cord, respectively (Supplementary Fig. S2). For each sample, MN quantification was separately performed, within the two ROIs (350 μm thick stacks, see Supplementary Figs. S2 and S3) at the epicenter, 0.5 and 1.0 mm from the lesion epicenter, one including the lesion epicenter and other two, rostral to the epicenter and spaced by 350 μm (see Supplementary Fig. S3).
We performed an automated 3D MN counting procedure on uninjured and injured (30 min and 7 days) spinal cords, exploiting a size-selective routine working on Fiji (3D Object counter). 33
The quantification inside the epicenter and ipsilaterally to the lesion was also done by using 2D cell counting from the maximum intensity projection along the z axis. This approach was especially useful for recovering part of the signal of the MNs, which is mainly covered by inflammatory cells. Also in this case, the images were binarized and only objects whose dimensions were between 10 × 10 μm2 and 25 × 25 μm2 were considered in the counting (in this case we used the Analyze particles plugin of Fiji).
Registration between SXPCT images and histological sections stained with retrograde tracing of cholera toxin subunit beta (CTB)
We developed a co-registration method between SXPCT images and serial matched-levels of histology sections in which phrenic MNs were retrogradely fluoro-labeled (see Supplementary Appendix S1). The rostro-caudal arrangement of the phrenic column was discriminated on tomographic spinal cord volume. This helped to identify the putative localization of phrenic MNs in various plans (frontal, parasagittal, transverse views) along the mid-cervical cord. Before registration, both the SXPCT and histological images were previously semi-automatically segmented using an edge classification algorithm and the area outside the spinal cord was masked out. Then, the histological sections were co-registered onto the tomographic images using the registration toolkit FLIRT of the FSL software (FMRIB Software Library v6.0) by a 2D linear transformation with 6 degrees of freedom (1 rotation, 2 translations, 2 scale and skew, i.e., oblique deformation; more details can be found in Supplementary Fig. S4 and in Supplementary Appendix S1). Based on the co-registered ROIs in individual slices, a 3D volume was generated to subsequently allow for counting of MNs within the phrenic column.
Results
Spinal cells at high-resolution SXPCT
SXPCT technique allowed simultaneous visualization of the gray/white matter interface, the penetrating blood vessels with their terminal branches into the gray matter and neuronal cell bodies (Fig. 1A–D). Spinal cord cell arrangement into nuclei and laminae in both ventral and dorsal horns, corresponding to the Rexed laminae, is shown in Figure 1. Thanks to the high spatial resolution (pixel size = 0.64 × 0.64 μm2) and a large FOV, it was possible to discriminate neuronal from non-neuronal populations, based on differential size, morphology, and contrast (Fig. 2). In particular, MNs were distinguished from glial cells (Fig. 2A,B; MNs appear as big cells in the image, whereas glial cells appear as small white dots), based on their size, shape, or location (e.g., if they are in white or gray matter; Fig. 2). The longitudinal view of the neuronal arrangement in the ventral horn (Fig. 2C) shows unambiguously the multi-polar morphology of MNs. In Figure 2D, a SXPCT capture of a MN matching its histological slice is shown for comparison. It demonstrates the correspondence in shape and location between MNs and satellite glial cells imaged with both techniques.

Tomographic slab of normal mouse spinal cord.
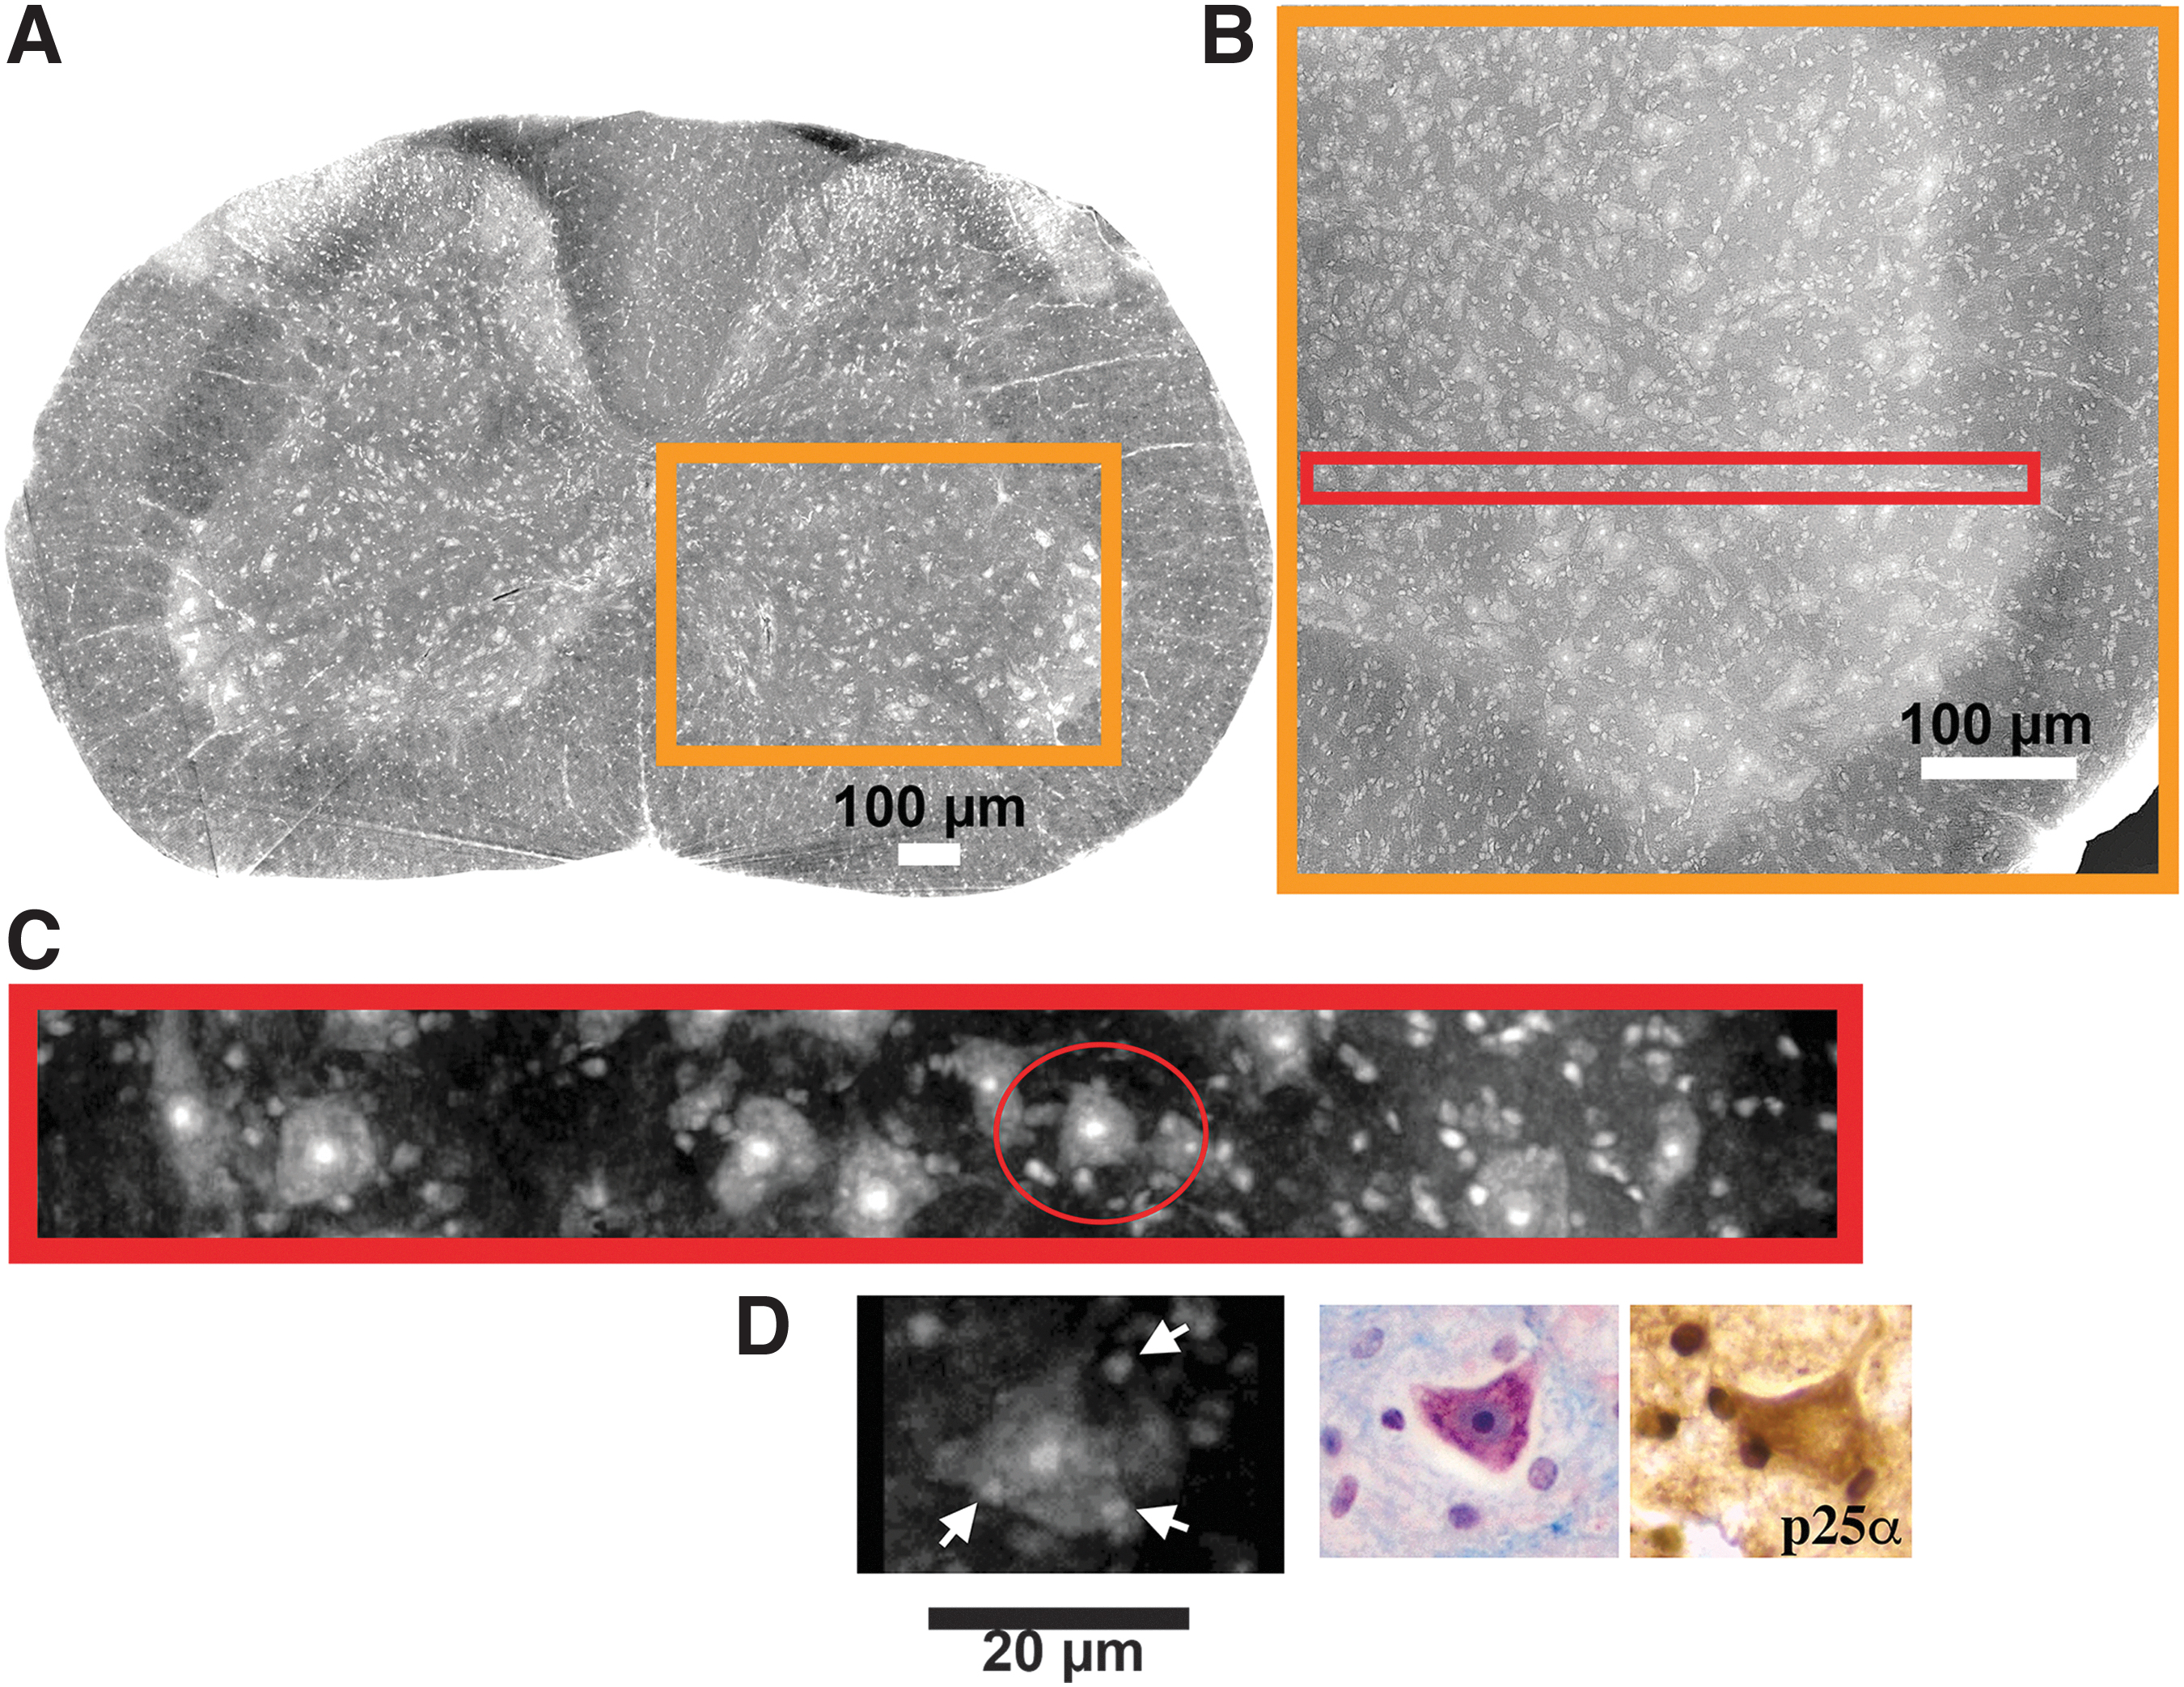
Visualization of spinal cells at high-resolution by SXPCT and histology.
Quantification of MN loss following SCI
Quantification of MNs was performed on the segmented volume of the spinal cord axial section (reported in Fig. 3) at 0.5 and 1.0 mm rostral to the epicenter (Fig. 3 D–I) compared with the sham-operated controls (Fig. 3A–C; for further information see the Methods section). The visual analysis of SXPCT imaging revealed a loss of MNs ipsilaterally to the lesion as early as 30 min post-SCI (Fig. 3D–F). The quantification of the density of MNs (expressed as cell number per volume unit) revealed a loss of MNs ipsilaterally to the lesion (at the epicenter), both at 30 min and 7 days post-SCI (see histogram in Fig. 3J). At both 30 min and 7 days post-SCI, no changes in cell density were detected at 1.0 mm rostral to the epicenter compared with sham-operated control.
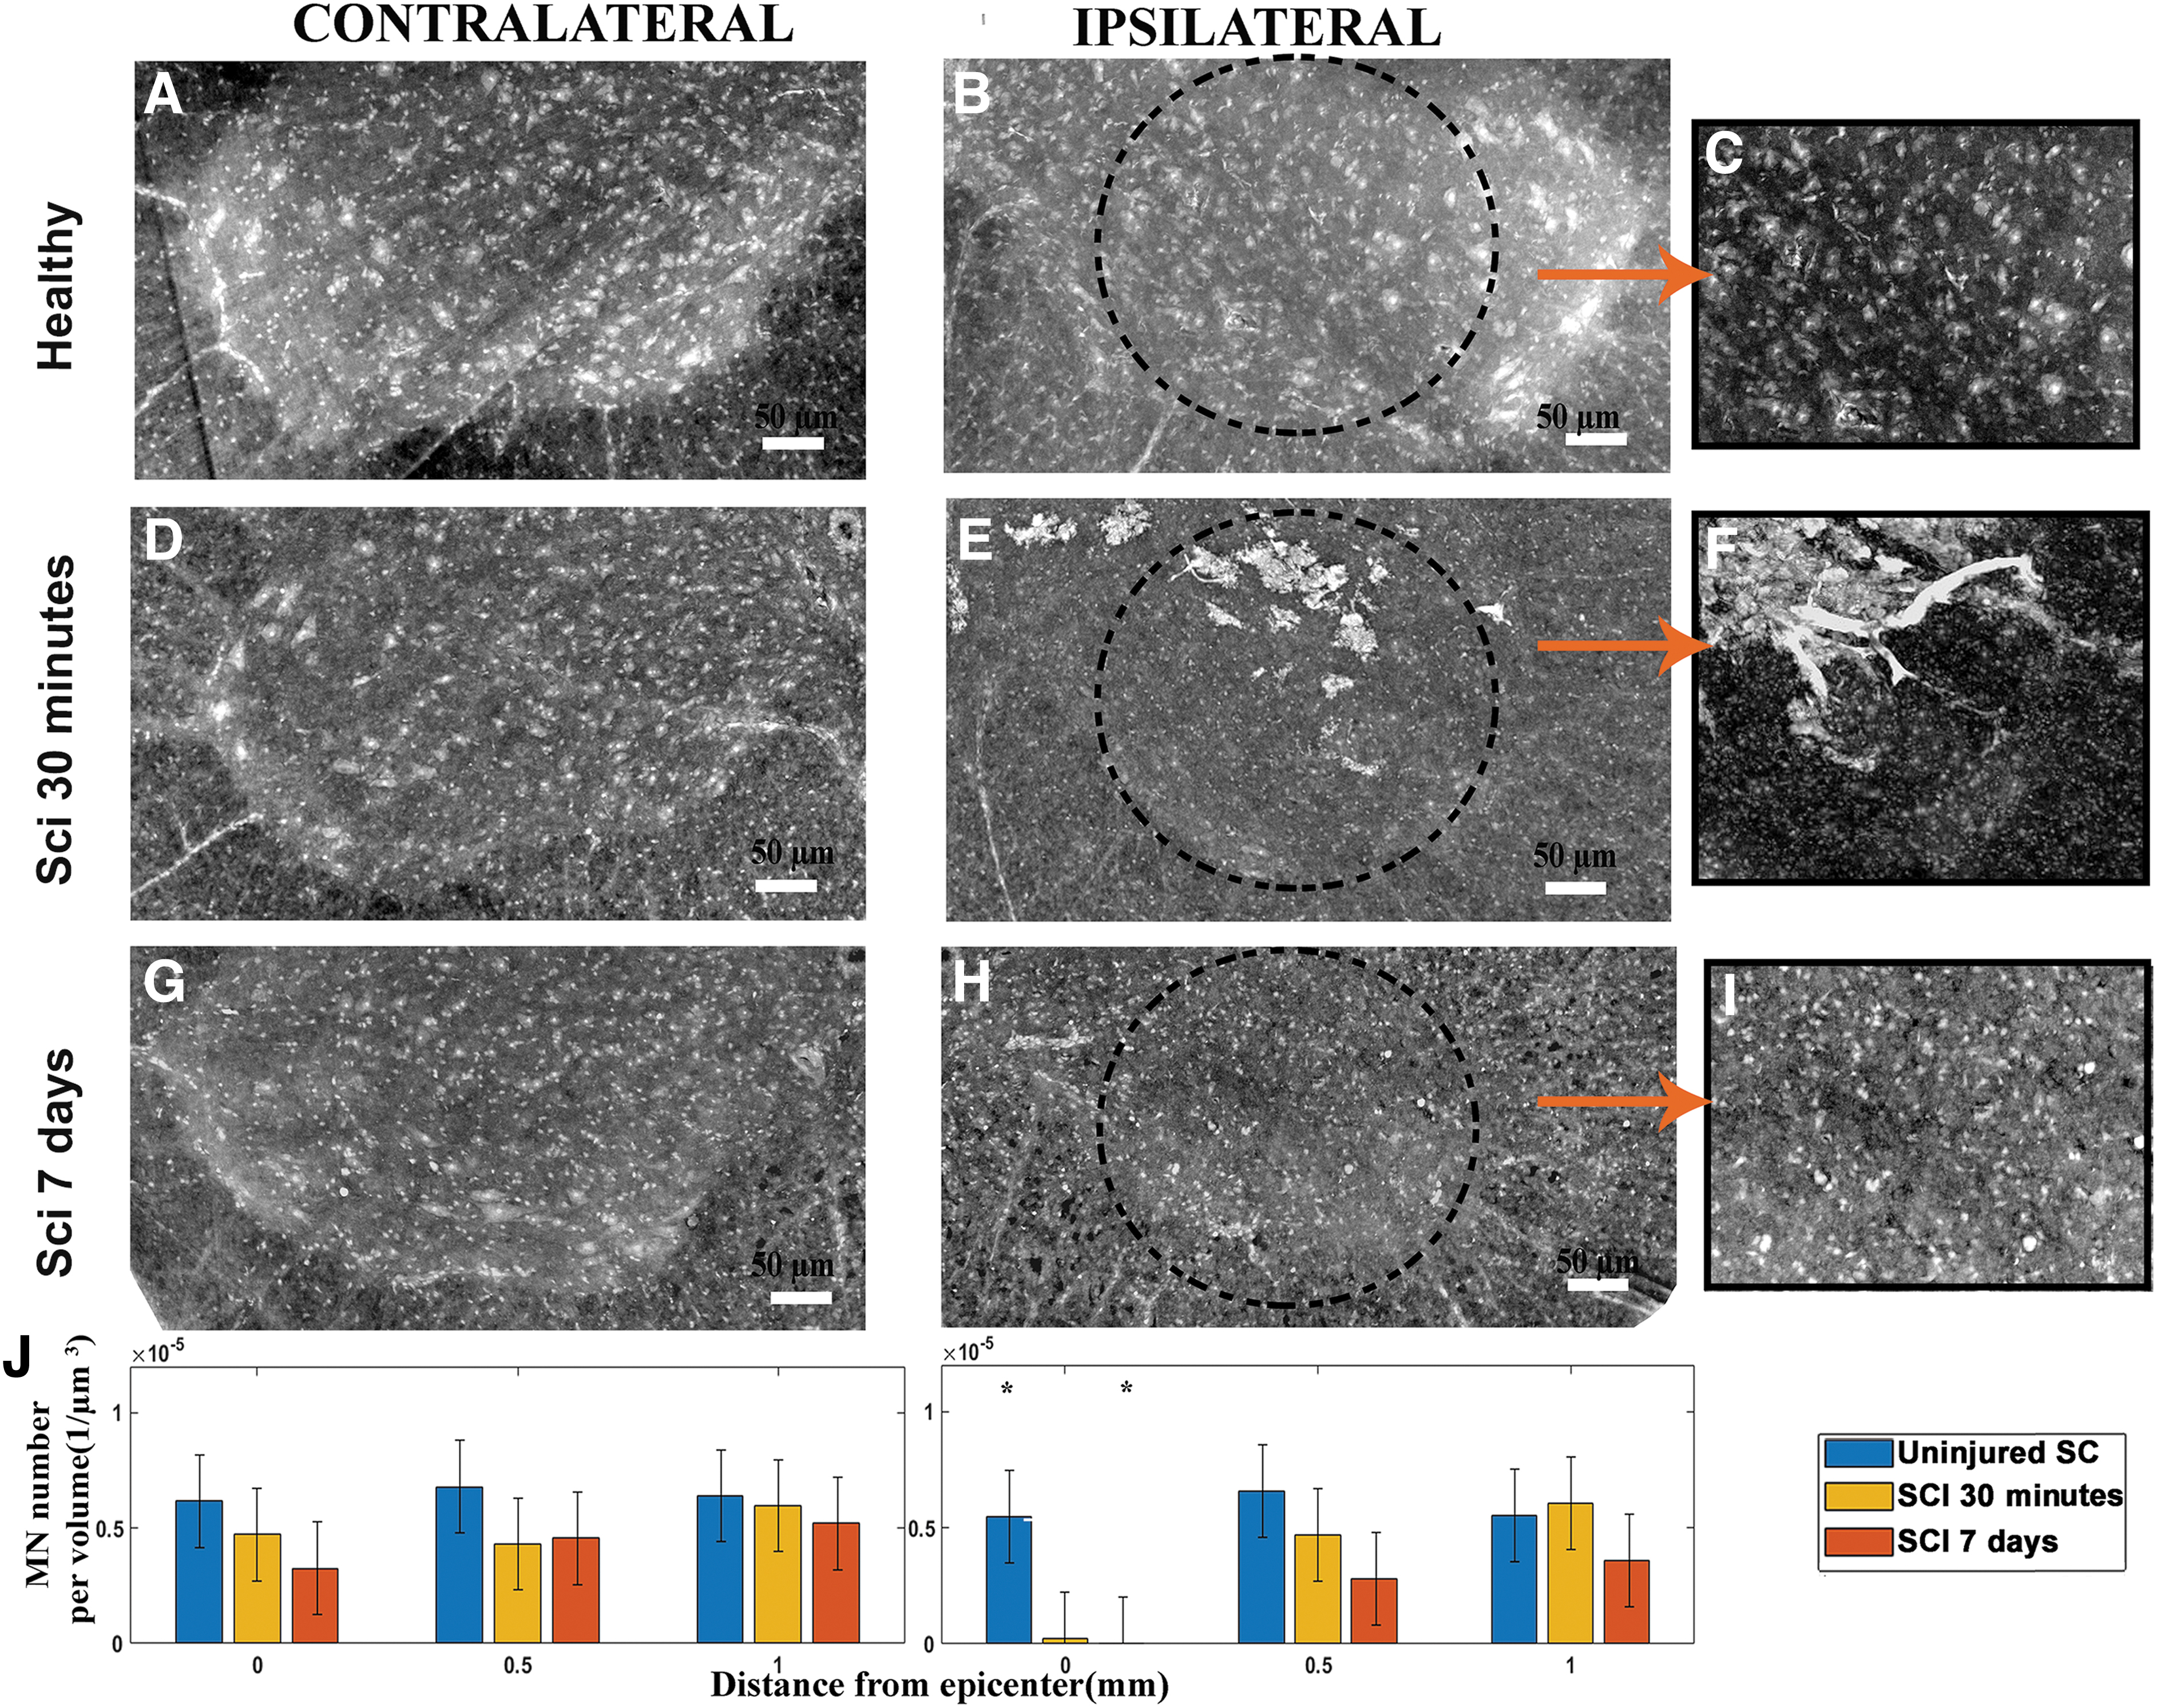
Quantification of MNs. The panels
By targeting the C4 level, a severe trauma produced a loss of cervical MNs, including phrenic MNs, as previously demonstrated in animal models. 27,34,35 Hence, the number of phrenic MNs was also evaluated at spinal level C4. We localized the rostro-caudal arrangement of the phrenic column (Fig. 4A–C) using a co-registration method based on fluorescently labeled phrenic MNs (see the Methods section and Supplementary Appendix S1). Notably, we imaged the peculiar chain-like arrangement of MNs inside those phrenic columns (Fig. 4C). We further analyzed the SCI-induced cell death at 7 days post-SCI (Fig. 4D) and found that ipsilateral phrenic MNs were not detectable anymore with SXPCT imaging at 7 days post-SCI (not shown). In comparison with an uninjured spinal cord, only 2% of MNs in the ipsilateral phrenic column were spared, whereas, in the contralateral side, there was a non-significant decrease (Fig. 4D).
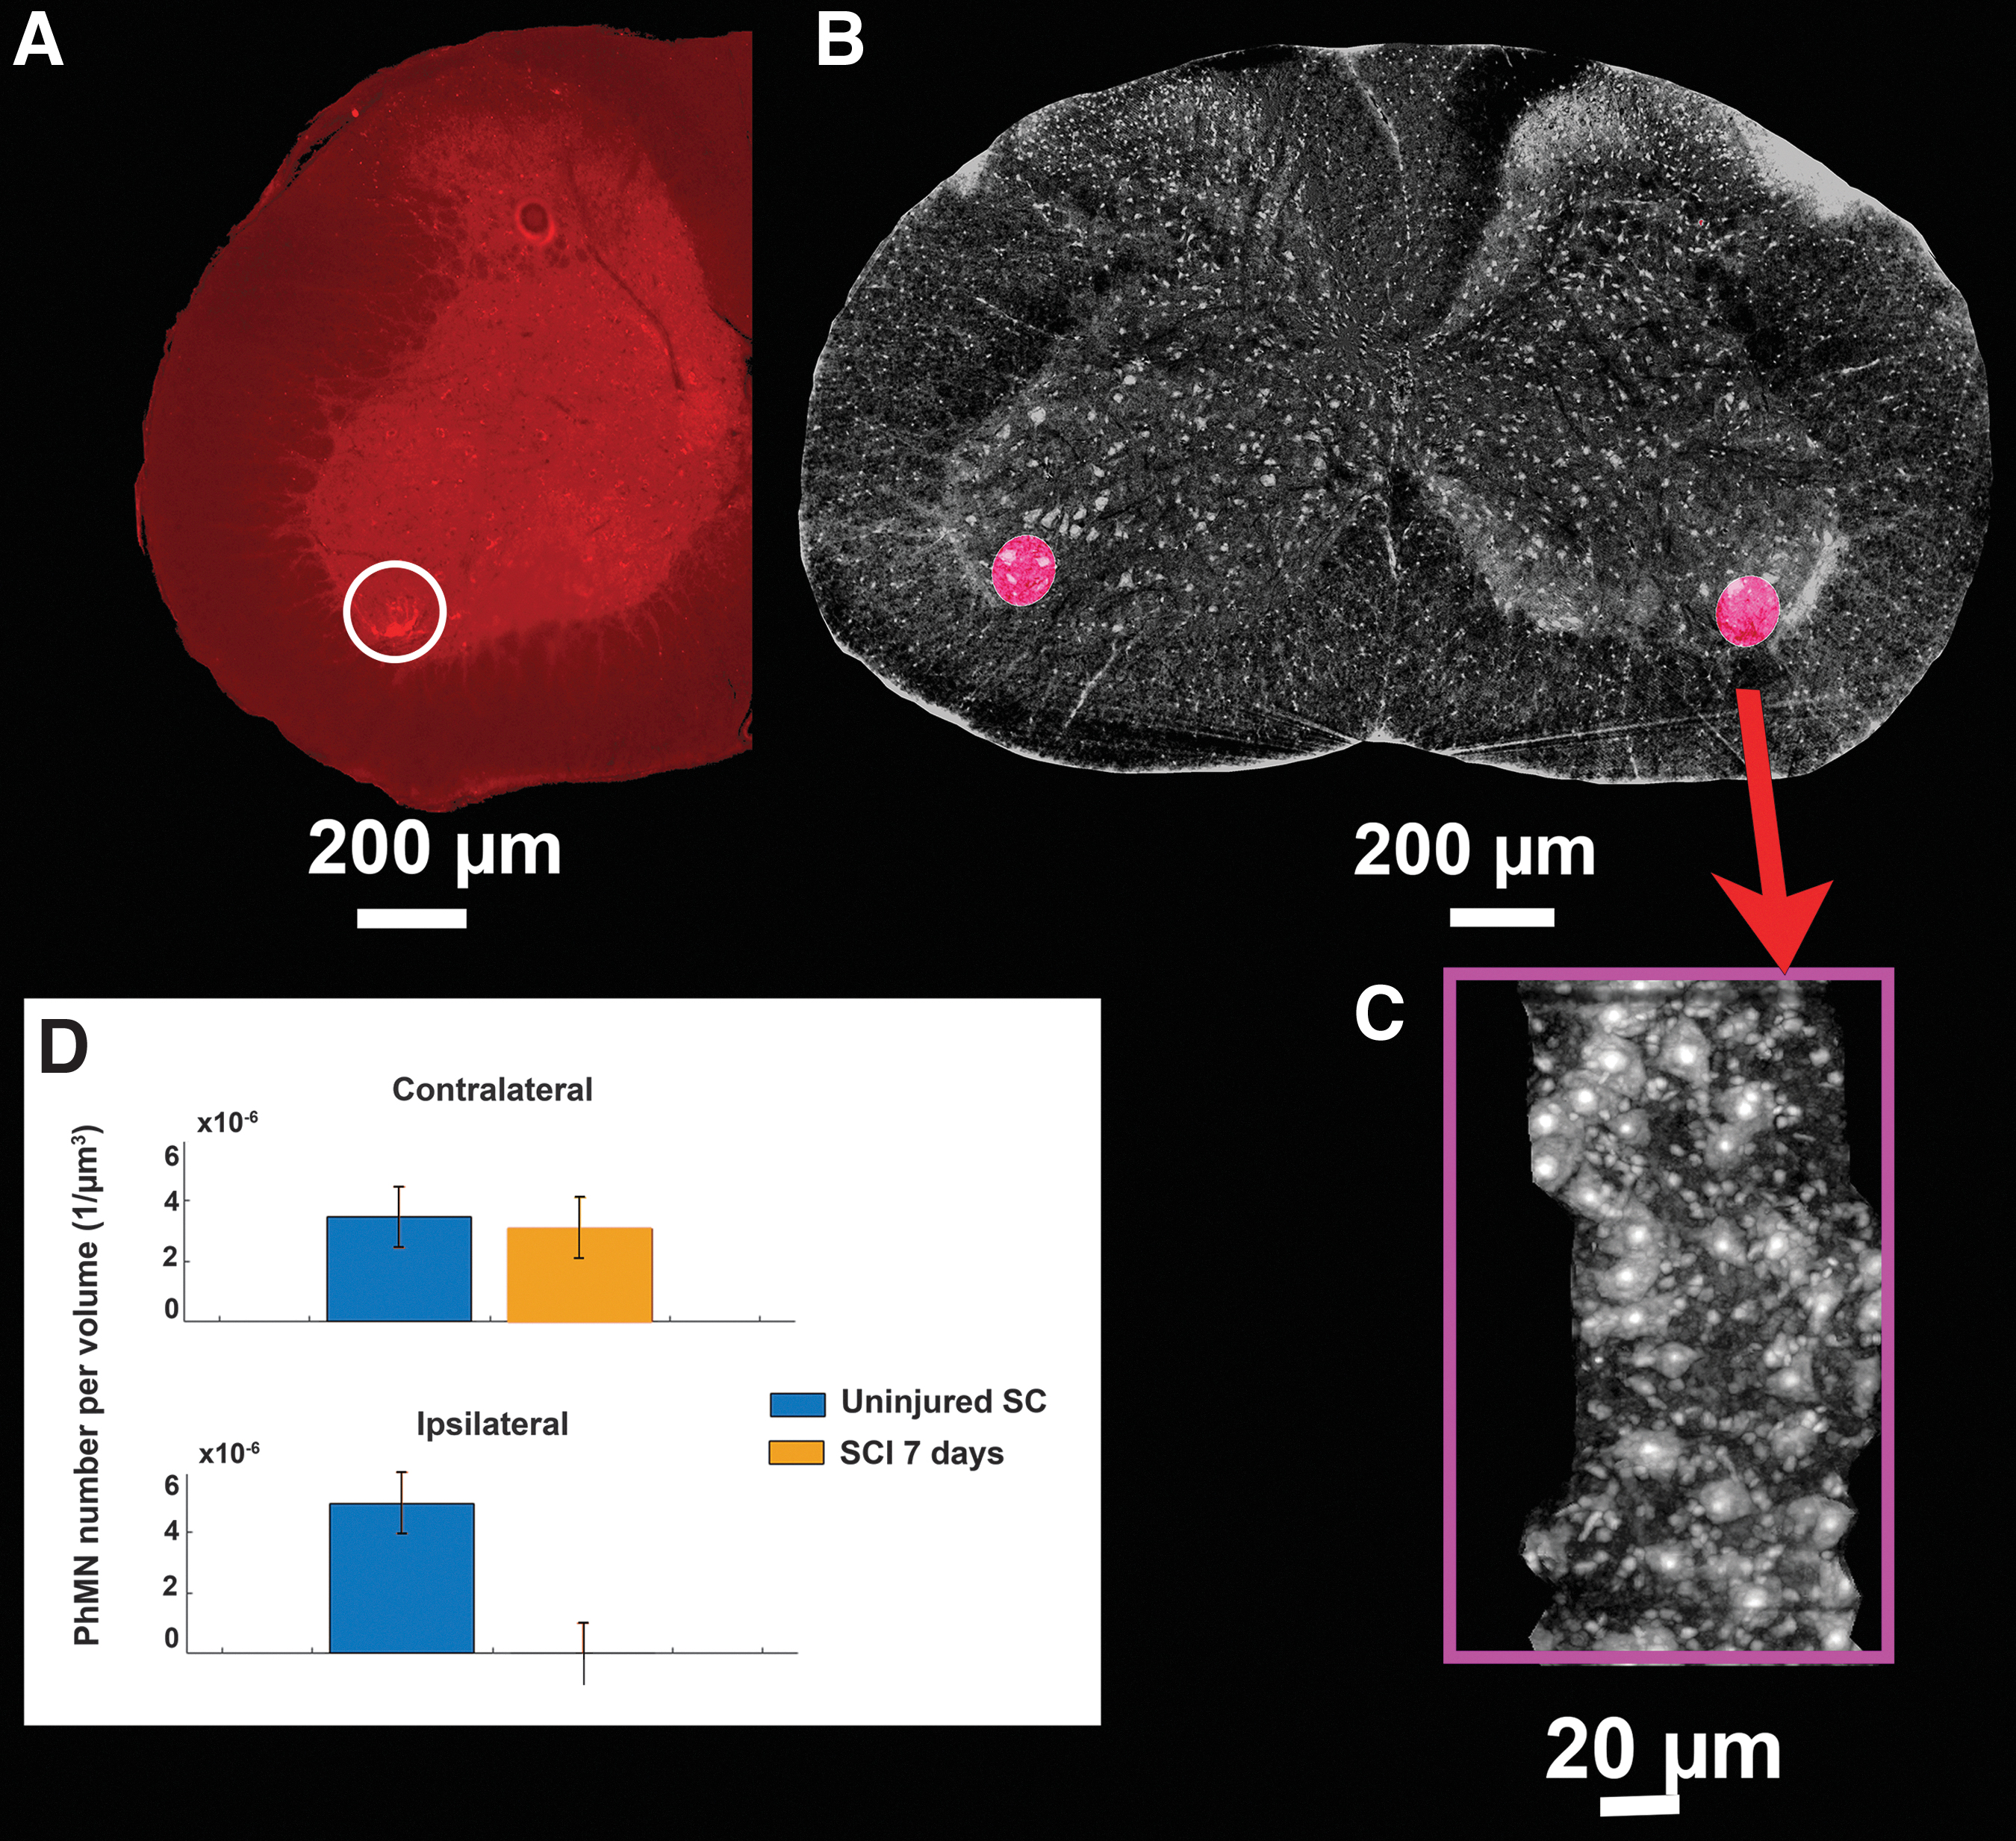
Arrangement of phrenic column in the axial anatomical planes.
Quantification of lesion volume using 3D SXPCT
Next, we characterized the morphology and the extension of the lesion at different time-points. SXPCT imaging was also able to capture the hemorrhagic events rapidly occurring after the initial trauma. As illustrated in Figure 5, the petechial hemorrhage segmented by SXPCT is correlated with Slc4a1 immunolabeling (a marker of erythrocyte surface protein band 3), but not with Perls staining (detecting Fe3+ in hemosiderin, a by-product of hemoglobin degradation), on matching SXPCT-histological slices. Thanks to the unique features of SXPCT imaging, it was possible to observe simultaneously the hemorrhagic extravasation (i.e., containing erythrocytes; bright white in Fig. 5D,G) and the damaged tissue (black holes in Fig. 5I,J). At 30 min post-SCI (Fig. 5D–F and Supplementary Fig. S3B), large areas of hyperintense signal extending into the gray matter and irradiating along the penetrating blood vessels of the white matter were unexpectedly observed. The hyperdense signal was markedly more spread at 30 min than at 7 days post-SCI (Fig. 5 D,F,G,H–J). The Slc4a1 immunolabeling evidenced RBC extravasation—and thus reflected microhemorrhage processes (Fig. 5E,H)—that were sufficiently self-explanatory and matched the SXPCT images (Fig. 5D,F).

Comparison between SXPCT and histology. SXPCT images of hemorrhage at 30 min following SCI
No such signal was observed in uninjured spinal cords. Knowing that acute events following contusive SCI include microhemorrhages, resulting from intraspinal blood vessel ruptures, we proved that the hyperdense signal observed in the gray matter was blood-borne material that had leaked into the spinal parenchyma.
More details can be found in Supplementary Appendix S1 and in Supplementary Figures S5 and S6. The hemorrhagic lesion was then rendered in 3D (by AMIRA software; Fig. 6), allowing the measurements of volume data. At 30 min post-injury, the cumulative total of microhemorrhagic volumes represented 0.540 ± 0.100 mm3 (Table 1). At 7 days post-injury, the total volume of the lesion was consistent across all injured mice and reached 0.45 ± 0.01 mm3 (see Table 1). The lesion at 30 min and 7 days post-SCI had the same volume but represented two different stages of the SCI, as a consequence of hemorrhagic events along with the secondary response of glial cells at the same 7-day delay. Considering the peri-lesional crown-shaped cellular infiltrate at 7 days post-SCI, we sought to explore how the glial scar process distributed around the lesion epicenter. We measured the thickness of the peri-lesional rim in different geometric planes using 3D SXPCT and found that, in general, the rim thickness was homogeneously formed in the axial plane (Supplementary Fig. S7G, Table 2). Intriguingly, in the coronal plane, the extension of the glial scar process was greater at the rostral border of the SCI lesion (Supplementary Fig. S7H, Table 2).

The hyperintense signal, arising from erythrocyte extravasation, is shown in magenta in
Quantitative Assessment of Lesion Volume from SXPCT Tomographic Slabs and Serial Histological Sections
Data are expressed as mean ± SD (n = 3 for SXPCT and n = 4 spinal cords for histology). The lesion volume at 7 days post-SCI was calculated by cumulating the volume of the hemorrhagic epicenter and the peri-lesional cellular infiltrate seen in SXPCT (Fig. 6B, Supplementary Video S1). For comparison and validation, the lesion volume was estimated by serial histological sections and the Cavalieri's method at 0.5 ± 0.1 mm3 onto the same samples as described in the Methods section of Supplementary Appendix S1.
SCI, spinal cord injury; SD, standard deviation; SXPCT, synchrotron X-ray phase-contrast tomography.
Peri-Lesional Rim Thickness Along the Coronal and Axial Directions
Data are expressed as mean ± SD (n = 3).
SD, standard deviation.
Discussion
This work aimed to investigate the morphology of a SCI lesion and its temporal evolution using 3D SXPCT in combination with computational and cross-validated histology methods. From one side, SXPCT was used to assess cells or tissue damage following SCI, overcoming common problems due to the lower spatial resolution of other soft-tissue 3D imaging techniques. 36 –40 On the other hand, histology combined with immunohistochemistry provides complementary information due to its specific identification of nervous cell types based on their biomarker expression profile. Major advantages of SXPCT image analysis include the direct 3D cell quantification within a volume-of-interest, avoiding many of the technical issues during sample preparation as in the case of stereology (unreliable serial sectioning, variation in staining intensities). 32,41,42
Despite stereology being the most accurate and gold standard method for measuring cell densities in CNS organs as it uses statistical extrapolation during cell counting within fixed volumes to obtain an estimate, 43 it is subject to observer bias in which subjective differences in cell counting arise. 44 When immunolabeled cells are used, some cell types may be undercounted based on staining variability or modulation of expression along the disease course. In addition, it suffers from tissue shrinkage incurred during dehydration and from paraffin embedding that is usually not controlled, resulting in a source of error.
Therefore, estimating sample volume can pose a significant challenge in obtaining a reliable number of cells per volume unit. Even within a CNS region, cell densities can vary across the anatomical region; this is particularly the case in the distribution of neurons along the spinal columns and in the various Rexed laminae. The most accurate density map of the spinal cord would therefore not necessarily come from a design-based stereology method, but rather it would measure cell number or cell densities at all points in a 3D reference atlas. This is where our SXPCT approach can fill many gaps in the knowledge of cell distribution and cell densities in the spinal cord.
In our study, stereology was not initially the ideal approach, because it required serial thick-tissue sections (typically >20 μm) to be useful. Thus, a specific experimental design, including neuron immunolabeling, needed to be used to make stereology applicable. For the latter, a specific experimental design, including neuron immunolabeling, needs to be tuned up to make stereology applicable. In our case, histological data came from serial 10-μm thick sections, immunolabeled for the detection of various cell populations (neurons, oligodendrocytes, astrocytes, microglia) including endothelial cells and extravasated RBCs. To validate our approach, we proposed comparison of the computer-assisted counting of NeuN+ neuron cell bodies from 10-μm histological slices with the size-based counting of cells within level-matched 10-μm slabs from SXPCT (see Supplementary Fig. S8).
In the present case, MNs are intermingled with other neuronal and glial populations in the ventral horn and the localization of the Rexed laminae (i.e., lamina IX) slightly varies along the rostro-caudal axis. Stereological methods thus show their limitations for MN quantification because they assume a random distribution of the objects counted within the ROI. 32 SXPCT image analysis might therefore offer a complementary or superior alternative to stereology counting, although the identification of cells relies on morphological features. 17
Within the first 30 min post-SCI at epicenter, the quantification showed a loss of ipsilateral MNs, according to the decrease of neuroplasmic contrast. Such a neuronal loss remained at the same magnitude at 7 days post-SCI. In addition, between 7 days post-SCI and 30 min post-SCI no drop was shown in MN number within a given volume 0.5 mm away from the epicenter, which suggests no overt extension of primary lesion during the subacute phase. To specifically quantify a MN subset belonging to lamina IX, we co-registered cervical MNs with histological slices, into which phrenic MNs had been beforehand fluorescently labeled. The final result represents an estimation of the phrenic MN density at level C4. However, the number may be overestimated, taking into account the inclusion of neurons intermingled with phrenic MNs and the heterogeneous distribution of phrenic MNs along the phrenic column. Accordingly, following C4 injury, SXPCT-based image quantification estimated that about 98% of phrenic MNs were lost ipsilaterally within the considered volume. SXPCT allowed the achievement of the simultaneous visualization of different pathological processes (MNs loss and petechial hemorrhage) using a single image acquisition.
Following a spinal contusion, vascular integrity is compromised. 45 The rupture of small intramedullary capillaries, very susceptible to traumatic damage, leads to intraparenchymal blood extravasation, unlike large extramedullary vessels (i.e., anterior or posterior spinal arteries) that usually remain intact. Injured spinal cords showed areas of petechial hemorrhage more predominantly in the gray matter due to the enriched capillary network of this area. The vascular injury was not limited to the epicenter as it expanded in rostral and caudal directions resulting in an ovoidal-shaped hemorrhagic lesion. The extension of microhemorrhage was easily visualized in 3D on SXPCT tomographic slabs without the use of any contrast agent, whereas it was hardly assessed on tissue sections routinely stained. The hyperdense signal detected on SXPCT images was likely caused by the accumulation of extravasated erythrocytes, which contain hemoglobin molecules with a dense core of iron. The lesion (herein deliberately referred as the hemorrhagic area), the central tissue loss and the hypercellularized peri-lesional area did not extend in volume between the acute timing (30 min) and the subacute time-point (7 days post-SCI).
The absence of significant volumetric differences or spatial spreading between 30 min and 7 days suggests that the petechial hemorrhage could be one of the earliest predictors of lesion extension 7 days later. A similar result has been obtained in a recent work based on SXPCT imaging, 19 in which the tissue pathology following a cervical level (C6) contusion injury was studied over acute to chronic (24 h to 5 weeks) post-injury time-points. In this case, four injury time-points were considered including 24 h post-injury, 72 h post-injury, and 1 week and 5 weeks post-injury. Lesions at different time-points were compared with each other and with the sham sample. In that comparison, the authors found that tissue damage area did not change between 24 h and 1 week after injury, which is consistent with our results. Of course, we cannot rule out that the lesion together with the neuronal loss keeps extending beyond the 7-day time-point.
Lastly, we observed that the peri-lesional glial scarring was built as an inhomogeneous process, showing the highest cellular infiltration and thickness rostrally to the epicenter, compared with all other directions. Even though the glial scar border is only mature several weeks' post-injury, this finding will help to refine therapeutic strategies targeting glial scar process. 46
However, one of the limitations of the present study is the use of the mouse as a rodent model of SCI. It is known that the pattern of spinal tissue reaction and remodeling post-SCI differs between mice and rats or humans. Rats are prone to develop large fluid-filled cystic cavities at the injury epicenter (thereby mimicking the human pathology)—in more than 90% of cervical contusion SCIs according to our previous reports—whereas mice do not. 27,34,35 The exact reason for such discrepancy between closely related rodent species is so far not known.
Advances in correlative microscopy, non-invasive imaging, and 3D image reconstruction pave the way for collecting accurate cell density information, including counting and spatial distribution, inside the spinal cord, with the aim of building a high-resolution cell atlas, similar to the initiatives that have started for the brain (e.g., EBRAINS projects). Combined with microscopy techniques that count cells labeled with multiple markers, SXPCT would allow cell-type specific registration in space, resulting in the building of a virtual cell spinal cord reference atlas. Thanks to progress in brain tissue clearing methods, neuron cell bodies and their projections can now be tracked in 3D in a whole-brain approach. In this vein, alignment to a standard reference atlas is being requested. 41 Beside the distribution of neurons, comprehensively mapping the distribution of glial cells or the vascularization down to the capillary scale would afford an unprecedented anatomical precision, leading to enhanced understanding of the neuron–glia relationship, the neurovascular unit, and their disease-induced changes.
Conclusions
Three-dimensional structural analysis of the spinal cord at cellular resolution might yield crucial information for the understanding of the pathological changes during the subacute or chronic stages of SCI. As proposed here, SXPCT-based image analysis offers the possibility to fill many gaps in the current knowledge of nervous cell distribution in the healthy or diseased spinal cord. We believe that the application of this technology will offer a powerful and physiologically relevant tool for the study of neuronal and glial morphological changes. In addition, it will help to evaluate non-invasive therapeutic strategies targeting nervous cells, scar-forming cells, or the inflammatory process following SCI.
Footnotes
Acknowledgments
The COST Action CA16122, Biomaterials and advanced physical techniques for regenerative cardiology and neu rology (BIONECA), is acknowledged for networking support. The authors thank the staff of the TOMCAT beamline at Swiss Light Source of Paul Schrerrer Institut (SLS-PSI) for their experimental support. The authors thank also Lorenzo Massimi and Inna Bukreeva for the fruitful discussions during the preparation of the manuscript and Luisa Le Donne for the English review of the manuscript. The authors also acknowledge the European Synchrotron Radiation Facility (ESRF) for provision of synchrotron radiation facilities through proposal MD1041. This research was made possible thanks to the access to the microscope facility of the Plateforme Technologique Morphologie—Imagerie (Université de Namur). The team would like also to acknowledge the significant help from two Université de Namur students: Thomas Duquesne and Lea Longueville.
Funding Information
The Italian Ministry of Health Young Researcher Grant 2013 (GR-2013-02358177) is acknowledged for financial support. Part of the research reported in this article was also supported by the FISR Project “Tecnopolo di nanotecnologia e fotonica per la medicina di precisione” (funded by MIUR/CNR, CUP B83B17000010001) and the TECNOMED project (funded by Regione Puglia, CUP B84I18000540002).
Author Disclosure Statement
No competing financial interests exist.
Supplementary Material
Supplementary Appendix S1
Supplementary Figure S1
Supplementary Figure S2
Supplementary Figure S3
Supplementary Figure S4
Supplementary Figure S5
Supplementary Figure S6
Supplementary Figure S7
Supplementary Figure S8
Supplementary Video S1
References
Supplementary Material
Please find the following supplemental material available below.
For Open Access articles published under a Creative Commons License, all supplemental material carries the same license as the article it is associated with.
For non-Open Access articles published, all supplemental material carries a non-exclusive license, and permission requests for re-use of supplemental material or any part of supplemental material shall be sent directly to the copyright owner as specified in the copyright notice associated with the article.
