




Abstract
Cardiometabolic disease is a leading complication of spinal cord injury (SCI) that contributes to premature all-cause cardiovascular morbidity and early death. Despite widespread reports that cardioendocrine disorders are more prevalent in individuals with SCI than those without disability, a well-defined pathophysiology has not been established. Autonomic dysfunction accompanying disruption of autonomic spinal tracts may contribute to dysregulation of energy metabolism via uncoupling of integrated hunger and satiation signals. In governing human feeding behaviors, these signals are controlled by a network of enteroendocrine cells that line the gastrointestinal (GI) tract. These cells regulate GI peptide release and autonomic systems that maintain direct neuroendocrine communication between the GI tract and appetite circuitry of the hypothalamus and brainstem. Here we investigate gene-expression and physiological changes in GI peptides and hormones, as well as changes in physiological response to feeding, glucose and insulin challenge, and evaluate GI tissue cytoarchitecture after experimental SCI. Adult female mice (C57BL/6) were subjected to a severe SCI (65 kDyne) at T9, and a sham control group received laminectomy only. The SCI results in chronic elevation of fasting plasma glucose levels and an exaggerated glucose response after an oral glucose and insulin tolerance test. Mice with SCI also exhibit significant alteration in gut hormone genes, plasma levels, physiological response to prandial challenge, and cell loss and gross tissue damage in the gut. These findings demonstrate that SCI has widespread effects on the GI system contributing to component cardiometabolic disease risk factors and may inform future therapeutic and rehabilitation strategies in humans.
Introduction
Cardiovascular disease (CVD) and related neuroendocrine/metabolic disorders are a leading cause of morbidity and death in chronic traumatic spinal cord injury (SCI). 1 –4 Several component cardiometabolic risk factors, including obesity, 5,6 elevated fasting glucose and frank diabetes, 7,8 dyslipidemia, 3,9 and hypertension (depending on the extent and level of injury), 10 –12 are observed earlier in the life span and at increased frequencies after SCI. 13
In particular, obesity is strikingly comorbid with glucose intolerance and insulin resistance, 14 –18 risk factors that are strongly associated with a “pro-inflammatory phenotype” that further accelerates atherogenesis 16 and CVD. 19 These hazards may explain, or provoke, premature pathology of the cardiovascular and neuroendocrine systems. 20
These cardiometabolic comorbidities after SCI are largely attributed to maladaptive metabolism related to physical deconditioning 19,21 and reduced whole-body energy expenditure, especially in injury above the spinal level (T6) of sympathetic nervous system outflow resulting in functional sympathectomy. 15,19,22 –26 While these injury outcomes might serve as discernible explanations, they alone do not provide a unified pathophysiology explaining metabolic impairment accompanying SCI.
Recent investigations examining autonomic dysregulation after SCI 27,28 call into question whether autonomic imbalance, interrupted neurotransmission within the “gut-brain” axis, or neuroendocrine dysregulation after injury should be included as possible factors contributing to post-SCI metabolic disease risk factors.
What is described as the gut-brain axis involves a complexity of gastrointestinal (GI) signals, bidirectional communication between autonomic and neuroendocrine systems and modulatory feedback via higher order neural components, including cognitive and reward mechanisms. 29 Autonomic innervation to the GI tract includes the stomach, small and large intestine, 30 and targets the enteric nervous system (ENS), endocrine, and secretory cells. 30,31 The ENS, comprising distinct ganglionated plexuses, 32 responds to nutrient intake and changes in luminal chemistry and mechanical distortion of the mucosa. 33 –36
Sympathetic reflexive actions involving enteric ganglia and splanchnic afferents, 37,38 also regulate motility, fluid exchange, and gut blood volume 39 in response to nutrient ingestion and absorption. Parasympathetic vagal afferents represent a direct link in gut-brain signaling 40 and relay information on the quality and quantity of ingested nutrients. 41
Importantly, endocrine cell types secrete messenger molecules—GI peptides and hormones—into the GI tract, 33,42 which underlie both short- and long-term nutrient cycling and feeding behavior by transmitting nutrient-related gastric and intestinal signals. 43,44 For example, anorexigenic effects of the GI hormone ghrelin 45,46 and orexigenic effects of the GI hormones cholecystokinin (CCK), 44,47 –49 glucagon-like peptide-1 (GLP1), 50 and peptide tyrosine tyrosine (PYY) 51 are mediated via autonomic circuits52 –54 and direct effects in the central nervous system. 44,48,55,56
These, and other endocrine hormones including glucose-dependent insulinotropic polypeptide (GIP) 57,58 (also GI-released), the incretins insulin and amylin, 59 PP 60,61 (pancreas-released), and leptin 62 (adipocyte-released) illustrate the robust mechanisms that contribute to energy metabolism regulation. Given the substantial importance of an integrated nervous system in nutrient cycling and feeding, it is reasonable to suspect that these functions are interrupted when the central and peripheral nervous systems are dissociated after SCI.
Although extensive research on autonomic dysfunction after SCI has focused on respiratory, 63 cardiac, 64 bowel, 65 and bladder 66 pathology, little is known about functional changes in the integrated signals and systems involved in the GI system as they relate to metabolism and component cardiometabolic disease risk factors.
In this study, we investigate differences in the physiological response to feeding, glucose and insulin challenge after experimental SCI compared with sham-control. We also examine gene expression and physiological changes in GI peptides and hormones and evaluate GI tissue cytoarchitecture. We demonstrate that after SCI, mice exhibit an exaggerated glucose response and insulin resistance, as well as a significantly altered gene expression profile and plasma levels of key GI peptides. In addition, we provide evidence of damaged autonomic innervation to the GI tract.
These novel findings suggest that impairment in enteroendocrine neurobiology and GI damage, in principle, are mechanisms that may contribute to impaired energy metabolism and component risks for cardiometabolic disease.
Methods
Experimental animals and grouping
All animal protocols were approved by the University of Miami Institutional Animal Care and Use Committee and are in accordance with National Research Council guidelines for the care and use of laboratory animals. Animals were group (socially) housed in a temperature- and humidity-controlled rodent vivarium, maintained on a reverse 12-h light/dark cycle, and given food and water ad libitum. No additional environmental enrichment was provided because of its reported effects on the nervous system, including neurogenesis and levels of inflammation, which may affect experimental outcomes. Animals were acclimated for seven days before study experiments, which included being handled daily to normalize human contact and minimize distress.
SCI and sham surgeries
As we described previously, 67 –70 contusion injury was induced with the Infinite Horizon Impactor device adapted to mice. The Infinite Horizon impactor device has been established in producing precise, graded contusion, with reproducible lesion volume and functional outcomes assessed using Basso, Beattie, Bresnahan (BBB) and Basso Mouse Scale (BMS) 71 open-field locomotor rating scales. 72
In brief, adult female C57Bl/6 mice (12-weeks old, ∼20 g; Jackson Laboratories) were anesthetized with an intraperitoneal (ip) injection of ketamine (80 ± 100 mg/kg) and xylazine (10 mg/kg). Complete anesthetization was determined by the lack of a stereotypical retraction of the hindpaw in response to a nociceptive stimulus. Mice then underwent a laminectomy at vertebrae T9, and the exposed spinal cord was injured at a predetermined impact force of 70 kdynes (severe injury). Sham-operated (control) animals underwent all surgical procedures, including laminectomy, but their spinal cords were not injured.
After surgical procedures, animals (both SCI and sham) were housed and treated with subcutaneous lactated Ringer solution to prevent dehydration, buprenorphine (0.1 mg/kg) bid for three days post-surgery and prn thereafter; the prophylactic antibiotic gentamicin was administered daily for seven days to prevent urinary tract infections. Manual bladder expression was performed twice daily, and simultaneously examined for post-stress health status by observation of activity level, respiratory rate, and general physical condition.
Body weight was monitored daily for the first week post-surgery and every other day thereafter. Excessive weight loss (>20%) and decreased grooming behavior were considered as criteria for early exclusion from the study and/or euthanasia. Physical conditions such as moribund state, dehydration, and anorexia were also considered as criteria for early termination.
Euthanasia was performed by carbon dioxide inhalation according to the recommendations for euthanasia detailed in the 2007 Report of the American Veterinary Medical Association's Panel on Euthanasia. Euthanasia was performed in a manner to avoid animal distress. After animals were placed inside the chamber, CO2 flow was gradually introduced and slowly increased until animals were in a deep state of sleep after 1 min, followed by an additional 4 min of increased CO 2 flow. After CO 2 exposure, confirmation of termination was accomplished by cervical dislocation.
Grouping
Sixty-four mice were randomized to independent experimental groups that either underwent contusion injury or sham procedure. A subset of animals (n = 8) from each group was sacrificed at 1-, 2-, 4- or 8-weeks post-surgical procedure. We note that only female mice were used in our study, because female neurogenic bladders after experimental SCI are more safely “expressed” than those of males. 73
Body mass
Body mass discriminated to 0.1 g was measured on a calibrated analytic balance (Data Weighing Systems) at 12 weeks of age (baseline: before survival surgery); 1-, 2-, 4- and 8-weeks post-surgery (before necropsy).
Tissue collection
The small intestines of mice were harvested after euthanasia in accordance with approved euthanasia procedures described above. In brief, the duodenum was dissected according to anatomical features, from the proximal limit— ∼0.5 cm distal to the pylorus—to the distal limit of the ligament of Treitz (∼4 cm in length). The luminal content was thoroughly and rapidly flushed with ice-cold phosphate-buffered saline (PBS), and the tissue was immediately either snap-frozen in liquid nitrogen and stored at -80°C until the time of assay, or post-fixed in 4% paraformaldehyde in PBS, then transferred to 20% sucrose in 0.1 M PBS until sectioned.
Total ribonucleic acid (RNA) isolation and quantitative real-time reverse transcription-polymerase chain reaction (RT-PCR)
Total RNA was isolated from mouse gut (duodenum) using TRIzol Reagent (Invitrogen) according to manufacturer's instructions. 1–10 μg of RNA were reverse transcribed using SuperScript III First Strand Synthesis System for RT-PCR (Invitrogen). Real-time PCR was performed with the Applied Biosystems 7300 Real-time PCR System on samples amplified with Rotor-Gene SYBR Green PCR Kit (Qiagen) and primers for ghrelin, CCK1, GLP1, and PYY (Table 1). Relative expression (as fold change) of target genes was calculated after normalization to beta-actin using the 2-ΔΔCt method.
Gene Primers for Quantitative Reverse Transcription-Polymerase Chain Reaction
Plasma
Mice were euthanized as described above and immediately exsanguinated by cardiac puncture using a heparinized needle. Samples were transferred to an ethylenediaminetetraacetic acid-coated tube and centrifuged (5000
Immunohistochemistry
The mouse gut (duodenum) was post-fixed in 4% paraformaldehyde solution as described above. The distal half (∼2 cm) of the tissue was embedded in O.C.T. Compound (Tissue Tek®) and processed by cryostat sectioning (Leica SM 2000R sliding microtome). Serial cross-sections (50 μm) were stored in free-floating cryostat media (30% ethylene glycol, 30% sucrose, 0.1 M PBS, pH 7.4) at -20°C then rinsed with 0.1 M PBS (pH 7.4). Tissue sections were blocked/permeabilized by treatment with 5% normal goat serum (Vector Laboratories Inc., Burlingame, CA) and 0.4% Triton X-100 (Sigma).
Sections were incubated for 48 h at 4°C with either tyrosine hydroxylase (TH) (1:1000; Abcam ab112) or neurofilament (NeuF) (1:500; Abcam ab8135) primary antibodies. Primary antibody binding was detected with Alexa Fluor secondary antibody conjugates (1:500, Molecular Probes, Eugene, OR). Controls lacking the primary antibody were run in parallel. Sections were counterstained with 4',6-diamino-2-phenylindole (DAPI), and cover-slipped with Vectashield mounting medium (Vector Laboratories Inc.).
Images of duodenum cross-sections were captured at 10X magnification with an Axiovert 200M Inverted Microscope (Zeiss; Göttingen, Germany), using consistent image acquisition settings (intensity, exposure time, numerical aperture). Quantification of staining was determined by mean fluorescence intensity (MFI) analysis of labeled proteins within area region of interest (ROI) using Image J 1.53m software similar to previous reports. 74 –77 Notably, MFI was measured using equivalent selected areas (pixels squared) within an ROI for a given tissue section and subsequently corrected for background fluorescence.
Metabolic testing
Postprandial challenge
After a 6-h fast, 78 mice were given normal chow ad libitum, at which point they began feeding immediately. Mice were allowed to eat for ∼10 min, after which they typically stopped eating, and the food was removed. At ∼30 minutes postprandially, plasma was collected as described above.
ip Glucose tolerance test (ipGTT)
This test was performed after a 6-h fast. Initial blood glucose levels were determined in unanesthetized mice, followed by ip injection of glucose (1.5 g/kg body weight). Blood glucose levels were measured from the tail vein at 15, 30, 60, 90, and 120 min after the glucose injection using an Accu-chek Advantage glucometer (Roche Diagnostics, Indianapolis, IN). The area under the curve during the ipGTT was calculated by the trapezoidal method with baseline correction for each animal to generate the area of the curve (AOC). 79
ip Insulin tolerance test (ipITT)
This test was performed after a 4-h fast. 80 Initial blood glucose levels were determined, followed by ip injection of human insulin (1.0 U/kg; Humulin R; Eli Lilly, Indianapolis, IN). Blood glucose levels were measured from tail vein blood at 15, 30, 60, 90, and 120 min after the insulin injection, and AOC was calculated as described above.
BMS for locomotor analysis
The BMS test of open-field locomotion was performed on experimental mice in an odor-free, non-transparent square arena as described previously. 81 The arena was divided into three zones (wall, inter, and center), and mouse behavior was recorded over a 5-min period using a high resolution video camera. The total number of lines crossed, time spent in each zone, and stereotypical behaviors such as grooming and rearing were analyzed and expressed as the number of events. Mice that did not enter all three zones or cross a minimum of 50 lines during the 5-min trial were excluded from analysis.
Scoring of the locomotor hindlimb performance in the open field with the BMS is a 0–9 rating system based on a modification of the BBB and is specifically designed for the mouse. 71 A team of two blinded investigators evaluated the mice over a 5-min period one day after surgery and weekly after that (data are summarized in Table 2).
Basso Mouse Scale Scores Plus Standard Error of the Mean
SCI, spinal cord injury.
Statistical analysis
Group comparisons
Experimental groups are independent across time. Between group differences were analyzed using an unpaired t test, except for gene (mRNA) expression analyses that were performed using one-way analysis of variance, followed by Tukey post hoc comparison (GraphPad, Prism v9.3.1) and reflect fold change from sham control. Data are expressed as mean ± standard error of the mean. A significance level of p < 0.05 was accepted as different from sham control.
Exclusion criteria
The criteria were post-surgery mortality—primarily caused by the severity of the injury, most notably from cardiorespiratory failure or sepsis because of neurogenic bladder—or morbidity, including abnormal/unexpected weight loss and physical signs of distress, SCI-impactor variance (desired vs. actual), and experimental/procedural error. For each group, n = 4–8 depending on quality of sample analysis and/or survival, where last observation carryforward technique was used. Number of samples (n) are shown in figure legends for all results reported.
We note that our exclusion criteria may introduce attrition bias. Given that this is a pre-clinical study, however, per protocol analysis is particularly useful for interpreting the effects of group differences when taken in an optimal manner—i.e., in conjunction with randomization, ensuring groups being compared have similar characteristics.
Correlation analysis
Correlation analysis was performed to evaluate whether specific outcome measures have significant collinearity, quantified by the Pearson r correlation coefficient (R Studio v1.4.1106). Pairwise correlation coefficients between outcome variables are presented in a correlation matrix, and the value of the correlation range from -1 to +1, where +/-1 describes a perfect positive/negative correlation and 0 describes no correlation.
R corrplot function was used to (i) run hierarchical clustering to identify structure and pattern in the matrix and (ii) graph the correlation matrix (upper triangular). Positive correlations are displayed in blue and negative correlations in red, and color intensity is proportional to the correlation coefficients. The p values of correlations were computed (p < 0.05), and insignificant correlation coefficient values are left blank (statistics are summarized in supporting Fig. 1).

Analysis and comparison of body mass and plasma lipids across time in spinal cord injury (SCI) and sham mice. (
Results
Body mass and fasting glucose
Mean group differences for body mass and fasting plasma glucose are summarized in Table 3. Body mass was measured before surgical procedure to confirm that there were no differences in randomization. Group comparisons between SCI and sham mice were made at acute (1- and 2-week) and chronic (4- and 8-week) time points post-surgery. Acutely post-SCI, there was a significant decrease in body mass at both 1 and 2 weeks when compared with sham. SCI mice recovered body mass at chronic time points, no longer being statistically different than sham at both 4 and 8 weeks (Fig. 1A).
Mean Values of Body Mass and Fasting Glucose Across Time
SCI, spinal cord injury.
Values are mean ± standard error of the mean (SEM).* p < 0.05, ** p < 0.01, *** p < 0.001, **** p < 0.0001.
Fasting plasma glucose was significantly reduced 1-week post-SCI compared with sham. Notably, there was a rise in fasting glucose in the SCI group that was significantly greater than time-matched sham at 2, 4, and 8 weeks (Fig. 1B). These data confirm previously demonstrated 69,70 acute body mass reduction with SCI, which is recovered chronically, and importantly, demonstrate a significant increase in fasting plasma glucose beginning acutely and sustained in chronic SCI.
ip Glucose and insulin tolerance test
The ipGTT and ipITT were performed in experimental groups at 1-, 2-, 4-, and 8-weeks post-surgery. In the ipGTT, plasma glucose increased to a maximum after 15 min of glucose injection in both groups, and this was observed at all time points post-surgery (Fig. 2). At 1-week post-injury, SCI mice exhibited decreased serum glucose levels at all time points measured after ip glucose injection, resulting in a significantly reduced AOC compared with sham (Fig. 2A) and indicative of greater insulin sensitivity in SCI compared with sham.
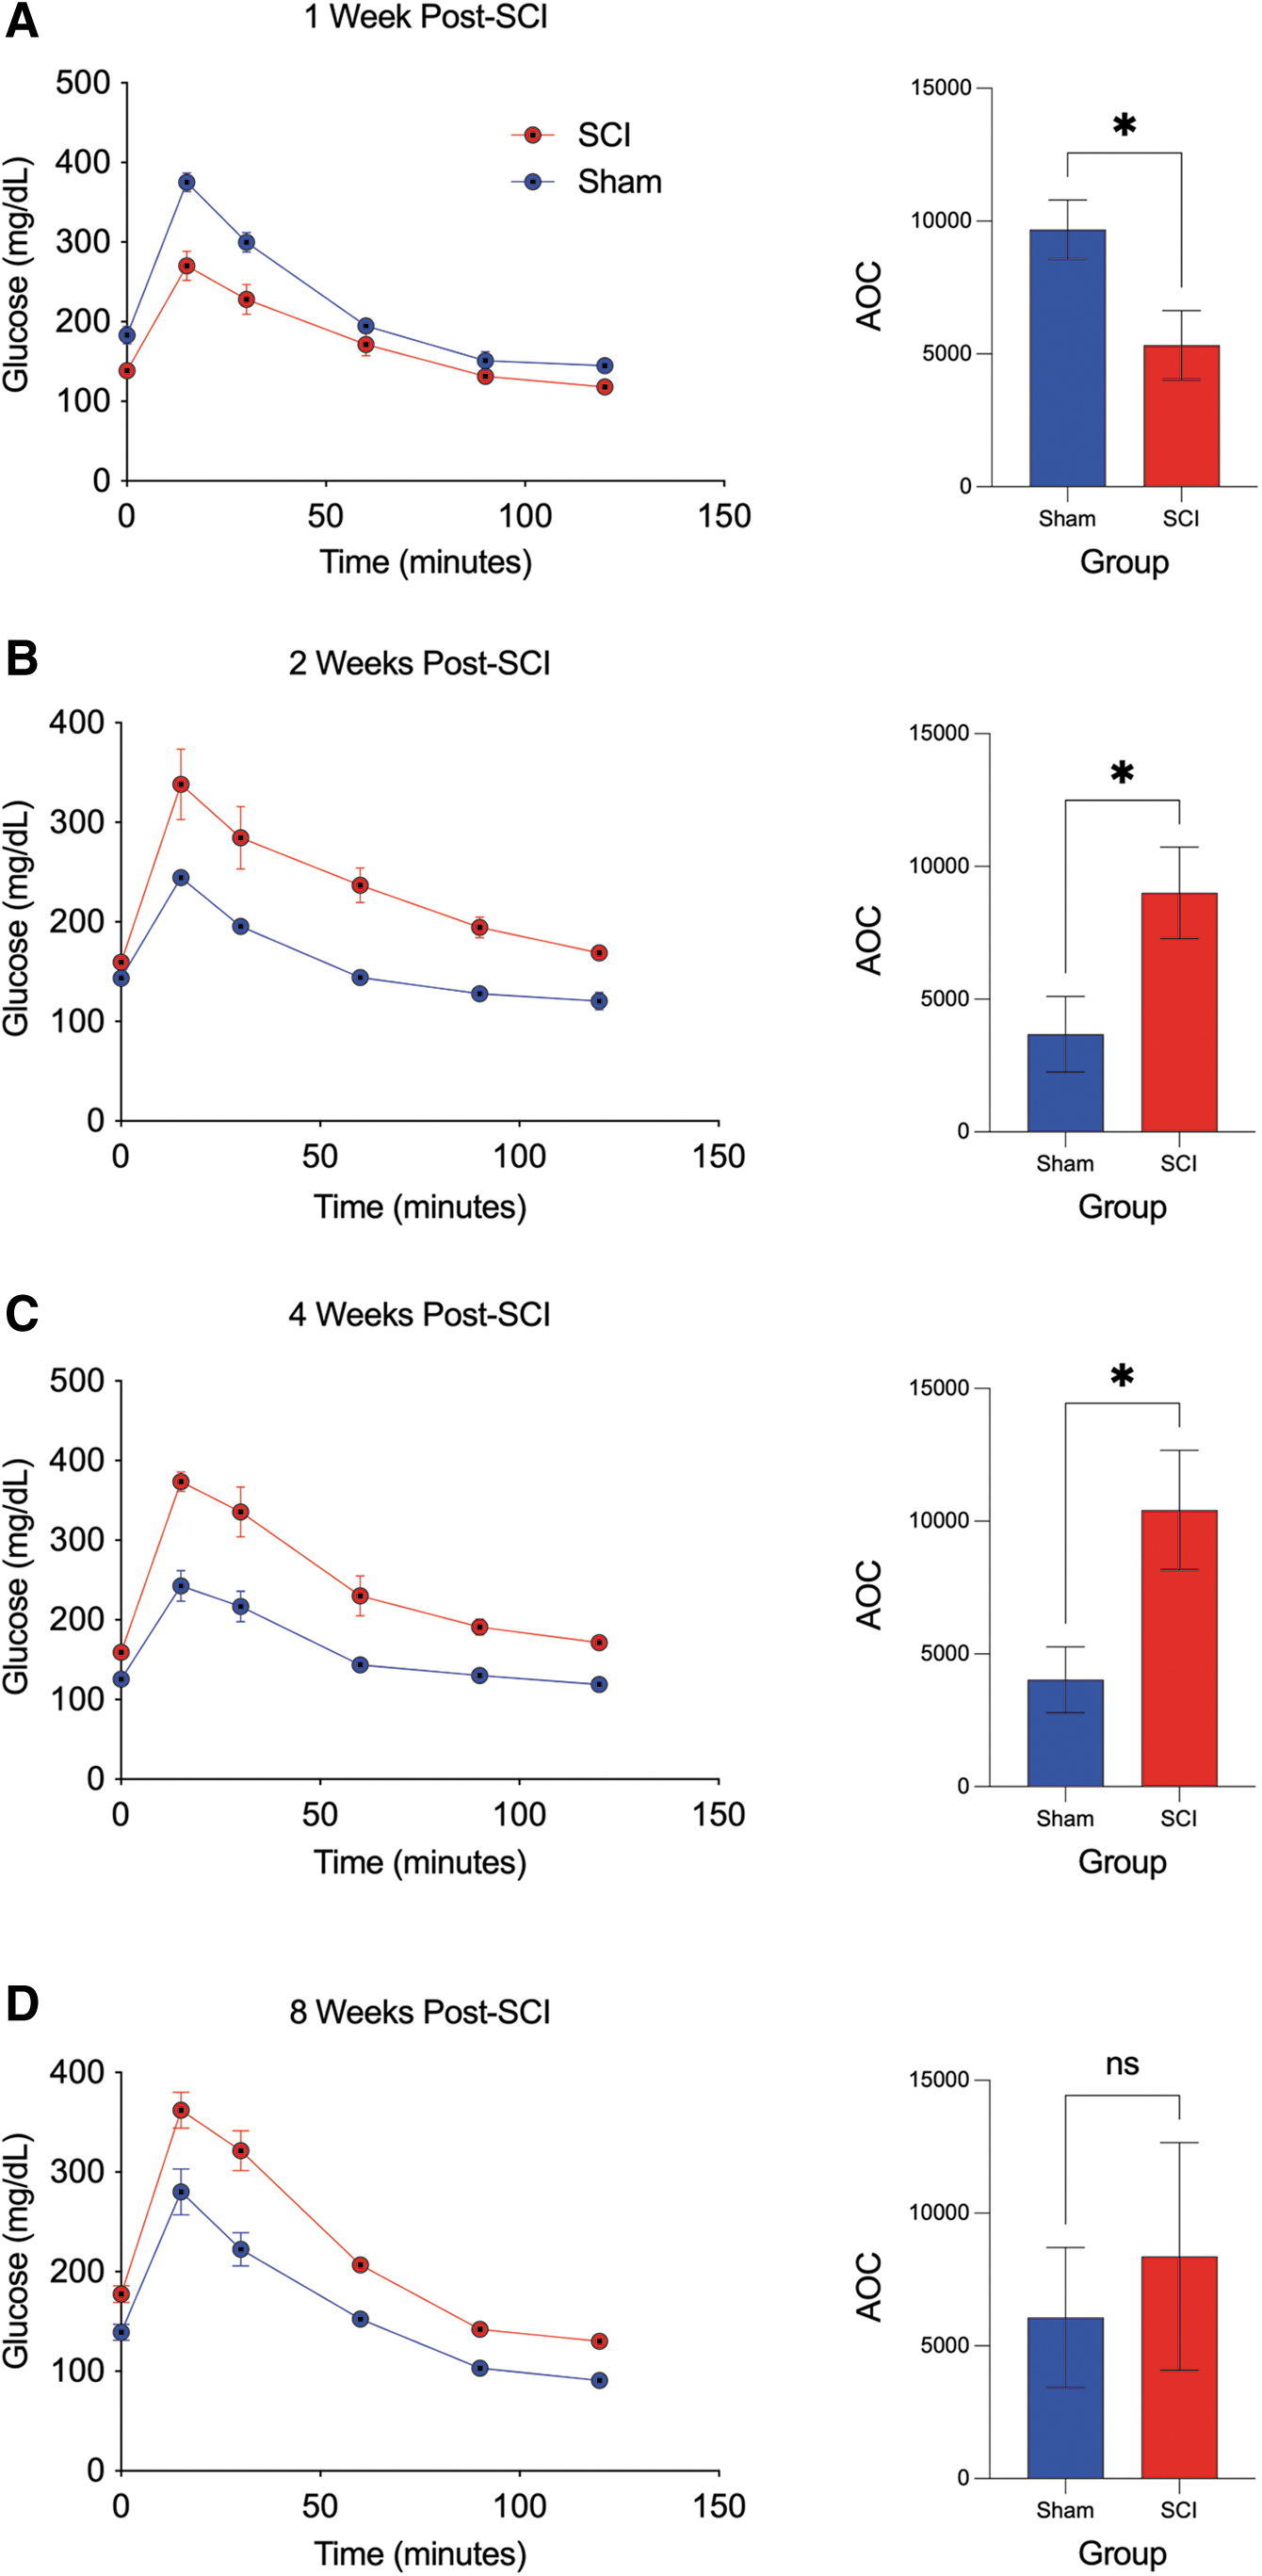
Intraperitoneal glucose tolerance test (ipGTT) and corresponding area of the curve (AOC) across time in spinal cord injury (SCI) and sham mice. (
Notably, at 2-, 4-, and 8-weeks post-injury, SCI mice exhibited insulin resistance compared with SCI evidenced by the increased serum glucose levels at all time points after ip glucose injection, resulting in a significantly greater AOC compared with sham at 2 and 4 weeks, although not significantly different by 8 weeks (Fig, 2B-D).
In the ipITT, a rapid decline in plasma glucose after 15 min of insulin administration was observed in the sham group, and this was observed at all time points post-surgery. The SCI mice, however, exhibited a markedly attenuated plasma glucose response at 15 min after insulin administration, observed at all time points post-SCI (Fig. 3). In addition, SCI mice exhibited increased serum glucose levels at all time points after ip insulin administration, resulting in a significantly greater AOC compared with sham at 2, 4, and 8 weeks (Fig. 3A–D). Taken together, these results indicate characteristic features of glucose intolerance and insulin resistance after SCI.
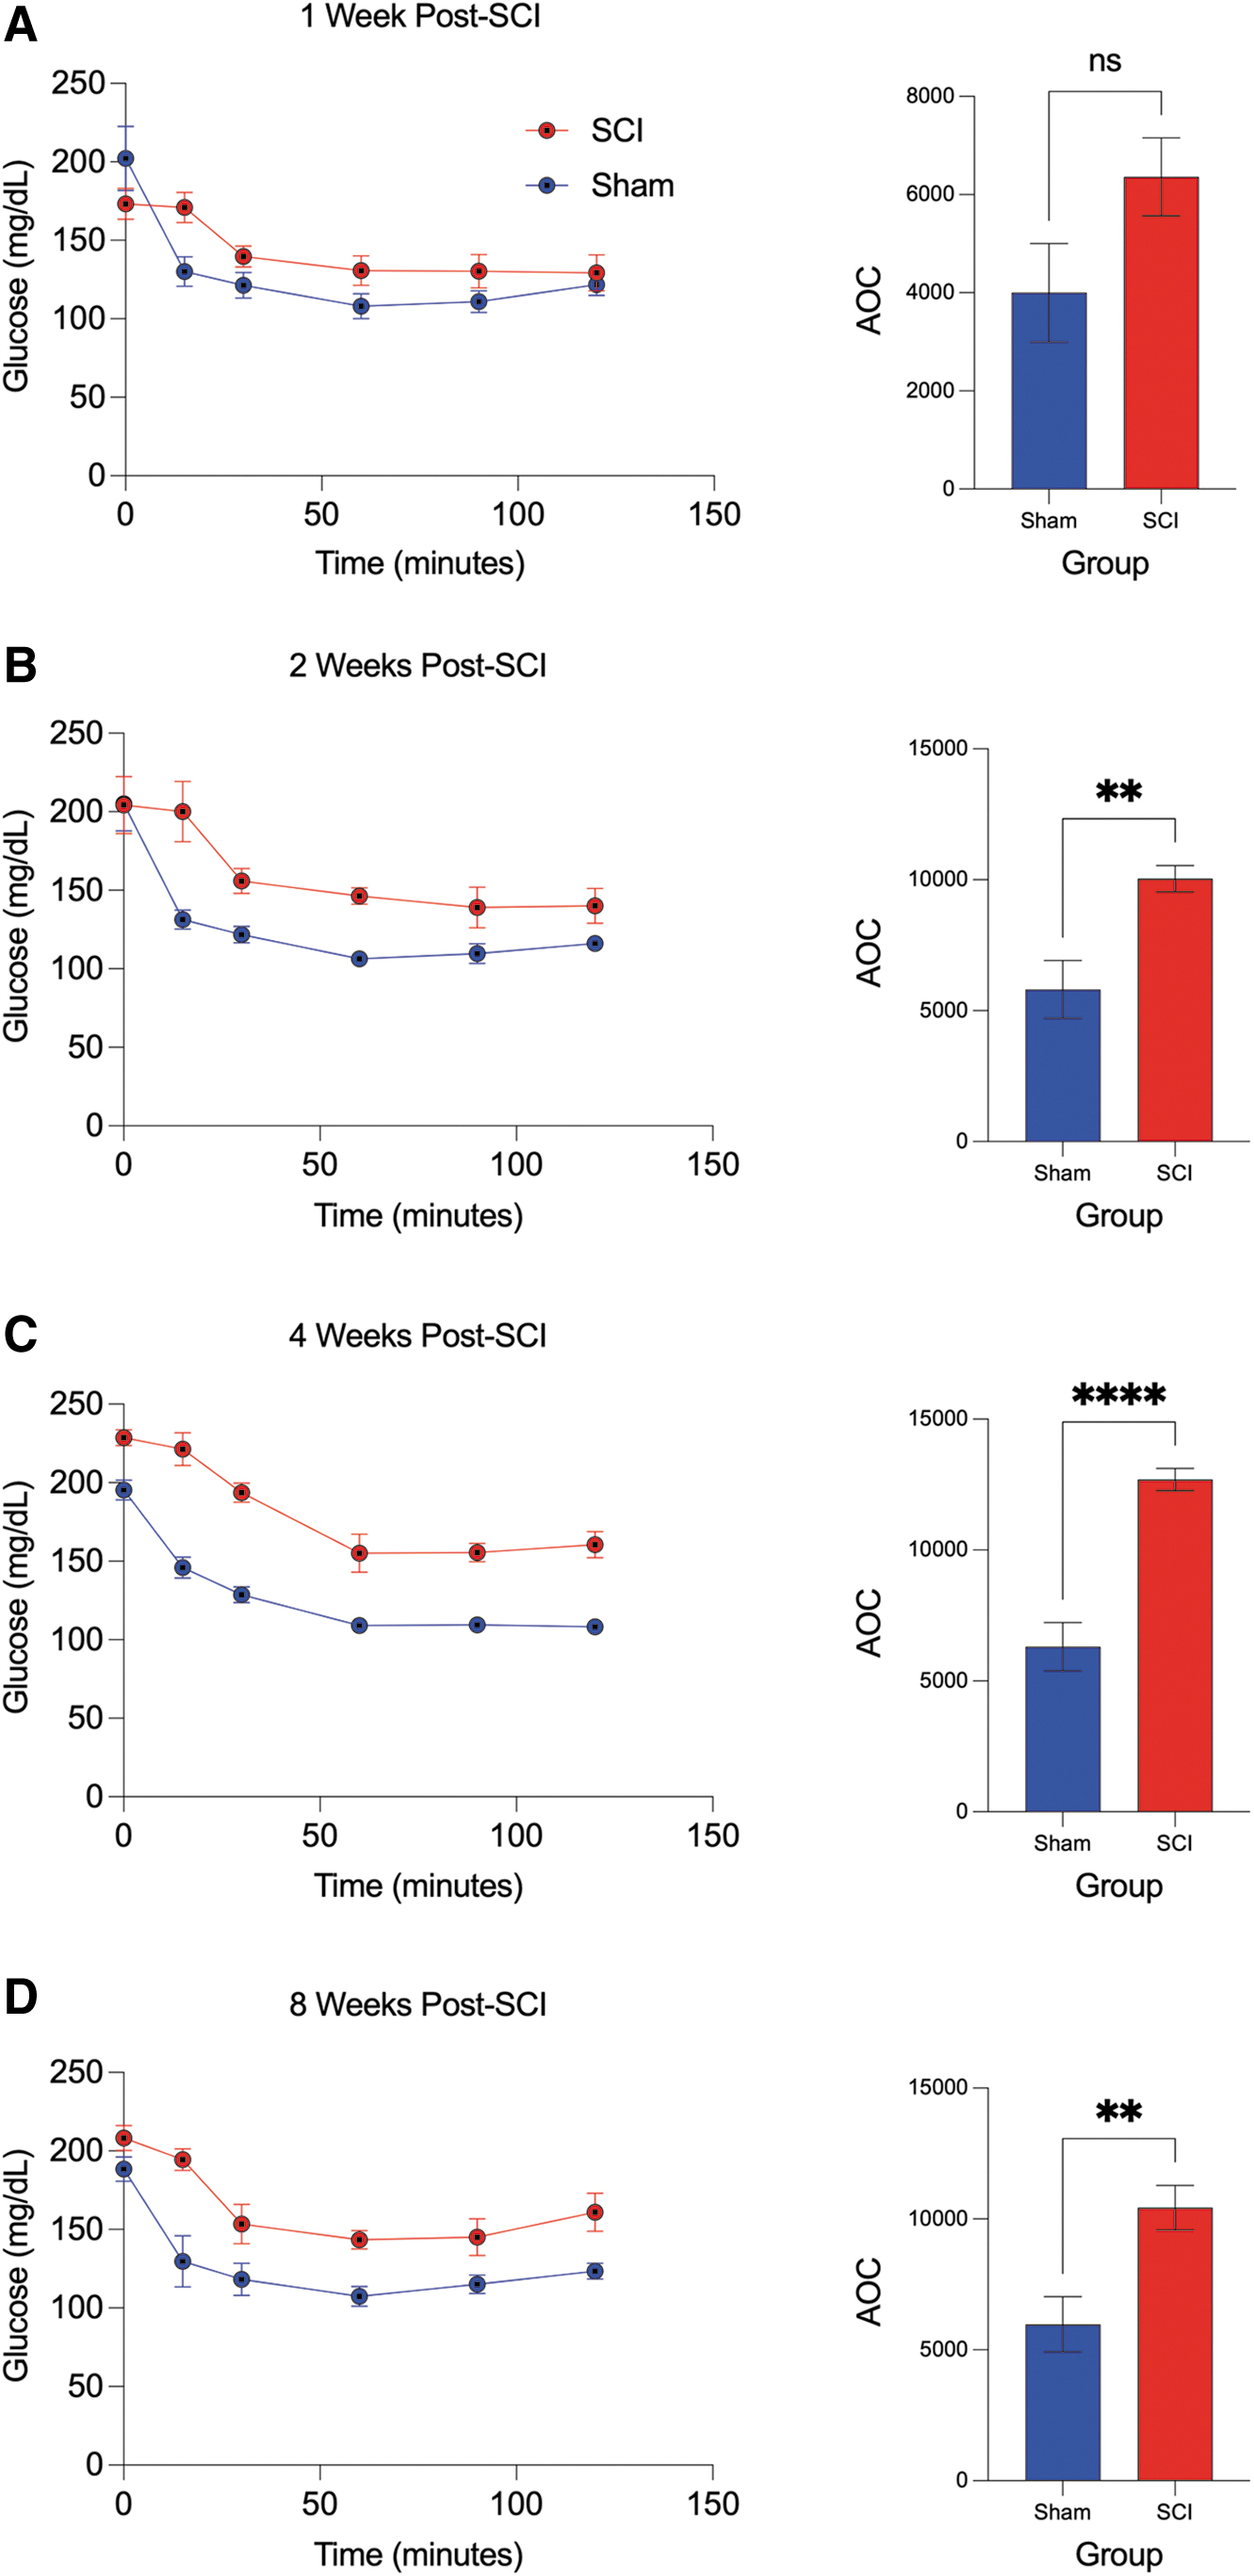
Intraperitoneal insulin tolerance test (ipITT) and corresponding area of the curve (AOC) across time in spinal cord injury (SCI) and sham mice. (
Gut hormone mRNA expression
To investigate long-term gene-expression changes in duodenum extracts from experimental groups, we examined mRNA expression levels of the gut hormones ghrelin, CCK, GLP1, and PYY, at 4- and 8-weeks post-injury (Fig. 4). Using quantitative RT-PCR, significant differences in mRNA expression were observed in all genes examined when comparing SCI with sham. Ghrelin, CCK, and PYY mRNA were all significantly reduced at 4 weeks in SCI mice compared with sham.

Messenger ribonucleic acid (mRNA) analysis of ghrelin, cholecystokinin (CCK), glucagon-like peptide-1 (GLP1), and PYY at chronic time points after spinal cord injury (SCI) and in sham mice. The mRNA expression of ghrelin, CCK, and peptide tyrosine tyrosin (PYY) were significantly reduced at 4 weeks post-SCI but no longer statistically different at 8 weeks post-SCI compared with sham (
The CCK and PYY mRNA remained significantly reduced at 8-weeks post-SCI, although ghrelin mRNA was no longer significant (Fig. 4A,B,D). Conversely, a non-significant increase in GLP1 mRNA expression was observed at 4-weeks post-SCI, which became significantly greater by 8-weeks post-SCI compared with sham (Fig. 4C). These results provide evidence that several key gut hormone genes associated with hunger, satiation, and metabolic regulation are significantly altered in the duodenum after chronic SCI.
Fasted and postprandial plasma levels of gut, pancreas, and adipocyte hormones
Plasma was analyzed under fasted and postprandial conditions as described for experimental groups at 8-weeks post-surgery. Specifically, we examined GI, pancreas, and adipocyte hormones that have an important role in the physiological response to feeding, hunger, and satiety. Importantly, maladaptive regulation of these hormones contributes to cardiometabolic risk factors such as insulin resistance, glucose intolerance, dyslipidemia, and obesity.
Of the 14 plasma gut hormones measured, nine provided consistent results within the detectable ranges across all groups. Group comparisons between SCI and sham mice were made for the following analytes: ghrelin (active) , CCK, GLP1 (active) , PYY (total) , GIP (total) , insulin, amylin (active) , PP, and leptin (Fig. 5). In the fasted state, significant group differences at 8 weeks were observed for all analytes except PP. Notably, in SCI mice, plasma levels of ghrelin were significantly reduced (Fig. 5A), whereas CCK, GLP1, PYY, GIP, insulin, amylin, and leptin levels were all significantly increased (Fig. 5B-F,H,I) when compared with sham.
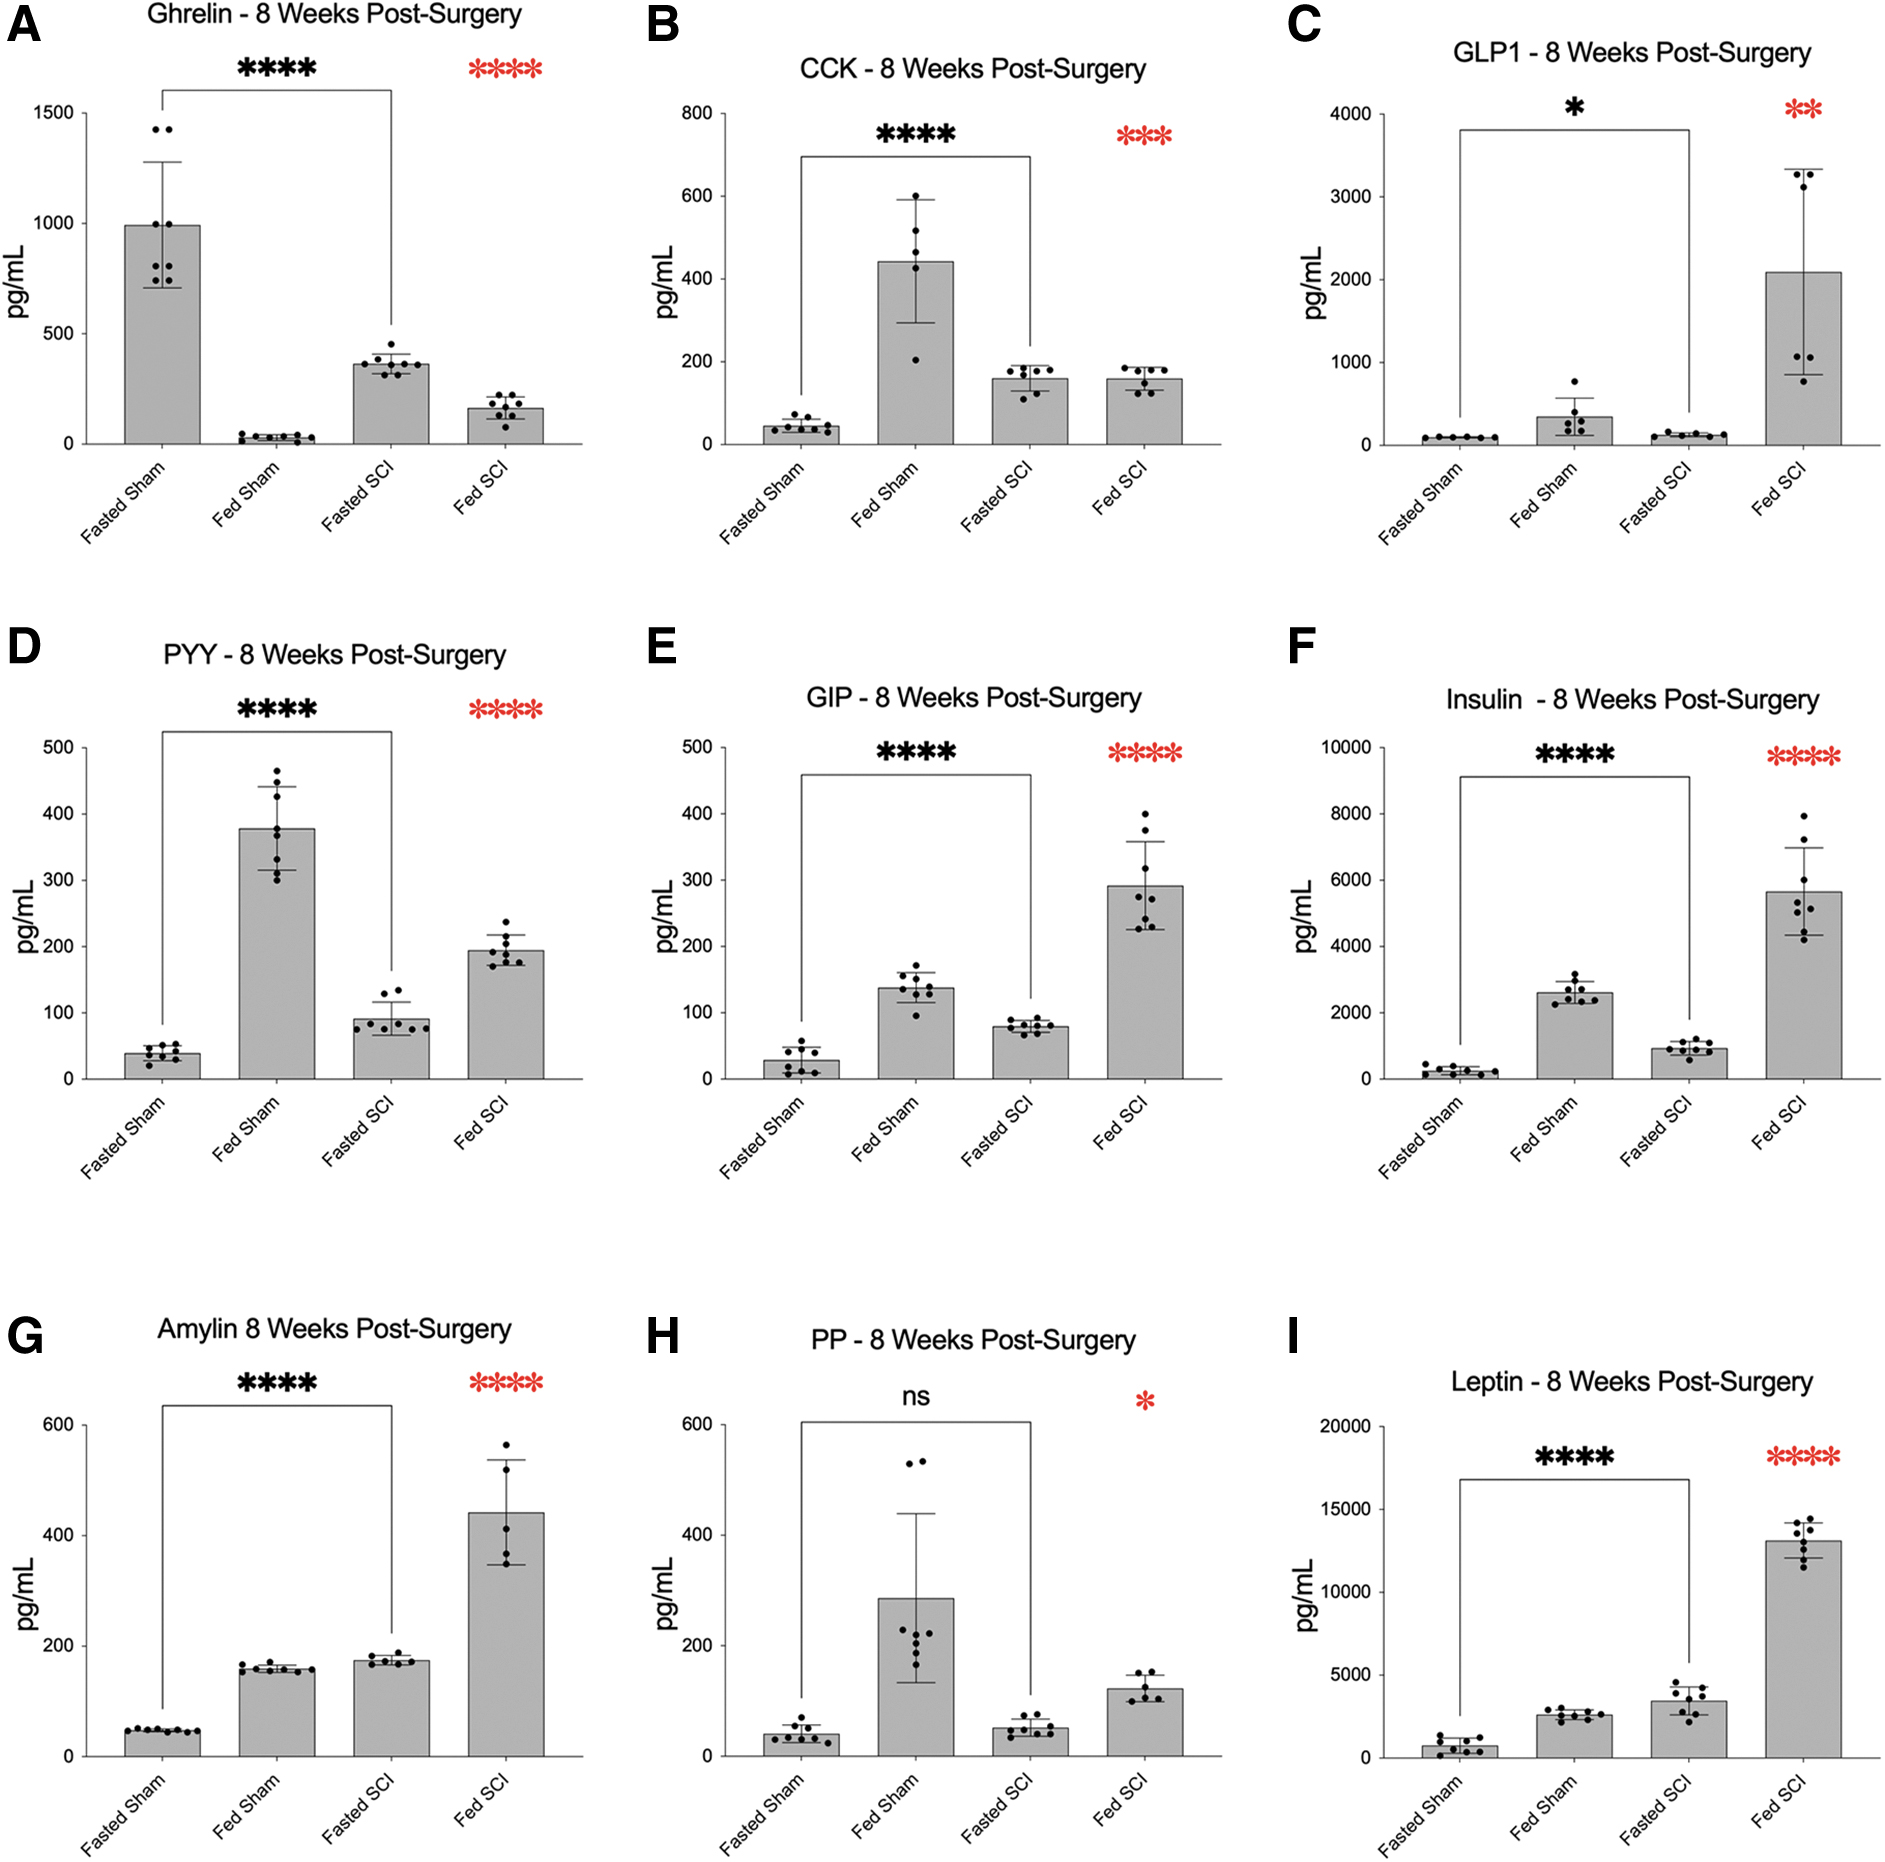
Analysis and comparison of plasma gut hormone levels in fasted and fed states at 8 weeks after SCI and in sham mice. Fasted plasma levels of ghrelin were significantly reduced (
After postprandial challenge, significant group differences at 8 weeks were observed for all analytes examined. In SCI mice, plasma levels of ghrelin, GLP1, GIP, insulin, amylin, and leptin were significantly increased (Fig. 5A,C–F,I), whereas CCK, PYY, and PP (Fig. 5B,G,H) were significantly decreased when compared with sham. These data provide evidence for a strong injury effect on several important gut hormones, alterations that may disrupt physiological responses to feeding and contribute to aberrant energy homeostasis and metabolism.
Duodenal immunohistochemistry and cytoarchitecture
The GI tract is innervated, in part, by prevertebral ganglia that supply an extensive network of noradrenergic fibers to the smooth muscle wall, enteric ganglia, and arteries, 31 all of which may be compromised after SCI. TH—the rate-limiting enzyme in the biosynthesis of noradrenaline—and NeuF—a major cytoskeletal element in neurons found in enteric ganglia—were used to selectively visualize innervation of the duodenum at 8-weeks post-surgery.
Here we illustrate widespread distribution and expression of positively immunostained DAPI (blue, nuclear counterstain), TH (green), and NeuF (red) in sham mice (Fig. 6A–C). The overlay and higher magnification images (Fig. 6D, I) show marked areas of colocalization of these neuronal markers (arrows, inset) and overall, demonstrate intact GI cytoarchitecture (Fig. 6A–D). After SCI DAPI, TH and NeuF immunoreactivity was markedly reduced (Fig. 6E–G), and extensive GI damage is evident (Fig. 6E–H, J) compared with sham. Semi-quantitative analysis of immunoreactivity by MFI (Fig. 6K) indicate a significant reduction in DAPI, TH, and NeuF immunostaining after SCI compared with sham, indicating neuronal damage and loss in the duodenum after injury.

Immunofluorescent images of tyrosine hydroxylase (TH) and neurofilament (NeuF) in the duodenum at 8 weeks after spinal cord injury (SCI) and in sham mice. Mouse duodenum cross sections (50 μm) were immunostained with TH (green), NeuF (red), as neuronal markers, and counterstained using 4',6-diamino-2-phenylindole (DAPI) (blue). Mean fluorescence intensity of immunoreactivity is significantly reduced in SCI for DAPI (
Discussion
This study demonstrates that SCI results in chronic insulin resistance demonstrated by the elevation of fasting plasma glucose levels, an exaggerated glucose response to both glucose and insulin challenge, and increased fasting and postprandial insulin levels. We also show SCI-induced alteration in several gut hormone genes, their plasma levels, and physiological response to prandial challenge. Further, we identify significant cell loss and gross tissue damage in the duodenum of the gut after SCI and concomitant decreases in the expression of key neuronal markers. These findings provide evidence for impaired metabolism and cardiometabolic disease risk factors and suggest duodenal dysregulation via SCI-induced interruption of autonomic neurotransmission.
It is evident that SCI contributes to the development of cardiometabolic risk factors and disease pathology. The long-term effects of SCI are linked to obesity, insulin resistance, and glucose intolerance, although human trials demonstrating these outcomes may be complicated by factors such as familial risks, pre-morbid health, socioeconomic status, and lifestyle (i.e., diet and exercise). We note that many cardiometabolic risk factors reflect observations reported in men 82 because they represent the majority of cases of SCI. 83
Although our study included exclusively female mice, the disparities in prevalence rates between male and female reflect differences in behavior, activity, and lifestyle factors 84 that do not necessarily reflect biological differences in sex. Our model circumvents such confounds that often elude experimental control. Moreover, there has been a gradual increase in the population of women with SCI 85 and an accompanying “call to action” to improve knowledge gaps to facilitate research and interpretations of findings. 82 Notwithstanding, we acknowledge that future studies should include sex-specific comparison.
In the current study, body mass at 1- and 2-weeks post-SCI is 20.4% and 11.9% less, respectively, and recovers by 4 and 8 weeks to the extent that any differences between groups is no longer discernable. Although seemingly contradictory to the chronic weight gain observed in humans with SCI, the rapid loss of body mass reflects acute-phase level-of-injury dependent hypokinesis (loss of muscle-mass 86 –94 and bone 95 –101 ), which we have shown in our model. 69,70,102 Further, compared with able-bodied controls, individuals with SCI exhibit infiltration of intramuscular fat, 94,103 –105 reported along with reduced overall lean mass. 102
These pathological features are evidence of an overall shift to an obesogenic body habitus, which may be a better indicator of cardiometabolic risk than mass standalone. We also demonstrate that fasting plasma glucose after SCI is 11%, 26.9%, and 23.15% greater at 2, 4, and 8 weeks, respectively. It is likely that sublesional muscle atrophy and impaired muscle oxidative phenotype promote increased circulating plasma glucose, which we show here (Fig. 1B) and indicate higher risk for type II diabetes. 106,107
Although fasting glucose at 1-week post-SCI was significantly less than time matched control, this likely reflects the substantial loss of total body mass acutely. We also note that fasting glucose in the sham “1-week cohort” appears uncommonly high, both in our experience and in the literature. 79 As such, it could be inferred that fasting glucose in sham at 2 and 4 weeks is reduced; however, the “independent group” study design limits repeated measures analysis and inference.
As an additional point, we cannot rule out that an acute stress-response—or stress hyperglycemia 108 —to sham-operation may account for the elevated fasting glucose in sham at 1-week post-SCI. Although we have shown that sham and naïve mice have no significant differences in certain biological outcomes in chronic SCI, 68 we have not directly examined stress and glucose between these conditions at a time point as early as 1-week post-SCI. Nevertheless, the chronic effects of SCI demonstrate impaired fasting glucose, which promotes cardiometabolic risk and reflects what is observed in chronic SCI in the human condition.
Our current understanding suggests that fasting glucose alone may fail to provide a diagnosis in a large proportion of people with diabetes, to the extent that GTT is recommended by the World Health Organization 109 to identify people with impaired glucose tolerance. The time course of absolute plasma glucose concentration after administration of glucose is well characterized as the “tolerance curve” and frequently used clinically and experimentally as an index of efficiency of the mechanisms regulating the concentration of glucose in the blood. 78,110 Our data demonstrate that glucose AOC after ipGTT is significantly greater after SCI as early as 2-weeks post-SCI, which persists through 8 weeks compared with sham. These results are consistent with an exaggerated postprandial glycemia observed in humans with chronic SCI. 111,112
An exaggerated glucose AOC is used widely to diagnose impaired glucose tolerance, which our results demonstrate both acutely and chronically post-SCI. Notably, although glucose AOC is no longer statistically greater by 8-weeks post-SCI, this may represent an adaptation to locomotor recovery with respect to the injury model and strain, which peaks (∼2-weeks post-SCI) and plateaus thereafter at ∼4-weeks post-SCI. 71
Similarly, the ITT is a standard test of insulin resistance, which determines whole body sensitivity of insulin receptors by measuring glucose level changes before and after insulin administration. We demonstrate a significantly greater AOC after ipITT following SCI, compared with time matched sham, beginning at 2 weeks post-SCI and remaining chronically at 4 and 8 weeks. Importantly, in all SCI groups, we observe a delayed glucose response at 15 min after insulin injection, indicating a thwarted ability to lower glucose levels compared with sham. Spinal cord injury has been reported as an independent risk factor for type II diabetes, 113,114 and these results support previous studies implying a role for insulin resistance in the development of extant disease. 115 –117
Although we have discussed several valid explanations for maladaptive metabolism associated with SCI, these findings taken together likely do not provide a complete pathophysiological model. Metabolic regulation requires expansive biological process, including GI signal integration, involving intrinsic (enteric) and extrinsic (sympathetic/parasympathetic) components. Importantly, enteric reflexes, reflexes involving sympathetic ganglia, and reflexes that directly pass from the gut through the CNS provide physiological feedback to hunger, satiation, and nutrient intake, contributing to regulation of energy balance and metabolism. 32
In fact, the GI tract is regarded as the largest endocrine organ of the body, expressing greater than 30 gut hormone genes and 100 bioactive peptides involved in the initiation and maintenance of food intake as well as termination of meals. 61,118 Notably, acylated ghrelin—originating primarily from the stomach and duodenum 119 —is the only known orexigenic gut hormone, stimulating appetite 45,46 via endocrine mechanisms that act on hypothalamic and brainstem centers. 44,48
Conversely, intestinal CCK suppresses food intake in response to luminal lipid and protein, 44,47 –49 and the incretin hormone GLP1 exerts sustained satiation 48,49,120,121 in response to glucose, 50 both of which exert their effects on hypothalamic and brainstem regions. 48,49,56,120,121 Satiety effects of PYY via vagal afferents are also thought to involve hypothalamic neural pathways, highlighting these hunger and satiation peptides in the central (CNS) integration and regulation of feeding behavior.
Currently, there is a paucity of literature regarding GI neuraxis dysfunction in SCI, especially relating to metabolic dysfunction. To our knowledge, our data show for the first time that chronic SCI induces a significant reduction in ghrelin, CCK, and PYY gene expression at 4-weeks post-SCI, and although no longer statistically significant after 8 weeks, each is still observably reduced compared with sham. Conversely, we show GLP1 gene expression is observably greater after 4 weeks, and this trend is significantly greater at 8-weeks post-SCI compared with sham. These data indicate that key gut hormone genes associated with feeding responses and behaviors are significantly dysregulated after SCI.
Germane to genetic dysregulation is the physiological response of gut hormone analytes to nutrient intake. Ghrelin, which drives the sensation of hunger, has peak plasma levels when fasted 122 and is rapidly reduced to nadir levels by ∼30 min postprandially. 123 Conversely, CCK, GLP1, and PYY are all released to drive satiety, with peak levels observed at ∼30 123 –125 (CCK and GLP1) and ∼60123 (PYY) min postprandially.
The incretin hormone GIP augments nutrient-induced insulin secretion, contributing equally to the effect as GLP1. 57,58 Insulin and amylin are postprandially cosecreted from pancreatic β-cells in a 20:1 ratio, 59,126,127 where insulin plays a major role in carbohydrate, fat, and protein metabolism and amylin functions as a synergistic partner in glucose regulation.
In addition, long-term anorexigenic effects have been demonstrated by the hormones PP 60,61 and leptin 62 arising from pancreatic islet and adipocytes, respectively, both acting via hypothalamic and brainstem regions. 61,62 Circulating PP concentrations rise after a meal in proportion to caloric load, 60,61 and leptin response is significantly correlated with insulin response. 128 Here, we show significant group differences between SCI and sham for each of these serum analytes in both the fasted and fed state, except PP, which was not significantly different between groups in the fasted state.
Importantly, several of these changes are consistent with observations reported previously in cardiometabolic disorders. For example, differences in the fasted to feeding response show that ghrelin levels were lower in SCI in the fasted state and less effectively supressed after feeding. Our results indicating significantly lower fasted plasma ghrelin have been reported in obese individuals and are significantly related to insulin resistance. 129 Moreover, we show that postprandial reduction of circulating ghrelin levels is thwarted in SCI compared with sham, also previously demonstrated in response to nutrient intake in humans with obesity. 130
The PYY and CCK remained markedly lower in SCI postprandially compared with sham, and similarly reduced meal effects are reported in obesity. 131 –135 We also demonstrated an increased fasted and postprandial leptin and postprandial GIP secretion with SCI. Elevated circulating leptin is a hallmark biomarker of obesity 135 and some studies suggest GIP hypersecretion in people with obesity. 136,137
Importantly, insulin and amylin are both significantly increased in fasted and fed states with SCI. Chronically elevated insulin levels (both fasting and postprandially) are indicative of insulin resistance as shown in the ipGTT and ipITT results. Hyperinsulinemia is understood to participate in the metabolic dysregulation observed in obesity and type II diabetes, 138 –140 and amylin is shown to be elevated in obesity, believed to lead to the down-regulation of amylin receptors and lessen the impact of postprandial amylin secretion on satiety and gastric emptying.136.141
Notably, we also show increased circulating fasting and postprandial GLP1 with SCI compared with sham, although these results are inconsistent with respect to previous literature examining cardiometabolic risk. A recent report suggests that fasting plasma GLP1 is increased proportionally with the number of associated metabolic risk factors 142 ; however, a separate report indicates that individuals with obesity have attenuated nutrient-stimulated GLP-1 circulating levels compared with normal weight individuals. 131 Nonetheless, these data demonstrate that SCI induces wide-ranging dysregulation of GI hormone secretion affecting homeostatic levels and physiological response to prandial challenge, with many changes supporting previous literature related to cardiometabolic risks.
The impact of SCI on the GI system results in a number of complications, the most frequently reported being motility issues and bowel management 143 –145 with a recent review providing a broader discussion of GI symptoms. 146 More recently, gut dysbiosis has become an increasingly studied component of SCI-mediated GI pathophysiology. The gut microbiota are significantly altered after SCI 147,148 and have been shown to worsen neurological damage, directly impacting locomotor function. 149
Interestingly, changes in the gut microbiota have also been linked to obesity and metabolic dysfunction, 150,151 and several reports show that after SCI, dysbiosis of the gut microbiota is associated with serum lipid profiles 152 and several pro-inflammatory cytokines in intestinal tissue, 153 both of which are hallmark features of metabolic diseases. Most notably, none of these reports establishes a causal relationship that would suggest gut dysbiosis is a contributing component to GI dysfunction and feasibly metabolic outcomes.
Although sympathetic components of the autonomic nervous system are directly damaged with SCI—likely disrupting GI structures and the homeostatic regulation of GI peptides—there has been little to no examination of the integrated function of the GI system in energy balance and metabolic regulation. Our results indicate substantial damage to the duodenum, including gross tissue disorganization and neuronal degeneration as illustrated in Figure 6, where loss of nuclear, TH, and NeuF staining is apparent.
While we acknowledge that there are limits and some subjectivity in what could be described as semi-quantitative immunofluorescence analysis, our methods are nevertheless consistent with several other reports using MFI analysis 74 –77 ; we believe the analyses are informative and supportive of our expected outcomes, particularly considering our controlled experimental design. Importantly, these observations provide the groundwork for more directed studies, which should include comprehensive quantitation and morphological analyses. Altogether, these data suggest that loss of cellularity and autonomic innervation to the GI tract may instigate the vast dysregulation of GI hormones, physiological response of the GI system, and contribute to cardiometabolic risks that we observe.
The current work builds on recent evidence examining autonomic dysregulation after SCI 27,28 and calls into question whether autonomic imbalance, interrupted neurotransmission within the GI system, and/or neuroendocrine dysregulation after injury are among contributing causes of cardiometabolic disease risks. Given our framework for understanding SCI pathophysiology, it is reasonable to speculate that disrupted innervation of GI (duodenal) tissue may contribute to the genetic, physiological, and metabolic outcomes shown.
In the scope of this study, we do not examine biological cause-effect mechanisms; however, preliminary correlation analysis was performed to identify statistical relationships between outcomes measured (Supplementary Fig. S1). Hierarchical clustering analysis indicates patterns of high and low correlation, with several notable observations. For example, BMS has a significant inverse relationship with fasting glucose (r = -0.76) and insulin (r = -0.99), respectively, which is understandable given reduced BMS is associated with injury, and we observe chronic increases in glucose and insulin after SCI.
The BMS also has a significant positive relationship with DAPI (r = 0.77) and NeuF (r = 0.92), respectively, and positive but insignificant relationship with TH (r = 0.22), suggesting that tissue damage from injury—i.e., reduced staining—is associated with concomitantly reduced BMS score. Similarly, mass has a significant positive relationship with DAPI (r = 0.76) and NeuF (r = 0.83), and positive but insignificant relationship with TH (r = 0.4), supporting loss of GI tissue and overall mass with injury.
In addition, tissue damage—as assessed by our immunostaining and illustrated in the correlogram matrix—has several significant correlations with changes we see in both GI genes and GI plasma hormones, demonstrating an association with these outcomes.
While we acknowledge that it is presumptive to overstate or draw conclusions from this preliminary analysis, these correlations may direct our future studies examining biological causality.
Conclusion and Future Directions
To our knowledge, ours is the first study to report on the consequences of SCI with respect to dissociation of autonomic neurotransmission, neuroendocrine dysfunction of hormones of the GI system, and their relationship, in part, to cardiometabolic disease risk factors. Importantly, the authors acknowledge that future experiments should evaluate severity and level of injury and provide a comprehensive stereological analysis across anatomical regions of the GI system, to better determine the relationship between SCI, GI dysfunction, and metabolic outcomes.
These data will help elucidate underlying mechanisms contributing to maladaptive nutrient-cycling and related metabolic dysfunction in SCI. Given the impact of cardiometabolic risks and extant disease on health and function in human SCI, studies of this kind may help identify therapeutic targets for intervention and rehabilitation and/or shape nutritional guidelines.
Footnotes
Authors' Contributions
All authors listed meet the criteria for authorship as defined by the International Committee of Medical Journal Editors.
Funding Information
This work was funded by The Miami Project to Cure Paralysis.
Author Disclosure Statement
No competing financial interests exist.
Supplementary Material
Supplementary Figure S1
References
Supplementary Material
Please find the following supplemental material available below.
For Open Access articles published under a Creative Commons License, all supplemental material carries the same license as the article it is associated with.
For non-Open Access articles published, all supplemental material carries a non-exclusive license, and permission requests for re-use of supplemental material or any part of supplemental material shall be sent directly to the copyright owner as specified in the copyright notice associated with the article.
