




Abstract
Exposure to repetitive head impacts (RHI) has been associated with long-term disturbances in cognition, mood, and neurobehavioral dysregulation, and reflected in neuroimaging. Distinct patterns of changes in quantitative features of the brain electrical activity (quantitative electroencephalogram [qEEG]) have been demonstrated to be sensitive to brain changes seen in neurodegenerative disorders and in traumatic brain injuries (TBI). While these qEEG biomarkers are highly sensitive at time of injury, the long-term effects of exposure to RHI on brain electrical activity are relatively unexplored. Ten minutes of eyes closed resting EEG data were collected from a frontal and frontotemporal electrode montage (BrainScope Food and Drug Administration–cleared EEG acquisition device), as well as assessments of neuropsychiatric function and age of first exposure (AFE) to American football. A machine learning methodology was used to derive a qEEG-based algorithm to discriminate former National Football League (NFL) players (n = 87, 55.40 ± 7.98 years old) from same-age men without history of RHI (n = 68, 54.94 ± 7.63 years old), and a second algorithm to discriminate former players with AFE <12 years (n = 33) from AFE ≥12 years (n = 54). The algorithm separating NFL retirees from controls had a specificity = 80%, a sensitivity = 60%, and an area under curve (AUC) = 0.75. Within the NFL population, the algorithm separating AFE <12 from AFE ≥12 resulted in a sensitivity = 76%, a specificity = 52%, and an AUC = 0.72. The presence of a profile of EEG abnormalities in the NFL retirees and in those with younger AFE includes features associated with neurodegeneration and the disruption of neuronal transmission between regions. These results support the long-term consequences of RHI and the potential of EEG as a biomarker of persistent changes in brain function.
Introduction
Exposure to repetitive head impacts (RHI) from contact and collision sports has been associated with long-term cognitive and neuropsychiatric disturbances. 1 –5 Former elite American football players frequently exhibit memory, executive, and other cognitive function difficulties, along with symptoms of depression and neurobehavioral dysregulation. 6 –11 Structural, functional, and molecular neuroimaging studies suggest that these symptoms may be related to the late effects of RHI on the brain, including the development of the neurodegenerative tauopathy chronic traumatic encephalopathy (CTE). 2,8,9,11 –25 Duration of exposure to RHI has been identified as an important risk factor for neurological disorders, 2,3 with age of first exposure (AFE) to American football being key. Findings show that younger AFE is associated with greater microstructural alterations, volume decrease in the hippocampus and corpus callosum, and greater functional/behavioral consequences, 26 –31 although inconsistencies have been reported. 32 -34 Further imaging-based research is needed to better understand the late effects of exposure to RHI, including AFE, on the brain.
Changes in quantitative brain electrical activity (quantitative electroencephalogram [qEEG]) features have been demonstrated to be sensitive to brain alterations seen in neurodegenerative disorders. Use of qEEG in early identification of dementias, evaluation of severity, and prediction of cognitive decline suggest an important role for brain electrical activity (EEG) in the evaluation of neurodegenerative disorders. 35 -37 Further, significant correlations have been found between abnormal qEEG features and abnormalities in cerebral blood flow, hippocampal atrophy, changes in glucose metabolism and other advanced neuroimaging, 38 -40 with cerebrospinal fluid biomarkers of Alzheimer's disease 41 and with evidence of cortical thinning. 42 Alterations in brain electrical activity following traumatic brain injury (TBI) result in profiles with identifiable, distinctive patterns in time and frequency within and between brain regions that have been demonstrated to be highly sensitive to TBI. 43 –46 EEG changes in concussion include shifts in the frequency spectra and disruption in connectivity (e.g., coherence, phase, power relationships) between regions and between neural networks, 46 –49 and measures of entropy and “complexity” reflecting disorganization of neural networks. 50 A significant correlation was reported between changes in diffusion tensor imaging (DTI), mean fractional anisotropy (FA), and changes in frontal EEG phase synchrony, demonstrating that EEG changes reflected disruption in neural transmission between brain regions in blast-concussed soldiers. 51 The importance of sensitivity to such abnormalities is emphasized by magnetic resonance imaging (MRI) evidence of white matter injury in both sub-concussive and concussive injuries in collegiate football athletes. 52
This study combined the power of qEEG with a machine learning (ML) methodology, a dual approach that demonstrated high classification accuracy in independent validation studies, identifying patients with both structural (intracranial bleeds) and functional (concussion) traumatic brain injuries. 43,46,53 Despite findings in the setting of acute TBI and short-term follow-up, the long-term effects of exposure to RHI from contact sports on brain electrical activity are relatively unknown. qEEG could provide key insights into the long-term pathophysiological changes associated with RHI, as well as serve as a potential nonspecific, supportive biomarker of long-term neurological disorders associated with RHI. The present study investigates qEEG differences between former National Football Leagues (NFL) players and same-age men without a history of RHI and explores differences within the population of former NFL players related to AFE.
Methods
Study design
The study included a cohort of 90 former NFL players from the National Institutes of Health (NIH)-funded Diagnosing and Evaluating Traumatic Encephalopathy using Clinical Tests (DETECT) study. Eligibility criteria were male, ages 40-69, a minimum of two NFL seasons and 12 years of organized tackle football, and self-reported cognitive, behavioral, and/or mood symptoms. Also recruited was a same-age unexposed group of men (n = 25) who had no history of contact sport participation, service in the military, or self-reported TBI, and denied symptoms (at telephone screen). Exclusion criteria for the DETECT study included MRI or lumbar puncture contraindications, presence of another central nervous system disease, and/or non-English speaking. Participants completed a 2- to 3-day visit involving multiple assessments, including EEG.
Data from an additional 44 healthy volunteers, matched for age and gender to the former NFL players in this study, were obtained from a concussion assessment study (under a contract to BrainScope from the Department of Defense; #W81XWH-14-C-1405). All participants had a Glasgow Coma Scale score of 15 and were not under duress. Exclusion criteria included history of neurological disorder, brain surgery, TBI, or reporting any “concussion” symptoms at time of the evaluation. The EEG assessment for this subgroup was conducted separately from the DETECT study. EEG data from these participants was verified to be statistically equivalent to the unexposed group of men in the DETECT study with hierarchical clustering analysis and Kolmogorov-Smirnov test, allowing merging of both control groups for the analyses. Both study protocols were approved by the local institutional review boards (IRB) and all participants provided written informed consent.
Measures
Self-reported athletic history
AFE to American football, total years of American football play, and number of seasons and position played in the NFL were collected through self-report. The AFE was determined as the age when participant began to play organized American football.
Neuropsychological and neuropsychiatric measures
A neuropsychological battery was administered to evaluate attention, executive function, verbal and visual episodic memory, language, and visuospatial function, and semi-structured interviews and self-report measures to evaluate neuropsychiatric function (e.g., depression, behavioral dysregulation, aggression). 54 Neuropsychological test raw scores were converted to standard scores that account for age, gender, and/or education. Principal component analysis generated four composite factors measuring the following domains: behavioral/mood, psychomotor speed/executive function, verbal memory, and visual memory. 54
EEG data acquisition and processing
Ten minutes of eyes closed resting EEG was acquired using BrainScope's investigational device (BrainScope Food and Drug Administration [FDA]-cleared device, which does not provide a result to the blind investigators). Data was recorded from a frontal electrode montage including Fp1, Fp2, F7, F8, AFz, A1, and A2 locations of the expanded International 10-20 Electrode Placement System, re-referenced to linked ears. A technician observed the participants throughout data acquisition for vigilance and drowsiness. Data was acquired at a sampling rate of 1 kHz and all electrode impedances were below 10 kΩ.
Using BrainScope's real-time artifact detection algorithms, 45 physiologic and non-physiologic contamination (e.g., lateral and horizontal eye movement, electromyography muscle activity) was identified for removal, assuring quality of EEG data. Only cases with 1-2 min of artifact-free data were selected for further analyses. Sufficient data was available in all but four subjects, which represented <3.5% of all samples.
A set of qEEG features was extracted from the artifact-free data and z-transformed relative to age expected normal values. 45,55 Feature sets characterizing the EEG signal included measures of power (absolute and relative), mean frequency, connectivity (asymmetry, coherence, phase lag, phase synchrony), complexity (fractal dimension and scale-free activity), and information theory (entropy) across and within frequency bands. A multi-variate EEG marker of brain function impairment 53 (Brain Function Index, BFI) also was computed.
Classifier development and evaluation
Two qEEG-based binary supervised classification algorithms were derived to optimize separations between: 1) former NFL players and the age-matched comparison group and 2) within the former NFL player group, between those with AFE <12 and those with AFE ≥12. Least absolute shrinkage and selection operator (LASSO) regression method 56,57 was used to derive these algorithms in the following steps:
Step 1: Informed feature reduction
A challenge to the development of a stable, replicable machine learning classification model is the relationship between the number of participants and the number of input features. If not addressed, the solution may converge to a local optimal solution (overtraining) instead of the global optimum. 58 To minimize overtraining and maximize the likelihood of prospective independent replication, the first step was to perform an informed feature reduction, described in detail elsewhere. 45
Step 2: Recursive feature elimination
Further data reduction and feature selection was achieved through the recursive feature elimination (RFE) algorithm, a stepwise feature elimination method that finds the optimal set of features for a classification using a pre-defined kernel function. 59 In this study, RFE was configured with a linear support vector machine (SVM) 60,61 as the kernel function, and the feature selection process was repeated 30 times on a 3-fold cross-validation (CV) 62 schema. The top 50 qEEG features selected most frequently from the total of 90 runs (30 repetitions × 3-fold CV) constituted the feature set input to the LASSO model development.
Step 3: Classifier development
Cross-validation (CV) strategy also was used to train the LASSO model. For the classification between former NFL players and the age-matched comparison group, data was randomly split into five folds of approximately equal size, keeping the overall group ratios, with one-fold reserved for testing and the remaining four folds used for training the model. This training and testing process was repeated five times until all folds had been used for testing. For the classification between AFE <12 and AFE ≥12 within the former NFL players group, due to the limited number of former NFL players in both classes, a leave-one-out (LOO) cross-validation strategy 62 was adopted. In this case, a single sample was left out each time for testing, while the remaining samples formed the training set for model building. This process was repeated until all samples had been used for testing once.
Step 4: Classifier evaluation
The metrics used to estimate model performance were the receiver operating characteristic (ROC) curve and the area under the ROC curve (AUC) of all normalized discriminant scores from testing sets. For the classification between former NFL players and age-matched participants, the cross-validation classifier development was repeated 20 times for a stable assessment on the algorithm performance. The overall ROC performance of the LASSO algorithm was evaluated by pooling the 100 sets of testing results (20 repetitions × 5 folds). For the classification within the former NFL players, the ROC performance was assessed using the LOO cross-validation testing results.
Results
Classification results for former NFL players versus comparison group
After the application of exclusion criteria and EEG quality check (1-2 min of artifact-free data), the study population for algorithm development consisted of 87 former NFL players, 24 same-age unexposed men (recruited from DETECT), and 44 healthy volunteers (recruited from BrainScope DoD study). Body mass index difference between former NFL players and unexposed men from DETECT study was consistent to what previously reported. 63 Table 1 presents sample characteristics.
Sample Characteristics between Former NFL Players and Comparison Group
Data was only available for unexposed men from DETECT study.
The comparison group includes 24 unexposed men from DETECT study and 44 age and gender matched healthy volunteers from a concussion assessment study.
NFL, National Football League; SD, standard deviation; DETECT, Diagnosing and Evaluating Traumatic Encephalopathy using Clinical Tests study.
Following the procedures described above, 50 qEEG features were input to the model training and the classification performance was analyzed based on discriminant scores from 20 repeats of 5-fold cross-validation. The ROC curve for the classification function shown in Figure 1 had an AUC of 0.748. Relative to the optimal operating point (selected to target high specificity to minimize false positives), sensitivity of 60% and specificity of 80% were obtained (at discriminant score threshold value of 0.115).
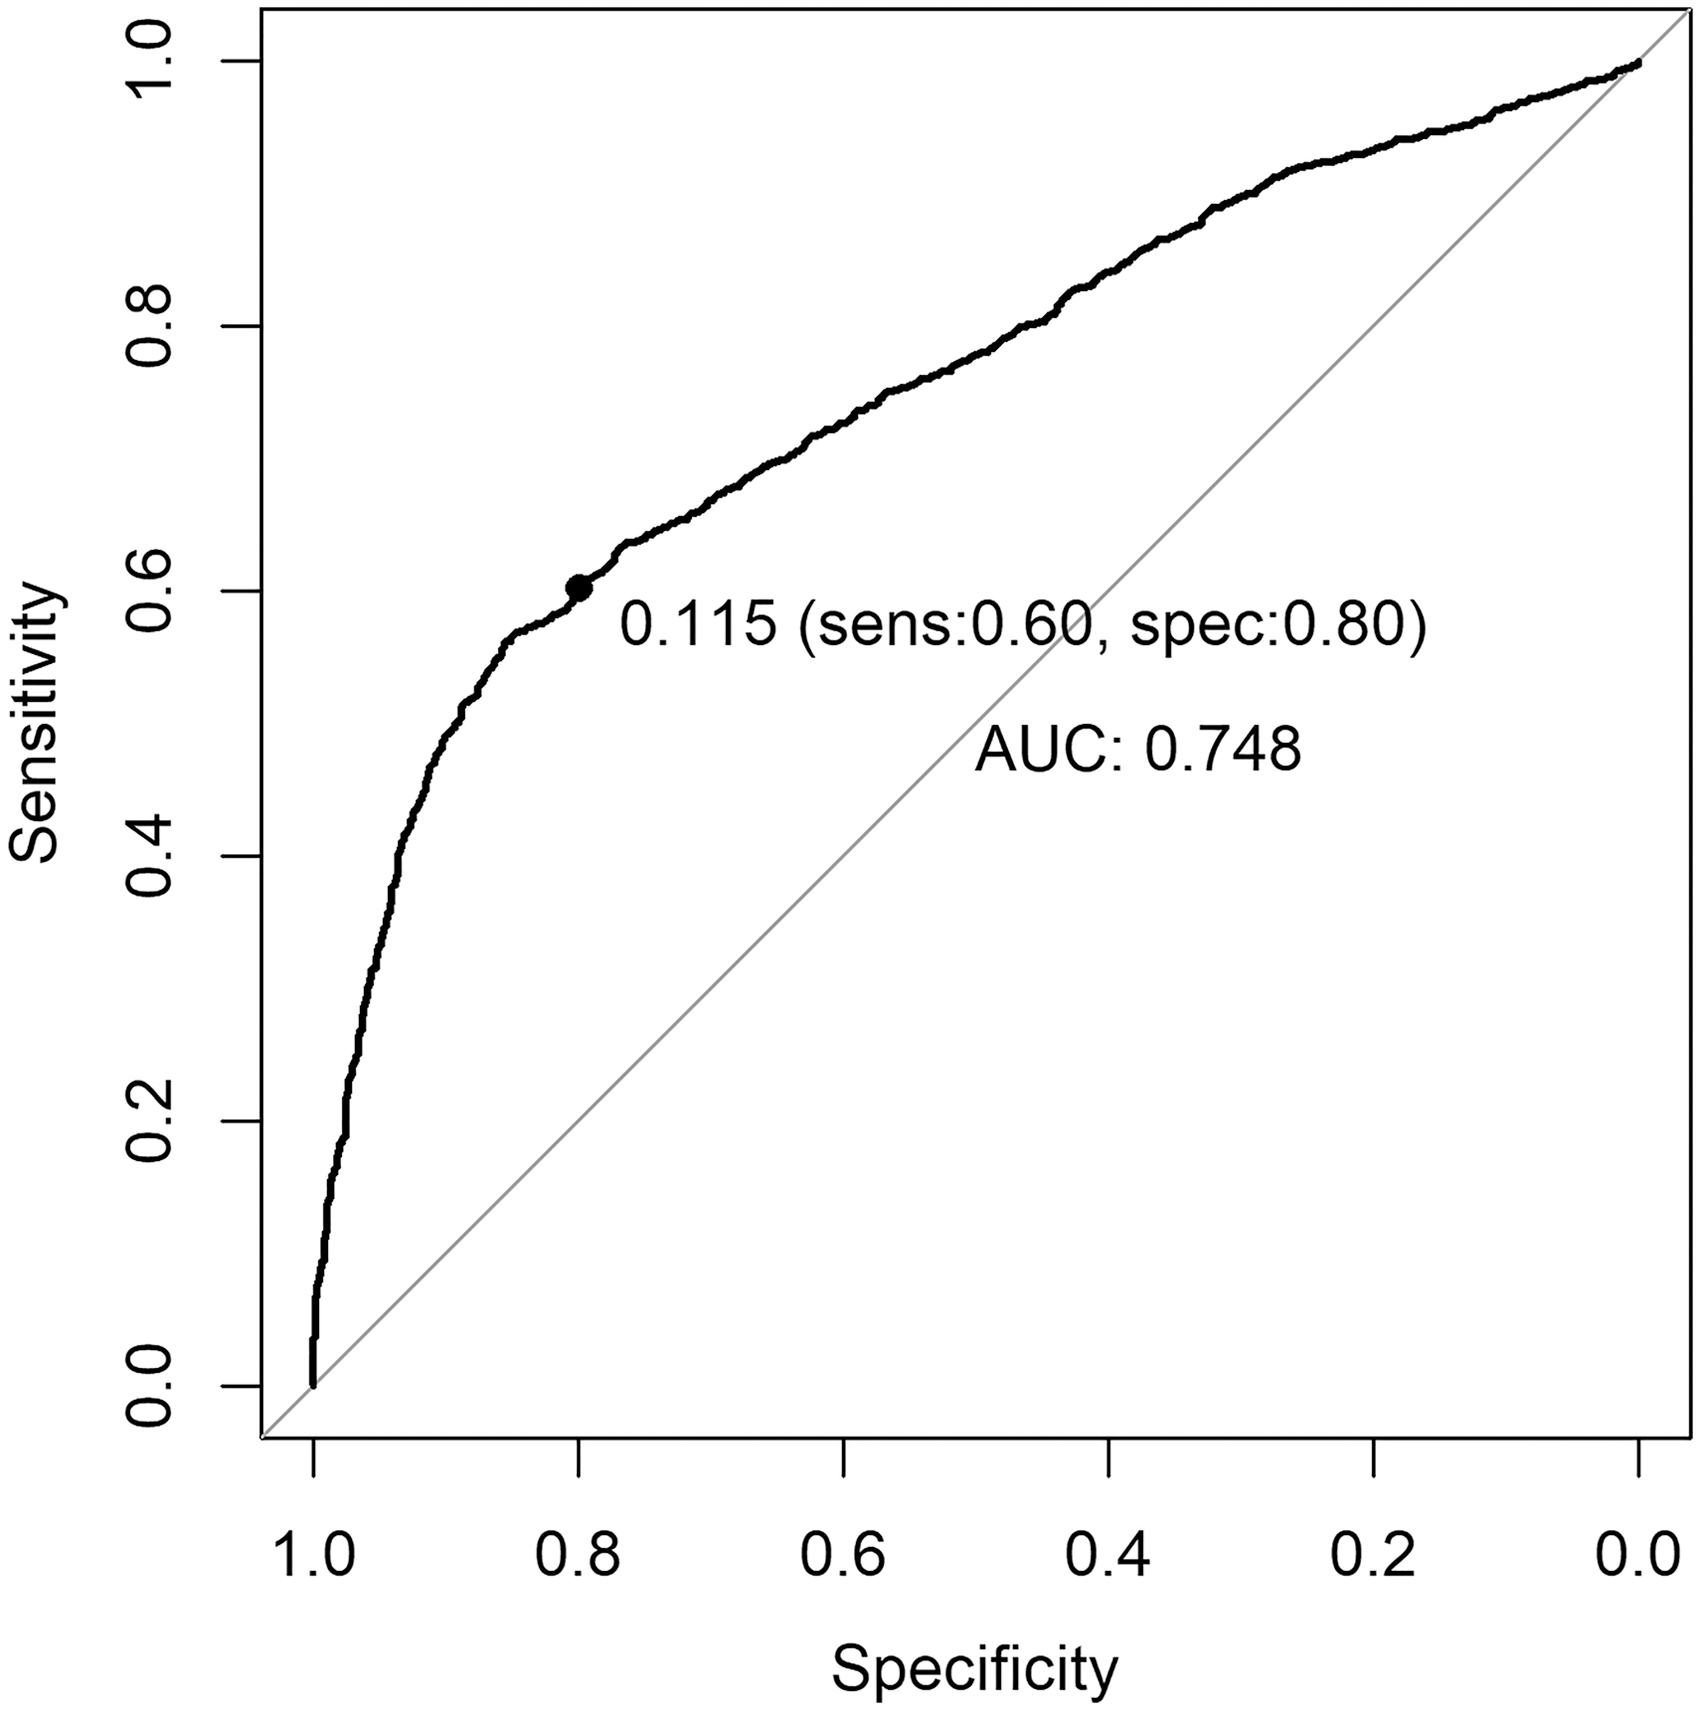
Receiver operating characteristic curve of the least absolute shrinkage and selection operator discriminant score when classifying between former National Football League players and participants in comparison group.
Figure 2 shows the mean z-values of features with high contribution to the algorithm. These features are expressed as z-scores relative to the age-expected normal value; the closer to zero, the more normal the feature. For all features displayed in Figure 2, the comparison group shows values closer to zero than the former NFL player group. On the other hand, the former NFL players consistently display non-zero values, indicating abnormalities in the features. Other features not shown include multi-variate features, for which the significance of the magnitude of the differences between the groups is important and not the direction of the z-score.

Group average mean z-score (with 95% confidence interval error bars) for each predominance quantitative electroencephalogram variable shown for the former National Football League player population (n = 87) and comparison group (n = 68). These variables are a subset of those contributing the most to the classifier algorithm separating the two groups. The significance level of a group average z-score is estimated by considering the square root of the size of the group. Thus, for this group size, a z-score of 0.4 is associated with a p < 0.001.
Features contributing to the function included measure sets characterizing different aspects of the EEG signal, including absolute power, relative (%) power, mean frequency, coherence, and power asymmetry. Features contributing highest to the algorithm (Fig. 2) were in the theta frequency band and delta+theta bands (a multi-variate feature for slow waves), reflecting slowing in the frequency spectra in the NFL group compared with the controls; and in connectivity measures in the alpha band, reflecting disruption of the connections between brain regions. These selected features relate to changes in the way the brain generates, transmits, and processes neural signals both within and between regions.
Pearson's correlation coefficients and associated p values between the averaged discriminant scores (mean across the internal cross validations) and values of each of the four clinical feature composites scores 54 controlled by age, body mass index, and years of football play were computed for the former NFL group (Table 2). Correlations between discriminant score and the BrainScope multi-variate BFI are also displayed in Table 2. Sample size for the four clinical composites was 77 and for the BFI was 87. The p values were corrected for multiple tests using Benjamini and Hochberg method.
Correlations between Clinical Composites/Brain Function Index (BFI) and Discriminant Scores, with Associated p Value for the Significance of the Correlations
Ten former National Football League players were removed from the correlation analysis due to the absence of clinical feature assessments.
Sample size for the four clinical composites was 77 and for the BFI was 87.
Only the BFI showed a significant correlation with the discriminant score for the participants (-0.4444, p < 0.0001). The BFI is a measure of severity of brain function impairment in concussion. It was previously derived as a single score in an independent cohort and validated in a large FDA study. 53
Without any controlling factor, age (0.1305, p = 0.2282), AFE (0.0240, p = 0.8253), and years of football play (-0.1650, p = 0.1267) had no significant correlation with the discriminant score of the former NFL players.
Classification results for separation within former NFL players based on AFE to American football
Eighty-seven former NFL players were segmented into two groups based on AFE—before or after age 12. The subgroups were matched for their total years of football play as a controlling factor. Each subject from the AFE <12 group, the smaller group, was matched to a subject from the AFE ≥12 group that had the closest value in years of football play. Such sample paring process reduced the potential confounding of years of exposure to football play and resulted in equal size for both groups (n = 33).
A LASSO classification model was trained based on 50 qEEG features and tested using leave-one-out cross-validation. The ROC curve for the classification function shown in Figure 3 had an AUC of 0.721. Relative to the optimal operating point (selected to target high sensitivity to minimize false negatives), sensitivity of 76% and specificity of 52% were obtained (at discriminant score threshold value of -0.367).
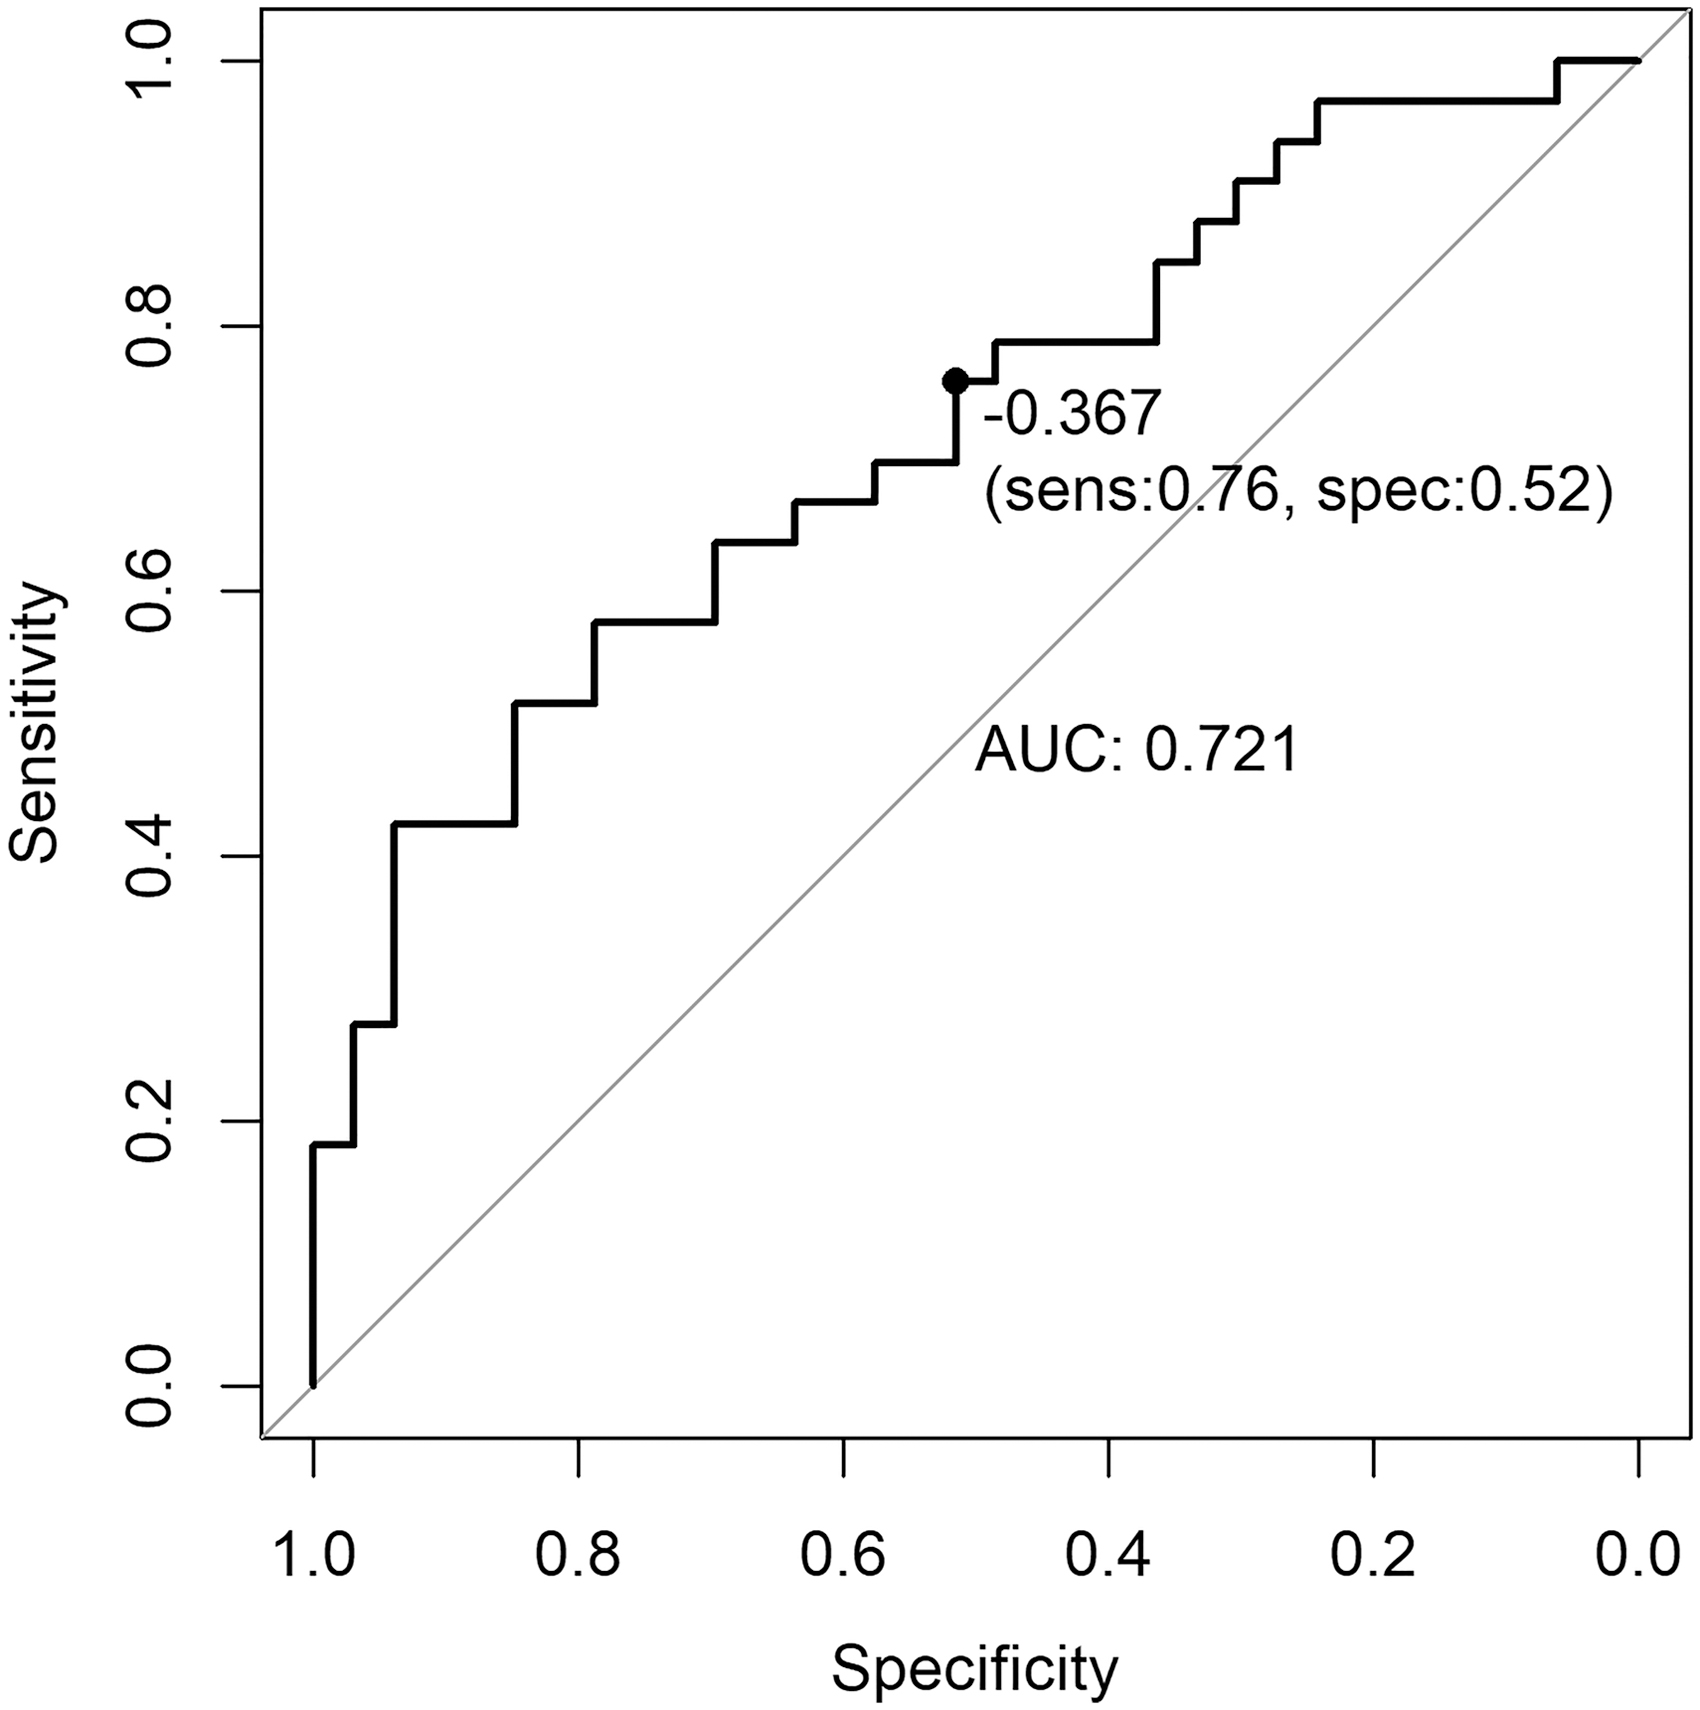
Receiver operating characteristic curve of the least absolute shrinkage and selection operator discriminant score when classifying between former National Football League players with age of first exposure (AFE) <12 and AFE ≥12.
Figure 4 shows the mean z-values of the highest contributing features for the AFE <12 and AFE ≥12 groups. Top contributing features to the separation between the groups were in the theta band, with some features in the high alpha band, within the left hemisphere or between the left hemisphere and midline regions. Hypocoherence in the theta band between dorsolateral prefrontal cortical regions was seen in the AFE <12 group, whereas the AFE ≥12 group showed a tendency toward hypercoherence (lack of expected differentiation between regions). Significantly decreased mean frequency in the high beta (gamma 1) across frontopolar regions was also characteristic of the AFE <12 group, with the AFE ≥12 group having more normally expected values.
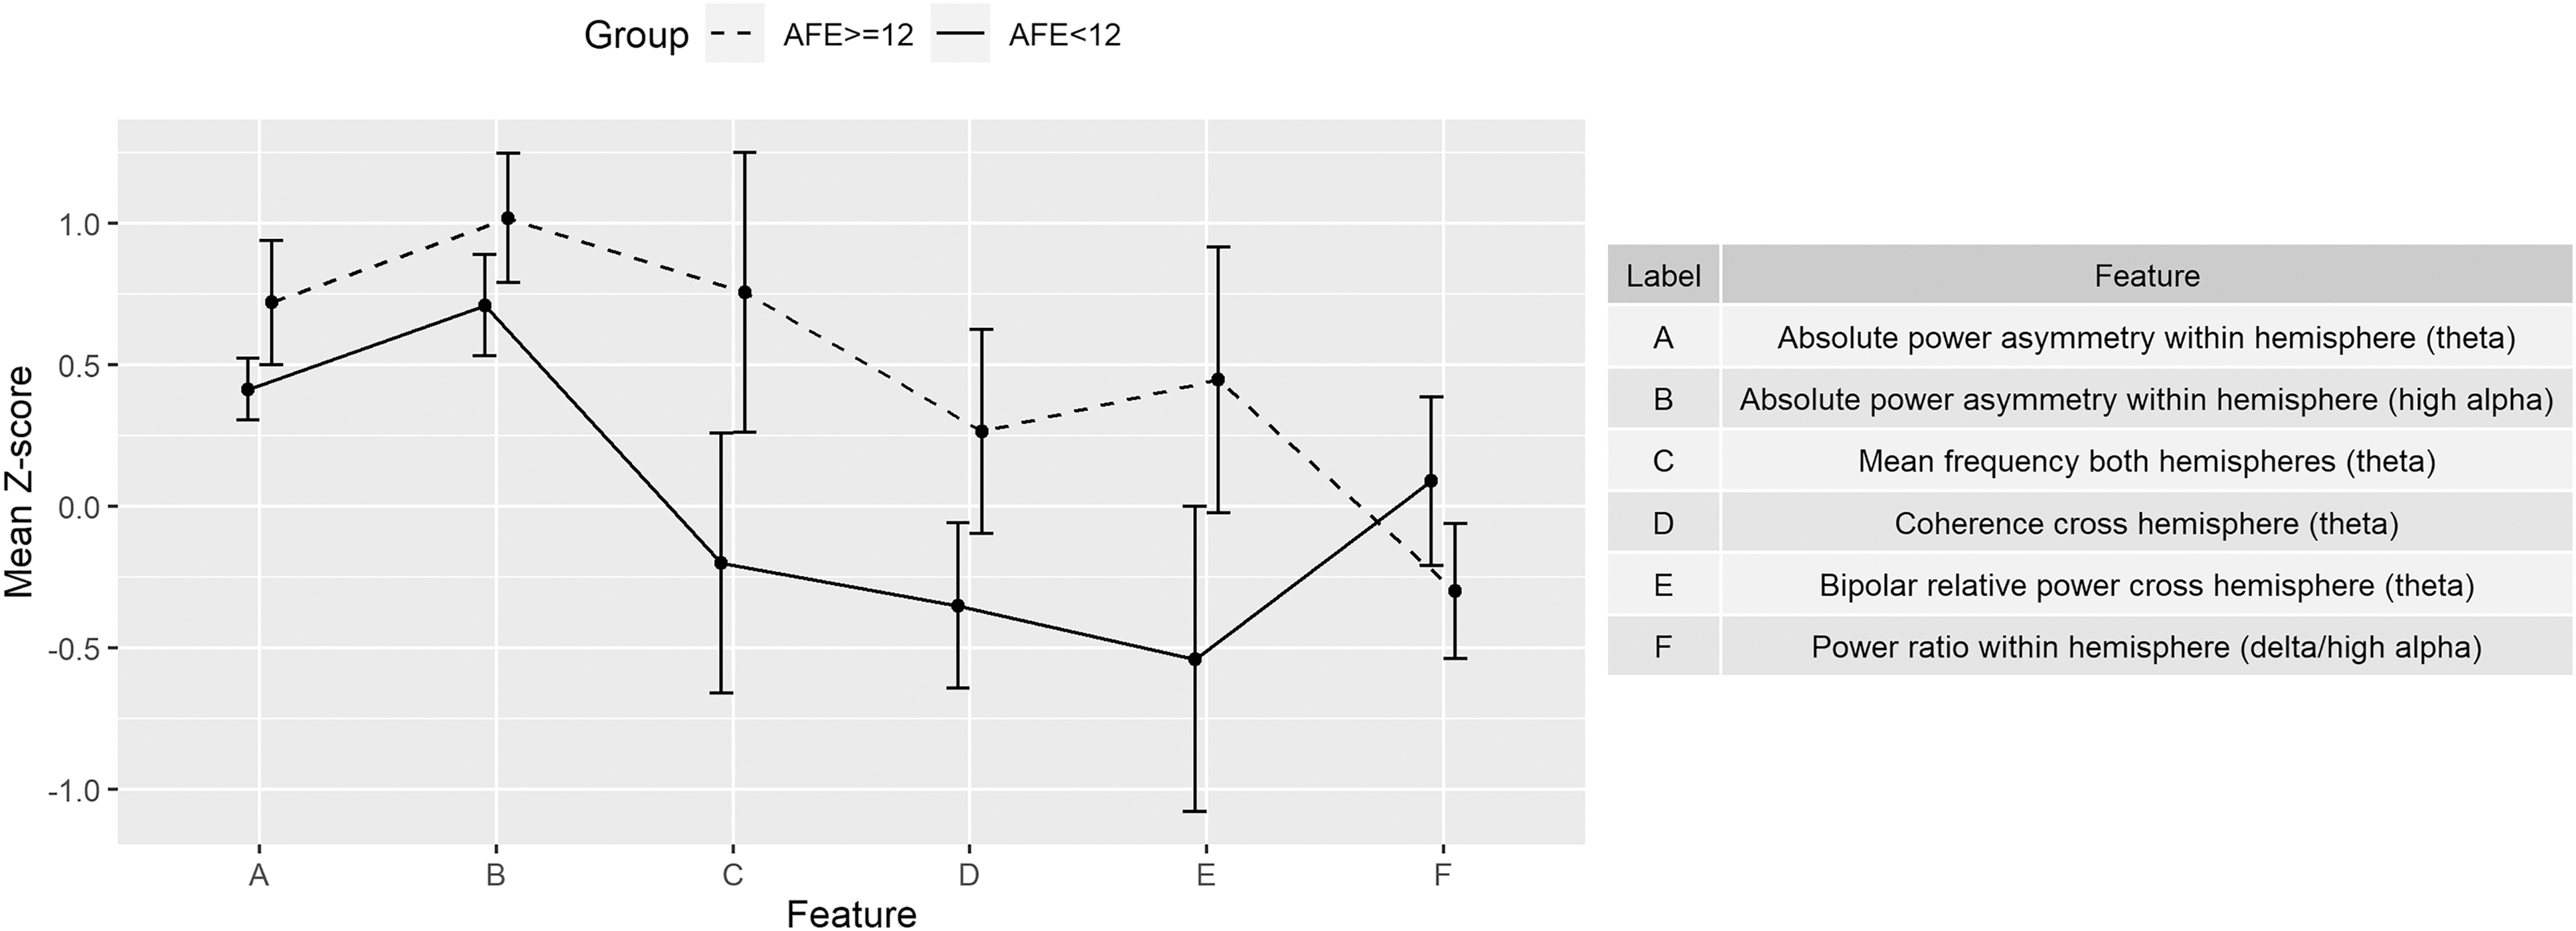
Group average mean z-score (with 95% confidence interval error bars) for each predominance quantitative electroencephalogram variable shown for the age of first exposure (AFE) <12 (n = 33) and AFE ≥12 (n = 33). These variables are a subset of those contributing the most to the classifier algorithm separating the two groups. The significance level of a group average z-score is estimated by considering the square root of the size of the group. Thus, for this group size, a z-score of 0.6 is associated with a p < 0.001.
Table 3 shows the Pearson's correlation between the discriminant score and each of the four clinical feature composite scores 54 controlled by age, body mass index, and years of football play. Correlation between discriminant score and BFI is also included in Table 3. Sample size for the four clinical composites was 59 and for BFI was 66. The p values were corrected using Benjamini and Hochberg method.
Correlations between Clinical Composites/Brain Function Index (BFI) and Discriminant Scores Generated by the Classifier for the Separation of AFE <12 and AFE ≥12
Four participants in AFE <12 and three participants in AFE ≥12 were removed from the correlation analysis due to the absence of clinical feature assessments.
Sample size for the four clinical composites was 59 and for the BFI was 66.
AFE, age of first exposure.
Discussion
A qEEG-based biomarker derived using ML analyses accurately differentiated former NFL players from men without RHI. These classification algorithms identified a distinctive profile of qEEG abnormalities characteristic of the NFL players and demonstrated the long-term consequences of RHI and the potential of EEG as a biomarker of persistent changes in brain function. It is important to note that it is the unique set of features that define the qEEG-based biomarker, no one of which could distinguish between groups. Consideration of the qEEG features that contributed most highly to this discrimination suggest the underlying pathophysiology present in this group. These features included abnormalities in power features in slow-wave (delta, theta, and delta+theta) frequencies, often associated with neurodegenerative disorders, hippocampal atrophy and decreased cerebral perfusion. 37,42,64 Also, contributing were deficits of alpha bipolar absolute power, consistent with what has been reported in concussion. 49,65,66 Also part of this profile was positive values for coherence features indicate hypercoherence both within and between hemispheres in the alpha band, often associated with cognitive and executive dysfunction, 67 reflecting temporal hypersynchrony of coupled rhythmic oscillations. The presence of several features reflecting disturbances in connectivity (coherence and asymmetry) provides further evidence of disruption in white matter tracts often reported in concussion and post-concussion syndrome, seen here in the former NFL players. 47,68 -70 This is also supported in the significant correlation between classification discriminant scores and participant's BFI score, which is an EEG composite feature heavily weighted by measures of connectivity. It is of note that the discriminating features selected by the classifier often involved the dorsolateral prefrontal cortex, which has been reported in neuroimaging studies to correlate with disruption of structural integrity of this region in post-concussion syndrome. 71,72 Further, the correlation with BFI suggests that a single multi-variate marker for the presence of such brain function abnormalities may be derived from the EEG signal acquired only on the frontal and frontotemporal locations.
With respect to key qEEG features of the profile distinguishing former NFL players based on AFE, it is of note that features were more abnormal (severe) in the AFE <12 group. That is, the group whose exposure began pre-adolescence reveals changes in EEG frequency and region connectivity consistent with neurodegenerative or other cognitive disorders to a greater extent than those within the AFE ≥12 group. Discriminating features often belong to the high alpha and theta frequency bands, known to be associated with cortical thinning and hippocampal atrophy in studies of patients with mild cognitive impairment. 73 The presence of a profile of EEG abnormalities seen in the former NFL players, more prominent in those with younger AFE, supports the long-term consequence of RHI, and again suggests the potential of this EEG technology in the detection of persistent changes in brain function.
A limitation of this study was the availability of former NFL players, especially as it relates to the within group comparisons and the ability to use an independent hold-out data set for classifier evaluation. It is important for future studies to include information related to medical histories, especially those reported to be associated with brain connectivity, not available in this sample. The fact that all former NFL players were symptomatic (by inclusion criteria) limits the generalization of the findings. Due to the difficulty of recruiting former NFL players, future studies may be enhanced by recruiting a symptomatic control group. In addition, only male former professional American football players were enrolled, which constrains the findings to a specific demographically homogeneous group. Despite these restrictions, multiple rounds of algorithm induction reported qEEG activity profiles consistent with the suggested underlying mechanisms of neurodegeneration and disruption of connectivity between brain regions. A larger, more diverse population with RHI would allow the extension and validation of the findings reported.
Conclusions
The presence of a profile of qEEG abnormalities seen in former NFL players, more prominent in those with younger AFE, supports the long-term consequence of RHI. Features contributing to this qEEG-based biomarker included those associated with neurodegeneration and disruption of white matter tracts, supporting the role of these pathophysiological changes in RHI. The ease of use of a limited montage EEG assessment system to rapidly test brain function illustrates the potential of a brain electrical activity biomarker to aid in the identification and tracking of such changes in the RHI population.
Footnotes
Acknowledgments
We thank the participants and investigators who participated in this study.
The views, opinions and/or findings contained in this presentation are those of the authors and should not be construed as an official Department of the Army position, policy, or decision, and do not necessarily represent the official views of the National Institute of Neurological Disorders and Stroke.
Authors' Contributions
Dr. B. Liang, Dr. M.L. Alosco, Dr. R. Armañanzas, and Dr. L.S. Prichep made contributions to the algorithm development, data analyses, and drafting of the manuscript. Dr. Y. Tripodis provided critical review of the data analyses. Mr. B.M. Martin was responsible for the database management and data pre-processing of the clinical study. Dr. R.A. Stern was responsible for the overall design and data collection for the clinical study and contributed to the draft and critical review of the manuscript.
Funding Information
This work was funded, in part, by a grant from the U.S. Department of Defense #W81XWH-14-C-1405 and the following grants from National Institute of Neurological Disorders and Stroke: R01NS078337, R56NS078337, and K23NS102399.
Author Disclosure Statement
Dr. B. Liang is employed by BrainScope as a Senior Data Scientist/R&D Engineer. Dr. L.S. Prichep is employed by BrainScope as the Chief Scientific Officer and is a professor at NYU School of Medicine (Ret). Dr. Prichep holds potential financial interest through patented technology licensed by BrainScope from NYU School of Medicine. Dr. R. Armañanzas was an employee of BrainScope at the time of the preliminary data analyses. Dr. R.A. Stern receives consulting fees from Biogen and Lundbeck, as well as royalties from Psychological Assessment Resources, Inc. Dr. Stern has stock options as a member of the Board of Directors for King Devick Technologies, Inc.
For the other authors, no competing financial interests exist.