




Abstract
Traumatic brain injury (TBI) and obesity are two common conditions in modern society; both can impair neuronal integrity and neurological function. However, it is unclear whether the coexistence of both conditions will worsen outcomes. Therefore, in a rat model, we aimed to investigate whether the coexistence of TBI and a high-fat diet (HFD) has an additive effect, leading to more severe neurological impairments, and whether they are related to changes in brain protein markers of oxidative stress, inflammation, and synaptic plasticity. Sprague–Dawley rats (female, ∼250 g) were divided into HFD (43% fat) and diet (CD) (17% fat) groups for 6 weeks. Within each dietary group, half underwent a TBI by a weight-drop device, and the other half underwent sham surgery. Short-term memory and sensory function were measured at 24 h, 1 week, 3 weeks, and 6 weeks post-TBI. Brain tissues were harvested at 24 h and 6 weeks post-TBI, and markers of oxidative stress, apoptosis, inflammation, and synaptic plasticity were measured via immunostaining and Western blotting. In rats without TBI, HFD increased the pre-synaptic protein synaptophysin. In rats with TBI, HFD resulted in worsened sensory and memory function, an increase in activated macrophages, and a decrease in the endogenous antioxidant manganese superoxide dismutase (MnSOD). Our findings suggest that the additive effect of HFD and TBI worsens short term memory and sensation deficits, and may be driven by enhanced oxidative stress and inflammation.
Introduction
Traumatic brain injury (TBI) is defined as a “bump, blow, or jolt to the head that interferes with the normal function of the brain.” 1 It makes up nearly two thirds of all annual disease incidence in Australia and the United States. 2 It is a debilitating and often degenerative condition that can have lifelong consequences even when it is classified as “mild.” 3 Most patients with mild TBI recover relatively rapidly, with the uninjured brain regions compensating for functional loss caused by any irreversible tissue damage. 4 However, some neurological consequences can be far reaching and may increase in severity as time passes, such as to memory, where deficits may not always recover and are often indicative of future neurodegenerative disease. 5
The primary tissue injury mainly consists of mechanical damage such as the destruction of tissue and blood vessels, causing rapid mass cell death. 6 The primary injury is irreversible, and treatment strategies mostly focus on reducing the penumbra, the zone of dying tissue surrounding the primary injury site. 4 The impact from the expansion of the penumbra is often more detrimental than the primary injury. 7 Direct mechanical damage initiates multiple biochemical cascades that, over the course of several hours, damage the tissue surrounding the core injury site, resulting in neuronal cell death and inflammation. Tissue in the penumbra slowly dies and becomes part of the core infarction over the next 2–24 h after the original injury. 8 Without timely treatment, tissue loss caused by secondary injury is permanent. 9 The inflammatory response itself can cause further damage to the tissue because of the release of chemotactic and pro-inflammatory modulators. 10,11 Therefore, we measured macrophage activation in the brain at various time points after injury.
Inflammation can also induce oxidative stress, further damaging cellular functions. Reactive oxygen species (ROS) are a natural byproduct of the electron transport chain. 12 In healthy cells, ROS are removed by the antioxidant defense system, including antioxidant enzymes such as manganese superoxide dismutase (MnSOD). 13 Following an injury, ROS often overwhelm the capacity of the antioxidants, resulting in oxidative stress. Thus, following a TBI, progressive cell damage and apoptosis caused by inflammation and oxidative stress enlarge the tissue injury size and increase symptom severity over time. 14,15 Synaptic plasticity is also significantly impaired in the surviving neurons. 16 Therefore, antioxidant treatment immediately after TBI has been shown to reduce injury size and improve neurological function. 17,18
Obesity is another global health concern. 19 In obese individuals, ROS are significantly increased in the brain, leading to the shortage of endogenous antioxidants. 20,21 It is known to exacerbate aging-related cognitive decline 22 ; however, how obesity affects TBI-related neurological outcomes is not fully understood. Given that approximately half of the world's adult population are either overweight or obese, 23 this study aimed to determine the combined effects of obesity induced by a high-fat diet (HFD) 24,25 and TBI on neurological outcomes, tissue integrity, and markers of inflammation, endogenous antioxidants and synaptic proteins in the brain.
Methods
Modeling obesity and TBI
Approval for the animal experiments was granted by the Animal Care and Ethics Committee at the University of Technology Sydney (ACEC# 2014000478). The study was conducted in accordance with the guidelines provided by the Australian National Health and Medical Research Council in the Guide for the Care and Use of Laboratory Animals.
Female Sprague–Dawley rats (n = 72, ∼ 250 g, Animal Resources Centre, Perth, Australia) were used. We only focused on the female to preclude sex-related effects, and because TBI in human females was associated with higher morbidity and mortality rates. 26 Half of the rats were provided with an HFD (20 KJ/g, 43% energy as fat, Specialty Feed, WA, Australia) to induce obesity and the other half were provided with a standard chow diet (CD) (14 KJ/g, 17% energy as fat, Gordon's Specialty Stockfeeds, NSW, Australia) for 6 weeks. Rats from each dietary group were then randomly assigned to TBI or sham surgery, resulting in four groups: SHAM-CD, SHAM-HFD, TBI-CD, and TBI-HFD. Surgery was performed with the animals under anaesthesia (isoflurane, 4% induction, 2% maintenance), as we have reported previously. 15,17,18 Briefly, a craniectomy was made on the right side of the skull using a dental drill at 2.5 mm posterior and 3.0 mm lateral to bregma, after which a New York University Impactor, 2.5 mm diameter, 10 g weight dropped from 5 cm above the surface of the brain, was used to induce a cortical contusion. This produced a moderate TBI with a small focal contusion, which was confirmed visually in all rats undergoing TBI. 17 Sham rats underwent all surgical procedures except for the weight drop injury.
Behavioral tests
Short-term memory function was tested through the novel object recognition (NOR) test at 24 h, and at 1, 3, and 6 weeks post-surgery. 15,17,18 During the familiarization phase, each rat was placed in the field with two identical objects for 5 min. One hour later, the rat was reintroduced to the field, in the presence of one of the familiar objects and a novel object for another 5 min. Videos were then analyzed by an unbiased assessor who was blinded to the treatment groups. The data were presented as the Recognition Index, which is the time spent on the novel object divided by the total time spent on both objects in the test phase.
The adhesive tape removal test was performed to determine sensory function following a TBI at 24 h, and at 1, 3, and 6 weeks post-surgery. 17,18 The rat was gently restrained while an adhesive sticker was placed on its forepaw, and then placed in a box. The recording was of the time when the rat noticed the sticker on its foot. A rat “noticing” the sticker was defined as touching, looking at, or shaking the affected limb. An injury to the motor-sensory region of the right side of the brain would be expected to affect the sensory function of the left side of the body. 27 This test was repeated six times on alternating forepaws. The data were presented as the ratio of the average time for the left forepaw over the average time for the right forepaw.
Brain tissue collection and marker analyses
Rats were euthanized at either 24 h (n = 9/group) or 6 weeks (n = 9/group) post-surgery with an overdose of anaesthetics (pentobarbitone, 0.1 mL/100 g, i.p.). The brain was bisected coronally through the lesion site, and the posterior half of the brain was fixed in 10% formalin, processed through graded alcohols, and paraffin embedded. Sections were then cut in a series of 10 at a thickness of 5 μm. These sections were used to score the cortical lesion severity and for immunostaining of markers of neurons, macrophages, and apoptosis. The anterior part of the injury site was snap-frozen and stored at -80°C for the study of protein expression of specific synaptic proteins via Western blotting.
Histology and immunostaining
Slides were deparaffinized and one slide in each series was stained with hemotoxylin and eosin to grade the lesion severity in the cortex, hippocampus, and thalamus using a semi-quantitative scoring system as previously published 15,17 (0: no visible damage; 1: minimal tissue damage; 2: bleeding, necrotic, and/or dying tissue; 3: extensive necrosis, tissue loss).
Adjacent slides were deparaffinized for immunostaining as previously published. 17 Briefly, slides underwent antigen retrieval through a 15 min incubation in citrate buffer (pH = 6) in a pressure cooker. Immunohistochemistry (IHC) was applied to analyze neuronal nuclei (NeuN) and the apoptotic marker caspase-3, while immunofluorescence was applied to analyze macrophage marker ectodermal dysplasia 1 (ED1)/CD68.
To measure apoptosis, we used caspase-3 staining, which is a key enzyme to induce apoptosis. For IHC, sections underwent endogenous peroxidase blocking, followed by blocking in 5% normal goat serum (NGS) for 30 min, and incubation in primary antibody (NeuN, clone A60, 1:1000, Millipore, MA USA; or caspase-3, 1:300, BD Biosciences, CA, USA) overnight at 4°C, followed by appropriate secondary antibody (biotinylated Horse anti-Mouse, 1:200, Vector Laboratories, CA, USA; and Goat anti-Rabbit - HRP, 1:200, Vector Laboratories, respectively) for 2 h at room temperature. Staining was amplified with Avidin-Biotin Complex (Vector Laboratories) for 1 h, developed with 3,-3’-diaminobenzidine (DAB), and counterstained in hematoxylin.
ED1 staining recognizes activated macrophages, overexpressing the glycoprotein cluster of differentiation 68 (CD68), and ED1 is an anti-CD68 antibody. 28 We analyzed this marker by immunofluorescence. Sections were blocked in 5% NGS for 30 min, and incubated in primary antibody against ED1/CD68, (1:500, Abd Serotec, Oxford, UK) overnight at 4°C, followed by incubation with rabbit anti-Mouse - AF568 (1:200, AlexaFluor, ThermoFisher, MA, USA), and counterstained with Hoechst (1:5000, Invitrogen, CA).
An Olympus BX-51 light microscope with an Olympus U-RFL-T fluorescence burner was used to image the slides using built-in software and an NUA filter (blue; absorption = 360–370, emission = 420–460) and a WIG filter (red; absorption = 530-550, emission = 575). Multiple images were taken from the cortex, hippocampus, and thalamus on each side of the lesion site, as well as directly in the center of the lesion, or approximately where the lesion would have been on an uninjured animal, and analyzed using ImageJ software (National Institutes of Health, MD, USA). Positively stained cells were counted and averaged between multiple fields of view (FOV).
Western blotting
Tissue was homogenized using cell lysis buffer, and then the whole protein was separated on NuPager Novexr 4–12% Bis-Tris gels (ThermoFisher) with Novex sharp pre-stained protein standard. Protein was dry-transferred to polyvinylidene fluoride (PVDF) membranes (Rockford, IL, USA), and was blocked with skim milk in TBST, followed by incubation with the primary antibodies (antioxidant MnSOD 1:2,000, Santa Cruz Biotech; synaptic proteins synaptophysin 1:2000, NOVUS; synapsin 1:1000, Cell Signaling Technology; postsynaptic density protein 95 (PSD-95) 1:1000, Cell Signaling Technology; and loading control β-actin 1:10,000, Santa Cruz Biotech) overnight at 4°C. Membranes were then incubated in secondary antibodies (IgG-HRP 1:2,000; IgG-HRP 1:2,000, both Santa Cruz Biotech) 15 for 2 h at room temperature and the bands were visualized using a Bio-Rad ChemiDoc imager and analyzed with ImageJ. The band densities were standardized to the housekeeping control protein β-actin.
Statistical analysis
All results are presented as the mean ± standard error of the mean (SEM). The body weight of CD and HFD rats before surgery was analyzed by an unpaired student's t test. Two-way analysis of variance (ANOVA) was performed, followed by Tukey post-hoc tests for all other outcome measures. Occasional samples were not usable as a result of technical issues and were omitted from the analysis. P < 0.05 was considered significant.
Results
Body weight
The CD rats weighed 170 ± 10 g, and the HFD rats weighed 171 ± 8 g at the start of the experiments. After 6 weeks of diet intervention, the HFD rats were on average 25 g heavier than the CD rats (281 ± 13 g vs. 256 ± 18 g, p = 0.053, n = 18). At the end of the study, the SHAM-HFD rats (328 ± 17 g) were significantly heavier than the SHAM-CD rats (285 ± 14 g, p < 0.01, n = 18).
Short-term memory and sensory functions
At 24 h post-injury, there were significant overall short-term memory deficits caused by TBI (F [1,59] = 6.631, p < 0.05). The TBI-CD group did not show any short-term memory deficit; however, the TBI-HFD group showed significantly impaired short-term memory compared with the SHAM-HFD (p < 0.05). The memory function was not different between rats with and without TBI from 1 week until the end-point at 6 weeks post-injury, regardless of the diet (Fig. 1A).
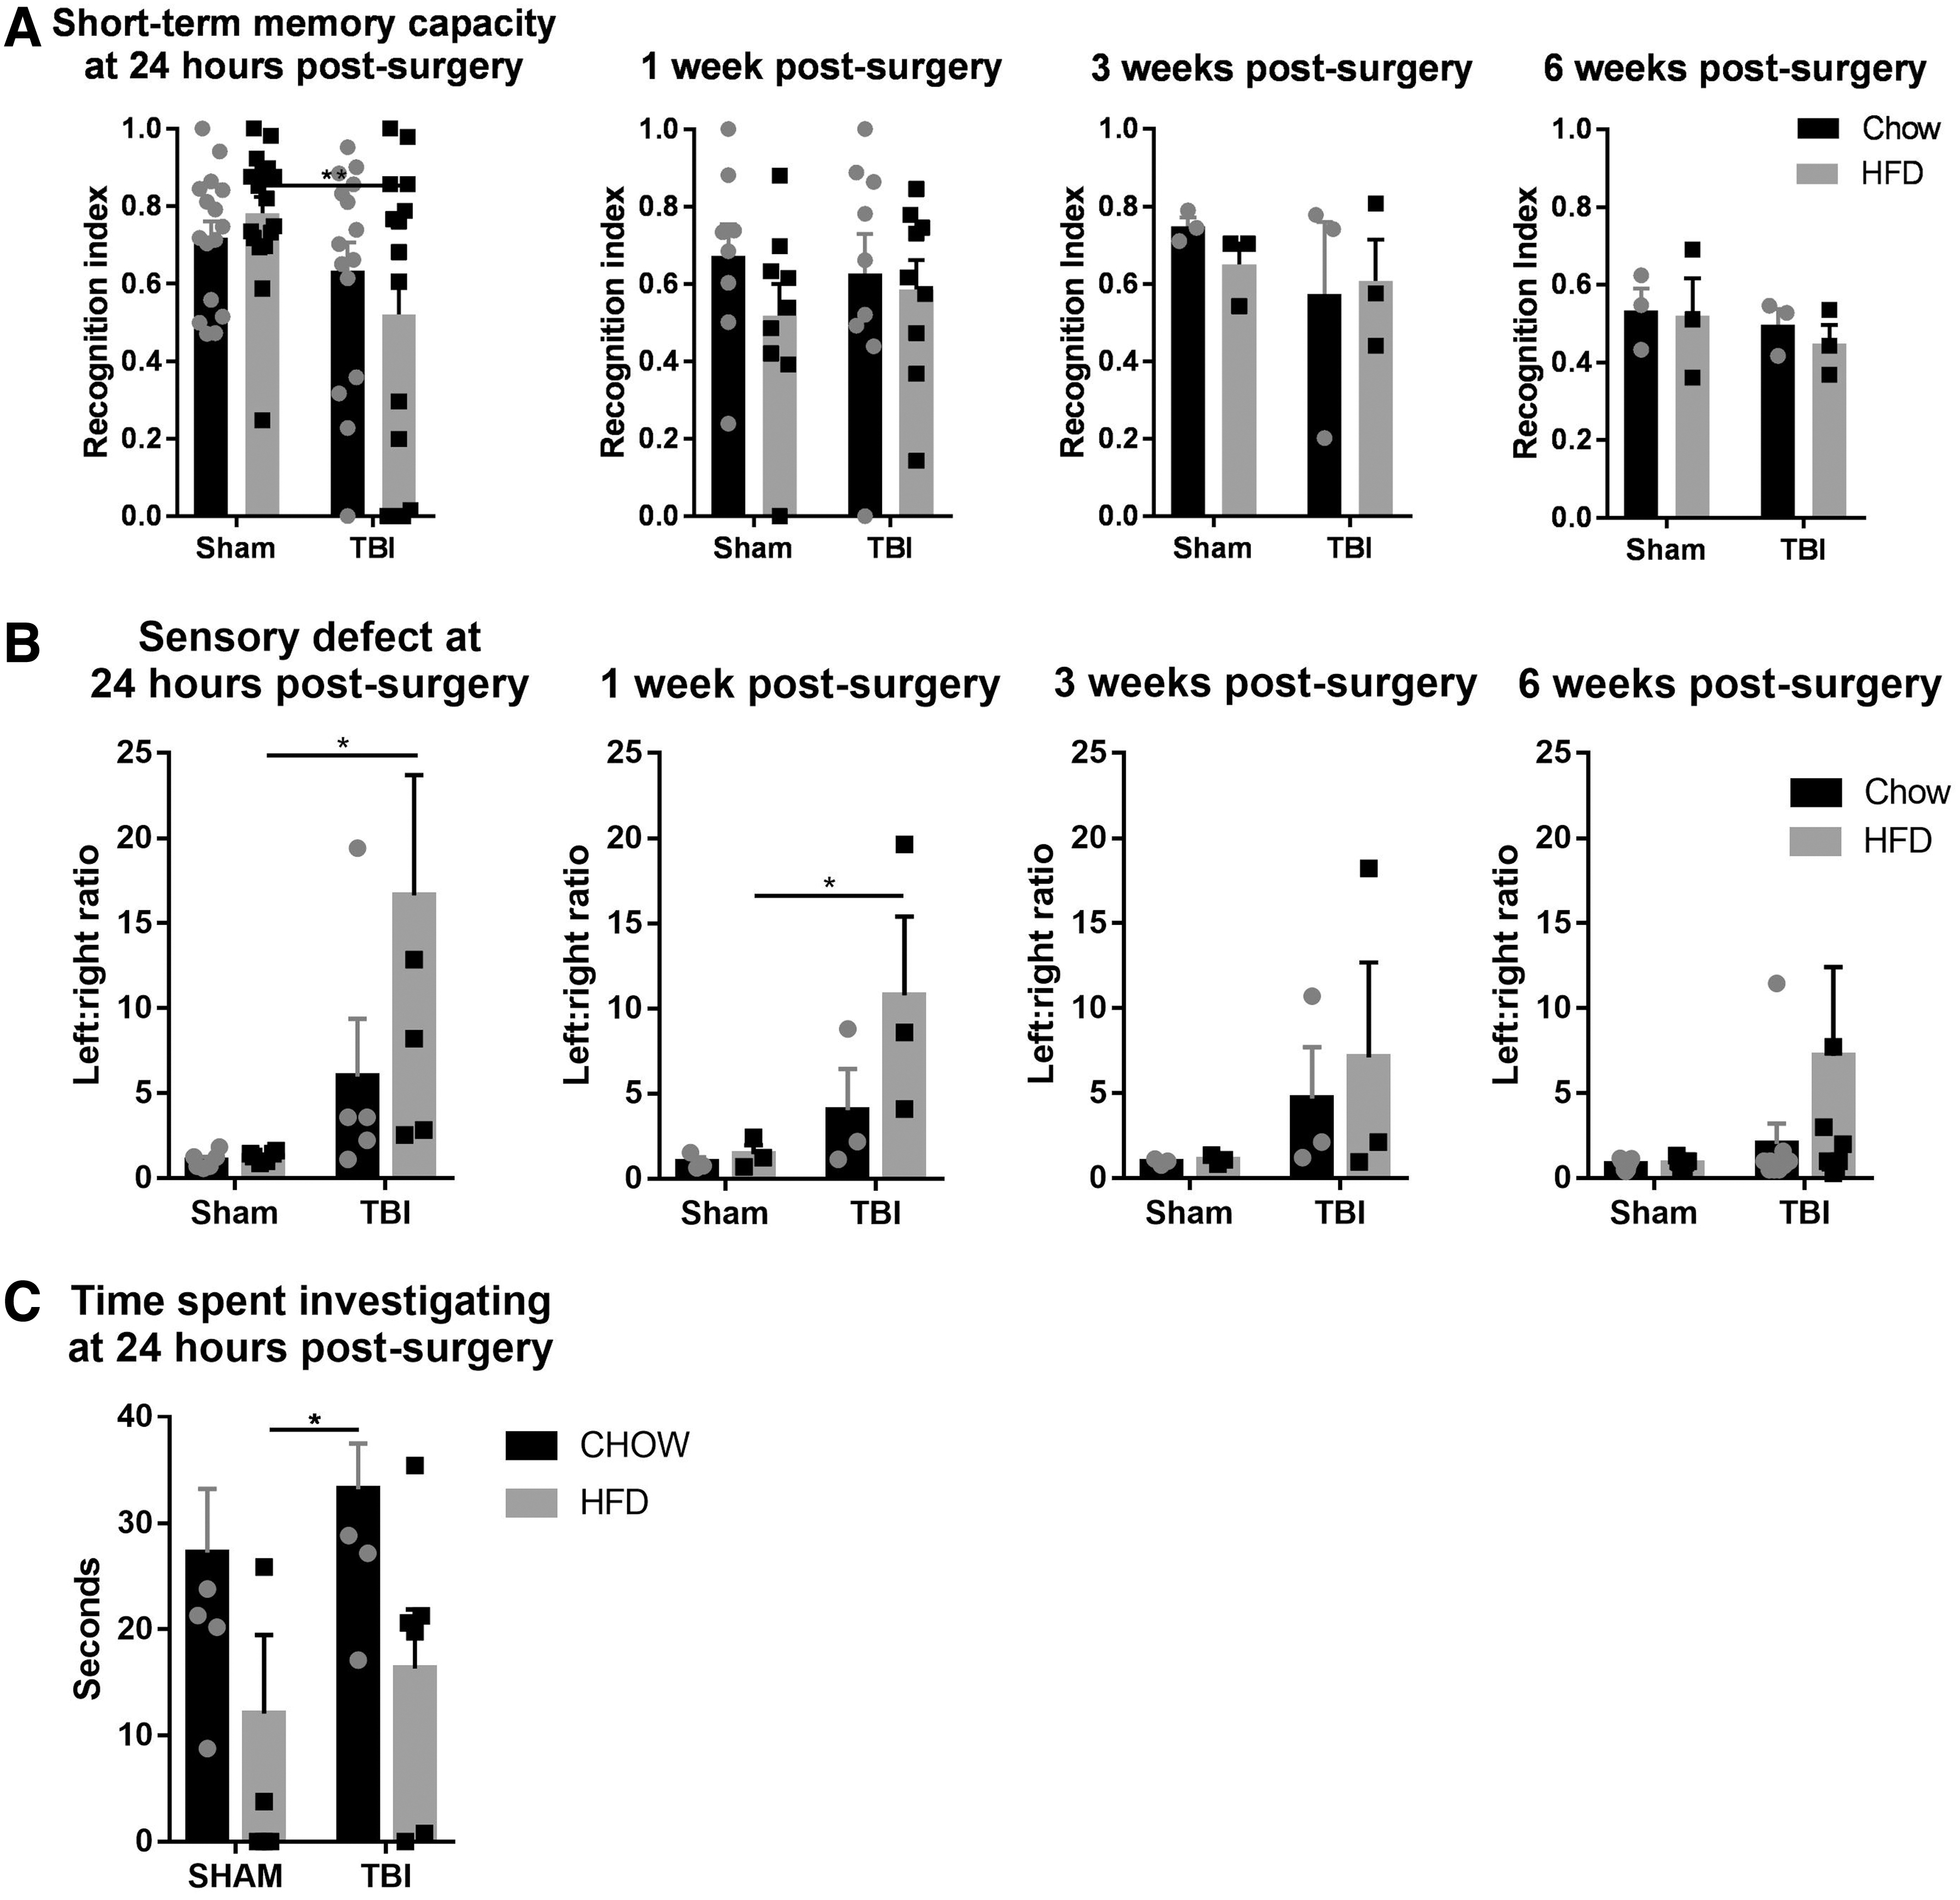
Short-term memory using the novel object recognition test
At 24 h and 1 week post-injury, there were significant overall sensory deficits caused by TBI (F [1,67] = 8.873, p < 0.01; F [1,32] = 4.5, p < 0.05). Rats with sham surgery showed no changes in sensory function throughout the 6 weeks. TBI-CD rats showed some sensory deficiency at 24 h, 1 week, and 3 weeks after surgery; however, without statistical significance. TBI-HFD rats showed significant sensory deficits at 24 h (p < 0.01) and 1 week (p < 0.05) compared with the SHAM-HFD group and partially recovered at 3 and 6 weeks post-surgery (Fig 1B).
At 24 h, there was no change in the total time rats spent investigating the novel object by either diet or injury interventions without interaction between these two interventions. However, post-hoc tests showed a significant increase in TBI-CD rats compared with SHAM-HFD rats (p < 0.01, Fig 1C).
Brain changes
Severity of lesion
No tissue damage was observed in the sham rats. Rats with TBI showed large amounts of hemorrhage, immune cell accumulation, and tissue necrosis at 24 h post-injury; at 6 weeks, a cavity was observed at the epicenter, consistent with what we showed previously in this model. 15,17,18 At 24 h post-injury, there was a significant increase in the average severity scores following injury (F [1,30] = 59.30, p < 0.0001) and for severity scores in individual subregions including the cortex (F [1,32] = 129.3, p < 0.0001), hippocampus (F [1,3] = 13.5, p < 0.001), and thalamus (F [1,32] = 231.36, p < 0.0001), but not for diet or interaction between diet and TBI (Fig. 2A,C,D). Post-hoc tests showed that these increases were significant for both TBI-HFD (p < 0.05) and TBI-CD (p < 0.05) compared with their respective SHAM groups in all brain regions. At 6 weeks, similar significance was seen for average injury (F [1,29] = 50.69, p < 0.0001), cortex (F [1,30] = 99.78, p < 0.0001), hippocampus (F [1,29] = 7.86, p < 0.0001) and thalamus (F [1,30] = 20.54, p < 0.0001), (Fig. 2B,D,F). Post-hoc tests showed similar significance to those at 24 h, although in the hippocampus, no significance was seen between TBI-HFD and the SHAM-HFD group, whereas TBI-CD still showed signicantly higher levels of lesion severity than SHAM-CD (p < 0.05)
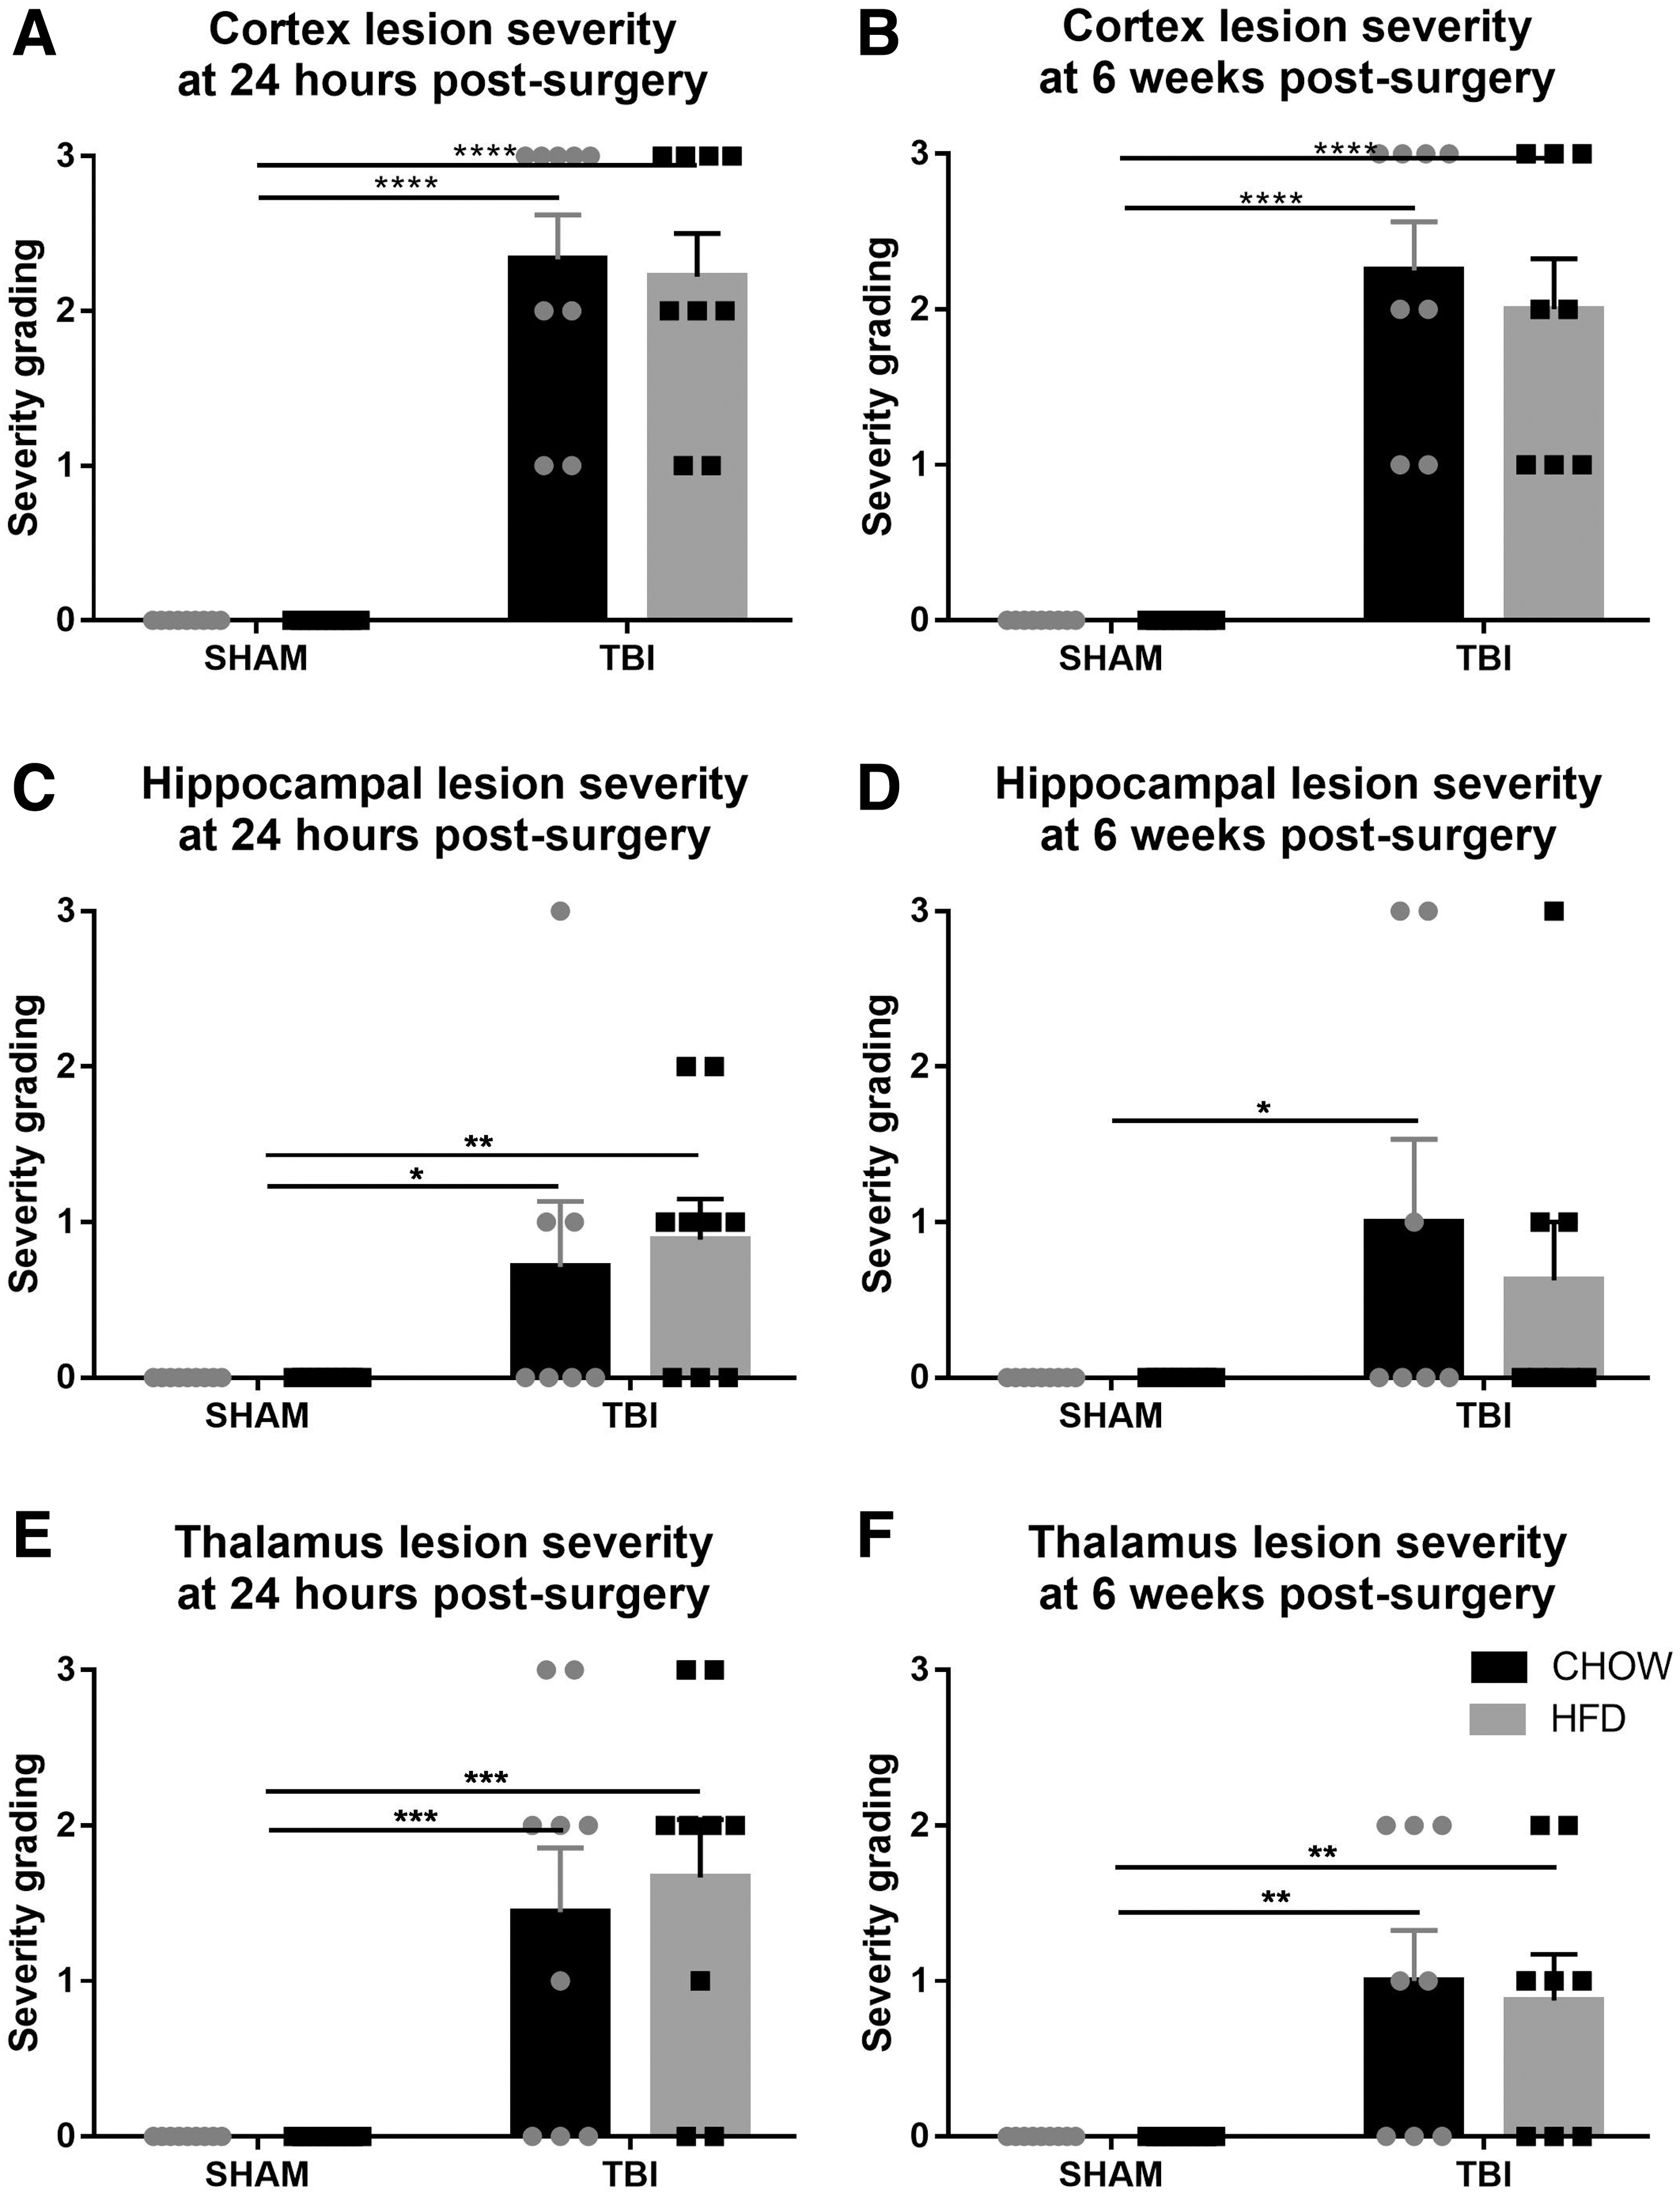
Semi-quantitative grading of lesion severity at 24 h (
There was no significant difference in neuronal (NeuN+) cell numbers following HFD consumption or between the CD- and HFD-fed rats with TBI in any of the subregions, including the cortex, hippocampus, and thalamus (Figs. 3 and 4).

Neuronal quantification in the right hemisphere (ipsilateral to injury). The number of neurons (NeuN positive cells per field) in the cortex, hippocampus, and thalamus, (
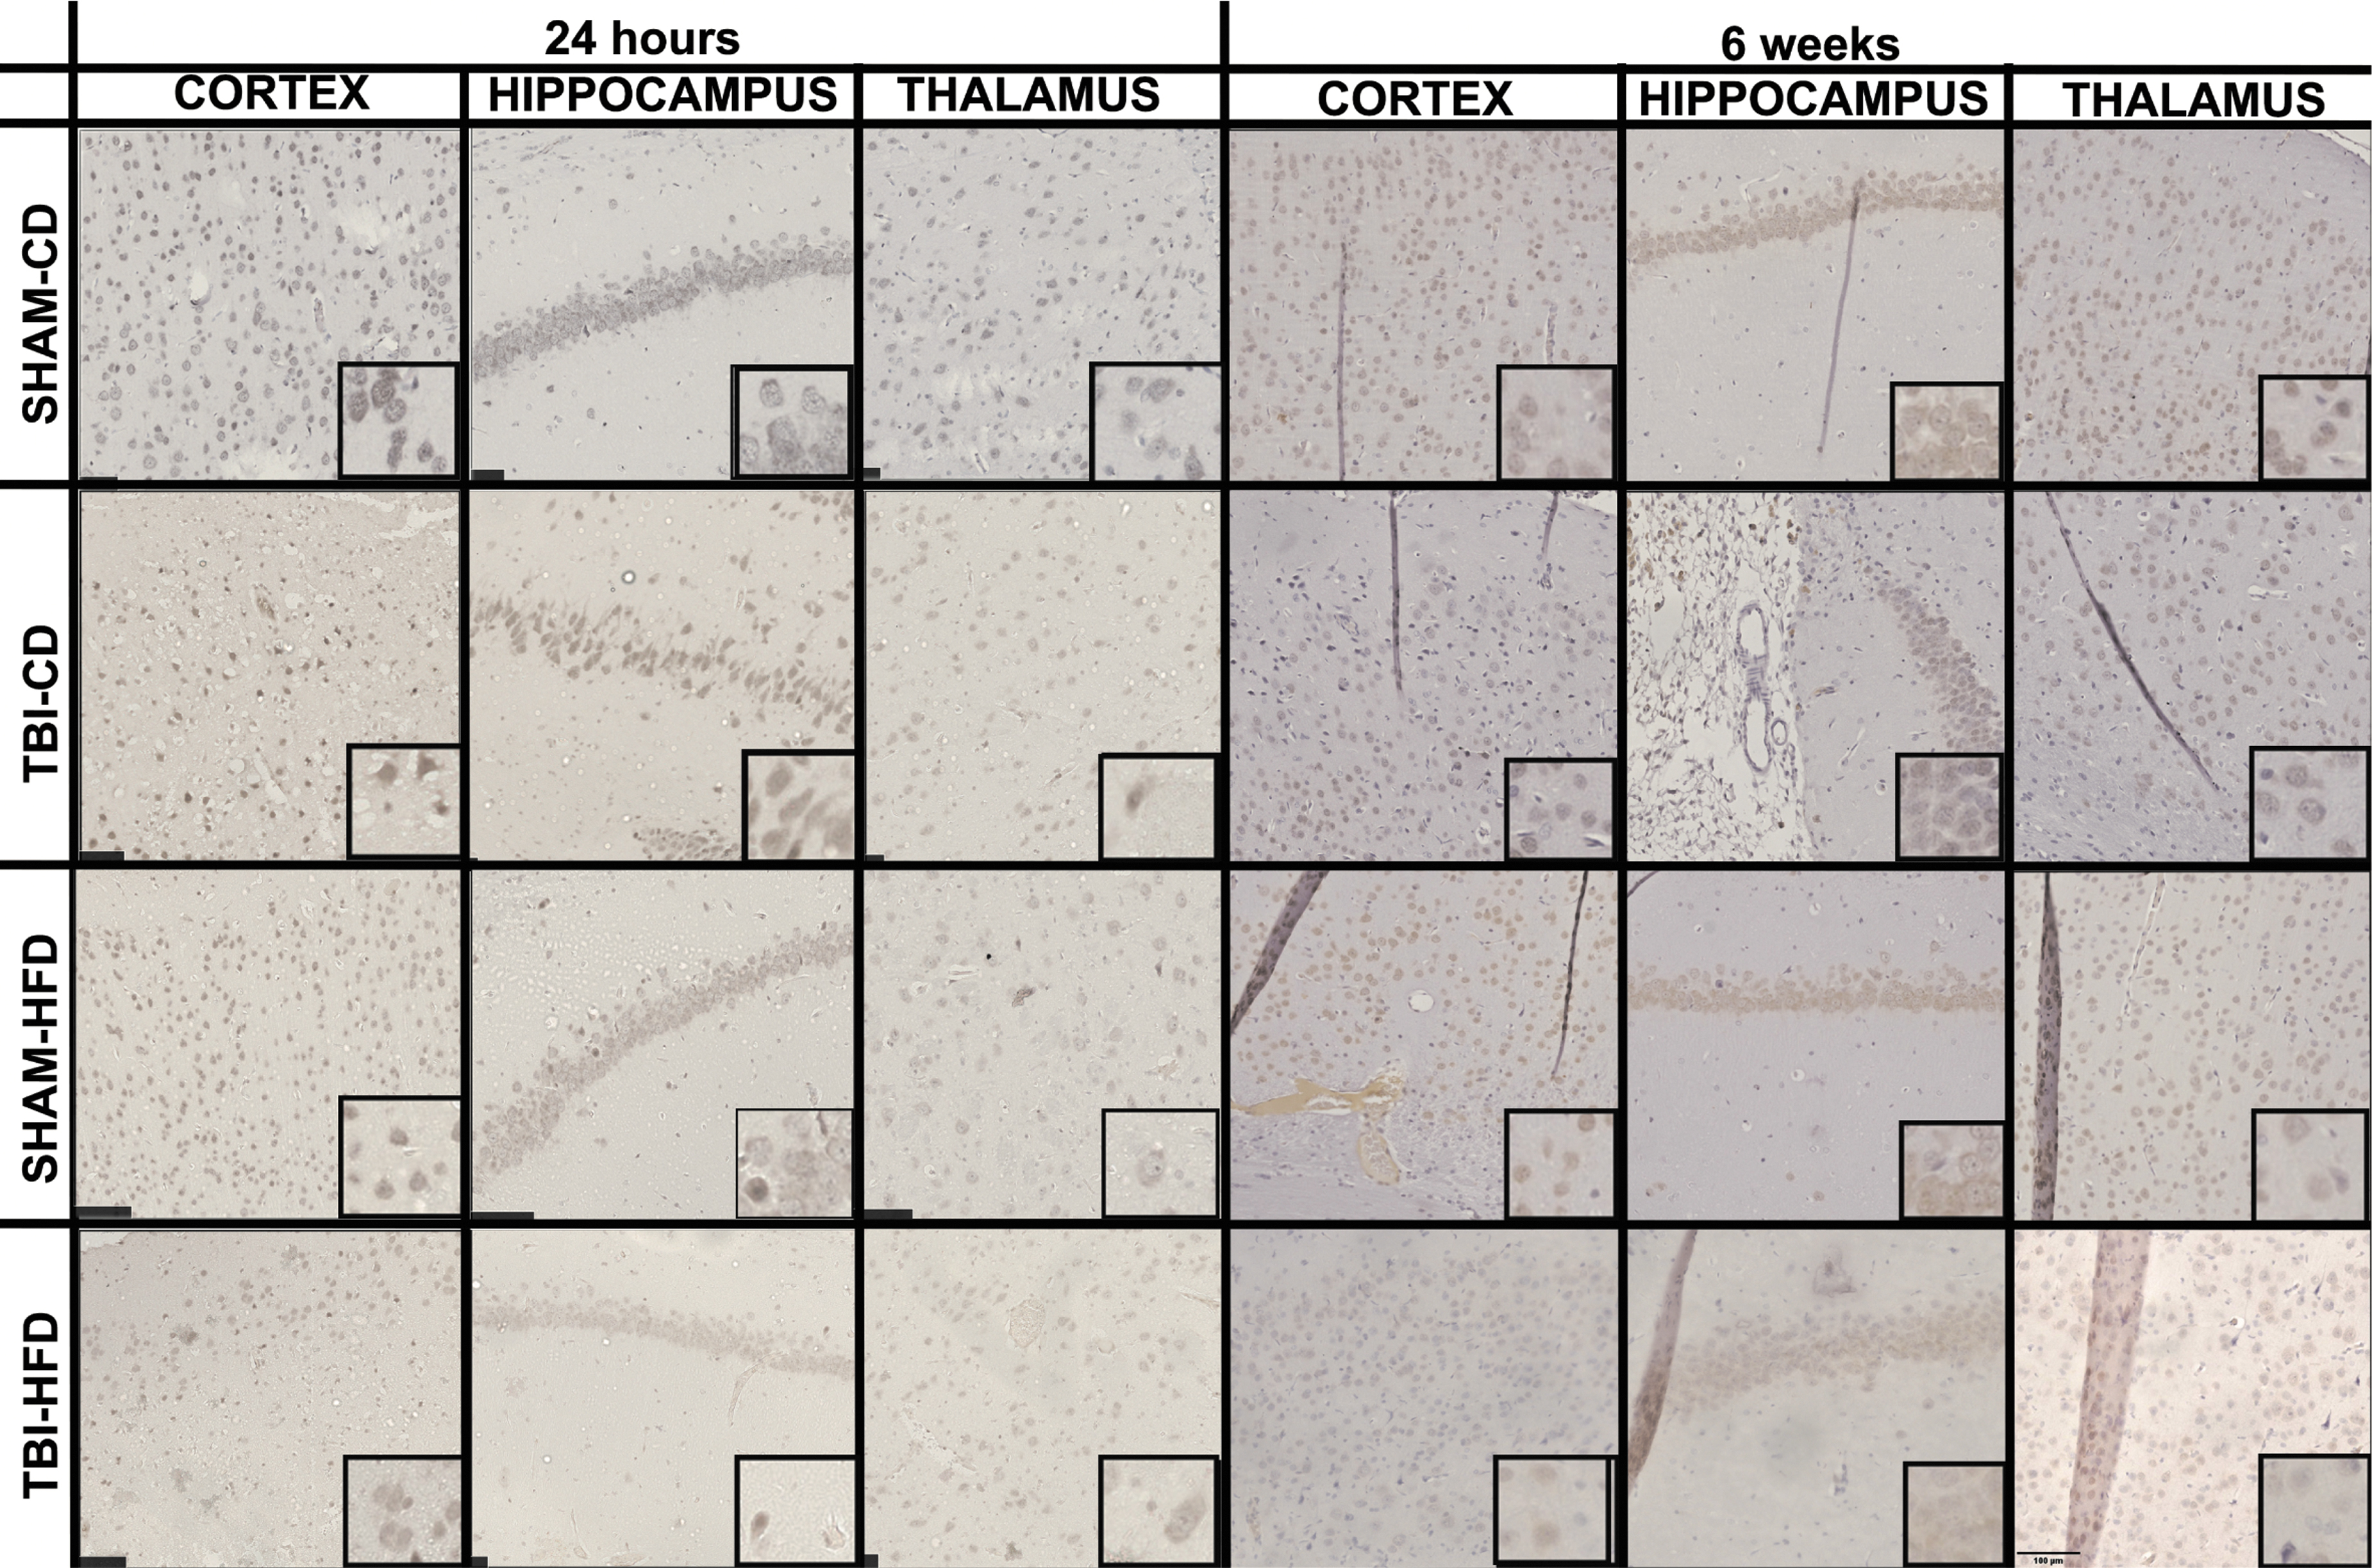
Images of neuronal nuclei (NeuN) staining around the injury site in each area of the brain are quantified. The right cortex, hippocampus, and thalamus are shown in each treatment group (SHAM-CD, SHAM-HFD, TBI-CD, TBI-HFD) at 24 h and at 6 weeks post-surgery. Insert boxes show high power image of individual positively stained cells.
Apoptosis marker
At 24 h post-injury, there was a significant increase in the number of caspase-3 positive cells seen in the right cortex of rats with TBI (F[1,16] = 12.01, p < 0.005), but not in the hippocampus or thalamus (Fig 5A,C,E). There was no difference as a result of diet or interaction between HFD and TBI. Post-hoc tests showed that these increases in the cortex were significant in both the TBI-HFD (p < 0.05) and TBI-CD (p < 0.05) groups compared with their respective SHAM groups. At 6 weeks, there was only an increase in the number of caspase-3 positive cells in the thalamus of TBI rats (F [1,15] = 7.625, p < 0.05), and no change was induced by HFD or interaction between diet and TBI. Post-hoc tests showed that caspase-3 cell numbers were significantly increased in TBI-HFD (p < 0.05) compared with the SHAM-HFD in the cortex (Fig. 5B), whereas in the hippocampus and thalamus, caspase-3 positive cell numbers were increased in TBI-CD (p < 0.05) compared with SHAM-CD (Fig. 5D,F). Representative images of caspase-3 staining are shown in Figure 6
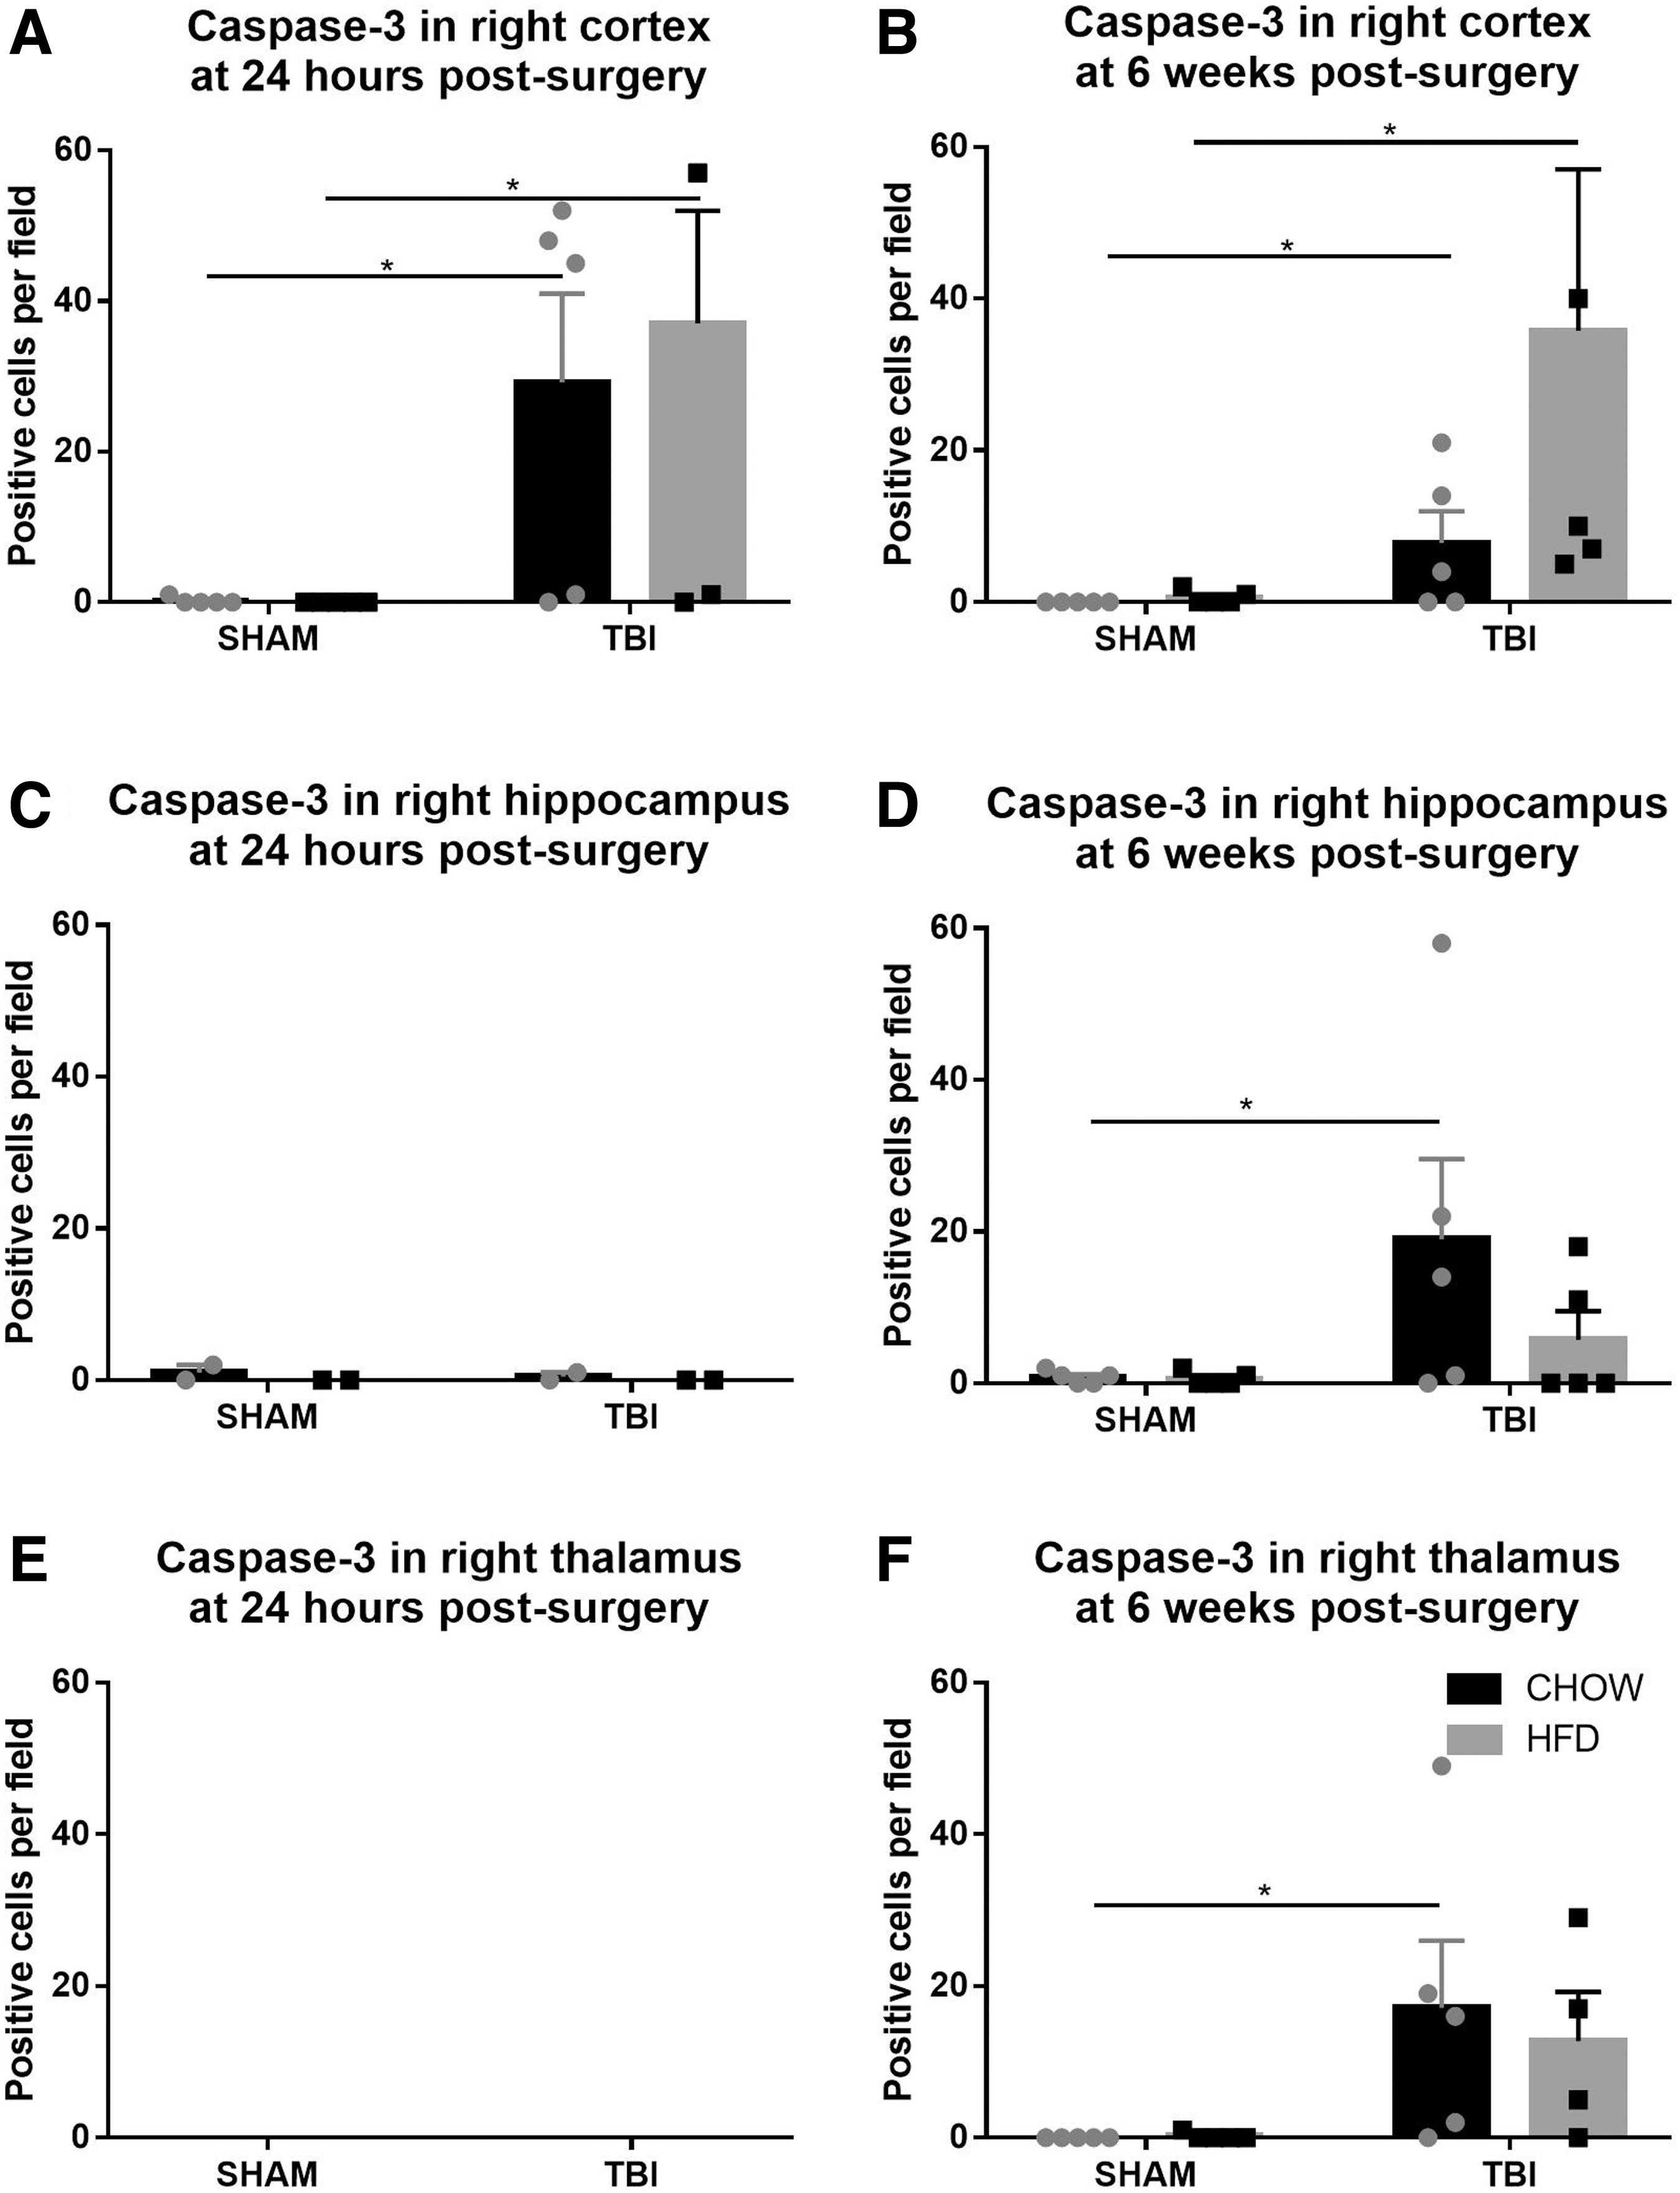
Numbers of caspase-3 positive cells in the right hemisphere (ipsilateral to injury). Number of caspase-3 positive cells per field in the cortex, hippocampus, and thalamus, respectively, at 24 h (

Images of caspase-3 staining in each area of the brain are quantified. The cortex, hippocampus, and thalamus are shown in each treatment group (SHAM-CD, SHAM-HFD, TBI-CD, TBI-HFD) at 24 h and at 6 weeks post-surgery. Insert boxes show high power image of individual positively stained cells.
Marker of inflammation and oxidative stress
ED1 staining was observed microscopically to be most prominent in the cortex, thalamus, and the lesion center (Fig. 7A–P), and appeared either in clusters (Fig. 7E,H) or separated (Fig. 7M–P). At 24 h, there was no ED1 staining apparent post-TBI (image not shown). At 6 weeks, there was increased ED1 staining in the cortex (F [1,20] = 9.46, p < 0.01) and lesion center (F [1,20] = 4.97, p < 0.05) caused by injury but not by diet, nor was there any interaction between the two (Fig. 7Q,T). Post-hoc tests showed increases in the cortex for the TBI-HFD group compared with the SHAM-HFD and SHAM-CD groups (p < 0.01), as well as with the TBI-CD group (p < 0.05). In the thalamus at 6 weeks, there were significant changes caused by injury (F [1,20] = 4.83, p < 0.05), diet (F [1,20] = 4.40, p < 0.05), and there was a significant interaction between HFD and TBI (F [1,20] = 4.40, p < 0.05). Post-hoc tests showed that ED1 staining was significantly increased in the thalamus in the TBI-HFD group compared with both the SHAM-HFD (p < 0.05) and the TBI-CD (p < 0.05) groups (Fig. 7S)

Ectodermal dysplasia 1 (ED1) expression in the right hemisphere (ipsilateral to injury) at 6 weeks post-surgery. Micrographs showing the staining in rats without an injury (
For the antioxidant MnSOD as a marker of oxidative stress, at 24 h, it was significantly decreased as a result of injury (F [1,20] = 9.46, p < 0.01), and there was a significant interaction between HFD and TBI to reduce MnSOD (F [1,20] = 14.88, p < 0.001), but no significant effect for HFD (Fig. 8A). Post-hoc tests showed that there was significantly less MnSOD in the TBI-HFD group (p < 0.0001 vs. SHAM-HFD, p < 0.01 vs. TBI-CD and SHAM-CD, n = 6, Fig. 8A). At 6 weeks, there was a greater decrease in MnSOD from TBI (F [1,20] = 20.33, p < 0.001). Post-hoc tests indicated a significant difference in MnSOD levels between CD- and HFD-fed rats (p < 0.01, n = 6, Fig 8B).
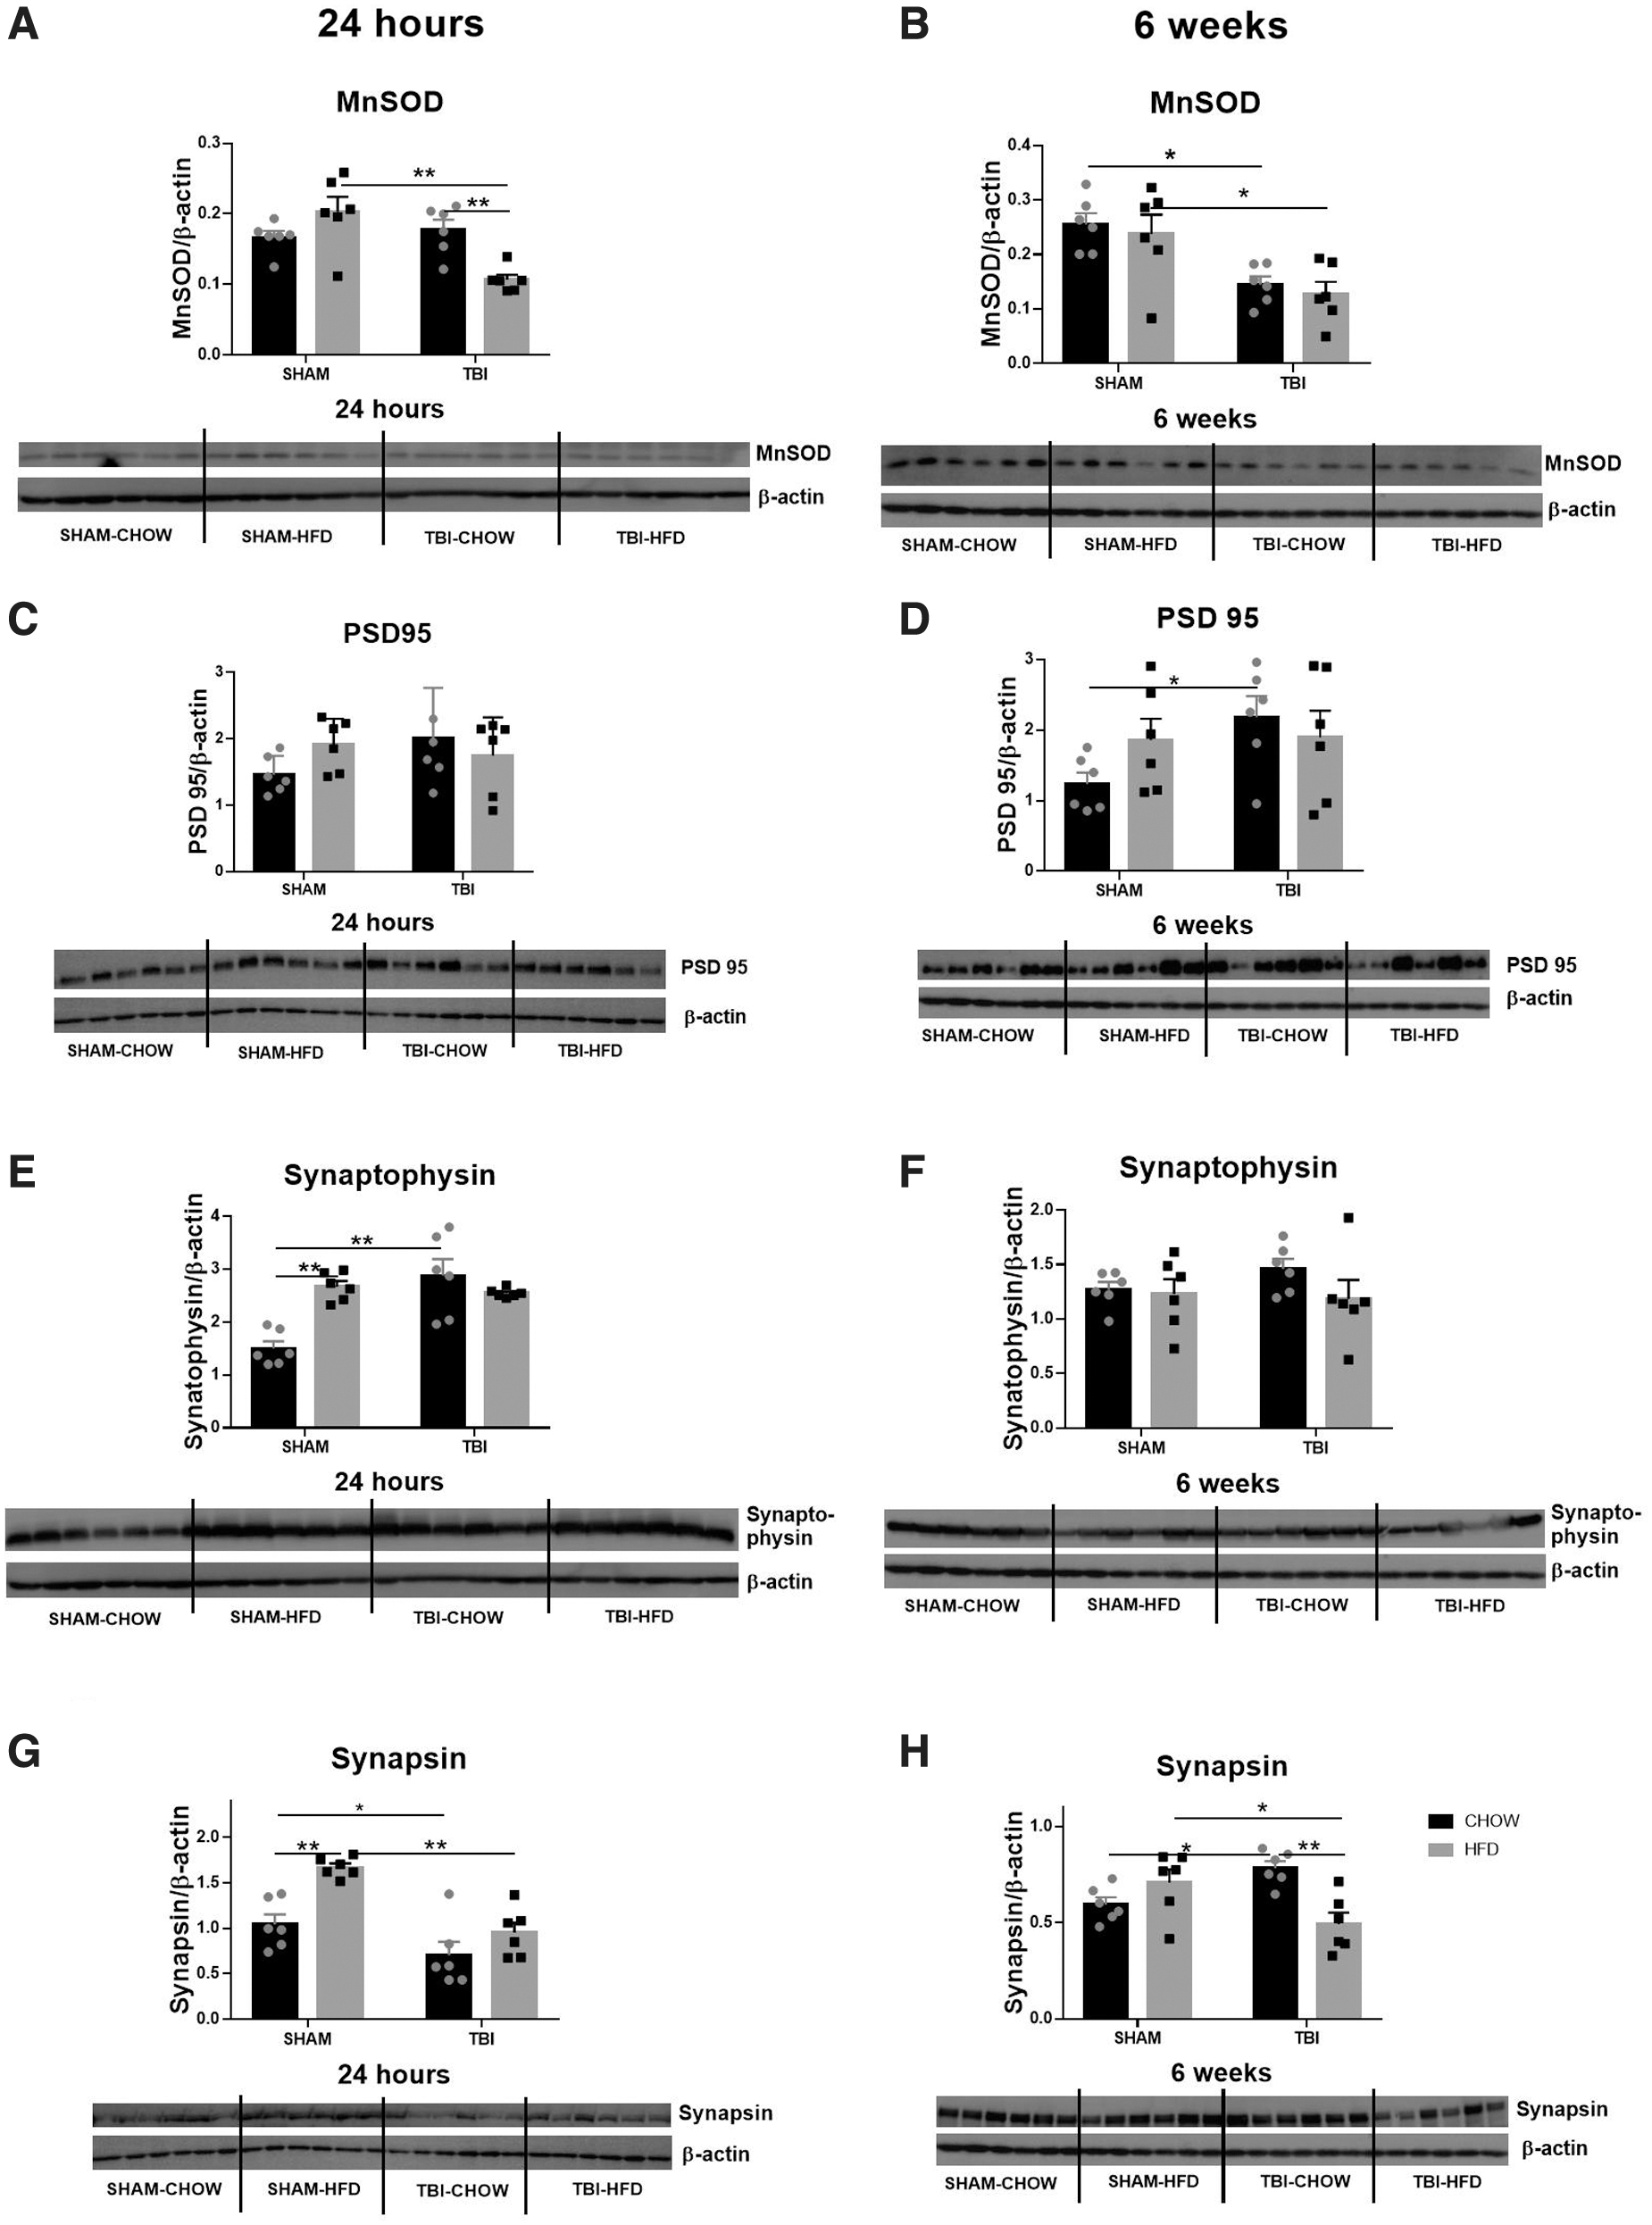
Protein levels of manganese superoxide dismutase (MnSOD)
Synaptic proteins
For PSD-95, there was no significant change at 24 h post-injury (Fig. 8C). However, post-hoc tests showed a significant increase resulting from TBI in the TBI-CD group compared with the SHAM-CD group (p < 0.05, n = 6, Fig. 8D)
Levels of the pre-synaptic protein synaptophysin were increased at 24 h as a result of injury (F [1,20] = 12.22, p < 0.01) and HFD (F [1,20] = 5.486, p < 0.05), and there was an interaction between HFD and TBI (F [1,20] = 17.46, p < 0.001). Post-hoc tests indicated significant differences between SHAM-CD and all other groups (p < 0.001 compared with the HFD-CD group; p < 0.0001 compared with the TBI-CD group, n = 6, Fig. 8E). At 6 weeks, there was no difference in synaptophysin levels among the groups (Fig. 8F).
At 24 h, synapsin was significantly increased by HFD (F [1,20] = 16.17, p < 0.001) and decreased by injury (F [1,20] = 23.75, p < 0.0001), but there was no interaction between HFD and TBI. Post-hoc tests showed that it was reduced by TBI in both CD- (p < 0.05 vs. SHAM-CD, n = 6) and HFD-fed rats (p < 0.01 vs. SHAM-CD group, n = 6, Fig. 8G). At 6 weeks, there was a significant interaction between HFD and TBI on synapsin levels (F [1,20] = 15.25, p < 0.001), but no significance was seen for either HFD or injury. Post-hoc tests showed that synapsin was significantly increased in the TBI-CD group (p < 0.5 vs. SHAM-CD, n = 6), whereas it was reduced in the TBI-HFD group (p < 0.05 vs. SHAM-HFD, p < 0.01 vs. TBI-CD, n = 6, Fig. 8H).
Discussion
Using a number of outcome measures to examine the extent of cognitive dysfunction and cellular injury after a TBI and the additional impact of an HFD, the findings of this study suggest an acute additive effect of HFD and moderate TBI on short-term memory and sensation. These effects corresponded with brain inflammatory cell accumulation (specific to the cortex and thalamus), oxidative stress, and modification of synapsis proteins. These findings are summarized in Table 1.
Summary of Changes in This Study Compared with Baseline (SHAM-CD) at Both 24 h and 6 Week Time Points
CD, chow diet; HFD, high-fat diet; TBI, traumatic brain injury; MnSOD, manganese superoxide dismutase; PSD, postsynaptic density protein.
The fact that there was little change in short-term memory and sensory function at 24 h after injury and in the long term (up to 6 weeks post-injury) in our TBI model does not preclude that these functions were affected. For example, we previously showed that this TBI model resulted in transient mild motor deficits on the affected side soon after injury (within 24 h) as measured by a horizontal ladder walking task, 15 but they were not overt and did not appear to interfere with generalized mobility in the NOR testing apparatus. Because of the limitation of our equipment, we could not cover the whole arena during NOR in the recording to examine the changes in the distance of travel, nor did we apply the open field test to measure the activities. 29 Nevertheless, considering the three parameters measured in this study (recognition index, time with object, and sensation), our results showed little to no effect of TBI, but did show that HFD plays a major role.
At the macro- and microscopic levels, the lesions that resulted were associated with significant apoptosis in the cortex, hippocampus, and thalamus by 6 weeks, consistent with our previous studies using the same model. 15 Although neuronal cell counts were unchanged among groups, this may be because of the delayed increase in apoptosis markers only at 6 weeks in TBI-HFD. It is possible that significant neuronal loss would be observed at even longer time points beyond 6 weeks, leading to early neurodegeneration in HFD-fed rats with TBI, but this requires further investigation.
Macrophage recruitment and microglial activation are integral parts of the inflammatory response after TBI and can persist for up to 17 years in human patients with TBI. 30 Our results seem consistent with this observation in humans, whereby the macrophage levels, reflected by ED1 staining, in the cortex and thalamus were much greater in HFD-fed rats with TBI than in TBI-CD-fed rats at 6 weeks post-injury. Inflammation and neuronal injury have been shown to be exaggerated by 12 weeks of HFD consumption in the transient ischemic model. 31 A greater level of oxidative stress appeared at 24 h in HFD-fed rats; whereas it was only marked in the TBI-CD rats at 6 weeks post-injury. This may explain why neurological dysfunction was more impaired in HFD-fed rats than in the CD-fed rats.
The lack of memory deficits in TBI-CD rats is also interesting, even though a lesion was observed (mainly hemorrhage) in the hippocampal region without any measurable cell loss. A previous study suggested that cell death/injury in the hippocampus is not necessary to produce significant short-term memory deficits in mild to moderate TBI models. 5 Therefore, we investigated the synaptic protein markers PSD-95, synaptophysin, and synapsin, changes in which may affect neuronal functions without a significant decline in neural cell numbers. It is of note that PSD-95 is a glutamatergic synaptic protein that facilitates the maturation of glutamatergic synapses and post-synaptic terminals, 32 which when it is overexpressed, leads to an increase in N-methyl-d-aspartate (NMDA)-induced neuronal death. 33 Injury or insult to the brain can increase PSD-95, 34 and this was evident only in our TBI-CD rats at 6 weeks, therefore suggesting delayed activation of this pathway in our model. This finding warrants further study at earlier time points and at the cellular level to help determine brain region specification, as well as its role in neuronal death.
A decrease in synaptophysin, a pre-synaptic vesicle protein, usually indicates a decrease in synaptic density, 35 and synaptophysin knockout in mice has been associated with impairment in object novelty recognition. 36 Generally, it is expected that there will be a loss of neurons and an associated loss of synapses following brain injury, 37,38 but synaptopathy in TBI is a complex and dynamic process, 39 and alterations to synapse density appear to differ with the post-injury time, anatomical location, and type of injury. In the current study, there was an increase in synaptophysin in all groups at 24 h compared with the SHAM-CD group, with a return to baseline by 6 weeks, which has also been reported for TBI, 40 cerebral infarction, 41 and HFD alone. 42 This suggests that there may be an immediate adaptive compensation in response to both HFD and TBI, with a rapid attempt at synaptogenesis to maintain functions of the uninjured neurons, but that it may be short lived and ineffective. Synapsin is a group of proteins associated with vesicle organization, 43 which has been shown to increase in the first 24 h after a TBI. 44,45 However, in our study, synapsin levels were decreased in rats with TBI at 24 h regardless of the diet, in a manner similar to that found by Wu and colleagues at 1 week post TBI. 46 Further, SHAM-HFD had higher levels of synapsin than SHAM-CD. This suggests that the response of synapsin is impaired by HFD consumption.
In summary, we identified increased oxidative stress as being the key to causing inflammation and changes in synaptic markers, associated with mild motor and sensory dysfunctions, consistent with our previous studies. 15,17,18 Therefore, oxidative stress represents a plausible target for intervention, such as the use of the antioxidants reported in our previous studies 17,18 to determine whether such a strategy is effective in preventing neurological dysfunction caused by the combination of HFD consumption and TBI. This will be followed up in future studies.
Conclusion
Obesity caused by HFD consumption and moderate TBI showed an additive effect to worsen short-term memory and sensory function deficit, driven by increased inflammation, oxidative stress, and dysregulated synaptic proteins, as summarized in Table 1.
Footnotes
Acknowledgments
We thank Li Nah Khor for her contribution to the animal work.
Authors' Contributions
C.Y., B.G.O., C.A.G., and H.C. designed the study. C.Y., B.G.O., and H.C. obtained the funding. S.T., C.A.G., and H.C. performed the animal experiments. S.T., Y.L.C., B.W., R.M., and C.A.G. analyzed the tissues. S.T. and H.C. wrote the first draft. All authors contributed to and approved the manuscript.
Funding Information
This project was funded by an Incentive Grant to Hui Chen by the Faculty of Science, University of Technology Sydney, and a project grant awarded to Hui Chen and Brian G Oliver by the National Health & Medical Research Council of Australia (APP1158186). Yik Lung Chan is supported by the Peter Doherty Fellowship, National Health & Medical Research Council of Australia. Chenju Yi is supported by grants from the National Natural Science Foundation of China (NSFC 81971309 and 32170980), Guangdong Basic and Applied Basic Research Foundation (2022B1515020012 and 2019A1515011333), and Shenzhen Fundamental Research Program (JCYJ20190809161405495, JCYJ20210324123212035 and RCYX20200714114644167).
Author Disclosure Statement
No competing financial interests exist.